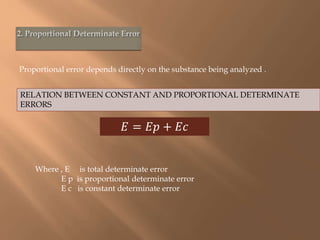
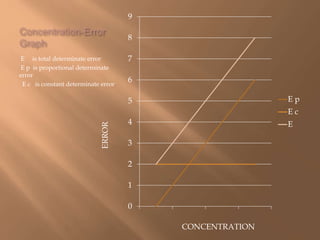
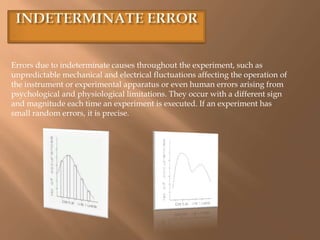
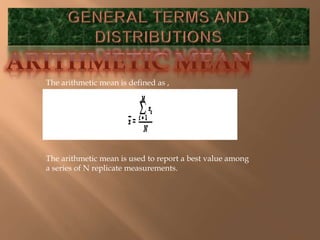
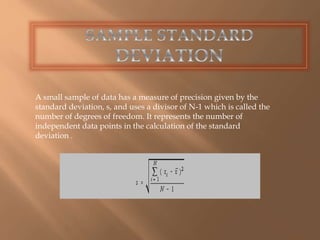
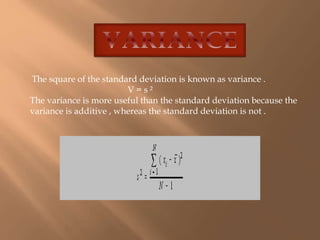
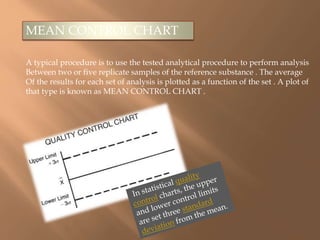
This document discusses various types of errors that can occur in chemical analysis and sampling. It describes determinate errors, which can be identified and corrected, and include constant and proportional determinate errors. It also discusses indeterminate errors, which occur randomly. The document provides definitions and formulas for key statistical concepts used to evaluate precision and accuracy in chemical analysis, including mean, median, standard deviation, variance, control charts, and confidence limits.
Analytical Chemistry & Role in pharmaceutical industry
Different techniques of analysis
Significant Figures
Errors - Types & Minimization
Calibration of glasswares - pipette, burette & Volumetric flask
Analytical Chemistry & Role in pharmaceutical industry
Different techniques of analysis
Significant Figures
Errors - Types & Minimization
Calibration of glasswares - pipette, burette & Volumetric flask
Selection and calibration of analytical method & calibration methodsTapeshwar Yadav
The accuracy of a measurement system is the degree of closeness of measurements of a quantity to the true value.
The precision of a measurement system, also called reproducibility or repeatability, is the degree to which repeated measurements under unchanged conditions show the same results.
The sensitivity of a clinical test refers to the ability of the test to correctly identify those patients with the disease.
A test with 100% sensitivity correctly identifies all patients with the disease.
A test with 80% sensitivity detects 80% of patients with the disease (true positives) but 20% with the disease go undetected (false negatives).
The specificity of a clinical test refers to the ability of the test to correctly identify those patients without the disease.
Therefore, a test with 100% specificity correctly identifies all patients without the disease.
A test with 80% specificity correctly reports 80% of patients without the disease as test negative (true negatives) but 20% patients without the disease are incorrectly identified as test positive (false positives).
Potentiometry is an electrochemical method of Analysis deals with the measurement of electric potential or emf of an electrolyte solution under the condition of constant current.
Potentiometry is the measurement of electrical potential of an electrolyte solution to determine its concentration.
The principle is based on the fact that the potential of the given sample is directly proportional to the concentration of its electro active ions or its activity (pH)
When the pair of electrodes is placed in the sample solution it shows the potential difference by the addition of the titrant or by the change in the concentration of the ions.
The theory of potentiometry is based on the nernst equation.It gives the basic relationship between the potential generated by an electrochemical cell and the concentration of the ions.
The potential E ( Half cell potential) of any electrode is given by nernst equation
Many factors impacting the measurement precision of ICP-OES and ICP-MS are still often neglected for everyday operation, however. Sample preparation is one of the factors that play a crucial role in the success of high-quality sample analysis. In this webinar, our experts will discuss sample preparation to: 1) improve analysis precision 2) make difficult samples easy to be analyzed 3) eliminate sample dilution to minimize error introduction.
For more information, please visit here: http://chrom.ms/CtRtKpw
Definition of chrono potentiometry
Introduction about chrono potentiomerty
Experimental setup of chronopotentiometry
Theory of chronopotentiometry
Output wave function of chrono potentiometry
Analysis of an chronopotentiometry
Main window of chronopotentiometry
used files in chronopotentiometry
disadvantages of chronopotentiometry
Application of chrono potentiometry
compare of chronopotentiometry
Using hardware
Feature of files in chronopotentiometry
Types of errors
Among the most frequent sources of errors Brown counts
(1) interlingual transfer,
(2) intralingual transfer,
(3) context of learning,
and (4) various communication strategies the learners use
5 Steps for Successful Interviewing and SelectionRobin Schooling
The sustained success of any organization depends upon hiring the right people, in the right job, at the right time. Planning for human resources needs, specifically defining the necessary competencies and capabilities needed, is one of the greatest challenges facing managers. The journey to successful interviewing and selection begins with an understanding of these 5 basic steps.
Ethnobotany and Ethnopharmacology:
Ethnobotany in herbal drug evaluation,
Impact of Ethnobotany in traditional medicine,
New development in herbals,
Bio-prospecting tools for drug discovery,
Role of Ethnopharmacology in drug evaluation,
Reverse Pharmacology.
The Art Pastor's Guide to Sabbath | Steve ThomasonSteve Thomason
What is the purpose of the Sabbath Law in the Torah. It is interesting to compare how the context of the law shifts from Exodus to Deuteronomy. Who gets to rest, and why?
Welcome to TechSoup New Member Orientation and Q&A (May 2024).pdfTechSoup
In this webinar you will learn how your organization can access TechSoup's wide variety of product discount and donation programs. From hardware to software, we'll give you a tour of the tools available to help your nonprofit with productivity, collaboration, financial management, donor tracking, security, and more.
Read| The latest issue of The Challenger is here! We are thrilled to announce that our school paper has qualified for the NATIONAL SCHOOLS PRESS CONFERENCE (NSPC) 2024. Thank you for your unwavering support and trust. Dive into the stories that made us stand out!
How to Create Map Views in the Odoo 17 ERPCeline George
The map views are useful for providing a geographical representation of data. They allow users to visualize and analyze the data in a more intuitive manner.
Operation “Blue Star” is the only event in the history of Independent India where the state went into war with its own people. Even after about 40 years it is not clear if it was culmination of states anger over people of the region, a political game of power or start of dictatorial chapter in the democratic setup.
The people of Punjab felt alienated from main stream due to denial of their just demands during a long democratic struggle since independence. As it happen all over the word, it led to militant struggle with great loss of lives of military, police and civilian personnel. Killing of Indira Gandhi and massacre of innocent Sikhs in Delhi and other India cities was also associated with this movement.
Palestine last event orientationfvgnh .pptxRaedMohamed3
An EFL lesson about the current events in Palestine. It is intended to be for intermediate students who wish to increase their listening skills through a short lesson in power point.
The Indian economy is classified into different sectors to simplify the analysis and understanding of economic activities. For Class 10, it's essential to grasp the sectors of the Indian economy, understand their characteristics, and recognize their importance. This guide will provide detailed notes on the Sectors of the Indian Economy Class 10, using specific long-tail keywords to enhance comprehension.
For more information, visit-www.vavaclasses.com
The French Revolution, which began in 1789, was a period of radical social and political upheaval in France. It marked the decline of absolute monarchies, the rise of secular and democratic republics, and the eventual rise of Napoleon Bonaparte. This revolutionary period is crucial in understanding the transition from feudalism to modernity in Europe.
For more information, visit-www.vavaclasses.com
How to Split Bills in the Odoo 17 POS ModuleCeline George
Bills have a main role in point of sale procedure. It will help to track sales, handling payments and giving receipts to customers. Bill splitting also has an important role in POS. For example, If some friends come together for dinner and if they want to divide the bill then it is possible by POS bill splitting. This slide will show how to split bills in odoo 17 POS.
2. The Total Chemical Analysis consist of several
steps . Each of the steps must be carried with
enough care to allow the results of the analysis
to be accurate .
3. ERRORS IN CHEMICAL ANALYSIS
There is a certain amount of error in each step of chemical analysis .
Errors can be classified into the two categories of determinate and indeterminate
Error .
DETERMINATE ERROR
Errors due to the design and execution of the experiment. They can be
identified through a careful analysis of the experiment and associated
experiments, and measures can be taken to correct them. Systematic
errors occur with the same magnitude and sign every time the
experiment is performed, and affect the accuracy of the results, but not
the precision. If an experiment has small systematic errors, it is accurate.
4. There are two types of determinate error .
1. Constant Determinate Error
2. Proportional Determinate Error
1. Constant Determinate Error
A constant determinate error gives the same amount of the sample
regardless of the concentration of the substance being analyzed .
5. Proportional error depends directly on the substance being analyzed .
RELATION BETWEEN CONSTANT AND PROPORTIONAL DETERMINATE
ERRORS
퐸 = 퐸푝 + 퐸푐
Where , E is total determinate error
E p is proportional determinate error
E c is constant determinate error
6. Concentration-Error
Graph
E is total determinate error
E p is proportional determinate
error
E c is constant determinate error
9
8
7
6
5
4
3
2
1
0
E p
E c
E
CONCENTRATION
ERROR
7. Errors due to indeterminate causes throughout the experiment, such as
unpredictable mechanical and electrical fluctuations affecting the operation of
the instrument or experimental apparatus or even human errors arising from
psychological and physiological limitations. They occur with a different sign
and magnitude each time an experiment is executed. If an experiment has
small random errors, it is precise.
8. The arithmetic mean is defined as ,
The arithmetic mean is used to report a best value among
a series of N replicate measurements.
9. The median is the value which divides a set of replicate
measurements when the set is arranged in order from the smallest
to the largest .
If the total number of analytical results is an even number , then
the median is the average of the two middle values .
Precision is defined as a measure of the amount of agreement between
Replicate analytical results obtained with the same sample .
10. The standard deviation is the one measure of the precision of an analysis .
The greater the precision of an analysis ,the smaller the value of the
standard deviation .
STANDARD DEVIATION = d = Xi – X mean
Average deviation is the sum of the individual deviations divided by
number of trials . Average deviation is described by the formula ;
Average Deviation =Σd
—
N
11. The absolute error is the difference between any particular reading xi
and the true value xt:
absolute error = xi - xt
Note that the formula is set up so that a low value produces a
negative error and a high value produces a positive one. Sometimes
one speaks of the absolute error of a mean:
12. It is often more useful to speak in terms of the relative error
which relates the absolute error to the value of
measurement:
The percent relative error would then be given by
13. The range is the difference between the highest and the
lowest analytical results for a sample . The magnitude of the
range increases as the number of analysis increases .
14. The standard deviation is an accepted measure of the precision of a
population of data .
It gives an indication of the amount of random error in an analysis .
It is a theoretical quantity whose value is given by
It is strictly applicable only when N is very large i.e. N approaches to infinity
15. A small sample of data has a measure of precision given by the
standard deviation, s, and uses a divisor of N-1 which is called the
number of degrees of freedom. It represents the number of
independent data points in the calculation of the standard
deviation .
16. The square of the standard deviation is known as variance .
V = s ²
The variance is more useful than the standard deviation because the
variance is additive , whereas the standard deviation is not .
17. CONTROL CHART ANALYSIS
Control Chart Analysis is one of the better methods of checking for statistical
Control . By that method , the analytical procedure is regularly used in an
analysis of a reference substance .
18. MEAN CONTROL CHART
A typical procedure is to use the tested analytical procedure to perform analysis
Between two or five replicate samples of the reference substance . The average
Of the results for each set of analysis is plotted as a function of the set . A plot of
that type is known as MEAN CONTROL CHART .
19. CONFIDENCE LIMITS
The true mean is the mean result of an infinite number of analysis . The upper
and lower boundaries through which the true mean occurs are called
CONFIDENCE LIMITS .
For a single analysis , the true mean is within 0.675 ∂ of the mean a at the
50 percent confidence level .