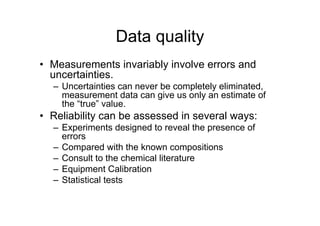
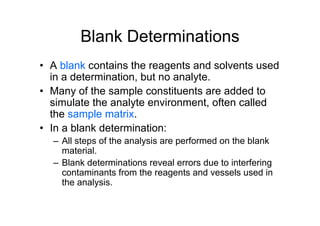
Errors in Chemical Analysis
Lecture 1
Data quality
• Measurements invariably involve errors and
uncertainties.
– Uncertainties can never be completely eliminated,
measurement data can give us only an estimate of
the “true” value.
• Reliability can be assessed in several ways:
– Experiments designed to reveal the presence of
errors
– Compared with the known compositions
– Consult to the chemical literature
– Equipment Calibration
– Statistical tests
Representative Data
• Chemists usually carry two to five portions
(replicates) of a sample through an entire
analytical procedure.
– Replicates are samples of about the same size that
are carried through an analysis in exactly the same
way.
• One usually considers the “best” estimate to be
the central value for the set:
– Usually, the mean or the median is used as the
central value for a set of replicate measurements.
– The variation in data allows us to estimate the
uncertainty associated with the central result
The Mean and Median
• The most widely used measure of central value
is the mean, . The mean, also called the
arithmetic mean, or the average,
– where xi represents the individual values of x making
up the set of N replicate measurements.
• The median is the middle result when replicate
data are arranged according to increasing or
decreasing value.
EXAMPLE 5-1
• Calculate the mean and median for the
data shown in Figure 5-1.
• Because the set contains an even
number of measurements, the median
is the average of the central pair:
Precision
• Describes the reproducibility of measurements
• Or, the closeness of results that have been
obtained in exactly the same way.
• Three terms are widely used to describe the
precision of a set of replicate data:
– standard deviation;
– variance;
– coefficient of variation.
• Deviation from the mean:
Accuracy
• Indicates the closeness of the measurement to
the true or accepted value
• Expressed in terms of either absolute or relative
error.
• Absolute error:
– where xt is the true or accepted value of the quantity
– We retain the sign in stating the absolute error.
• Relative error:
The difference between accuracy and precision
Types of Errors in Experimental Data
• The precision of a measurement is readily
determined by comparing data from
carefully replicated experiments.
• To determine the accuracy, we have to
know the true value, which is usually what
we are seeking in the analysis.
• Analyst 1: relatively high precision & high accuracy
• Analyst 2: poor precision but good accuracy
• Analyst 3: excellent precision & significant error in the
numerical average for the data
• Analyst 4: poor precision & poor accuracy
Types of Errors
• Random (or indeterminate) error:
– Affect measurement precision
– Causes data to be scattered more or less
symmetrically around a mean value.
• Analysts 1 and 3 is significantly less than that for analysts 2
and 4.
• Systematic (or determinate) error:
– Affect the accuracy of results
– Causes the mean of a data set to differ from the
accepted value.
• Analysts 1 and 2 have little systematic error;
• Analysts 3 and 4 show systematic errors of about -0.7% and
-1.2%.
• Gross error:
– Often the product of human errors.
– usually occur only occasionally, are often large, and
may cause a result to be either high or low.
– lead to outliers, results that appear to differ markedly
from all other data in a set of replicate measurements.
Systematic Errors
• Lead to bias in measurement results
– Bias affects all of the data in a set in the same way
and that bears a sign
• Three types:
– Instrumental errors are caused by nonideal
instrument behavior, by faulty calibrations, or by use
under inappropriate conditions.
– Method errors arise from nonideal chemical or
physical behavior of analytical systems.
– Personal errors result from the carelessness,
inattention, or personal limitations of the experimenter.
Instrument Errors
• All measuring devices are potential
sources of systematic errors.
• Calibration eliminates most instrumental
systematic errors.
• Electronic instruments are subject to
instrumental systematic errors.
– Ex: low battery voltage, noises
– In many cases, errors of these types are
detectable and correctable.
Method Errors
• The nonideal chemical or physical behavior of
the reagents and reactions on which an analysis
is based
• Ex: the slowness of some reactions, the
incompleteness of others, the instability of some
species
• Errors inherent in a method are often difficult to
detect and are thus the most serious of the three
types of systematic error.
Personal Errors
• Many measurements require personal
judgments. Judgments of this type are often
subject to systematic, undirectional errors.
• Analytical procedures should always be adjusted
so that any known physical limitations of the
analyst cause negligibly small errors.
• A universal source of personal error is prejudice,
or bias. Number bias is another source of
personal error that varies considerably from
person to person.
Effect of Systematic Errors on
Analytical Results
• Systematic errors may be either constant or
proportional.
• Constant errors
– Independent of the size of the sample being analyzed.
– The absolute error is constant with sample size, but
the relative error varies when sample size is changed.
– The excess of reagent required to bring about a color
change during a titration is an example.
– The effect of a constant error becomes more serious
as the size of the quantity measured decreases.
• Proportional errors
– Decrease or increase in proportion to the size
of the sample.
– The absolute error varies with sample size,
but the relative error stays constant with
changing sample size.
– A common cause of proportional errors is the
presence of interfering contaminants in the
sample.
Systematic Instrument and
Personal Errors Detection
• Instrument errors
– Some systematic instrument errors can be found and
corrected by calibration.
– Periodic calibration of equipment is always desirable
because the response of most instruments change
with time as a result of wear, corrosion, or
mistreatment.
• Personal errors
– Most personal errors can be minimized by care and
self-discipline.
– It is a good habit to check instrument readings,
notebook entries, and calculations systematically.
Systematic Method Errors Detection
• Take one or more of the following
steps to recognise and adjust for a
systematic error:
–Analysis of Standard Samples
–Independent Analysis
–Blank Determinations
–Variation in Sample Size
Analysis of Standard Samples
• The best way of estimating the bias of an
analytical method is by the analysis of
standard reference materials.
– Standard Reference Materials (SRMS):
• Materials that contain one or more analytes at
known concentration levels.
• Can sometimes be prepared by synthesis.
• Can be purchased from a number of governmental
and industrial sources. Ex: National Institute of
Standards and Technology (NIST); Sigma
Chemical Co.
Independent Analysis & Variation in
Sample Size
• Independent Analysis
– A second independent and reliable analytical method
can be used in parallel with the method being
evaluated.
– A statistical test must be used to determine whether
any difference is a result of random errors in the two
methods or due to bias in the method under study.
• Variation in Sample Size
– As the size of a measurement increases, the effect of
a constant error decreases. Constant errors can often
be detected by varying the sample size.
Blank Determinations
• A blank contains the reagents and solvents used
in a determination, but no analyte.
• Many of the sample constituents are added to
simulate the analyte environment, often called
the sample matrix.
• In a blank determination:
– All steps of the analysis are performed on the blank
material.
– Blank determinations reveal errors due to interfering
contaminants from the reagents and vessels used in
the analysis.

141279899-Chapter-1-Errors-in-Chemical-Analysis.pdf

  • 1.
    Errors in ChemicalAnalysis Lecture 1
  • 2.
    Data quality • Measurementsinvariably involve errors and uncertainties. – Uncertainties can never be completely eliminated, measurement data can give us only an estimate of the “true” value. • Reliability can be assessed in several ways: – Experiments designed to reveal the presence of errors – Compared with the known compositions – Consult to the chemical literature – Equipment Calibration – Statistical tests
  • 3.
    Representative Data • Chemistsusually carry two to five portions (replicates) of a sample through an entire analytical procedure. – Replicates are samples of about the same size that are carried through an analysis in exactly the same way. • One usually considers the “best” estimate to be the central value for the set: – Usually, the mean or the median is used as the central value for a set of replicate measurements. – The variation in data allows us to estimate the uncertainty associated with the central result
  • 4.
    The Mean andMedian • The most widely used measure of central value is the mean, . The mean, also called the arithmetic mean, or the average, – where xi represents the individual values of x making up the set of N replicate measurements. • The median is the middle result when replicate data are arranged according to increasing or decreasing value.
  • 5.
    EXAMPLE 5-1 • Calculatethe mean and median for the data shown in Figure 5-1. • Because the set contains an even number of measurements, the median is the average of the central pair:
  • 6.
    Precision • Describes thereproducibility of measurements • Or, the closeness of results that have been obtained in exactly the same way. • Three terms are widely used to describe the precision of a set of replicate data: – standard deviation; – variance; – coefficient of variation. • Deviation from the mean:
  • 7.
    Accuracy • Indicates thecloseness of the measurement to the true or accepted value • Expressed in terms of either absolute or relative error. • Absolute error: – where xt is the true or accepted value of the quantity – We retain the sign in stating the absolute error. • Relative error:
  • 8.
    The difference betweenaccuracy and precision
  • 9.
    Types of Errorsin Experimental Data • The precision of a measurement is readily determined by comparing data from carefully replicated experiments. • To determine the accuracy, we have to know the true value, which is usually what we are seeking in the analysis.
  • 10.
    • Analyst 1:relatively high precision & high accuracy • Analyst 2: poor precision but good accuracy • Analyst 3: excellent precision & significant error in the numerical average for the data • Analyst 4: poor precision & poor accuracy
  • 11.
    Types of Errors •Random (or indeterminate) error: – Affect measurement precision – Causes data to be scattered more or less symmetrically around a mean value. • Analysts 1 and 3 is significantly less than that for analysts 2 and 4. • Systematic (or determinate) error: – Affect the accuracy of results – Causes the mean of a data set to differ from the accepted value. • Analysts 1 and 2 have little systematic error; • Analysts 3 and 4 show systematic errors of about -0.7% and -1.2%.
  • 12.
    • Gross error: –Often the product of human errors. – usually occur only occasionally, are often large, and may cause a result to be either high or low. – lead to outliers, results that appear to differ markedly from all other data in a set of replicate measurements.
  • 13.
    Systematic Errors • Leadto bias in measurement results – Bias affects all of the data in a set in the same way and that bears a sign • Three types: – Instrumental errors are caused by nonideal instrument behavior, by faulty calibrations, or by use under inappropriate conditions. – Method errors arise from nonideal chemical or physical behavior of analytical systems. – Personal errors result from the carelessness, inattention, or personal limitations of the experimenter.
  • 14.
    Instrument Errors • Allmeasuring devices are potential sources of systematic errors. • Calibration eliminates most instrumental systematic errors. • Electronic instruments are subject to instrumental systematic errors. – Ex: low battery voltage, noises – In many cases, errors of these types are detectable and correctable.
  • 15.
    Method Errors • Thenonideal chemical or physical behavior of the reagents and reactions on which an analysis is based • Ex: the slowness of some reactions, the incompleteness of others, the instability of some species • Errors inherent in a method are often difficult to detect and are thus the most serious of the three types of systematic error.
  • 16.
    Personal Errors • Manymeasurements require personal judgments. Judgments of this type are often subject to systematic, undirectional errors. • Analytical procedures should always be adjusted so that any known physical limitations of the analyst cause negligibly small errors. • A universal source of personal error is prejudice, or bias. Number bias is another source of personal error that varies considerably from person to person.
  • 17.
    Effect of SystematicErrors on Analytical Results • Systematic errors may be either constant or proportional. • Constant errors – Independent of the size of the sample being analyzed. – The absolute error is constant with sample size, but the relative error varies when sample size is changed. – The excess of reagent required to bring about a color change during a titration is an example. – The effect of a constant error becomes more serious as the size of the quantity measured decreases.
  • 18.
    • Proportional errors –Decrease or increase in proportion to the size of the sample. – The absolute error varies with sample size, but the relative error stays constant with changing sample size. – A common cause of proportional errors is the presence of interfering contaminants in the sample.
  • 19.
    Systematic Instrument and PersonalErrors Detection • Instrument errors – Some systematic instrument errors can be found and corrected by calibration. – Periodic calibration of equipment is always desirable because the response of most instruments change with time as a result of wear, corrosion, or mistreatment. • Personal errors – Most personal errors can be minimized by care and self-discipline. – It is a good habit to check instrument readings, notebook entries, and calculations systematically.
  • 20.
    Systematic Method ErrorsDetection • Take one or more of the following steps to recognise and adjust for a systematic error: –Analysis of Standard Samples –Independent Analysis –Blank Determinations –Variation in Sample Size
  • 21.
    Analysis of StandardSamples • The best way of estimating the bias of an analytical method is by the analysis of standard reference materials. – Standard Reference Materials (SRMS): • Materials that contain one or more analytes at known concentration levels. • Can sometimes be prepared by synthesis. • Can be purchased from a number of governmental and industrial sources. Ex: National Institute of Standards and Technology (NIST); Sigma Chemical Co.
  • 22.
    Independent Analysis &Variation in Sample Size • Independent Analysis – A second independent and reliable analytical method can be used in parallel with the method being evaluated. – A statistical test must be used to determine whether any difference is a result of random errors in the two methods or due to bias in the method under study. • Variation in Sample Size – As the size of a measurement increases, the effect of a constant error decreases. Constant errors can often be detected by varying the sample size.
  • 23.
    Blank Determinations • Ablank contains the reagents and solvents used in a determination, but no analyte. • Many of the sample constituents are added to simulate the analyte environment, often called the sample matrix. • In a blank determination: – All steps of the analysis are performed on the blank material. – Blank determinations reveal errors due to interfering contaminants from the reagents and vessels used in the analysis.