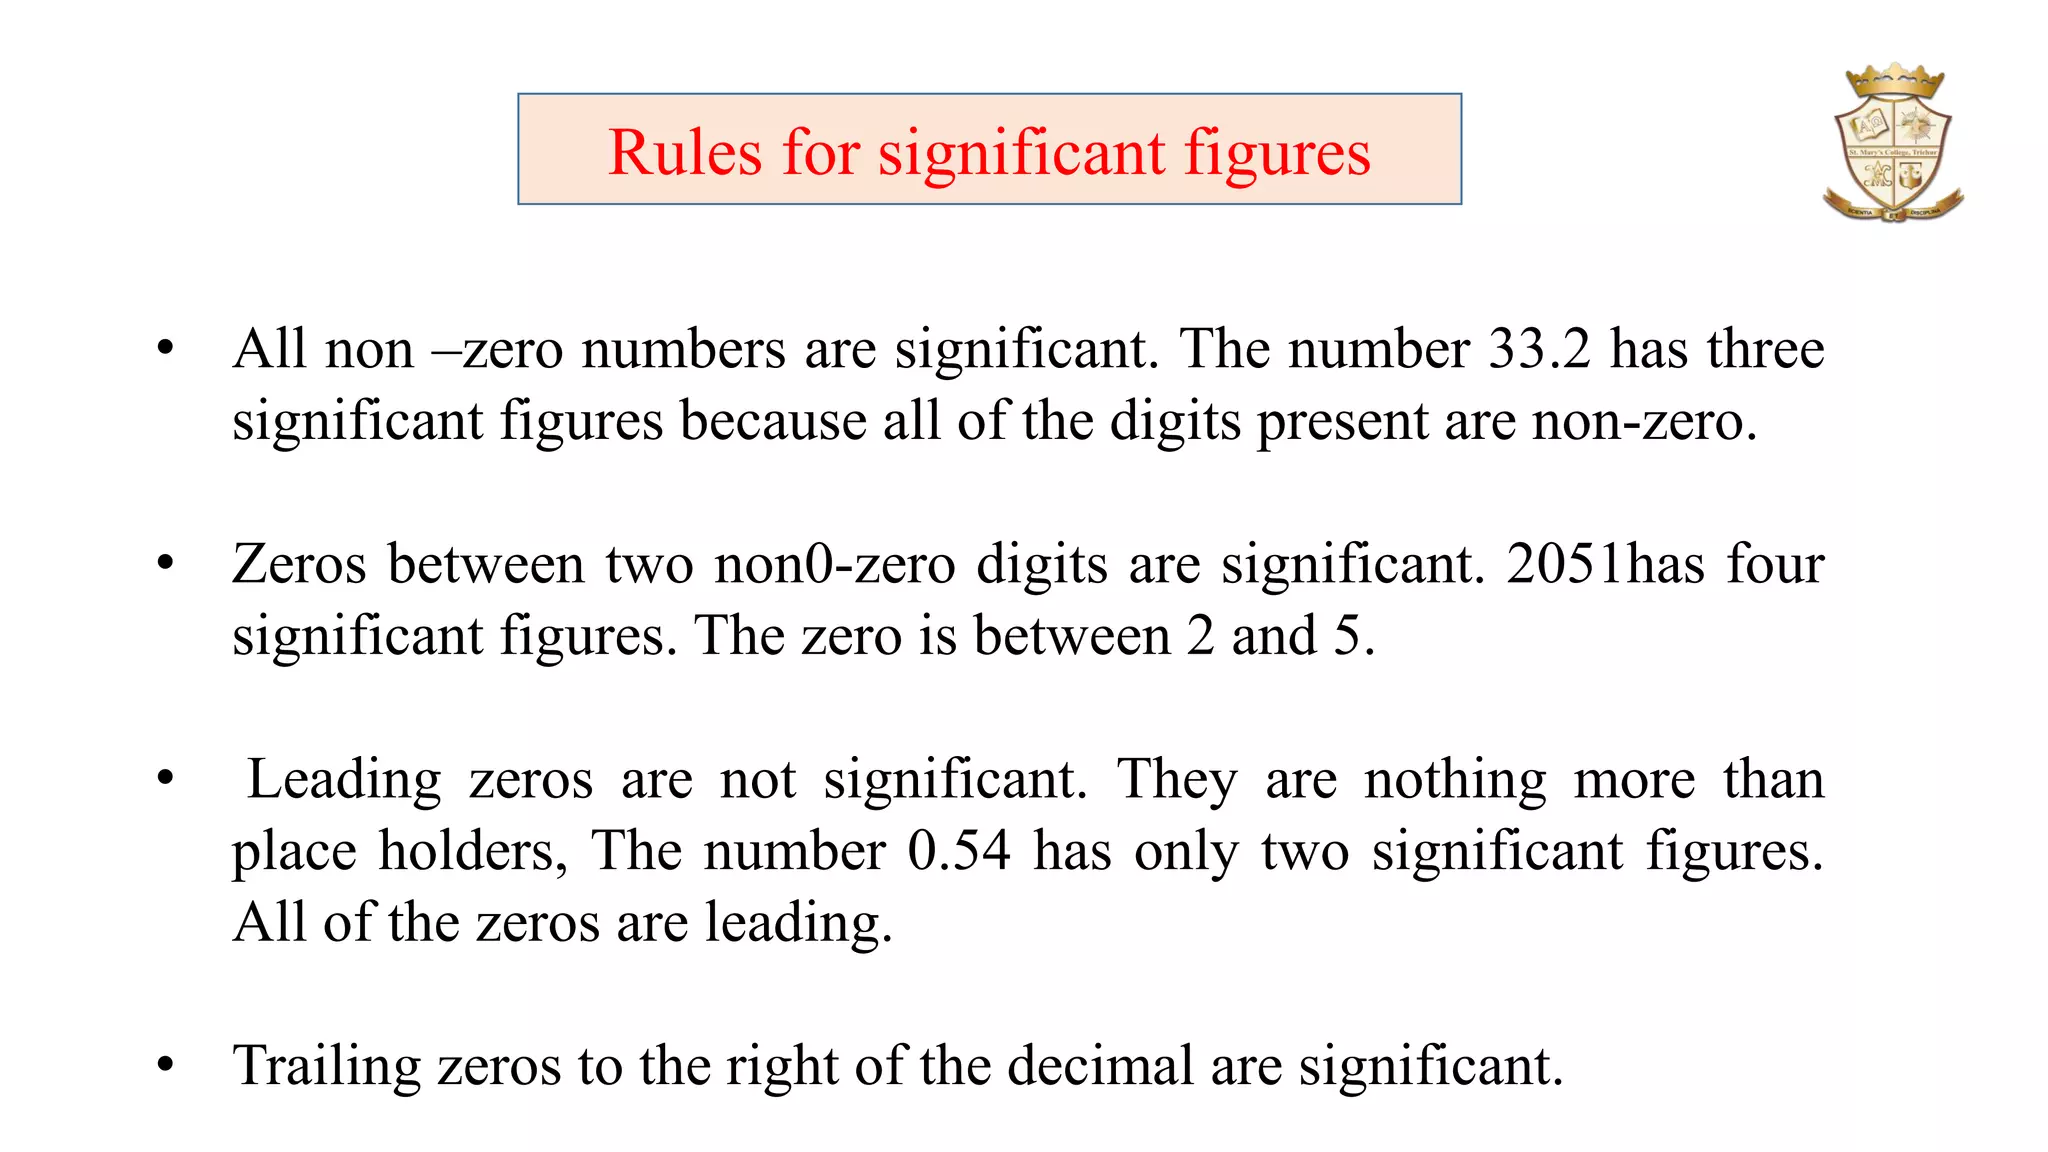
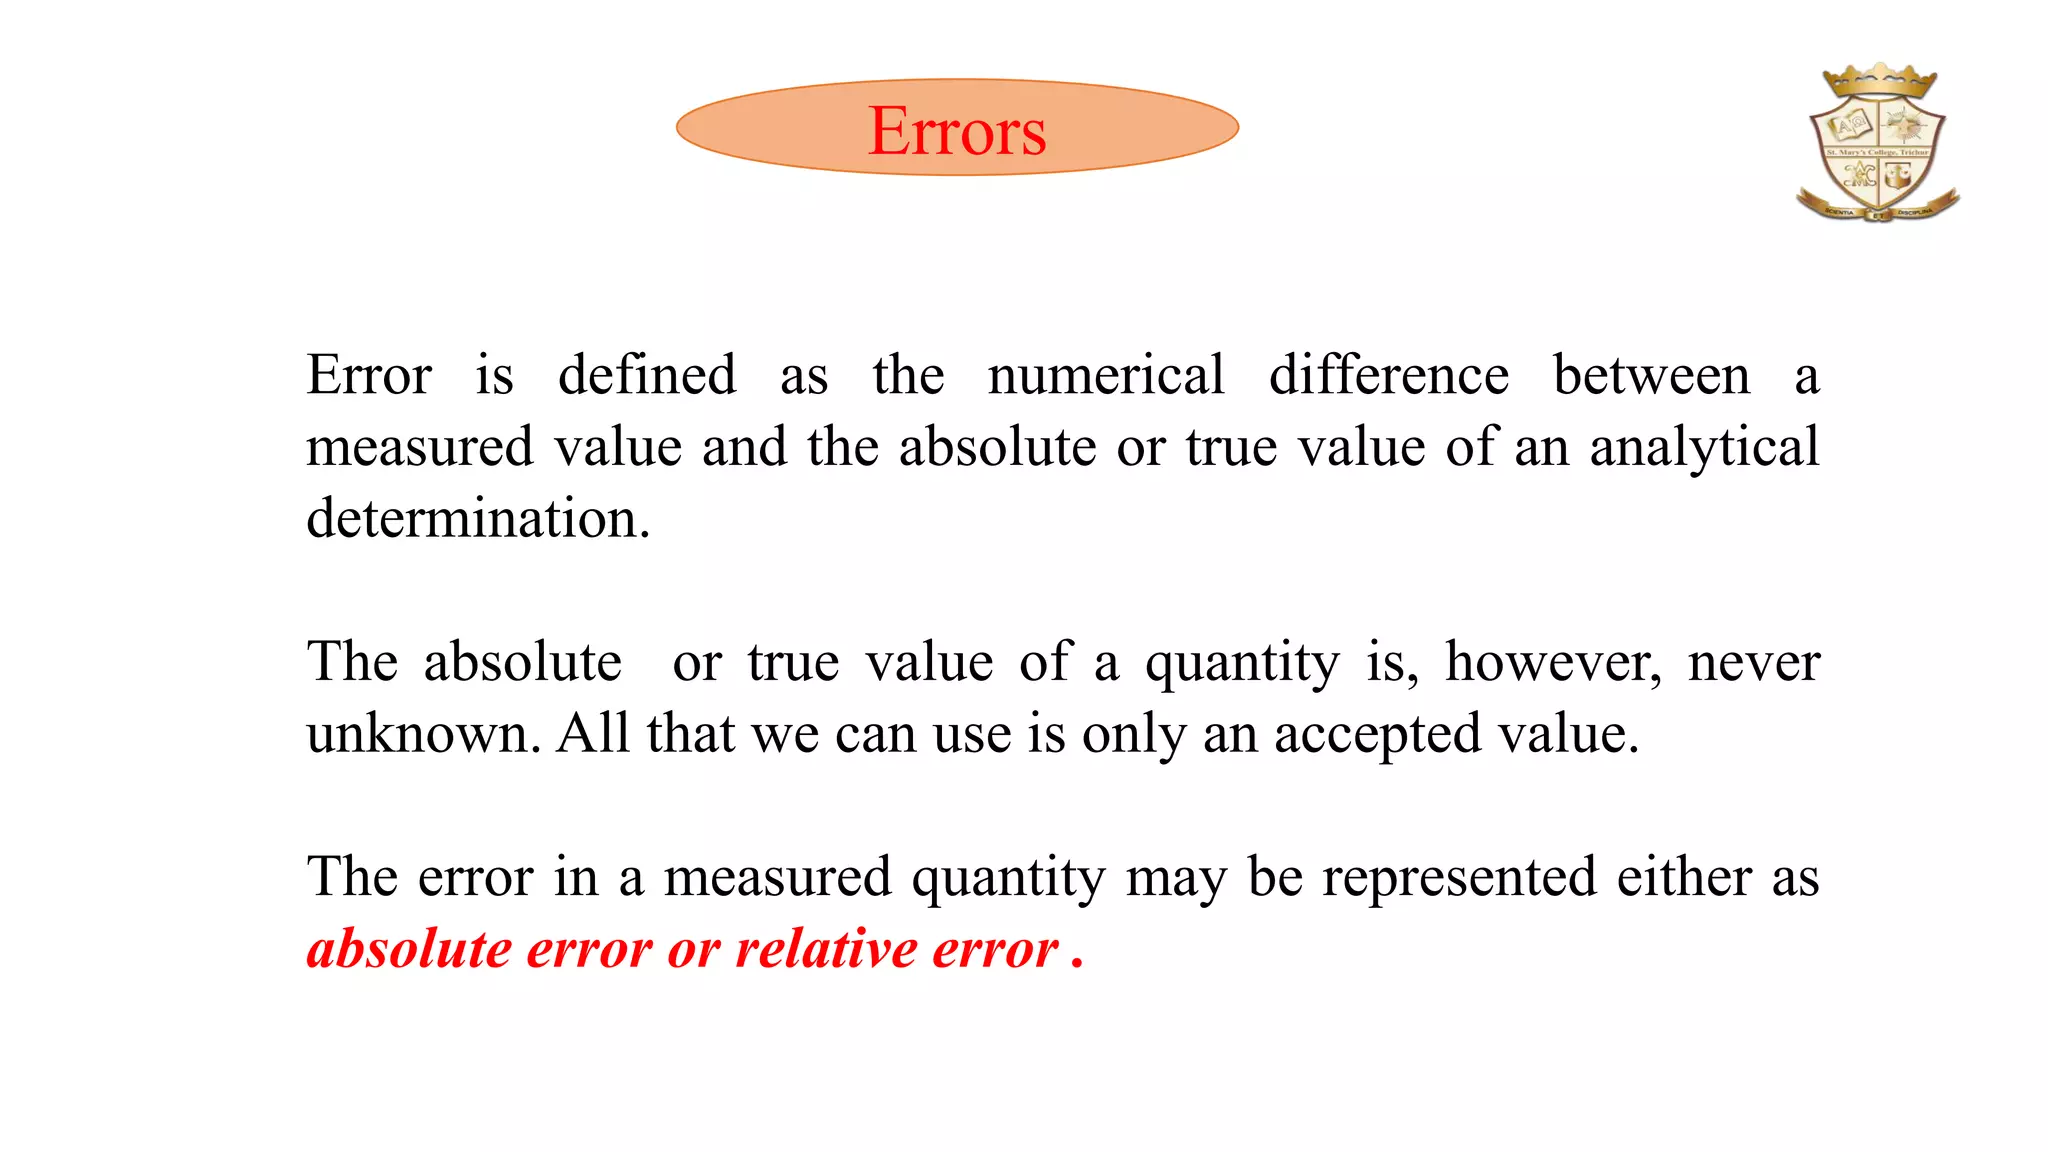
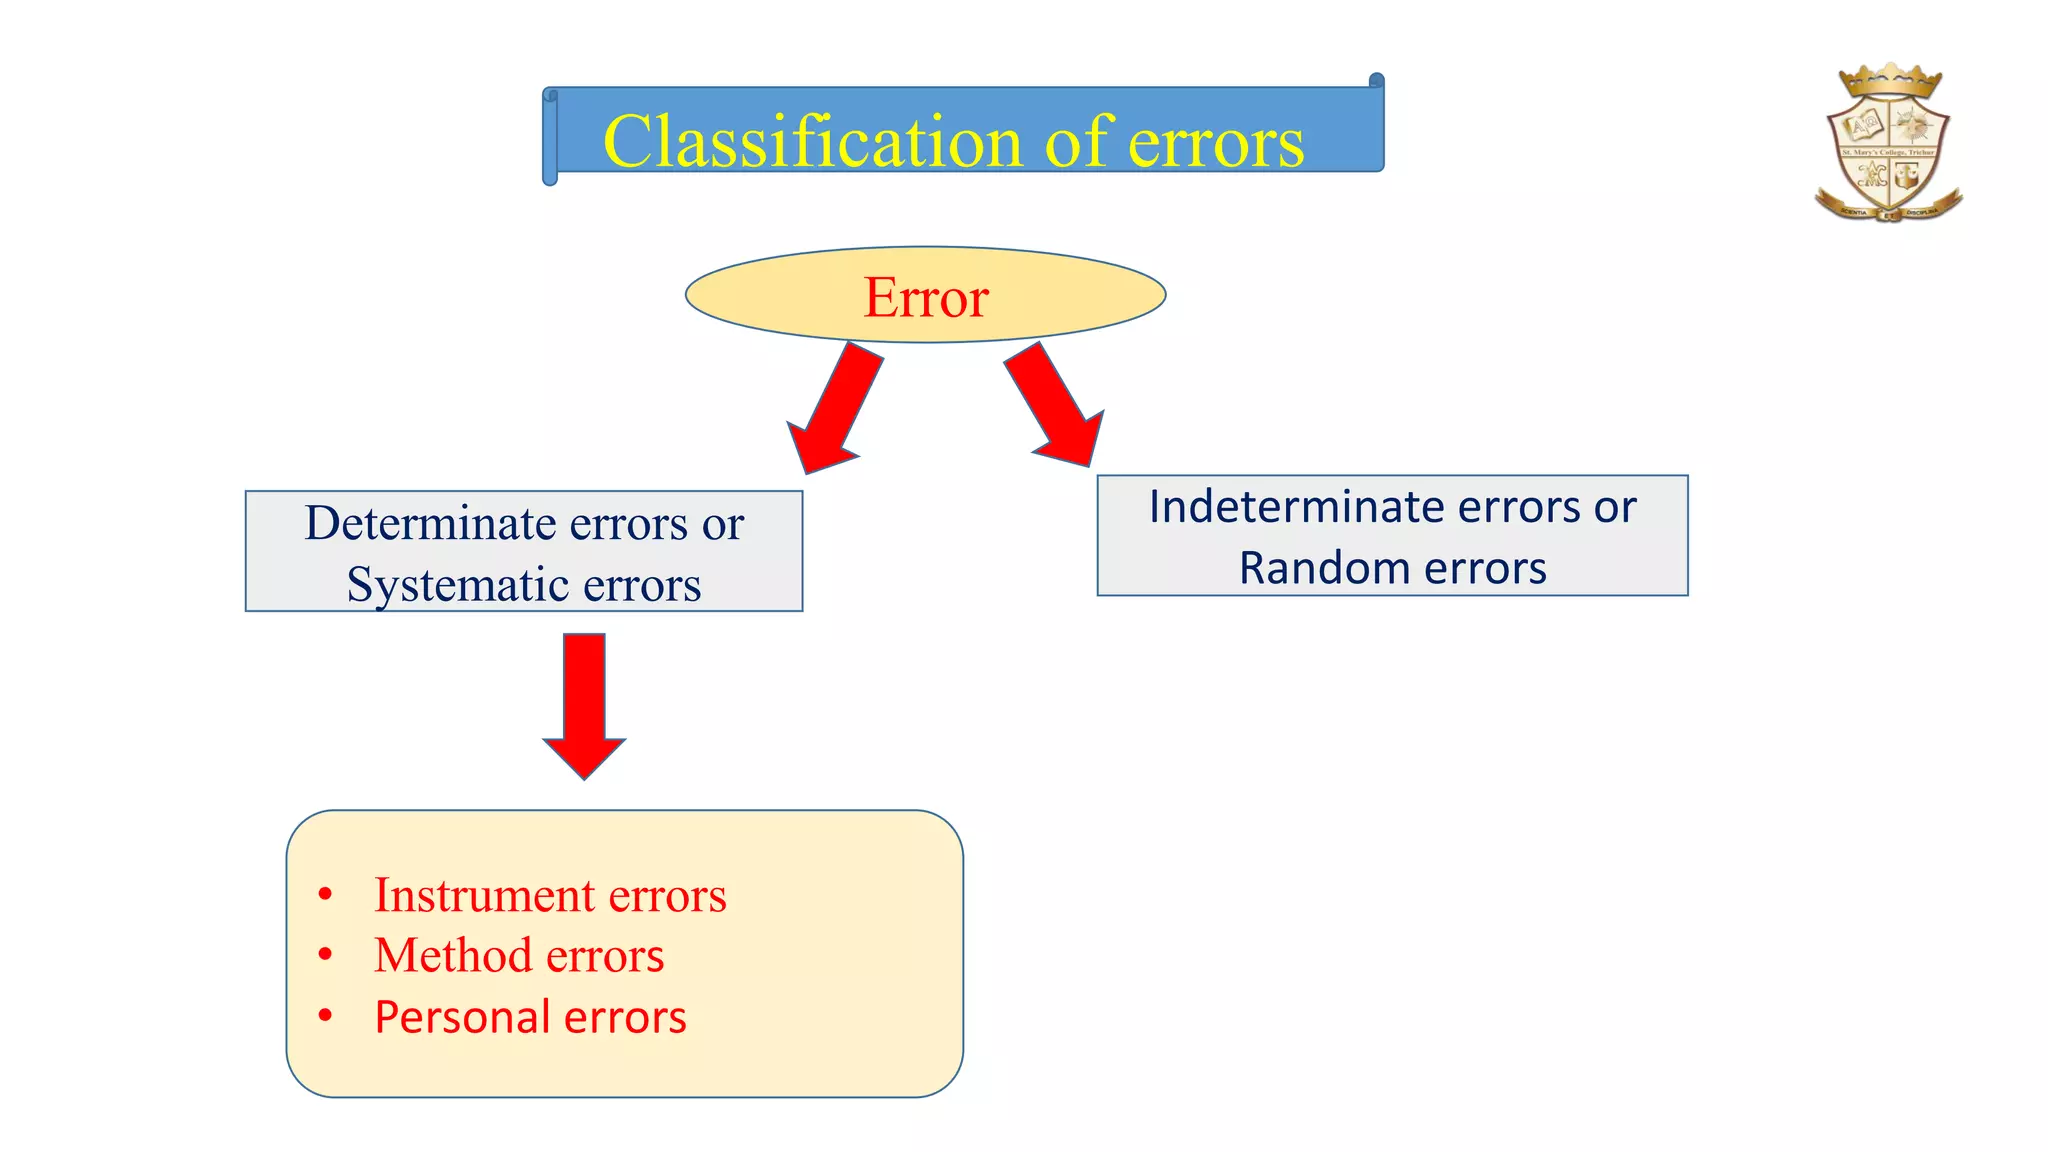
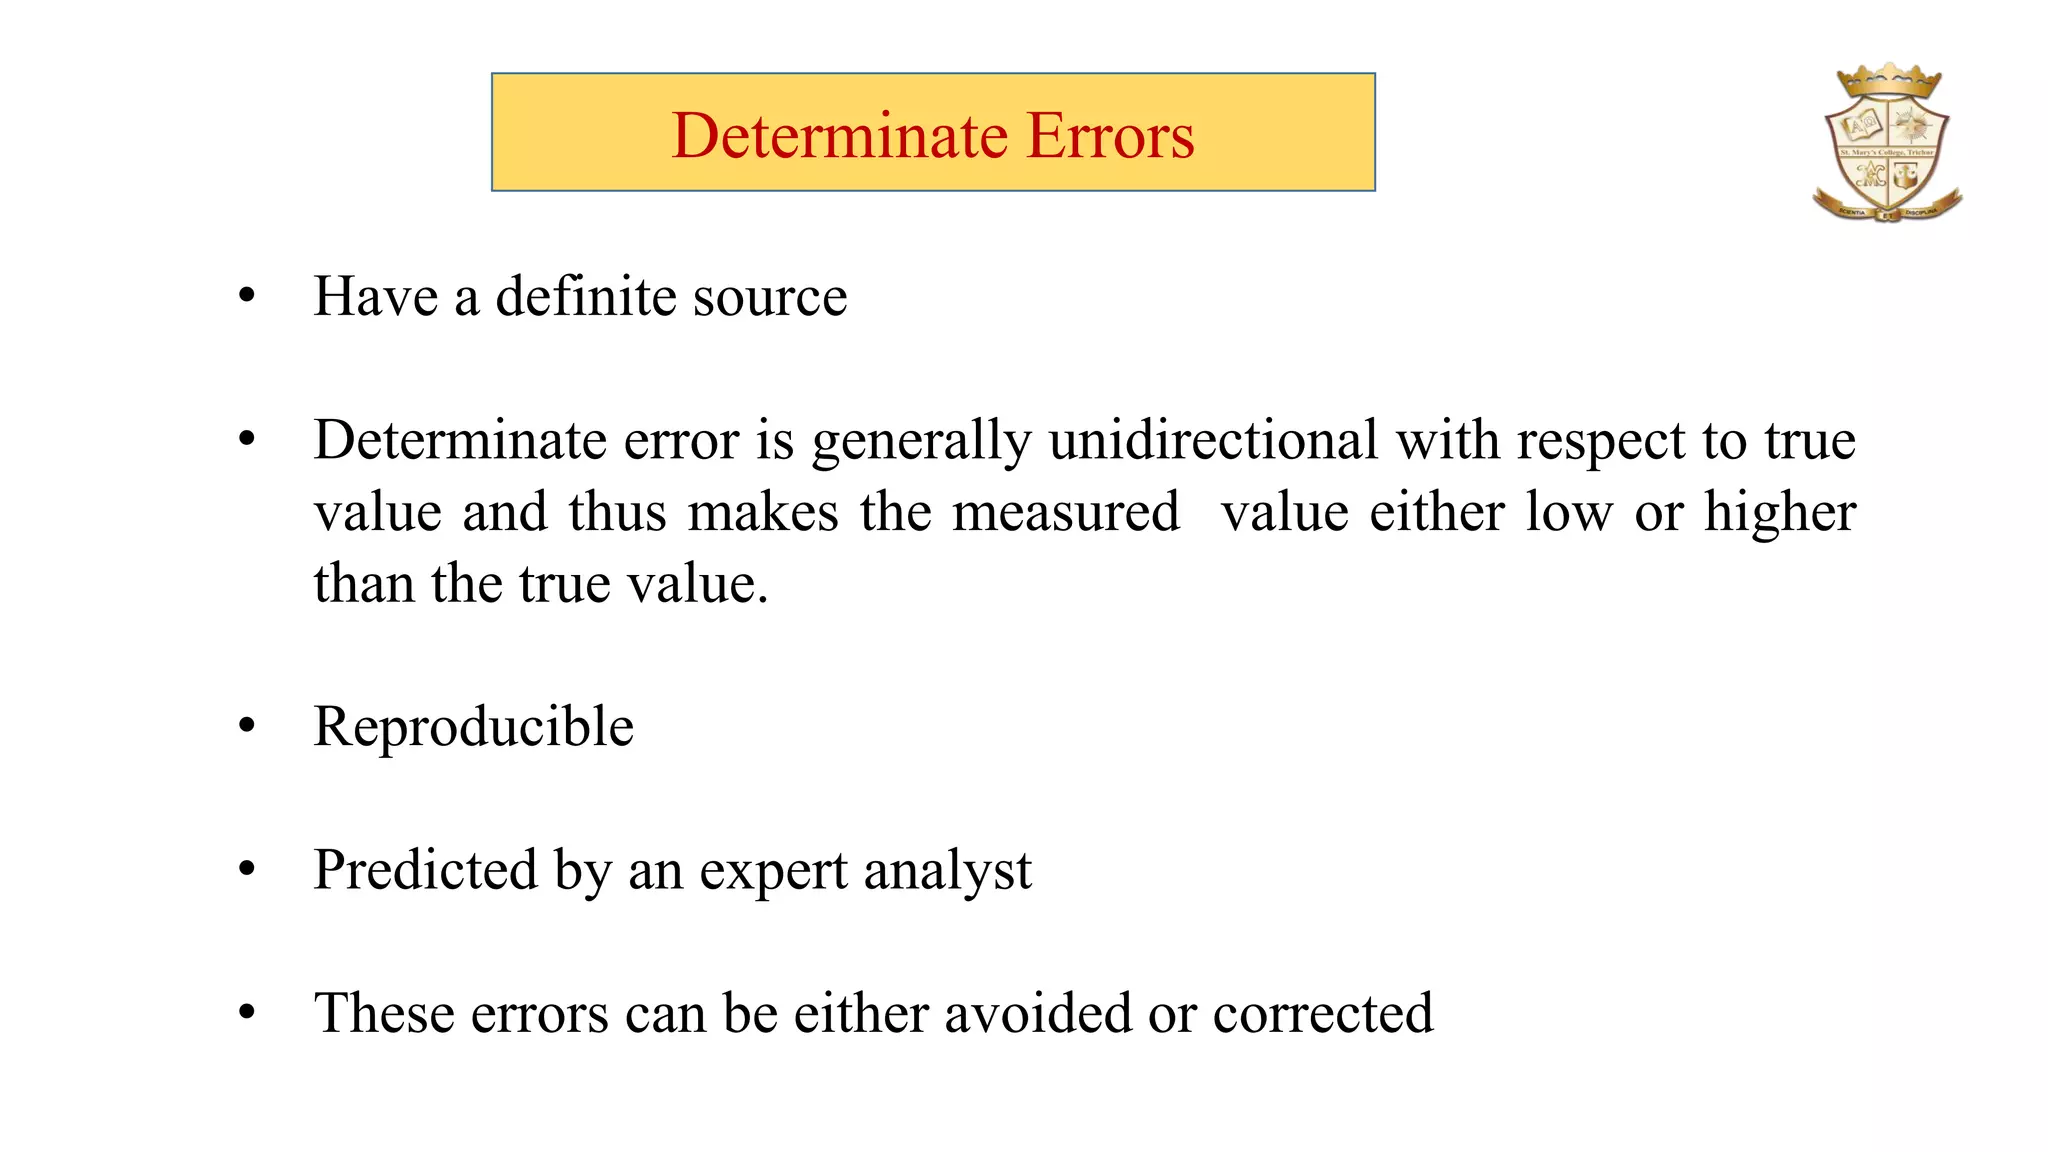
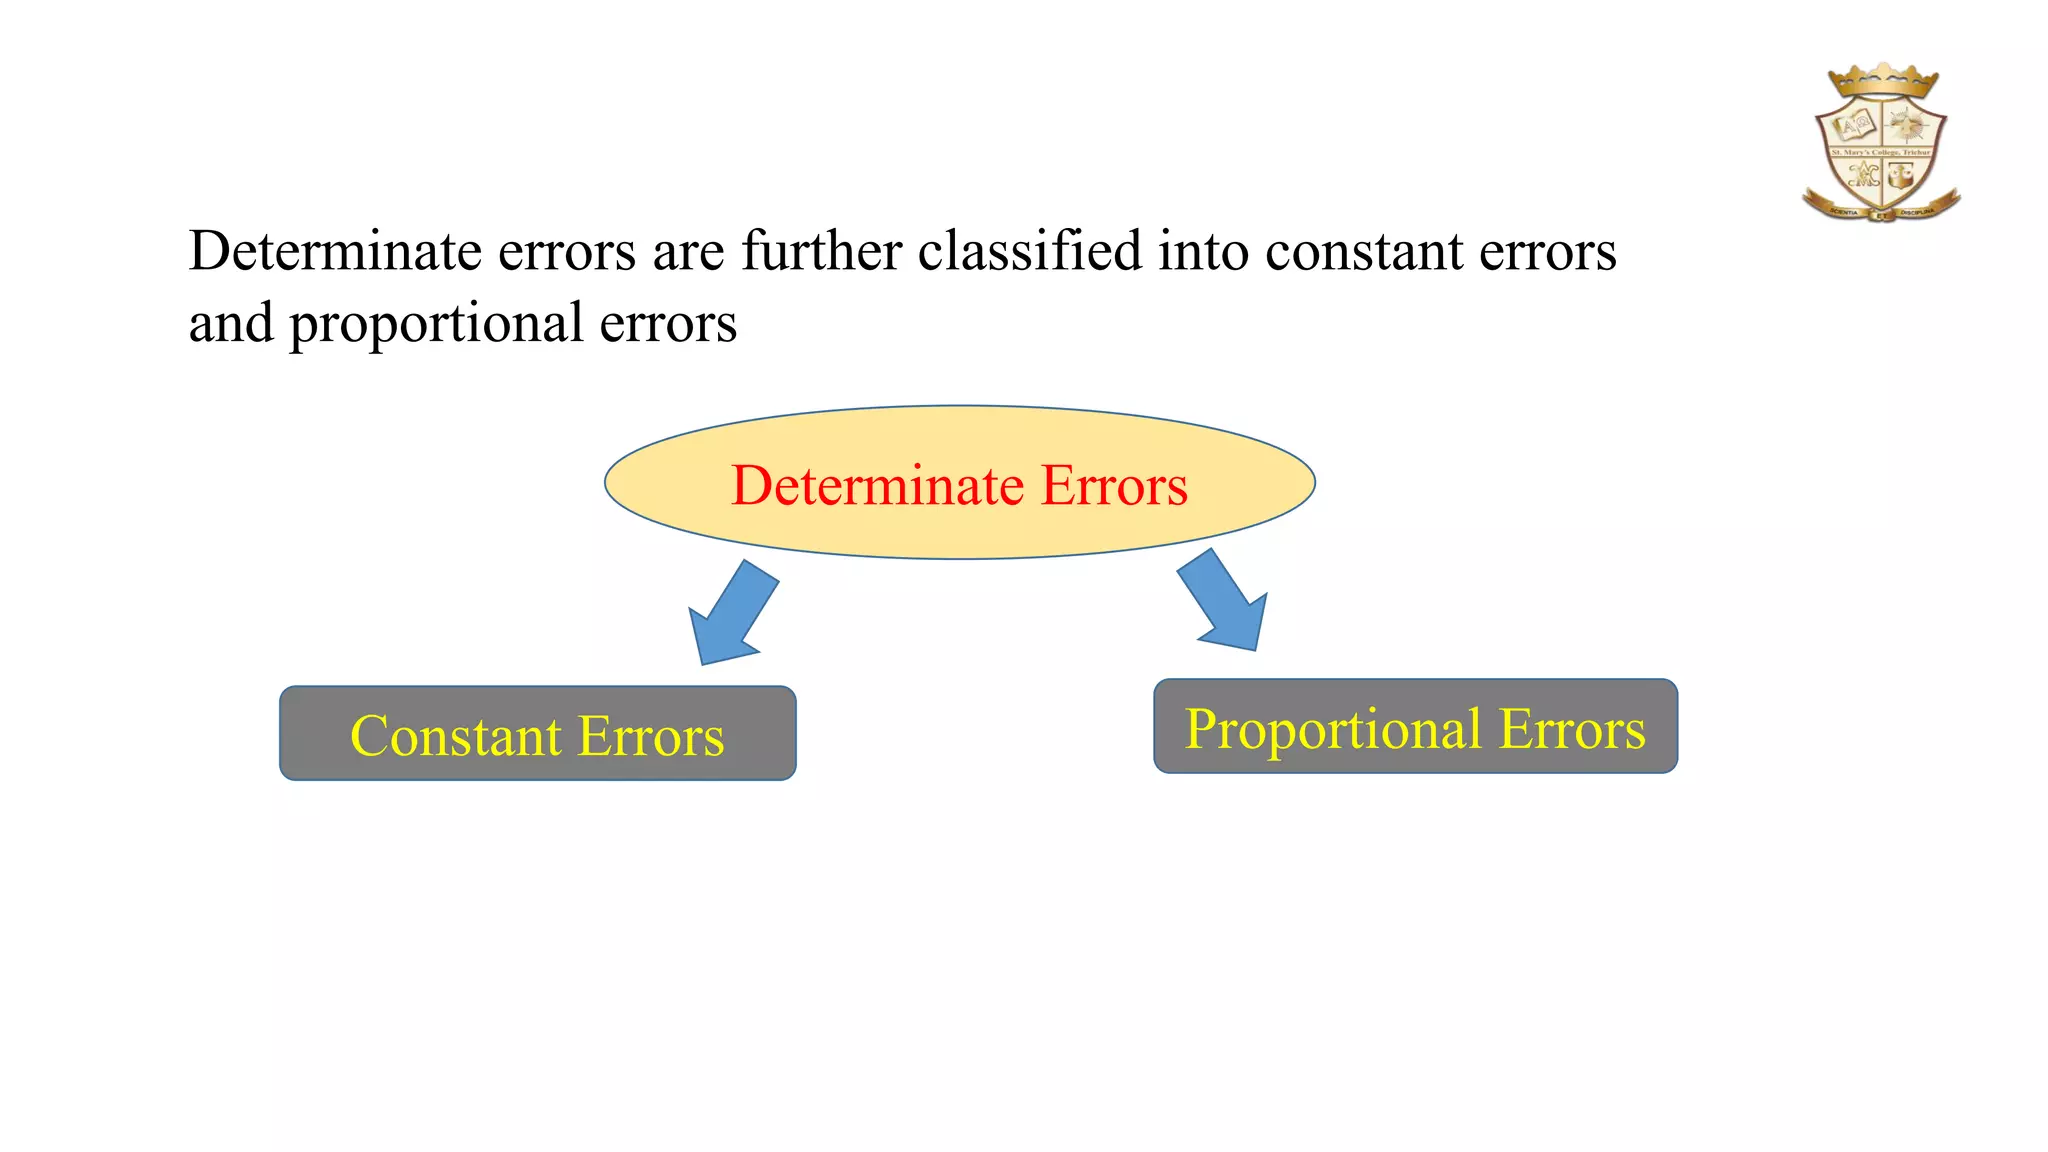
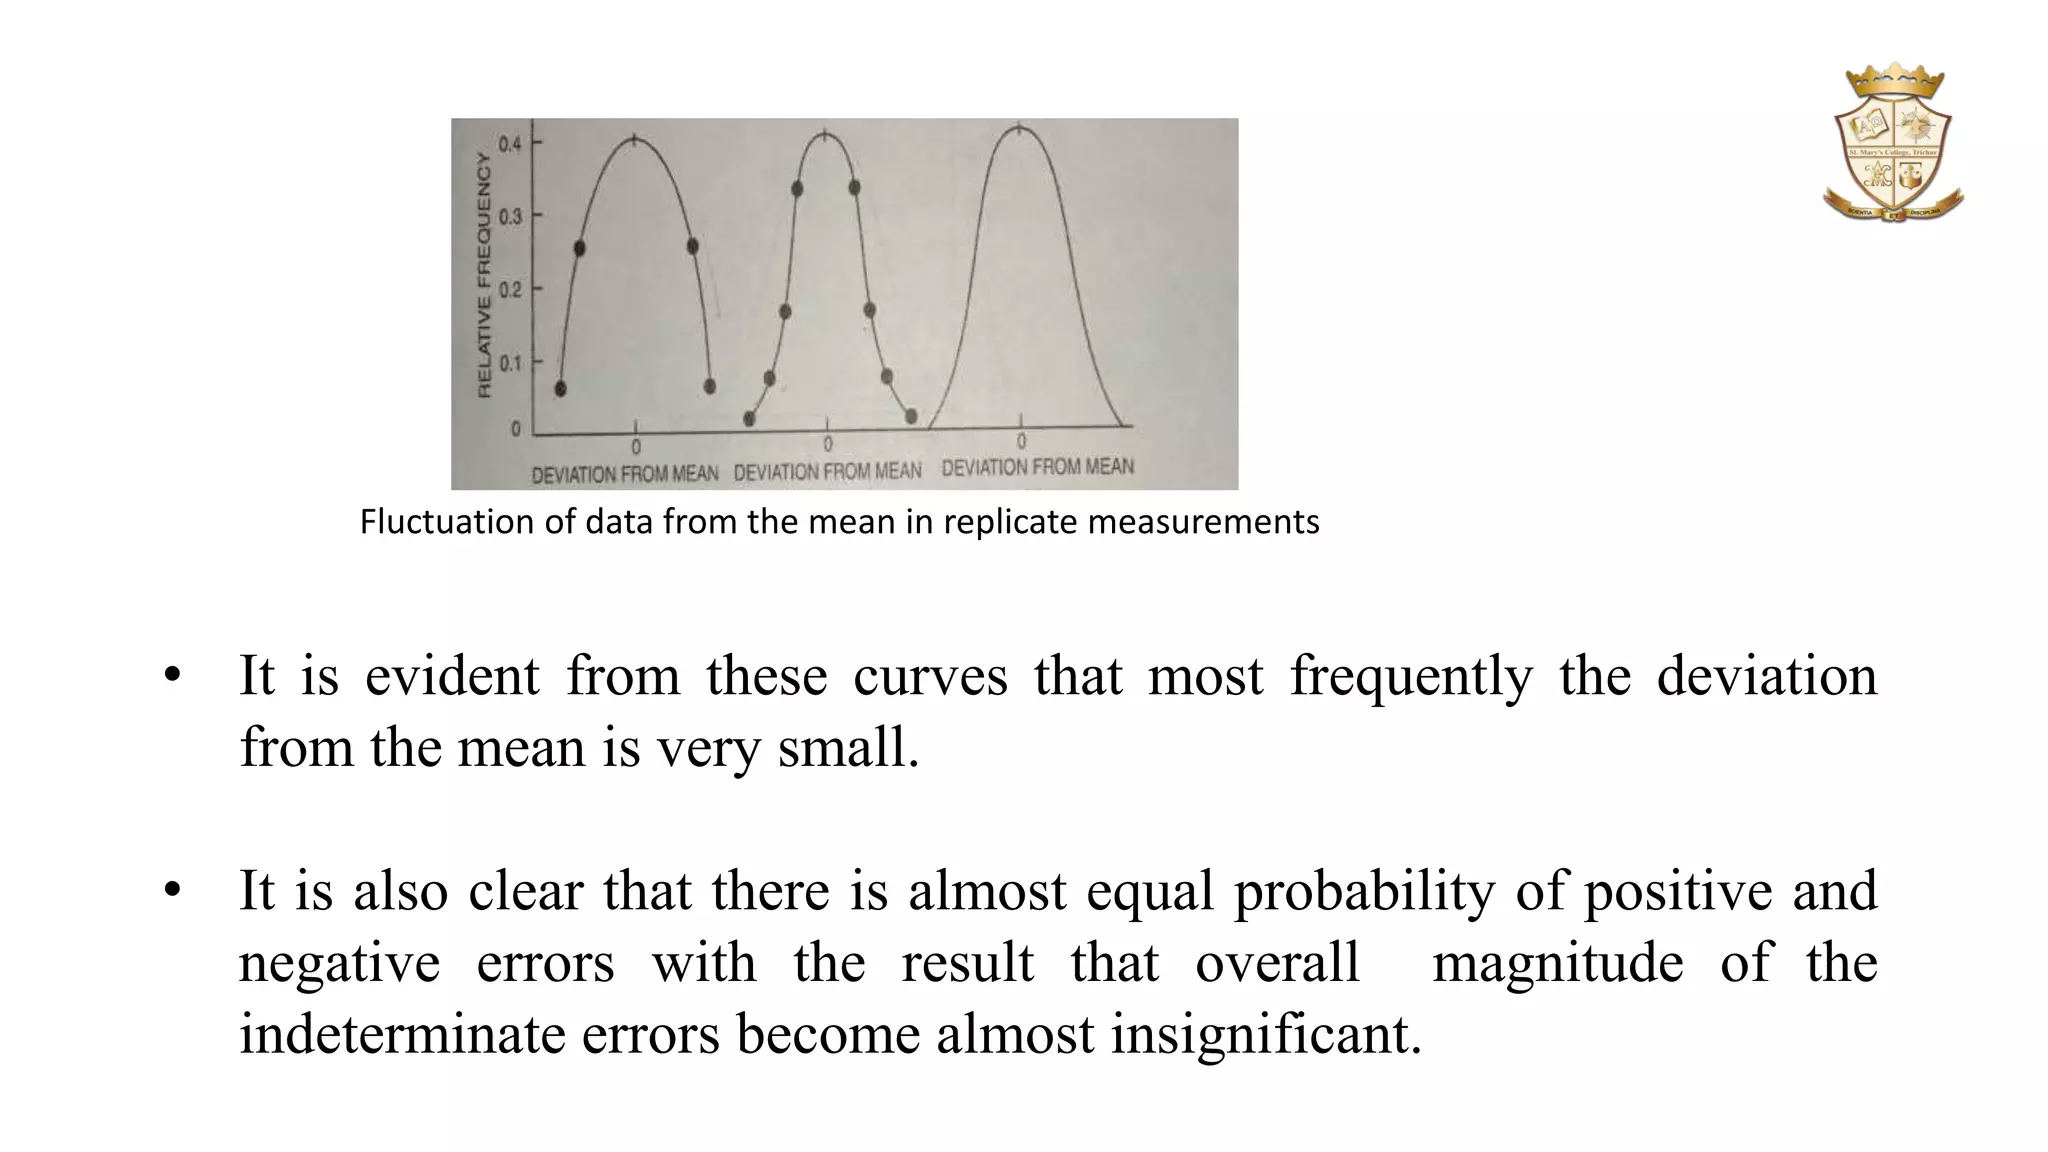
Shafna Jose
Assistant professor
Department of Chemistry
St. Mary’s College, Thrissur
Analytical chemistry
Significant Figures
The significant figures in a numerical expression are defined as all those
whose values are known with certainty with one additional digit whose
value is uncertain.
For e.g., if the mass of a substance is reported as 2.03765 gram, then only
the first four figures are meaningful. The last digit known with certainty
is 7.
The digit 6is uncertain and indicates only that the mass is more than
2.037 but less than 2.038.
The last digit 5 is meaningless and superfluous.
By definition, the expression 2.03765 has only five significant figures, of
which four figures are certain and one figure is uncertain
Rules for significant figures
• All non –zero numbers are significant. The number 33.2 has three
significant figures because all of the digits present are non-zero.
• Zeros between two non0-zero digits are significant. 2051has four
significant figures. The zero is between 2 and 5.
• Leading zeros are not significant. They are nothing more than
place holders, The number 0.54 has only two significant figures.
All of the zeros are leading.
• Trailing zeros to the right of the decimal are significant.
• Trailing zeros in a whole number with the decimal shown are significant.
• Trailing zeros in a whole number with no decimal shown are not significant.
• For a number in scientific notation : N × 10x
Error is defined as the numerical difference between a
measured value and the absolute or true value of an analytical
determination.
The absolute or true value of a quantity is, however, never
unknown. All that we can use is only an accepted value.
The error in a measured quantity may be represented either as
absolute error or relative error .
Errors
Absolute error :The absolute error E, in a measurement is expressed
as
E = xi – xt
where xi is the measured value and xt is the true (accepted) value
for the given measurement.
Relative error : The relative error in a measurement is expressed as
Er = xi - xt
xt
Absolute error and Relative Error
Error
Determinate errors or
Systematic errors
Indeterminate errors or
Random errors
• Instrument errors
• Method errors
• Personal errors
Classification of errors
Determinate Errors
• Have a definite source
• Determinate error is generally unidirectional with respect to true
value and thus makes the measured value either low or higher
than the true value.
• Reproducible
• Predicted by an expert analyst
• These errors can be either avoided or corrected
Determinate errors are of three types : instrument errors, method errors and
personal errors.
Instrument Errors
• These errors arise from imperfections in measuring devices.
• For instance, measuring devices such as pipettes, burettes, measuring
cylinders, measuring flasks etc. contain volumes that are different from
those indicated by their graduations
The reasons for these differences are :
1. The use of glassware at a temperature which is significantly
different from the temperature at which the glassware was
calibrated.
2. Distortions in the walls of the container due to heating while
drying the glassware
3. Errors in the original calibration
4. Contamination of the inner surfaces of the containers
Instruments powered by electricity are very much prone to
determinate errors because of the following reasons :
• Fall in voltage of battery operated instruments.
• Increased resistance in circuits due to unclean electrical contacts.
• Effect of temperature on resistors and standard cells.
• Currents induced from 220V power lines.
These errors can be easily detected and corrected.
Method Errors
These errors arise from the non ideal behavior of reagents and
reactions involved in a given analysis.
The non ideality originates from :
• The slowness of the reactions
• Incompleteness of reactions.
• Instability of reactants
• Non-specificity of reagents .
• Occurrence of side reactions which interfere with the main
process of measurement.
Since theses errors are inherent in the method, they cannot be
easily detected and corrected.
Personal Errors
• These errors arise from erratic personal judgement, as also from
prejudice or bias.
• Many experimental measurements such as the estimation of the
position of the pointer between two scale divisions , judgement of
the color of the solution at the end point of a titration, judgement of
the level of a liquid with respect to a graduation on a burette or a
pipette, are sources of personal errors.
• These errors would vary from person to person and can be reduced
to a minimum by experience and careful physical manipulation
Determinate errors are further classified into constant errors
and proportional errors
Determinate Errors
Constant Errors Proportional Errors
Constant Errors
• The magnitude of a constant error is independent of the size of the
sample or the size of the quantity that is being measured.
• It is also independent of the concentration of the substance being
analyzed.
• For e.g. in volumetric analysis, the excess of the titrant that has to be
added to bring about a change in color at the end point remains the
same whether we titrate 10 ml or 20 ml or 25 ml of the solution.
• Constant errors would become more serious as we decrease the size of
the quantity being measured.
• The effect of a constant error can be reduced to a minimum by
increasing the size of the sample to a maximum within permissible
limits
Proportional Errors
• It arises due to the presence of interfering impurities in the
sample.
• The magnitude of such an error depends upon the fraction of the
impurity and is independent of the size of the sample.
Correction of Determinate
Errors
• The determinate instrument errors are detected and corrected by
periodic calibration of the instruments.
• The determinate personal errors can be reduced to a minimum by
care and self-discipline. The most essential requisite of avoiding
personal errors is to fight against bias.
• The determinate method errors are rather difficult to detect. The
following procedures are suggested for the identification and
compensation of method errors.
1. Analysis of standard samples : Method errors can be detected by
carrying out the analysis of a standard sample prepared in such a way
that its composition is exactly the same as that of the material under
test.
2. Independent Analysis : A dependable procedure for detecting
method errors consists in carrying out parallel analysis of the sample
by another independent method of established reliability.
3. Blank determination : Blank determination in which all the steps
involved in the analysis are carried out in the absence of the sample in
exactly the same fashion is quite useful for exposing method errors
which are due to contaminations of the reagents and glass vessels
employed for the analysis.
Indeterminate errors
• These errors arise from uncertainties which are inevitably
associated with every physical or chemical measurement.
• These are random or accidental errors whose sources, though
many cannot be positively identified.
• As a result of these errors, the data from replicate
measurements fluctuate randomly around the mean of the set.
Fluctuation of data from the mean in replicate measurements
• It is evident from these curves that most frequently the deviation
from the mean is very small.
• It is also clear that there is almost equal probability of positive and
negative errors with the result that overall magnitude of the
indeterminate errors become almost insignificant.
Precision
• The degree of agreement between two or more replicate
measurements made on a sample in an identical manner, i.e., exactly
in the same fashion, is known as the precision of the measurement.
• If we make a large number of observations of a single quantity and
then plot the number of times a given value of the quantity itself, we
obtain a curve of the type given below. This is known as error
distribution curve.
• These curves have two useful qualitative features, viz., the height of
the peak of the distribution curve and the spread of the distribution
curve(dispersion)
• The precision of a set of measurements is judged from the
dispersion, i.e. the spread of the error distribution curve.
• The lesser the spread, the greater is the precision of the of the
measurements.
Error distribution curve
ACCURACY
• Accuracy is defined as the closeness of a measurement or a
set of measurements to the true or accepted value.
• Accuracy is expressed in terms of absolute error and relative
error.
Difference between
Accuracy and Precision
• Accuracy - measure of the agreement between an experimental result
and the true value of a given quantity.
• Precision - measures the agreement between several experimental
results obtained for the same quantity under identical
conditions.Precision can be determined by replicate measurements of
the same quantity.
• Accuracy can never be determined exactly because it involves the use of
absolute or true value of the quantity being measured which is never
known.
• Accuracy is expressed in terms of relative error or absolute
error whereas precision is expressed in terms of various
types of deviations from the mean.
• The error distribution curve for a less precise set of
measurements differs from that of a more precise set with
respect to its scatter or spread or dispersion; the spread
being more for a less precise set of measurements .
Error distribution curve for less accurate and
more accurate sets of results
Characteristics of less precise and more precise result
References :
• Principles of Inorganic Chemistry – B.R Puri, L.R Sharma, K.C Kalia
• Inorganic Chemistry – Shriver & Atkins
THANK YOU

Analytical Chemistry.ppsx

  • 1.
    Shafna Jose Assistant professor Departmentof Chemistry St. Mary’s College, Thrissur Analytical chemistry
  • 2.
    Significant Figures The significantfigures in a numerical expression are defined as all those whose values are known with certainty with one additional digit whose value is uncertain. For e.g., if the mass of a substance is reported as 2.03765 gram, then only the first four figures are meaningful. The last digit known with certainty is 7. The digit 6is uncertain and indicates only that the mass is more than 2.037 but less than 2.038. The last digit 5 is meaningless and superfluous. By definition, the expression 2.03765 has only five significant figures, of which four figures are certain and one figure is uncertain
  • 3.
    Rules for significantfigures • All non –zero numbers are significant. The number 33.2 has three significant figures because all of the digits present are non-zero. • Zeros between two non0-zero digits are significant. 2051has four significant figures. The zero is between 2 and 5. • Leading zeros are not significant. They are nothing more than place holders, The number 0.54 has only two significant figures. All of the zeros are leading. • Trailing zeros to the right of the decimal are significant.
  • 4.
    • Trailing zerosin a whole number with the decimal shown are significant. • Trailing zeros in a whole number with no decimal shown are not significant. • For a number in scientific notation : N × 10x
  • 5.
    Error is definedas the numerical difference between a measured value and the absolute or true value of an analytical determination. The absolute or true value of a quantity is, however, never unknown. All that we can use is only an accepted value. The error in a measured quantity may be represented either as absolute error or relative error . Errors
  • 6.
    Absolute error :Theabsolute error E, in a measurement is expressed as E = xi – xt where xi is the measured value and xt is the true (accepted) value for the given measurement. Relative error : The relative error in a measurement is expressed as Er = xi - xt xt Absolute error and Relative Error
  • 7.
    Error Determinate errors or Systematicerrors Indeterminate errors or Random errors • Instrument errors • Method errors • Personal errors Classification of errors
  • 8.
    Determinate Errors • Havea definite source • Determinate error is generally unidirectional with respect to true value and thus makes the measured value either low or higher than the true value. • Reproducible • Predicted by an expert analyst • These errors can be either avoided or corrected
  • 9.
    Determinate errors areof three types : instrument errors, method errors and personal errors. Instrument Errors • These errors arise from imperfections in measuring devices. • For instance, measuring devices such as pipettes, burettes, measuring cylinders, measuring flasks etc. contain volumes that are different from those indicated by their graduations
  • 10.
    The reasons forthese differences are : 1. The use of glassware at a temperature which is significantly different from the temperature at which the glassware was calibrated. 2. Distortions in the walls of the container due to heating while drying the glassware 3. Errors in the original calibration 4. Contamination of the inner surfaces of the containers
  • 11.
    Instruments powered byelectricity are very much prone to determinate errors because of the following reasons : • Fall in voltage of battery operated instruments. • Increased resistance in circuits due to unclean electrical contacts. • Effect of temperature on resistors and standard cells. • Currents induced from 220V power lines. These errors can be easily detected and corrected.
  • 12.
    Method Errors These errorsarise from the non ideal behavior of reagents and reactions involved in a given analysis. The non ideality originates from : • The slowness of the reactions • Incompleteness of reactions. • Instability of reactants • Non-specificity of reagents . • Occurrence of side reactions which interfere with the main process of measurement. Since theses errors are inherent in the method, they cannot be easily detected and corrected.
  • 13.
    Personal Errors • Theseerrors arise from erratic personal judgement, as also from prejudice or bias. • Many experimental measurements such as the estimation of the position of the pointer between two scale divisions , judgement of the color of the solution at the end point of a titration, judgement of the level of a liquid with respect to a graduation on a burette or a pipette, are sources of personal errors. • These errors would vary from person to person and can be reduced to a minimum by experience and careful physical manipulation
  • 14.
    Determinate errors arefurther classified into constant errors and proportional errors Determinate Errors Constant Errors Proportional Errors
  • 15.
    Constant Errors • Themagnitude of a constant error is independent of the size of the sample or the size of the quantity that is being measured. • It is also independent of the concentration of the substance being analyzed. • For e.g. in volumetric analysis, the excess of the titrant that has to be added to bring about a change in color at the end point remains the same whether we titrate 10 ml or 20 ml or 25 ml of the solution. • Constant errors would become more serious as we decrease the size of the quantity being measured. • The effect of a constant error can be reduced to a minimum by increasing the size of the sample to a maximum within permissible limits
  • 16.
    Proportional Errors • Itarises due to the presence of interfering impurities in the sample. • The magnitude of such an error depends upon the fraction of the impurity and is independent of the size of the sample.
  • 17.
    Correction of Determinate Errors •The determinate instrument errors are detected and corrected by periodic calibration of the instruments. • The determinate personal errors can be reduced to a minimum by care and self-discipline. The most essential requisite of avoiding personal errors is to fight against bias. • The determinate method errors are rather difficult to detect. The following procedures are suggested for the identification and compensation of method errors.
  • 18.
    1. Analysis ofstandard samples : Method errors can be detected by carrying out the analysis of a standard sample prepared in such a way that its composition is exactly the same as that of the material under test. 2. Independent Analysis : A dependable procedure for detecting method errors consists in carrying out parallel analysis of the sample by another independent method of established reliability. 3. Blank determination : Blank determination in which all the steps involved in the analysis are carried out in the absence of the sample in exactly the same fashion is quite useful for exposing method errors which are due to contaminations of the reagents and glass vessels employed for the analysis.
  • 19.
    Indeterminate errors • Theseerrors arise from uncertainties which are inevitably associated with every physical or chemical measurement. • These are random or accidental errors whose sources, though many cannot be positively identified. • As a result of these errors, the data from replicate measurements fluctuate randomly around the mean of the set.
  • 20.
    Fluctuation of datafrom the mean in replicate measurements • It is evident from these curves that most frequently the deviation from the mean is very small. • It is also clear that there is almost equal probability of positive and negative errors with the result that overall magnitude of the indeterminate errors become almost insignificant.
  • 21.
    Precision • The degreeof agreement between two or more replicate measurements made on a sample in an identical manner, i.e., exactly in the same fashion, is known as the precision of the measurement. • If we make a large number of observations of a single quantity and then plot the number of times a given value of the quantity itself, we obtain a curve of the type given below. This is known as error distribution curve.
  • 22.
    • These curveshave two useful qualitative features, viz., the height of the peak of the distribution curve and the spread of the distribution curve(dispersion) • The precision of a set of measurements is judged from the dispersion, i.e. the spread of the error distribution curve. • The lesser the spread, the greater is the precision of the of the measurements. Error distribution curve
  • 23.
    ACCURACY • Accuracy isdefined as the closeness of a measurement or a set of measurements to the true or accepted value. • Accuracy is expressed in terms of absolute error and relative error.
  • 24.
    Difference between Accuracy andPrecision • Accuracy - measure of the agreement between an experimental result and the true value of a given quantity. • Precision - measures the agreement between several experimental results obtained for the same quantity under identical conditions.Precision can be determined by replicate measurements of the same quantity. • Accuracy can never be determined exactly because it involves the use of absolute or true value of the quantity being measured which is never known.
  • 25.
    • Accuracy isexpressed in terms of relative error or absolute error whereas precision is expressed in terms of various types of deviations from the mean. • The error distribution curve for a less precise set of measurements differs from that of a more precise set with respect to its scatter or spread or dispersion; the spread being more for a less precise set of measurements .
  • 26.
    Error distribution curvefor less accurate and more accurate sets of results Characteristics of less precise and more precise result
  • 27.
    References : • Principlesof Inorganic Chemistry – B.R Puri, L.R Sharma, K.C Kalia • Inorganic Chemistry – Shriver & Atkins
  • 28.