SlideShare a Scribd company logo
1 of 70
ANALYTICAL
CHEMISTRY
(Errors in Chemical
Analysis)
Mean
value
A mean value is obtained by dividing the sum of a
set of replicate measurements by the number of
individual results in the set.
For example, if a titration is repeated four times and
the titre values are 10.1, 9.9, 10.0 and 10.2ml
Mean = 10.1 + 9.9 + 10 + 10.2
4
= 40.2
4
= 10.05
This mean value is also called arithmetic mean or
average.
The
median
This is a value about which all other values in
a set are equally distributed. Half of the
values are greater and the other half smaller
numerically, compared to the median.
For example: If we have a set of values like
1.1, 1.2, 1.3, 1.4 and 1.5 the median value is
1.3.
When a set of data has an even number of
values, then the median is the average of the
middle pair.
Precision
• Precision is defined as the agreement
between the numerical value of two or more
measurements of the same object that have
been made in an identical manner. Thus, a
value is said to be precise, when there is
agreement between a set of results for the
same quantity.
• Good precision does not guarantee accuracy
Methods of expressing
precision
_
• Precision can be expressed in an absolute
method. In the absolute way the
deviation from the mean
│xi ‒X│ expresses precision without
considering sign
S.No
Sample of an
organic compound
% of carbon
Deviation from mean
_
│xi ‒X │
1 X1 38.42 0.20
2 X2 38.02 0.20
3 X3 38.22 0.00
_
X = 38.22
0.40 = 0.133
3 (Average deviation)
Accura
cy
• Accuracyrepresents
the
nearness to
a
measurement to its expected value.
Any difference between the measured
value and the expected value is
expressed as error.
• For example: The dissociation constant
for acetic acid is 1.75×10‒5 at 25 °C. In
an experiment, if a student arrives at
exactly this value, his value is said to
be accurate.
Accuracy versus precision
1.Accuracy is the closeness of a measurement
to the true (or accepted) value (μ or xt).
Accuracy is expressed by the absolute error
or the relative error:
Absolute
error
• The term accuracy is denoted in terms of
absolute error E, E is the difference
between the observed value (Xi) and the
expected value (Xt).
E = │
Xi – Xt│
• If a student obtains a value of 1.69×10‒5 for
the dissociation constant of acetic acid at
25°C, the absolute error in this
determination is
E = │1.69 ×10‒5 –1.75×10‒5 │
= │0.06 ×10‒5 │
Relative
error
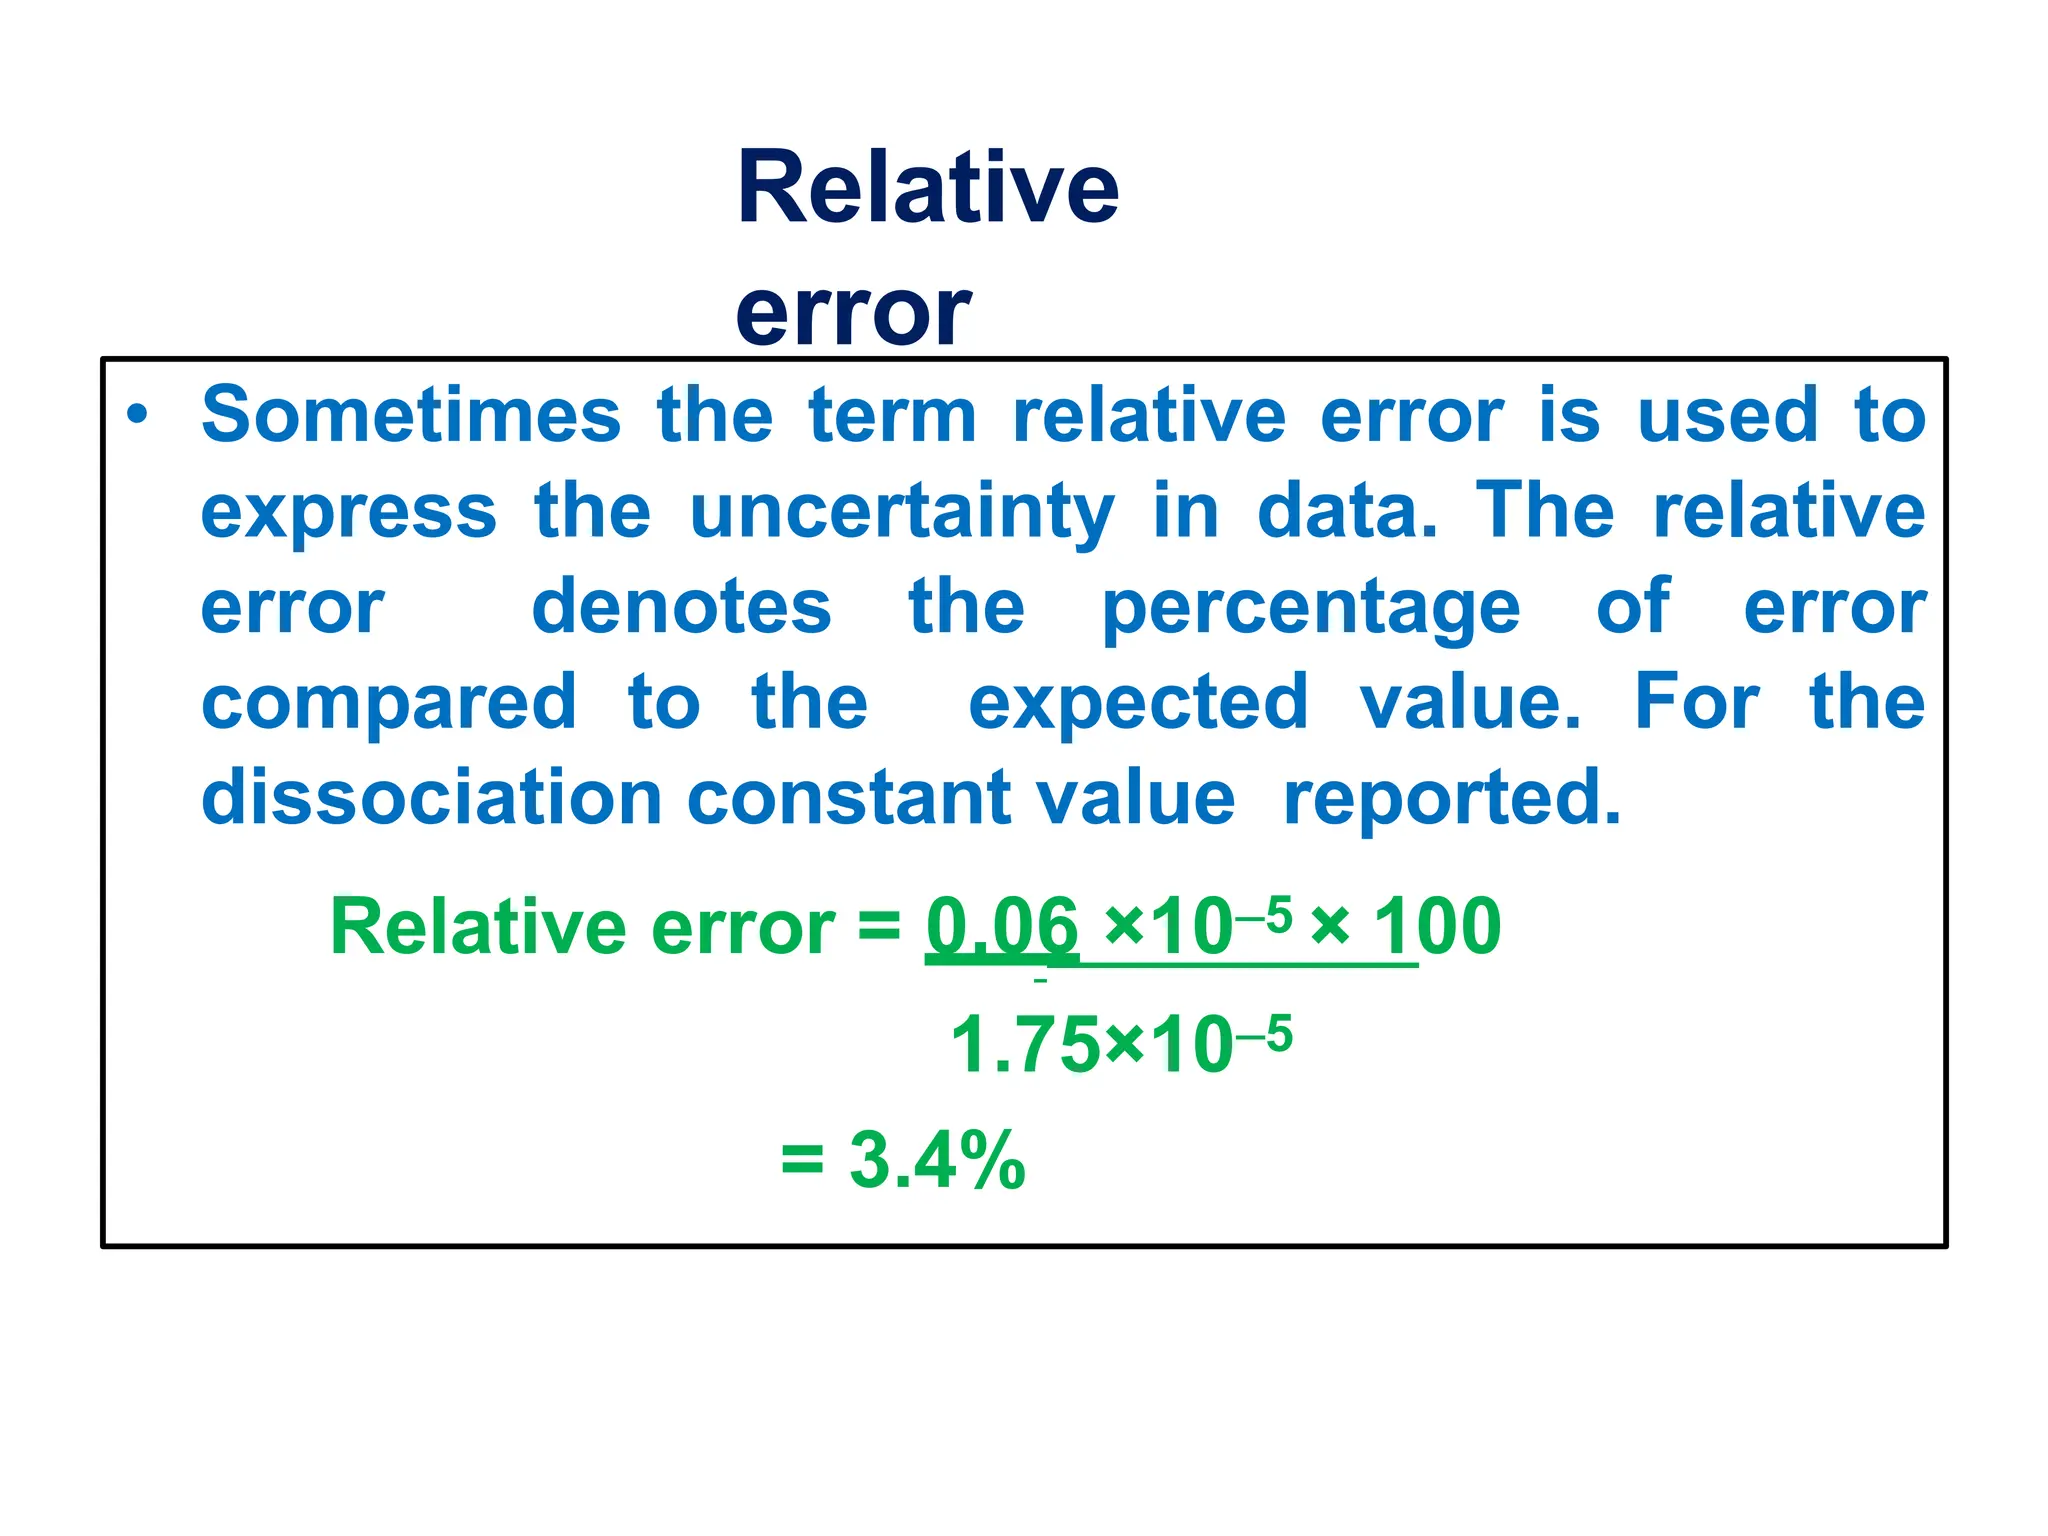
• Sometimes the term relative error is used to
express the uncertainty in data. The relative
error denotes the percentage of error
compared to the expected value. For the
dissociation constant value reported.
Relative error = 0.06 ×10‒5 × 100
1.75×10‒5
= 3.4%
Relative
error
• Sometimes the term relative error is used to
express the uncertainty in data. The relative
error denotes the percentage of error
compared to the expected value. For the
dissociation constant value reported.
Relative error = 0.06 ×10‒5 × 100
1.75×10‒5
= 3.4%
Proble
m:
• The actual length of a field is 500 feet.
instrument shows the length to
be 508
A
measuri
ng feet.
Find:
a.) the absolute error in the measured length of the
field. b.) the relative error in the measured length of
the field.
Solution:
• (a)The absolute error in the length of the field is 8 feet.
E =│ Xi – Xt│ =508-500 = 8 feet.
• b.) The relative error in the length of the field is
Relative error = 8 × 100
500
= 1.6%
Error
s
two main types
• Determinate errors
• Indeterminate errors
Determinate errors:
These errors are determinable and are
avoided if care is taken. Also known as
Systemic errors.
•predictable
•correctable (using a ref.)
•in the same direction ( + or -)
Sources of Systematic (Determinate) Errors
•Instrumental errors
•Operative / Personal errors
•Method errors
Instrumental
error
• Instrumental errors are introduced due to the
use of defective instruments.
• For example an error in volumetric analysis
will be introduced, when a 20ml pipette,
which actually measures 20.1ml, is used.
• Sometimes an instrument error may arise
from the environmental factors on the
instrument.
• For example a pipette calibrated at 20°C, if
used at 30°C will introduce error in volume.
• Instrumental errors may largely be eliminated
by
Operative
errors
• These errors are also called personal errors
and are introduced because of variation of
personal judgements.
• For example due to colour blindness a
person may arrive at wrong results in a
volumetric or
colorimetric analysis.
• Using incorrect mathematical
equations
an
d
caus
e
committingarithmetic mistakeswill
also operative errors.
Detection of Systematic Instrument and
Personal Errors
• analysis of standard samples
• independent analysis
• blank determinations
• variation in sample size
Method errors
• These errors are caused by adopting
defective experimental methods.
• For example in volumetric analysis the use of
an improper indicator leading to wrong
results is an example for methodic error.
• Proper understanding of the theoretical
background of the experiments is a
necessity for avoiding methodic errors.
Method Errors
•Instability of the reagent
•Slowness of some reactions
•Loss of solution by evaporation
•Interferences (pH measurements at
high/low pHs)
•Contaminants
Indeterminate
errors
• These errors are also called accidental
errors. Indeterminate errors arise from
uncertainties in a measurement that are
unknown and which cannot be controlled
by the experimentalist.
• For example: When pipetting out a liquid,
the speed of draining, the angle of
holding the pipette, the portion at which
the pipette is held, etc, would introduce
indeterminate error in the volume of the
liquid pipette out.
Random (Indeterminate)
Errors
•Affect precision but not
accuracy
•Follows a Gaussian or normal
distribution
•Most values fall close to the
mean, with values farther away
becoming less likely. The width
of the distribution tells us
something about the precision of
our measurement.
Random Error
• always present
• unpredictable
• non-correctable (equal probability of being + or -)
• can be reduced by averaging multiple measurements
• can be treated mathematically (with statistical methods)
Gross Error—(Human) silly mistakes:
•occur only occasionally
•often large (+ or -)
•undetected mistakes during the experiment
•can be verify by “Q-test”
Examples:
0.1000 recorded as 0.0100
1.00 g as 1.00 mg
Wrong connection of electrode wires
Normal error
Curve
• Thenormalerror curvewasfirst studied
by Carl FriedrichGaussas a curve for
the
the
distributionof errors. He found that
distribution of errors could be
closely
approximated by a curve
called the normal
curve of errors.
Gaussian Distribution
Two parameters define a Gaussian distribution for a population, the
population mean, μ, and the population standard deviation, σ.
General properties of a normal error curve
(a normalized Gaussian distribution of errors)
a.The mean (or average) is the central point of maximum
frequency (i.e., the top of the bell curve).
b.The curve is symmetric on both sides of the mean (i.e.,
50% per side).
c.There is an exponential decrease in resulting frequency
as you move away from the mean.
d.If time and expense permit, you need to perform more
than 20 replicates when possible to be sure that the
sample mean and standard deviation are sufficiently
close to the population mean and standard deviation.
Normal error
Curve
• This normal distribution curve is a useful
one to measure the extent of
indeterminate error. It is given by
 is the standard deviation
x = value of the continuous random
variable. µ = mean of the normal
random variable
π =constant = 3.14
Normal error
Curve
• In normal error curve, the frequency is
plotted against mean deviation.
• When the frequency is maximum the error is
nil.
• When the frequency decreases,
the magnitude of the error increases
Normal error
Curve
• When  is very large, the curve
obtained is bell shaped. When  is
very small, then a sharp curve is
obtained.
• When frequency
increases, the 
decrease → sharp curve → nil
error.
• When frequency decreases the 
increase → bell shaped curve →
increases
wil
l
wil
l
erro
r
Normal error
Curve
• The normal distributions are extremely
important in statistics and are often
used in science for real valued random
variables whose distributions are not
known.
Significant
figure
• Data have to be reported with care keeping in
mind reliability about the number of figures
used.
• For example, when reporting a value as many
as six decimal numbers can be obtained,
when one uses a calculator.
• However, reporting all these decimal numbers
is meaningless because, as is generally true,
there may be uncertainty about the first
decimal itself.
• Therefore, experimental data should be
rounded off.
Significant
Figures
Rules for Counting Significant Figures
2. Zeros
a. Leading zeros - never count
0.0025 2 significant figures
b. Captive zeros - always count
1.008 4 significant figures
c. Trailing zeros - count only if the number is written
with a decimal point
100 1 significant figure
100. 3 significant figures
120.0 4 significant figures
Significant
figure
• A zero is not a significant figure, when used
to locate a decimal. However, it is significant
when it occurs at the end.
• For example 0.00405 has three significant
figures, the two zeros before the 4 being
used to imply only the magnitude, but
0.04050 has four significant figures, the zero
beyond the 5 being significant.
Significant
figure
• The number of significant figures in a given
number is found by counting the number
figures from the left to right in the number
beginning with the first non-zero digit and
continuing until reaching the digit that
contains the uncertainty. Each of the
following has three significant figures.
646 0.317 9.22 0.00149 20.2
• How many significant figures
are in: 1. 12.548
2. 0.00335
3. 504.70
4. 4000
5. 0.10200
• How many significant figures
are in: 1. 12.548 - 5
2. 0.00335
3. 504.70
4. 4000
5. 0.10200
• How many significant figures
are in: 1. 12.548 - 5
2. 0.00335 - 3
3. 504.70
4. 4000
5. 0.10200
• How many significant figures
are in: 1. 12.548 - 5
2. 0.00335 - 3
3. 504.70 - 5
4. 4000
5. 0.10200
• How many significant figures
are in: 1. 12.548 - 5
2. 0.00335 - 3
3. 504.70 - 5
4. 4000 - 1
5. 0.10200 - 5
Correct answer: 10004.5
Write the sum of 1.586 + 2.31 with the
correct number of significant figures.
1.586 + 2.31 = 3.896
3.896 = 3.90
Write the difference of 0.954 - 0.3109 with
the correct number of significant figures.
0.954 - 0.3109 = 0.6431
0.6431 = 0.643
Write the sum of 1.586 + 2.31 with the
correct number of significant figures.
1.586 + 2.31 = 3.896
3.896 = 3.90
Write the difference of 0.954 - 0.3109 with
the correct number of significant figures.
0.954 - 0.3109 = 0.6431
0.6431 = 0.643
Write the sum of 1.586 + 2.31 with the
correct number of significant figures.
1.586 + 2.31 = 3.896
3.896 = 3.90
Write the difference of 0.954 - 0.3109 with
the correct number of significant figures.
0.954 - 0.3109 = 0.6431
0.6431 = 0.643
Write the product of 2.10 × 0.5896 with
the correct number of significant figures
2.10 × 0.5896 = 1.23816
1.23816 = 1.24
Write the quotient of 16.15 / 2.7 with the
correct number of significant figures.
16.15 / 2.7 = 5.98148148
5.98148148 = 6.0
Write the product of 2.10 × 0.5896 with
the correct number of significant figures
2.10 × 0.5896 = 1.23816
1.23816 = 1.24
Write the quotient of 16.15 / 2.7 with the
correct number of significant figures.
16.15 / 2.7 = 5.98148148
5.98148148 = 6.0
Write the product of 2.10 × 0.5896 with
the correct number of significant figures
2.10 × 0.5896 = 1.23816
1.23816 = 1.24
Write the quotient of 16.15 / 2.7 with the
correct number of significant figures.
16.15 / 2.7 = 5.98148148
5.98148148 = 6.0
Rules for Rounding Off Numbers
•When the number to be dropped is less
than 5 the preceding number is not
changed.
•When the number to be dropped is 5 or
larger, the preceding number is
increased by one unit.
•Round the following number to 3 sig
figs: 3.34966 x 104
=3.35 x 10⁴
Rules for Rounding Off Numbers
•When the number to be dropped is less
than 5 the preceding number is not
changed.
•When the number to be dropped is 5 or
larger, the preceding number is
increased by one unit.
•Round the following number to 3 sig
figs: 3.34966 x 104
=3.35 x 10⁴
Thank you and have a good
day!

More Related Content

Similar to Errors in Chemistry ANALYTICAL CHEMISTRY (Errors in Chemical Analysis).pptx

Chapter 4(1).pptx
Chapter 4(1).pptxChapter 4(1).pptx
Chapter 4(1).pptxmahamoh6
 
statistics-for-analytical-chemistry (1).ppt
statistics-for-analytical-chemistry (1).pptstatistics-for-analytical-chemistry (1).ppt
statistics-for-analytical-chemistry (1).pptHalilIbrahimUlusoy
 
12 13 h2_measurement_ppt
12 13 h2_measurement_ppt12 13 h2_measurement_ppt
12 13 h2_measurement_pptTan Hong
 
Accuracy, Precision Measurement
Accuracy, Precision Measurement Accuracy, Precision Measurement
Accuracy, Precision Measurement Pulchowk Campus
 
Analytical Chemistry.ppsx
Analytical Chemistry.ppsxAnalytical Chemistry.ppsx
Analytical Chemistry.ppsxSrShafnaJose
 
Definitions related to measurements
Definitions related to measurementsDefinitions related to measurements
Definitions related to measurementsArun Umrao
 
Errors-Analysis-MNN-RN.pptx
Errors-Analysis-MNN-RN.pptxErrors-Analysis-MNN-RN.pptx
Errors-Analysis-MNN-RN.pptxRishabhNath3
 
1625941932480.pptx
1625941932480.pptx1625941932480.pptx
1625941932480.pptxMathiQueeny
 
Ch3_Statistical Analysis and Random Error Estimation.pdf
Ch3_Statistical Analysis and Random Error Estimation.pdfCh3_Statistical Analysis and Random Error Estimation.pdf
Ch3_Statistical Analysis and Random Error Estimation.pdfVamshi962726
 

Similar to Errors in Chemistry ANALYTICAL CHEMISTRY (Errors in Chemical Analysis).pptx (20)

9618821.pdf
9618821.pdf9618821.pdf
9618821.pdf
 
Chapter 4(1).pptx
Chapter 4(1).pptxChapter 4(1).pptx
Chapter 4(1).pptx
 
statistics-for-analytical-chemistry (1).ppt
statistics-for-analytical-chemistry (1).pptstatistics-for-analytical-chemistry (1).ppt
statistics-for-analytical-chemistry (1).ppt
 
Data analysis
Data analysisData analysis
Data analysis
 
Chapter 1(5)Measurement and Error
Chapter 1(5)Measurement andErrorChapter 1(5)Measurement andError
Chapter 1(5)Measurement and Error
 
12 13 h2_measurement_ppt
12 13 h2_measurement_ppt12 13 h2_measurement_ppt
12 13 h2_measurement_ppt
 
Accuracy, Precision Measurement
Accuracy, Precision Measurement Accuracy, Precision Measurement
Accuracy, Precision Measurement
 
Presentation4.ppt
Presentation4.pptPresentation4.ppt
Presentation4.ppt
 
1.2 - Uncertainties and errors.pptx
1.2 - Uncertainties and errors.pptx1.2 - Uncertainties and errors.pptx
1.2 - Uncertainties and errors.pptx
 
Uncertainties.pptx
Uncertainties.pptxUncertainties.pptx
Uncertainties.pptx
 
Analytical Chemistry.ppsx
Analytical Chemistry.ppsxAnalytical Chemistry.ppsx
Analytical Chemistry.ppsx
 
Definitions related to measurements
Definitions related to measurementsDefinitions related to measurements
Definitions related to measurements
 
Error analysis
Error analysisError analysis
Error analysis
 
Methods of minimizing errors
Methods of minimizing errorsMethods of minimizing errors
Methods of minimizing errors
 
Errors-Analysis-MNN-RN.pptx
Errors-Analysis-MNN-RN.pptxErrors-Analysis-MNN-RN.pptx
Errors-Analysis-MNN-RN.pptx
 
DSE-2, ANALYTICAL METHODS.pptx
DSE-2, ANALYTICAL METHODS.pptxDSE-2, ANALYTICAL METHODS.pptx
DSE-2, ANALYTICAL METHODS.pptx
 
Errors.pptx
Errors.pptxErrors.pptx
Errors.pptx
 
1625941932480.pptx
1625941932480.pptx1625941932480.pptx
1625941932480.pptx
 
Ch3_Statistical Analysis and Random Error Estimation.pdf
Ch3_Statistical Analysis and Random Error Estimation.pdfCh3_Statistical Analysis and Random Error Estimation.pdf
Ch3_Statistical Analysis and Random Error Estimation.pdf
 
Validity andreliability
Validity andreliabilityValidity andreliability
Validity andreliability
 

Recently uploaded

定制英国白金汉大学毕业证(UCB毕业证书) 成绩单原版一比一
定制英国白金汉大学毕业证(UCB毕业证书)																			成绩单原版一比一定制英国白金汉大学毕业证(UCB毕业证书)																			成绩单原版一比一
定制英国白金汉大学毕业证(UCB毕业证书) 成绩单原版一比一ffjhghh
 
Kantar AI Summit- Under Embargo till Wednesday, 24th April 2024, 4 PM, IST.pdf
Kantar AI Summit- Under Embargo till Wednesday, 24th April 2024, 4 PM, IST.pdfKantar AI Summit- Under Embargo till Wednesday, 24th April 2024, 4 PM, IST.pdf
Kantar AI Summit- Under Embargo till Wednesday, 24th April 2024, 4 PM, IST.pdfSocial Samosa
 
{Pooja: 9892124323 } Call Girl in Mumbai | Jas Kaur Rate 4500 Free Hotel Del...
{Pooja:  9892124323 } Call Girl in Mumbai | Jas Kaur Rate 4500 Free Hotel Del...{Pooja:  9892124323 } Call Girl in Mumbai | Jas Kaur Rate 4500 Free Hotel Del...
{Pooja: 9892124323 } Call Girl in Mumbai | Jas Kaur Rate 4500 Free Hotel Del...Pooja Nehwal
 
Delhi Call Girls CP 9711199171 ☎✔👌✔ Whatsapp Hard And Sexy Vip Call
Delhi Call Girls CP 9711199171 ☎✔👌✔ Whatsapp Hard And Sexy Vip CallDelhi Call Girls CP 9711199171 ☎✔👌✔ Whatsapp Hard And Sexy Vip Call
Delhi Call Girls CP 9711199171 ☎✔👌✔ Whatsapp Hard And Sexy Vip Callshivangimorya083
 
VIP High Profile Call Girls Amravati Aarushi 8250192130 Independent Escort Se...
VIP High Profile Call Girls Amravati Aarushi 8250192130 Independent Escort Se...VIP High Profile Call Girls Amravati Aarushi 8250192130 Independent Escort Se...
VIP High Profile Call Girls Amravati Aarushi 8250192130 Independent Escort Se...Suhani Kapoor
 
Log Analysis using OSSEC sasoasasasas.pptx
Log Analysis using OSSEC sasoasasasas.pptxLog Analysis using OSSEC sasoasasasas.pptx
Log Analysis using OSSEC sasoasasasas.pptxJohnnyPlasten
 
Schema on read is obsolete. Welcome metaprogramming..pdf
Schema on read is obsolete. Welcome metaprogramming..pdfSchema on read is obsolete. Welcome metaprogramming..pdf
Schema on read is obsolete. Welcome metaprogramming..pdfLars Albertsson
 
Brighton SEO | April 2024 | Data Storytelling
Brighton SEO | April 2024 | Data StorytellingBrighton SEO | April 2024 | Data Storytelling
Brighton SEO | April 2024 | Data StorytellingNeil Barnes
 
VIP High Class Call Girls Bikaner Anushka 8250192130 Independent Escort Servi...
VIP High Class Call Girls Bikaner Anushka 8250192130 Independent Escort Servi...VIP High Class Call Girls Bikaner Anushka 8250192130 Independent Escort Servi...
VIP High Class Call Girls Bikaner Anushka 8250192130 Independent Escort Servi...Suhani Kapoor
 
PKS-TGC-1084-630 - Stage 1 Proposal.pptx
PKS-TGC-1084-630 - Stage 1 Proposal.pptxPKS-TGC-1084-630 - Stage 1 Proposal.pptx
PKS-TGC-1084-630 - Stage 1 Proposal.pptxPramod Kumar Srivastava
 
Indian Call Girls in Abu Dhabi O5286O24O8 Call Girls in Abu Dhabi By Independ...
Indian Call Girls in Abu Dhabi O5286O24O8 Call Girls in Abu Dhabi By Independ...Indian Call Girls in Abu Dhabi O5286O24O8 Call Girls in Abu Dhabi By Independ...
Indian Call Girls in Abu Dhabi O5286O24O8 Call Girls in Abu Dhabi By Independ...dajasot375
 
04242024_CCC TUG_Joins and Relationships
04242024_CCC TUG_Joins and Relationships04242024_CCC TUG_Joins and Relationships
04242024_CCC TUG_Joins and Relationshipsccctableauusergroup
 
(PARI) Call Girls Wanowrie ( 7001035870 ) HI-Fi Pune Escorts Service
(PARI) Call Girls Wanowrie ( 7001035870 ) HI-Fi Pune Escorts Service(PARI) Call Girls Wanowrie ( 7001035870 ) HI-Fi Pune Escorts Service
(PARI) Call Girls Wanowrie ( 7001035870 ) HI-Fi Pune Escorts Serviceranjana rawat
 
Low Rate Call Girls Bhilai Anika 8250192130 Independent Escort Service Bhilai
Low Rate Call Girls Bhilai Anika 8250192130 Independent Escort Service BhilaiLow Rate Call Girls Bhilai Anika 8250192130 Independent Escort Service Bhilai
Low Rate Call Girls Bhilai Anika 8250192130 Independent Escort Service BhilaiSuhani Kapoor
 
Best VIP Call Girls Noida Sector 39 Call Me: 8448380779
Best VIP Call Girls Noida Sector 39 Call Me: 8448380779Best VIP Call Girls Noida Sector 39 Call Me: 8448380779
Best VIP Call Girls Noida Sector 39 Call Me: 8448380779Delhi Call girls
 
代办国外大学文凭《原版美国UCLA文凭证书》加州大学洛杉矶分校毕业证制作成绩单修改
代办国外大学文凭《原版美国UCLA文凭证书》加州大学洛杉矶分校毕业证制作成绩单修改代办国外大学文凭《原版美国UCLA文凭证书》加州大学洛杉矶分校毕业证制作成绩单修改
代办国外大学文凭《原版美国UCLA文凭证书》加州大学洛杉矶分校毕业证制作成绩单修改atducpo
 
Building on a FAIRly Strong Foundation to Connect Academic Research to Transl...
Building on a FAIRly Strong Foundation to Connect Academic Research to Transl...Building on a FAIRly Strong Foundation to Connect Academic Research to Transl...
Building on a FAIRly Strong Foundation to Connect Academic Research to Transl...Jack DiGiovanna
 
dokumen.tips_chapter-4-transient-heat-conduction-mehmet-kanoglu.ppt
dokumen.tips_chapter-4-transient-heat-conduction-mehmet-kanoglu.pptdokumen.tips_chapter-4-transient-heat-conduction-mehmet-kanoglu.ppt
dokumen.tips_chapter-4-transient-heat-conduction-mehmet-kanoglu.pptSonatrach
 

Recently uploaded (20)

定制英国白金汉大学毕业证(UCB毕业证书) 成绩单原版一比一
定制英国白金汉大学毕业证(UCB毕业证书)																			成绩单原版一比一定制英国白金汉大学毕业证(UCB毕业证书)																			成绩单原版一比一
定制英国白金汉大学毕业证(UCB毕业证书) 成绩单原版一比一
 
Kantar AI Summit- Under Embargo till Wednesday, 24th April 2024, 4 PM, IST.pdf
Kantar AI Summit- Under Embargo till Wednesday, 24th April 2024, 4 PM, IST.pdfKantar AI Summit- Under Embargo till Wednesday, 24th April 2024, 4 PM, IST.pdf
Kantar AI Summit- Under Embargo till Wednesday, 24th April 2024, 4 PM, IST.pdf
 
{Pooja: 9892124323 } Call Girl in Mumbai | Jas Kaur Rate 4500 Free Hotel Del...
{Pooja:  9892124323 } Call Girl in Mumbai | Jas Kaur Rate 4500 Free Hotel Del...{Pooja:  9892124323 } Call Girl in Mumbai | Jas Kaur Rate 4500 Free Hotel Del...
{Pooja: 9892124323 } Call Girl in Mumbai | Jas Kaur Rate 4500 Free Hotel Del...
 
Delhi Call Girls CP 9711199171 ☎✔👌✔ Whatsapp Hard And Sexy Vip Call
Delhi Call Girls CP 9711199171 ☎✔👌✔ Whatsapp Hard And Sexy Vip CallDelhi Call Girls CP 9711199171 ☎✔👌✔ Whatsapp Hard And Sexy Vip Call
Delhi Call Girls CP 9711199171 ☎✔👌✔ Whatsapp Hard And Sexy Vip Call
 
VIP High Profile Call Girls Amravati Aarushi 8250192130 Independent Escort Se...
VIP High Profile Call Girls Amravati Aarushi 8250192130 Independent Escort Se...VIP High Profile Call Girls Amravati Aarushi 8250192130 Independent Escort Se...
VIP High Profile Call Girls Amravati Aarushi 8250192130 Independent Escort Se...
 
VIP Call Girls Service Charbagh { Lucknow Call Girls Service 9548273370 } Boo...
VIP Call Girls Service Charbagh { Lucknow Call Girls Service 9548273370 } Boo...VIP Call Girls Service Charbagh { Lucknow Call Girls Service 9548273370 } Boo...
VIP Call Girls Service Charbagh { Lucknow Call Girls Service 9548273370 } Boo...
 
Log Analysis using OSSEC sasoasasasas.pptx
Log Analysis using OSSEC sasoasasasas.pptxLog Analysis using OSSEC sasoasasasas.pptx
Log Analysis using OSSEC sasoasasasas.pptx
 
Schema on read is obsolete. Welcome metaprogramming..pdf
Schema on read is obsolete. Welcome metaprogramming..pdfSchema on read is obsolete. Welcome metaprogramming..pdf
Schema on read is obsolete. Welcome metaprogramming..pdf
 
E-Commerce Order PredictionShraddha Kamble.pptx
E-Commerce Order PredictionShraddha Kamble.pptxE-Commerce Order PredictionShraddha Kamble.pptx
E-Commerce Order PredictionShraddha Kamble.pptx
 
Brighton SEO | April 2024 | Data Storytelling
Brighton SEO | April 2024 | Data StorytellingBrighton SEO | April 2024 | Data Storytelling
Brighton SEO | April 2024 | Data Storytelling
 
VIP High Class Call Girls Bikaner Anushka 8250192130 Independent Escort Servi...
VIP High Class Call Girls Bikaner Anushka 8250192130 Independent Escort Servi...VIP High Class Call Girls Bikaner Anushka 8250192130 Independent Escort Servi...
VIP High Class Call Girls Bikaner Anushka 8250192130 Independent Escort Servi...
 
PKS-TGC-1084-630 - Stage 1 Proposal.pptx
PKS-TGC-1084-630 - Stage 1 Proposal.pptxPKS-TGC-1084-630 - Stage 1 Proposal.pptx
PKS-TGC-1084-630 - Stage 1 Proposal.pptx
 
Indian Call Girls in Abu Dhabi O5286O24O8 Call Girls in Abu Dhabi By Independ...
Indian Call Girls in Abu Dhabi O5286O24O8 Call Girls in Abu Dhabi By Independ...Indian Call Girls in Abu Dhabi O5286O24O8 Call Girls in Abu Dhabi By Independ...
Indian Call Girls in Abu Dhabi O5286O24O8 Call Girls in Abu Dhabi By Independ...
 
04242024_CCC TUG_Joins and Relationships
04242024_CCC TUG_Joins and Relationships04242024_CCC TUG_Joins and Relationships
04242024_CCC TUG_Joins and Relationships
 
(PARI) Call Girls Wanowrie ( 7001035870 ) HI-Fi Pune Escorts Service
(PARI) Call Girls Wanowrie ( 7001035870 ) HI-Fi Pune Escorts Service(PARI) Call Girls Wanowrie ( 7001035870 ) HI-Fi Pune Escorts Service
(PARI) Call Girls Wanowrie ( 7001035870 ) HI-Fi Pune Escorts Service
 
Low Rate Call Girls Bhilai Anika 8250192130 Independent Escort Service Bhilai
Low Rate Call Girls Bhilai Anika 8250192130 Independent Escort Service BhilaiLow Rate Call Girls Bhilai Anika 8250192130 Independent Escort Service Bhilai
Low Rate Call Girls Bhilai Anika 8250192130 Independent Escort Service Bhilai
 
Best VIP Call Girls Noida Sector 39 Call Me: 8448380779
Best VIP Call Girls Noida Sector 39 Call Me: 8448380779Best VIP Call Girls Noida Sector 39 Call Me: 8448380779
Best VIP Call Girls Noida Sector 39 Call Me: 8448380779
 
代办国外大学文凭《原版美国UCLA文凭证书》加州大学洛杉矶分校毕业证制作成绩单修改
代办国外大学文凭《原版美国UCLA文凭证书》加州大学洛杉矶分校毕业证制作成绩单修改代办国外大学文凭《原版美国UCLA文凭证书》加州大学洛杉矶分校毕业证制作成绩单修改
代办国外大学文凭《原版美国UCLA文凭证书》加州大学洛杉矶分校毕业证制作成绩单修改
 
Building on a FAIRly Strong Foundation to Connect Academic Research to Transl...
Building on a FAIRly Strong Foundation to Connect Academic Research to Transl...Building on a FAIRly Strong Foundation to Connect Academic Research to Transl...
Building on a FAIRly Strong Foundation to Connect Academic Research to Transl...
 
dokumen.tips_chapter-4-transient-heat-conduction-mehmet-kanoglu.ppt
dokumen.tips_chapter-4-transient-heat-conduction-mehmet-kanoglu.pptdokumen.tips_chapter-4-transient-heat-conduction-mehmet-kanoglu.ppt
dokumen.tips_chapter-4-transient-heat-conduction-mehmet-kanoglu.ppt
 

Errors in Chemistry ANALYTICAL CHEMISTRY (Errors in Chemical Analysis).pptx

  • 2. Mean value A mean value is obtained by dividing the sum of a set of replicate measurements by the number of individual results in the set. For example, if a titration is repeated four times and the titre values are 10.1, 9.9, 10.0 and 10.2ml Mean = 10.1 + 9.9 + 10 + 10.2 4 = 40.2 4 = 10.05 This mean value is also called arithmetic mean or average.
  • 3. Mean value A mean value is obtained by dividing the sum of a set of replicate measurements by the number of individual results in the set. For example, if a titration is repeated four times and the titre values are 10.1, 9.9, 10.0 and 10.2ml Mean = 10.1 + 9.9 + 10 + 10.2 4 = 40.2 4 = 10.05 This mean value is also called arithmetic mean or average.
  • 4. The median This is a value about which all other values in a set are equally distributed. Half of the values are greater and the other half smaller numerically, compared to the median. For example: If we have a set of values like 1.1, 1.2, 1.3, 1.4 and 1.5 the median value is 1.3. When a set of data has an even number of values, then the median is the average of the middle pair.
  • 5. The median This is a value about which all other values in a set are equally distributed. Half of the values are greater and the other half smaller numerically, compared to the median. For example: If we have a set of values like 1.1, 1.2, 1.3, 1.4 and 1.5 the median value is 1.3. When a set of data has an even number of values, then the median is the average of the middle pair.
  • 6.
  • 7.
  • 8.
  • 9. Precision • Precision is defined as the agreement between the numerical value of two or more measurements of the same object that have been made in an identical manner. Thus, a value is said to be precise, when there is agreement between a set of results for the same quantity. • Good precision does not guarantee accuracy
  • 10. Methods of expressing precision _ • Precision can be expressed in an absolute method. In the absolute way the deviation from the mean │xi ‒X│ expresses precision without considering sign S.No Sample of an organic compound % of carbon Deviation from mean _ │xi ‒X │ 1 X1 38.42 0.20 2 X2 38.02 0.20 3 X3 38.22 0.00 _ X = 38.22 0.40 = 0.133 3 (Average deviation)
  • 11. Methods of expressing precision _ • Precision can be expressed in an absolute method. In the absolute way the deviation from the mean │xi ‒X│ expresses precision without considering sign S.No Sample of an organic compound % of carbon Deviation from mean _ │xi ‒X │ 1 X1 38.42 0.20 2 X2 38.02 0.20 3 X3 38.22 0.00 _ X = 38.22 0.40 = 0.133 3 (Average deviation)
  • 12. Methods of expressing precision _ • Precision can be expressed in an absolute method. In the absolute way the deviation from the mean │xi ‒X│ expresses precision without considering sign S.No Sample of an organic compound % of carbon Deviation from mean _ │xi ‒X │ 1 X1 38.42 0.20 2 X2 38.02 0.20 3 X3 38.22 0.00 _ X = 38.22 0.40 = 0.133 3 (Average deviation)
  • 13. Methods of expressing precision _ • Precision can be expressed in an absolute method. In the absolute way the deviation from the mean │xi ‒X│ expresses precision without considering sign S.No Sample of an organic compound % of carbon Deviation from mean _ │xi ‒X │ 1 X1 38.42 0.20 2 X2 38.02 0.20 3 X3 38.22 0.00 _ X = 38.22 0.40 = 0.133 3 (Average deviation)
  • 14. Accura cy • Accuracyrepresents the nearness to a measurement to its expected value. Any difference between the measured value and the expected value is expressed as error. • For example: The dissociation constant for acetic acid is 1.75×10‒5 at 25 °C. In an experiment, if a student arrives at exactly this value, his value is said to be accurate.
  • 15.
  • 16.
  • 17. Accuracy versus precision 1.Accuracy is the closeness of a measurement to the true (or accepted) value (μ or xt). Accuracy is expressed by the absolute error or the relative error:
  • 18. Absolute error • The term accuracy is denoted in terms of absolute error E, E is the difference between the observed value (Xi) and the expected value (Xt). E = │ Xi – Xt│ • If a student obtains a value of 1.69×10‒5 for the dissociation constant of acetic acid at 25°C, the absolute error in this determination is E = │1.69 ×10‒5 –1.75×10‒5 │ = │0.06 ×10‒5 │
  • 19. Absolute error • The term accuracy is denoted in terms of absolute error E, E is the difference between the observed value (Xi) and the expected value (Xt). E = │ Xi – Xt│ • If a student obtains a value of 1.69×10‒5 for the dissociation constant of acetic acid at 25°C, the absolute error in this determination is E = │1.69 ×10‒5 –1.75×10‒5 │ = │0.06 ×10‒5 │
  • 20. Relative error • Sometimes the term relative error is used to express the uncertainty in data. The relative error denotes the percentage of error compared to the expected value. For the dissociation constant value reported. Relative error = 0.06 ×10‒5 × 100 1.75×10‒5 = 3.4%
  • 21. Relative error • Sometimes the term relative error is used to express the uncertainty in data. The relative error denotes the percentage of error compared to the expected value. For the dissociation constant value reported. Relative error = 0.06 ×10‒5 × 100 1.75×10‒5 = 3.4%
  • 22. Proble m: • The actual length of a field is 500 feet. instrument shows the length to be 508 A measuri ng feet. Find: a.) the absolute error in the measured length of the field. b.) the relative error in the measured length of the field. Solution: • (a)The absolute error in the length of the field is 8 feet. E =│ Xi – Xt│ =508-500 = 8 feet. • b.) The relative error in the length of the field is Relative error = 8 × 100 500 = 1.6%
  • 23. Proble m: • The actual length of a field is 500 feet. instrument shows the length to be 508 A measuri ng feet. Find: a.) the absolute error in the measured length of the field. b.) the relative error in the measured length of the field. Solution: • (a)The absolute error in the length of the field is 8 feet. E =│ Xi – Xt│ =508-500 = 8 feet. • b.) The relative error in the length of the field is Relative error = 8 × 100 500 = 1.6%
  • 24. Proble m: • The actual length of a field is 500 feet. instrument shows the length to be 508 A measuri ng feet. Find: a.) the absolute error in the measured length of the field. b.) the relative error in the measured length of the field. Solution: • (a)The absolute error in the length of the field is 8 feet. E =│ Xi – Xt│ =508-500 = 8 feet. • b.) The relative error in the length of the field is Relative error = 8 × 100 500 = 1.6%
  • 25. Error s two main types • Determinate errors • Indeterminate errors
  • 26. Determinate errors: These errors are determinable and are avoided if care is taken. Also known as Systemic errors. •predictable •correctable (using a ref.) •in the same direction ( + or -)
  • 27. Sources of Systematic (Determinate) Errors •Instrumental errors •Operative / Personal errors •Method errors
  • 28. Instrumental error • Instrumental errors are introduced due to the use of defective instruments. • For example an error in volumetric analysis will be introduced, when a 20ml pipette, which actually measures 20.1ml, is used. • Sometimes an instrument error may arise from the environmental factors on the instrument. • For example a pipette calibrated at 20°C, if used at 30°C will introduce error in volume. • Instrumental errors may largely be eliminated by
  • 29. Operative errors • These errors are also called personal errors and are introduced because of variation of personal judgements. • For example due to colour blindness a person may arrive at wrong results in a volumetric or colorimetric analysis. • Using incorrect mathematical equations an d caus e committingarithmetic mistakeswill also operative errors.
  • 30. Detection of Systematic Instrument and Personal Errors • analysis of standard samples • independent analysis • blank determinations • variation in sample size
  • 31. Method errors • These errors are caused by adopting defective experimental methods. • For example in volumetric analysis the use of an improper indicator leading to wrong results is an example for methodic error. • Proper understanding of the theoretical background of the experiments is a necessity for avoiding methodic errors.
  • 32. Method Errors •Instability of the reagent •Slowness of some reactions •Loss of solution by evaporation •Interferences (pH measurements at high/low pHs) •Contaminants
  • 33. Indeterminate errors • These errors are also called accidental errors. Indeterminate errors arise from uncertainties in a measurement that are unknown and which cannot be controlled by the experimentalist. • For example: When pipetting out a liquid, the speed of draining, the angle of holding the pipette, the portion at which the pipette is held, etc, would introduce indeterminate error in the volume of the liquid pipette out.
  • 34. Random (Indeterminate) Errors •Affect precision but not accuracy •Follows a Gaussian or normal distribution •Most values fall close to the mean, with values farther away becoming less likely. The width of the distribution tells us something about the precision of our measurement.
  • 35. Random Error • always present • unpredictable • non-correctable (equal probability of being + or -) • can be reduced by averaging multiple measurements • can be treated mathematically (with statistical methods)
  • 36. Gross Error—(Human) silly mistakes: •occur only occasionally •often large (+ or -) •undetected mistakes during the experiment •can be verify by “Q-test” Examples: 0.1000 recorded as 0.0100 1.00 g as 1.00 mg Wrong connection of electrode wires
  • 37.
  • 38. Normal error Curve • Thenormalerror curvewasfirst studied by Carl FriedrichGaussas a curve for the the distributionof errors. He found that distribution of errors could be closely approximated by a curve called the normal curve of errors.
  • 39. Gaussian Distribution Two parameters define a Gaussian distribution for a population, the population mean, μ, and the population standard deviation, σ.
  • 40. General properties of a normal error curve (a normalized Gaussian distribution of errors) a.The mean (or average) is the central point of maximum frequency (i.e., the top of the bell curve). b.The curve is symmetric on both sides of the mean (i.e., 50% per side). c.There is an exponential decrease in resulting frequency as you move away from the mean. d.If time and expense permit, you need to perform more than 20 replicates when possible to be sure that the sample mean and standard deviation are sufficiently close to the population mean and standard deviation.
  • 41. Normal error Curve • This normal distribution curve is a useful one to measure the extent of indeterminate error. It is given by  is the standard deviation x = value of the continuous random variable. µ = mean of the normal random variable π =constant = 3.14
  • 42. Normal error Curve • In normal error curve, the frequency is plotted against mean deviation. • When the frequency is maximum the error is nil. • When the frequency decreases, the magnitude of the error increases
  • 43. Normal error Curve • When  is very large, the curve obtained is bell shaped. When  is very small, then a sharp curve is obtained. • When frequency increases, the  decrease → sharp curve → nil error. • When frequency decreases the  increase → bell shaped curve → increases wil l wil l erro r
  • 44. Normal error Curve • The normal distributions are extremely important in statistics and are often used in science for real valued random variables whose distributions are not known.
  • 45. Significant figure • Data have to be reported with care keeping in mind reliability about the number of figures used. • For example, when reporting a value as many as six decimal numbers can be obtained, when one uses a calculator. • However, reporting all these decimal numbers is meaningless because, as is generally true, there may be uncertainty about the first decimal itself. • Therefore, experimental data should be rounded off.
  • 46. Significant Figures Rules for Counting Significant Figures 2. Zeros a. Leading zeros - never count 0.0025 2 significant figures b. Captive zeros - always count 1.008 4 significant figures c. Trailing zeros - count only if the number is written with a decimal point 100 1 significant figure 100. 3 significant figures 120.0 4 significant figures
  • 47. Significant figure • A zero is not a significant figure, when used to locate a decimal. However, it is significant when it occurs at the end. • For example 0.00405 has three significant figures, the two zeros before the 4 being used to imply only the magnitude, but 0.04050 has four significant figures, the zero beyond the 5 being significant.
  • 48. Significant figure • The number of significant figures in a given number is found by counting the number figures from the left to right in the number beginning with the first non-zero digit and continuing until reaching the digit that contains the uncertainty. Each of the following has three significant figures. 646 0.317 9.22 0.00149 20.2
  • 49. • How many significant figures are in: 1. 12.548 2. 0.00335 3. 504.70 4. 4000 5. 0.10200
  • 50. • How many significant figures are in: 1. 12.548 - 5 2. 0.00335 3. 504.70 4. 4000 5. 0.10200
  • 51. • How many significant figures are in: 1. 12.548 - 5 2. 0.00335 - 3 3. 504.70 4. 4000 5. 0.10200
  • 52. • How many significant figures are in: 1. 12.548 - 5 2. 0.00335 - 3 3. 504.70 - 5 4. 4000 5. 0.10200
  • 53. • How many significant figures are in: 1. 12.548 - 5 2. 0.00335 - 3 3. 504.70 - 5 4. 4000 - 1 5. 0.10200 - 5
  • 57. Write the sum of 1.586 + 2.31 with the correct number of significant figures. 1.586 + 2.31 = 3.896 3.896 = 3.90 Write the difference of 0.954 - 0.3109 with the correct number of significant figures. 0.954 - 0.3109 = 0.6431 0.6431 = 0.643
  • 58. Write the sum of 1.586 + 2.31 with the correct number of significant figures. 1.586 + 2.31 = 3.896 3.896 = 3.90 Write the difference of 0.954 - 0.3109 with the correct number of significant figures. 0.954 - 0.3109 = 0.6431 0.6431 = 0.643
  • 59. Write the sum of 1.586 + 2.31 with the correct number of significant figures. 1.586 + 2.31 = 3.896 3.896 = 3.90 Write the difference of 0.954 - 0.3109 with the correct number of significant figures. 0.954 - 0.3109 = 0.6431 0.6431 = 0.643
  • 60.
  • 61.
  • 62.
  • 63.
  • 64.
  • 65. Write the product of 2.10 × 0.5896 with the correct number of significant figures 2.10 × 0.5896 = 1.23816 1.23816 = 1.24 Write the quotient of 16.15 / 2.7 with the correct number of significant figures. 16.15 / 2.7 = 5.98148148 5.98148148 = 6.0
  • 66. Write the product of 2.10 × 0.5896 with the correct number of significant figures 2.10 × 0.5896 = 1.23816 1.23816 = 1.24 Write the quotient of 16.15 / 2.7 with the correct number of significant figures. 16.15 / 2.7 = 5.98148148 5.98148148 = 6.0
  • 67. Write the product of 2.10 × 0.5896 with the correct number of significant figures 2.10 × 0.5896 = 1.23816 1.23816 = 1.24 Write the quotient of 16.15 / 2.7 with the correct number of significant figures. 16.15 / 2.7 = 5.98148148 5.98148148 = 6.0
  • 68. Rules for Rounding Off Numbers •When the number to be dropped is less than 5 the preceding number is not changed. •When the number to be dropped is 5 or larger, the preceding number is increased by one unit. •Round the following number to 3 sig figs: 3.34966 x 104 =3.35 x 10⁴
  • 69. Rules for Rounding Off Numbers •When the number to be dropped is less than 5 the preceding number is not changed. •When the number to be dropped is 5 or larger, the preceding number is increased by one unit. •Round the following number to 3 sig figs: 3.34966 x 104 =3.35 x 10⁴
  • 70. Thank you and have a good day!