Downloaded 121 times
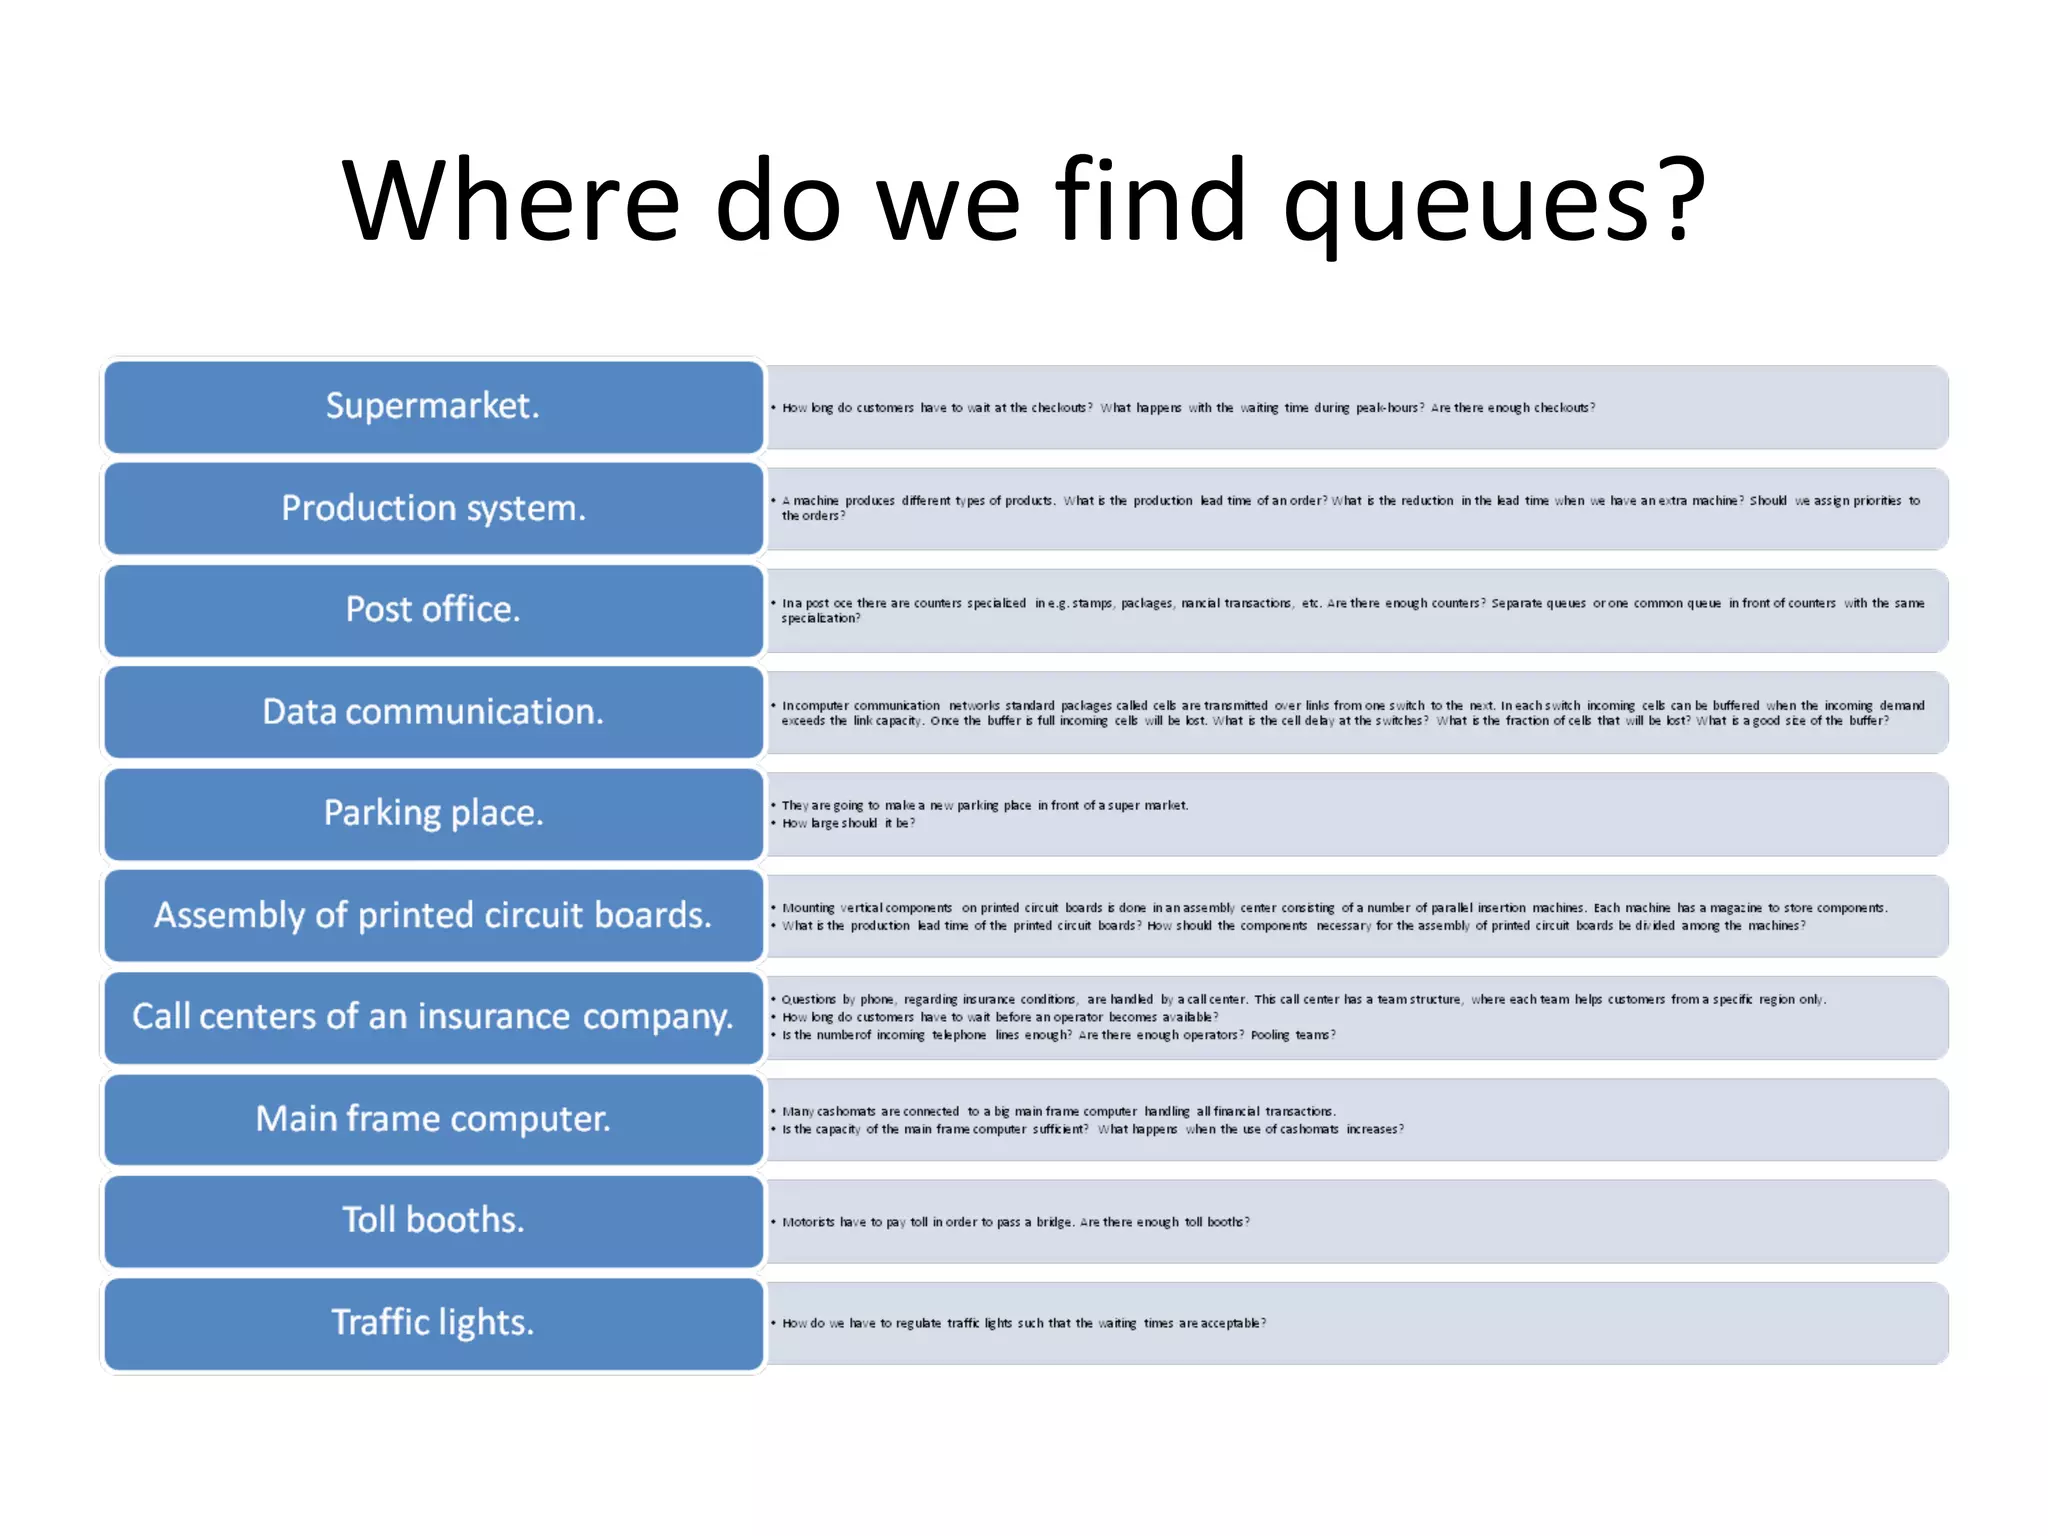
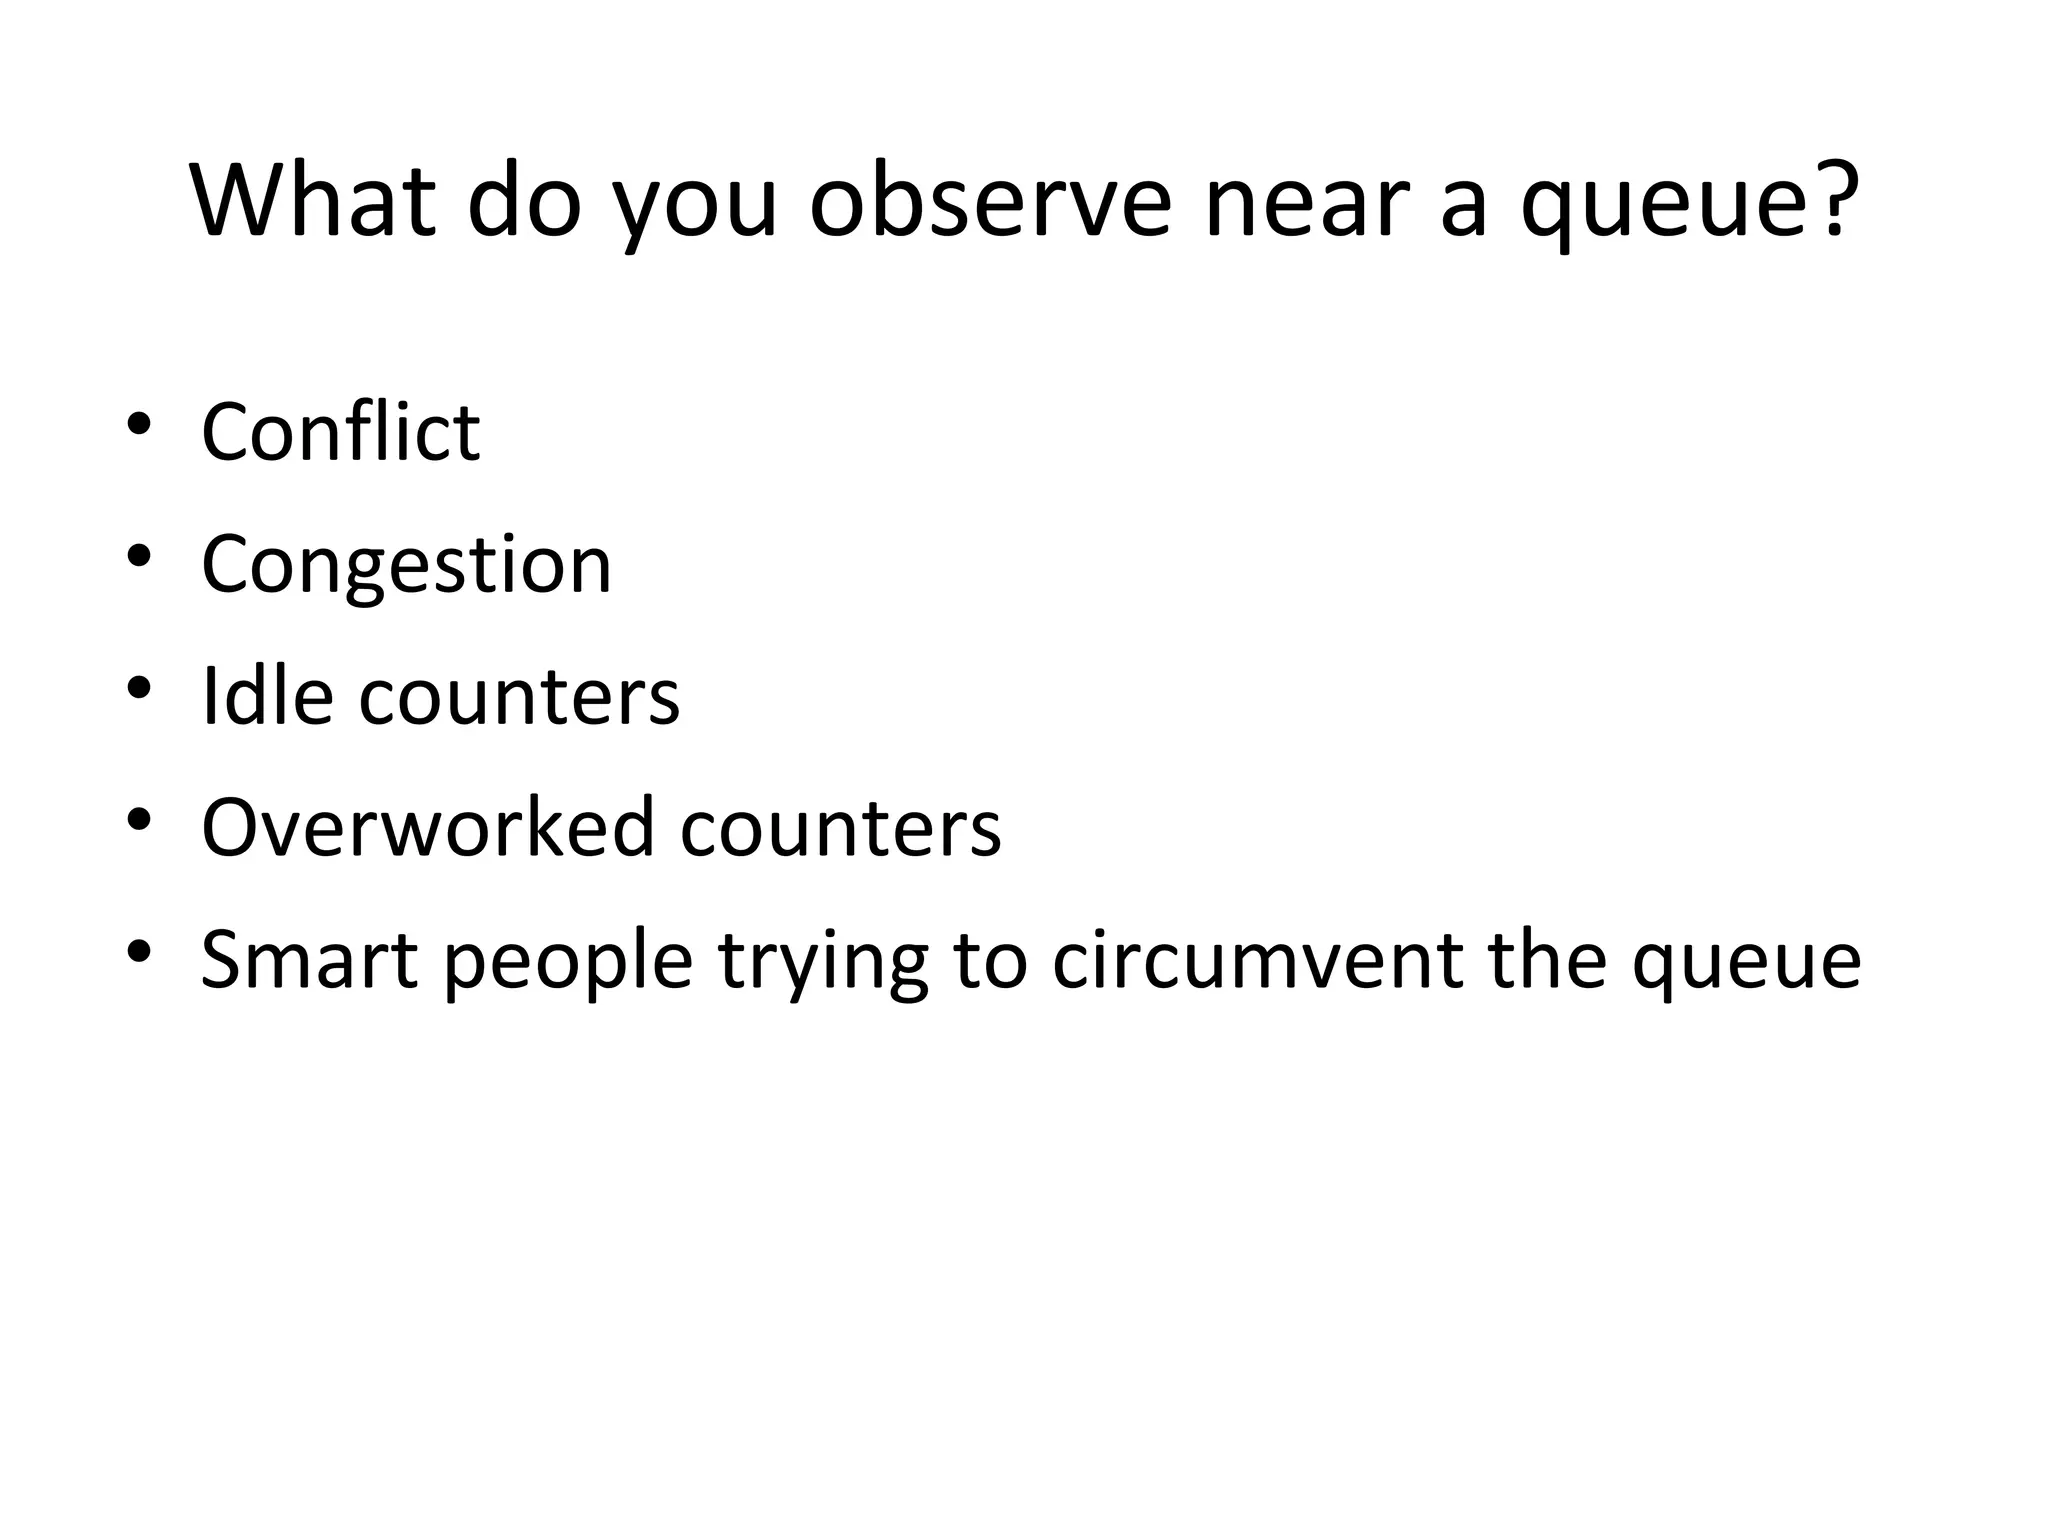
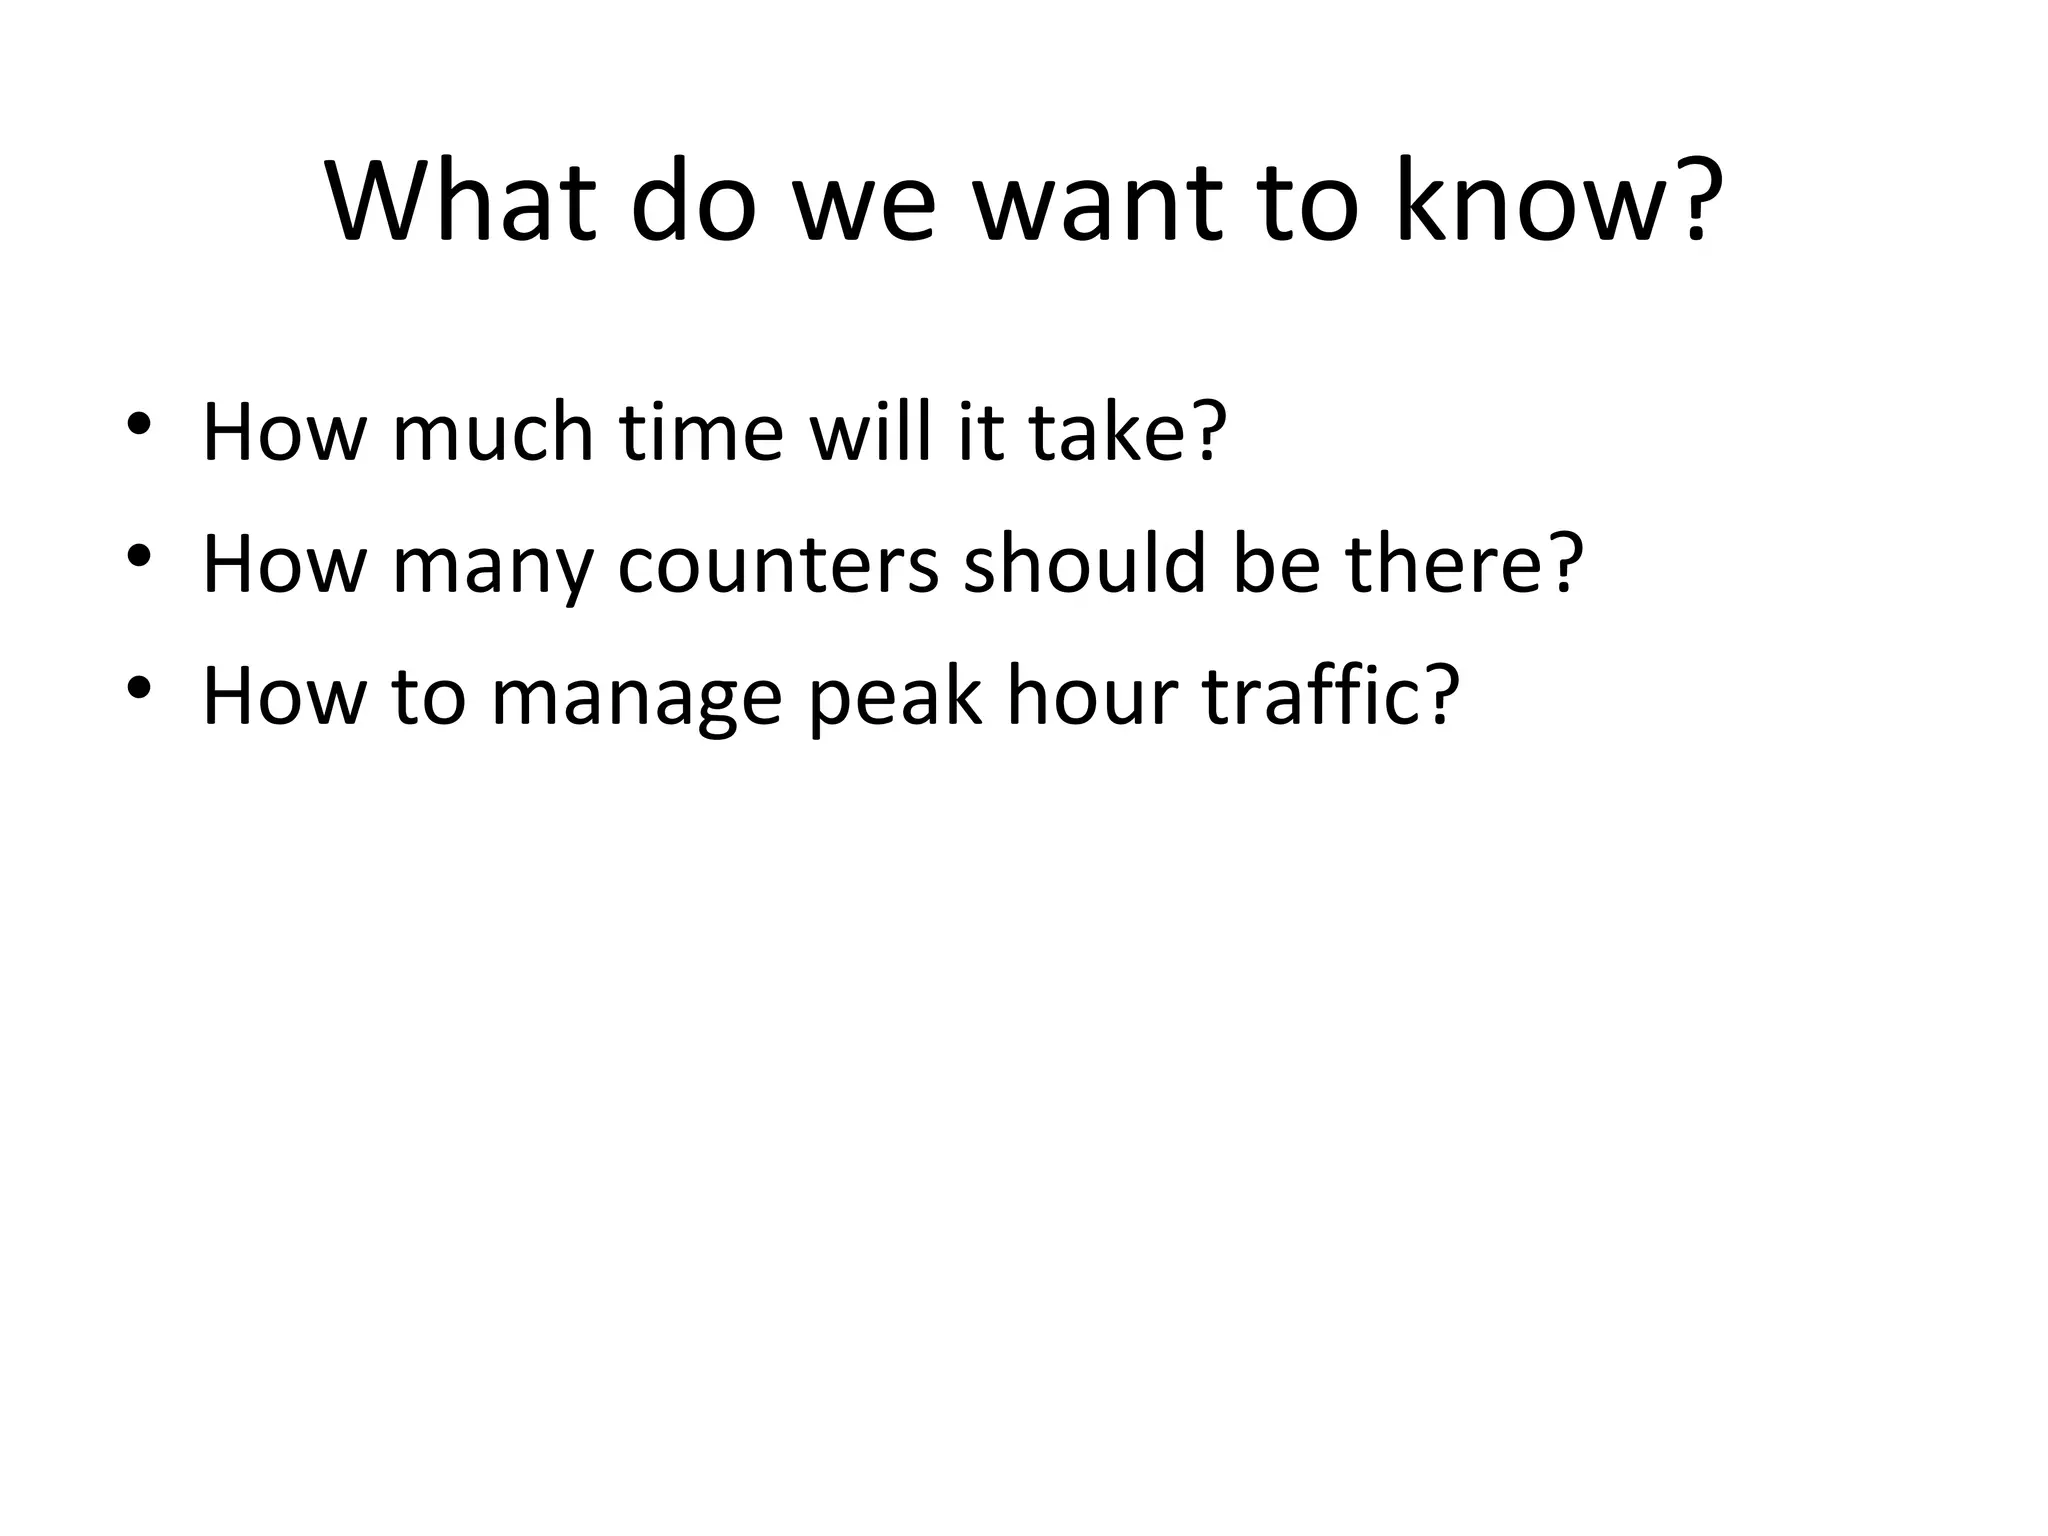
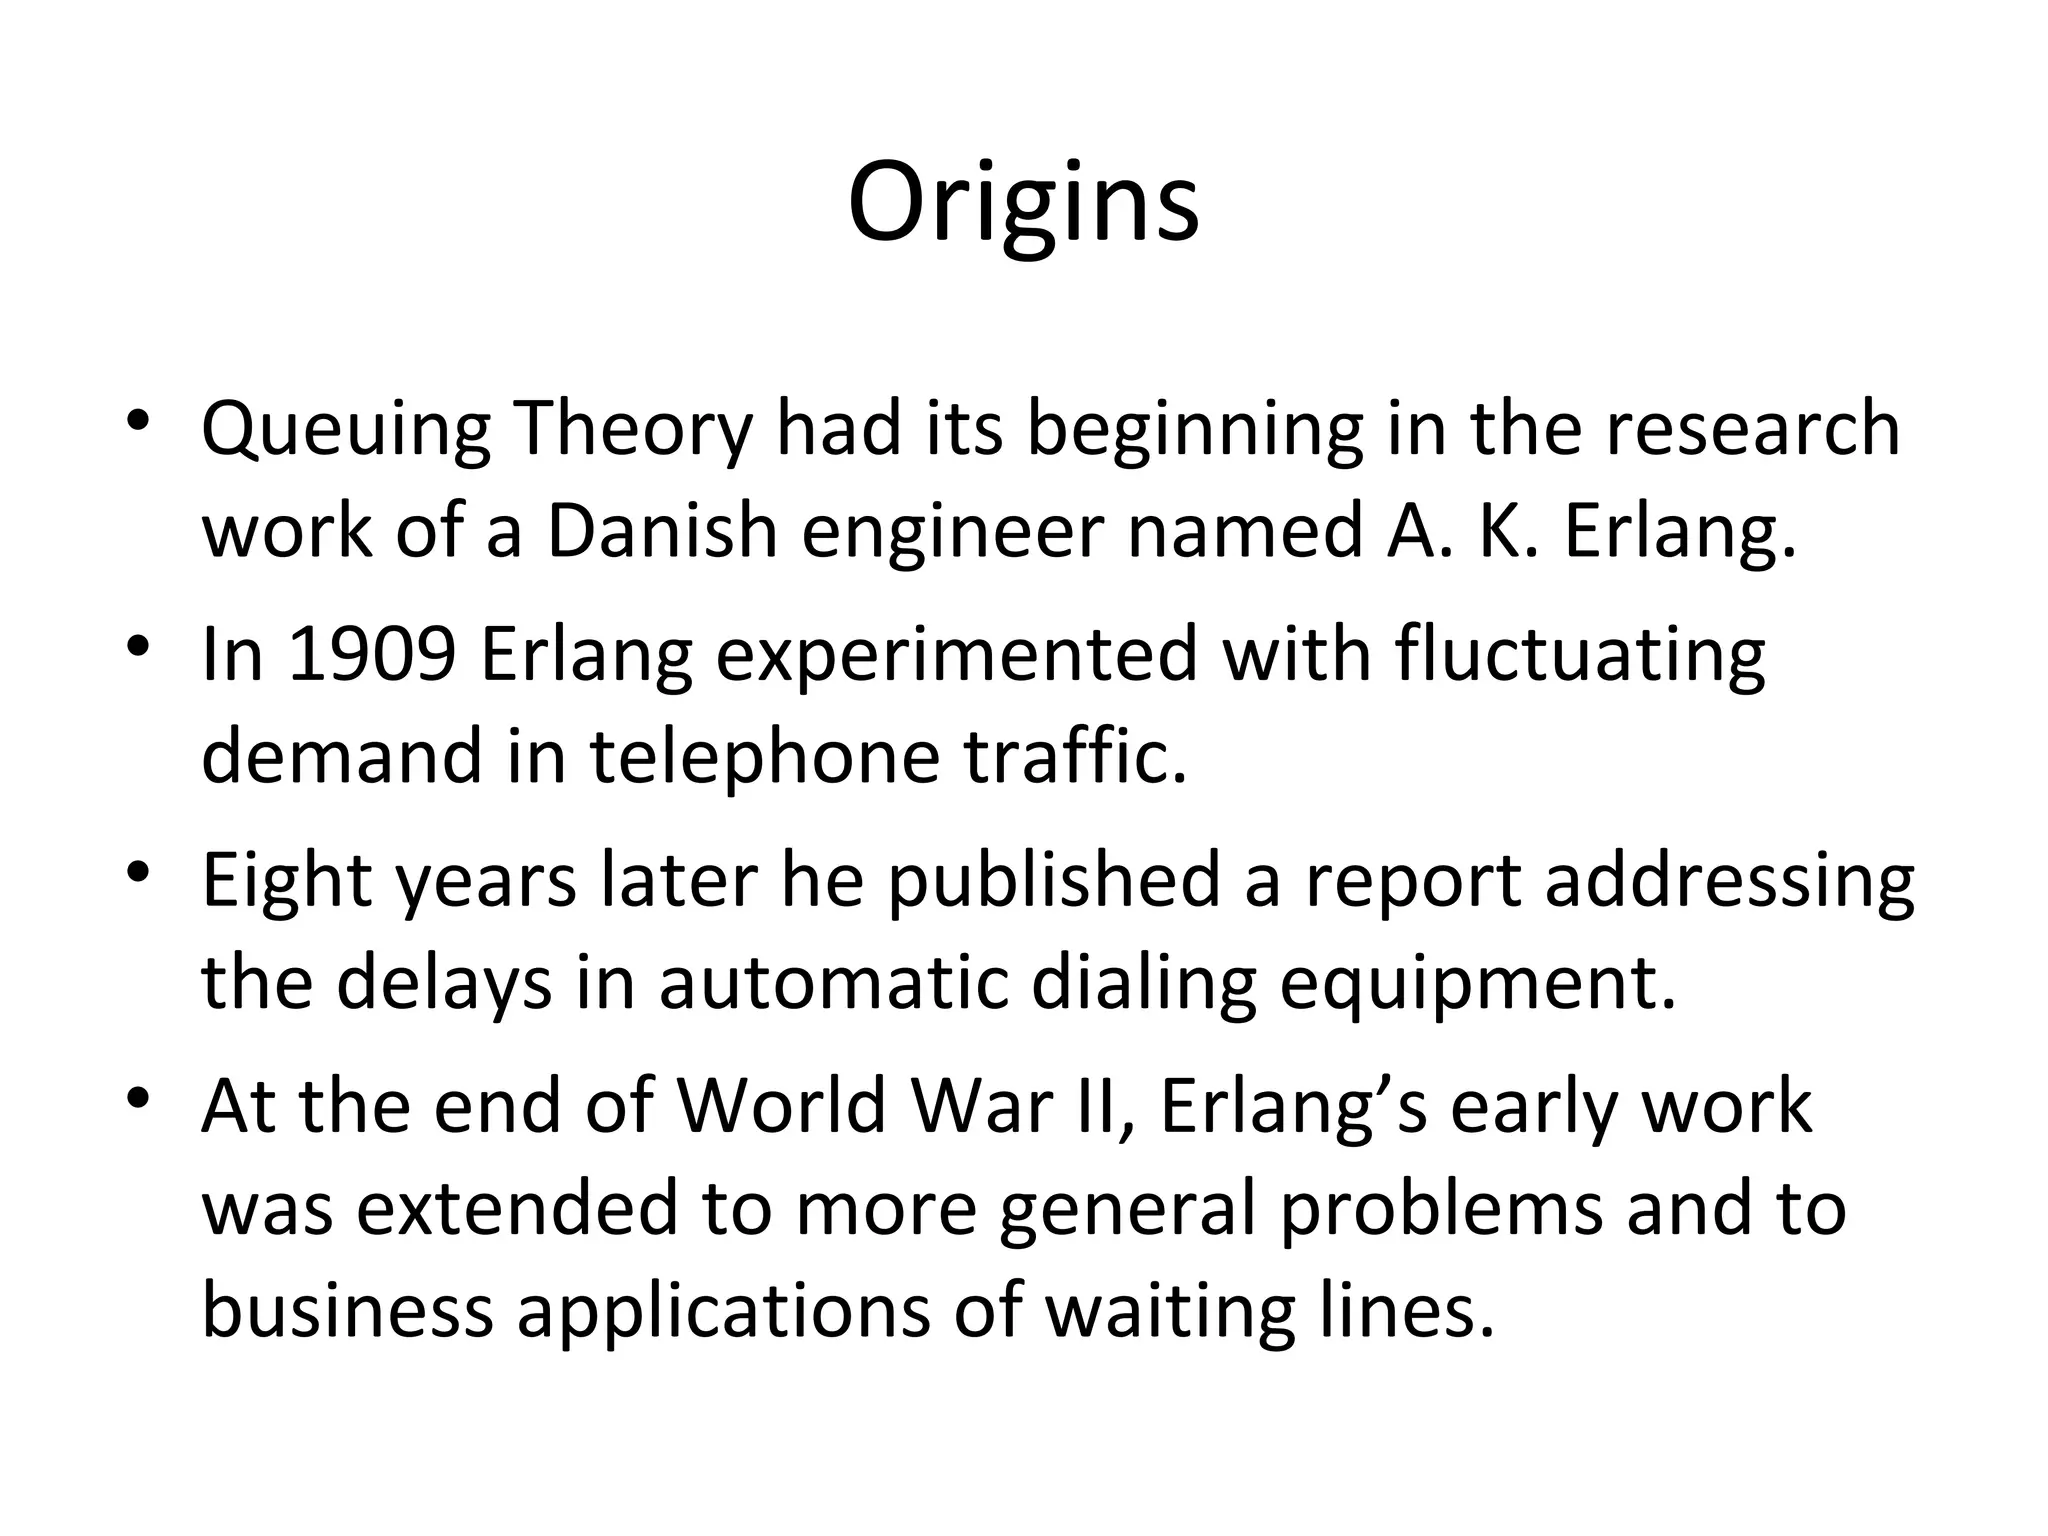
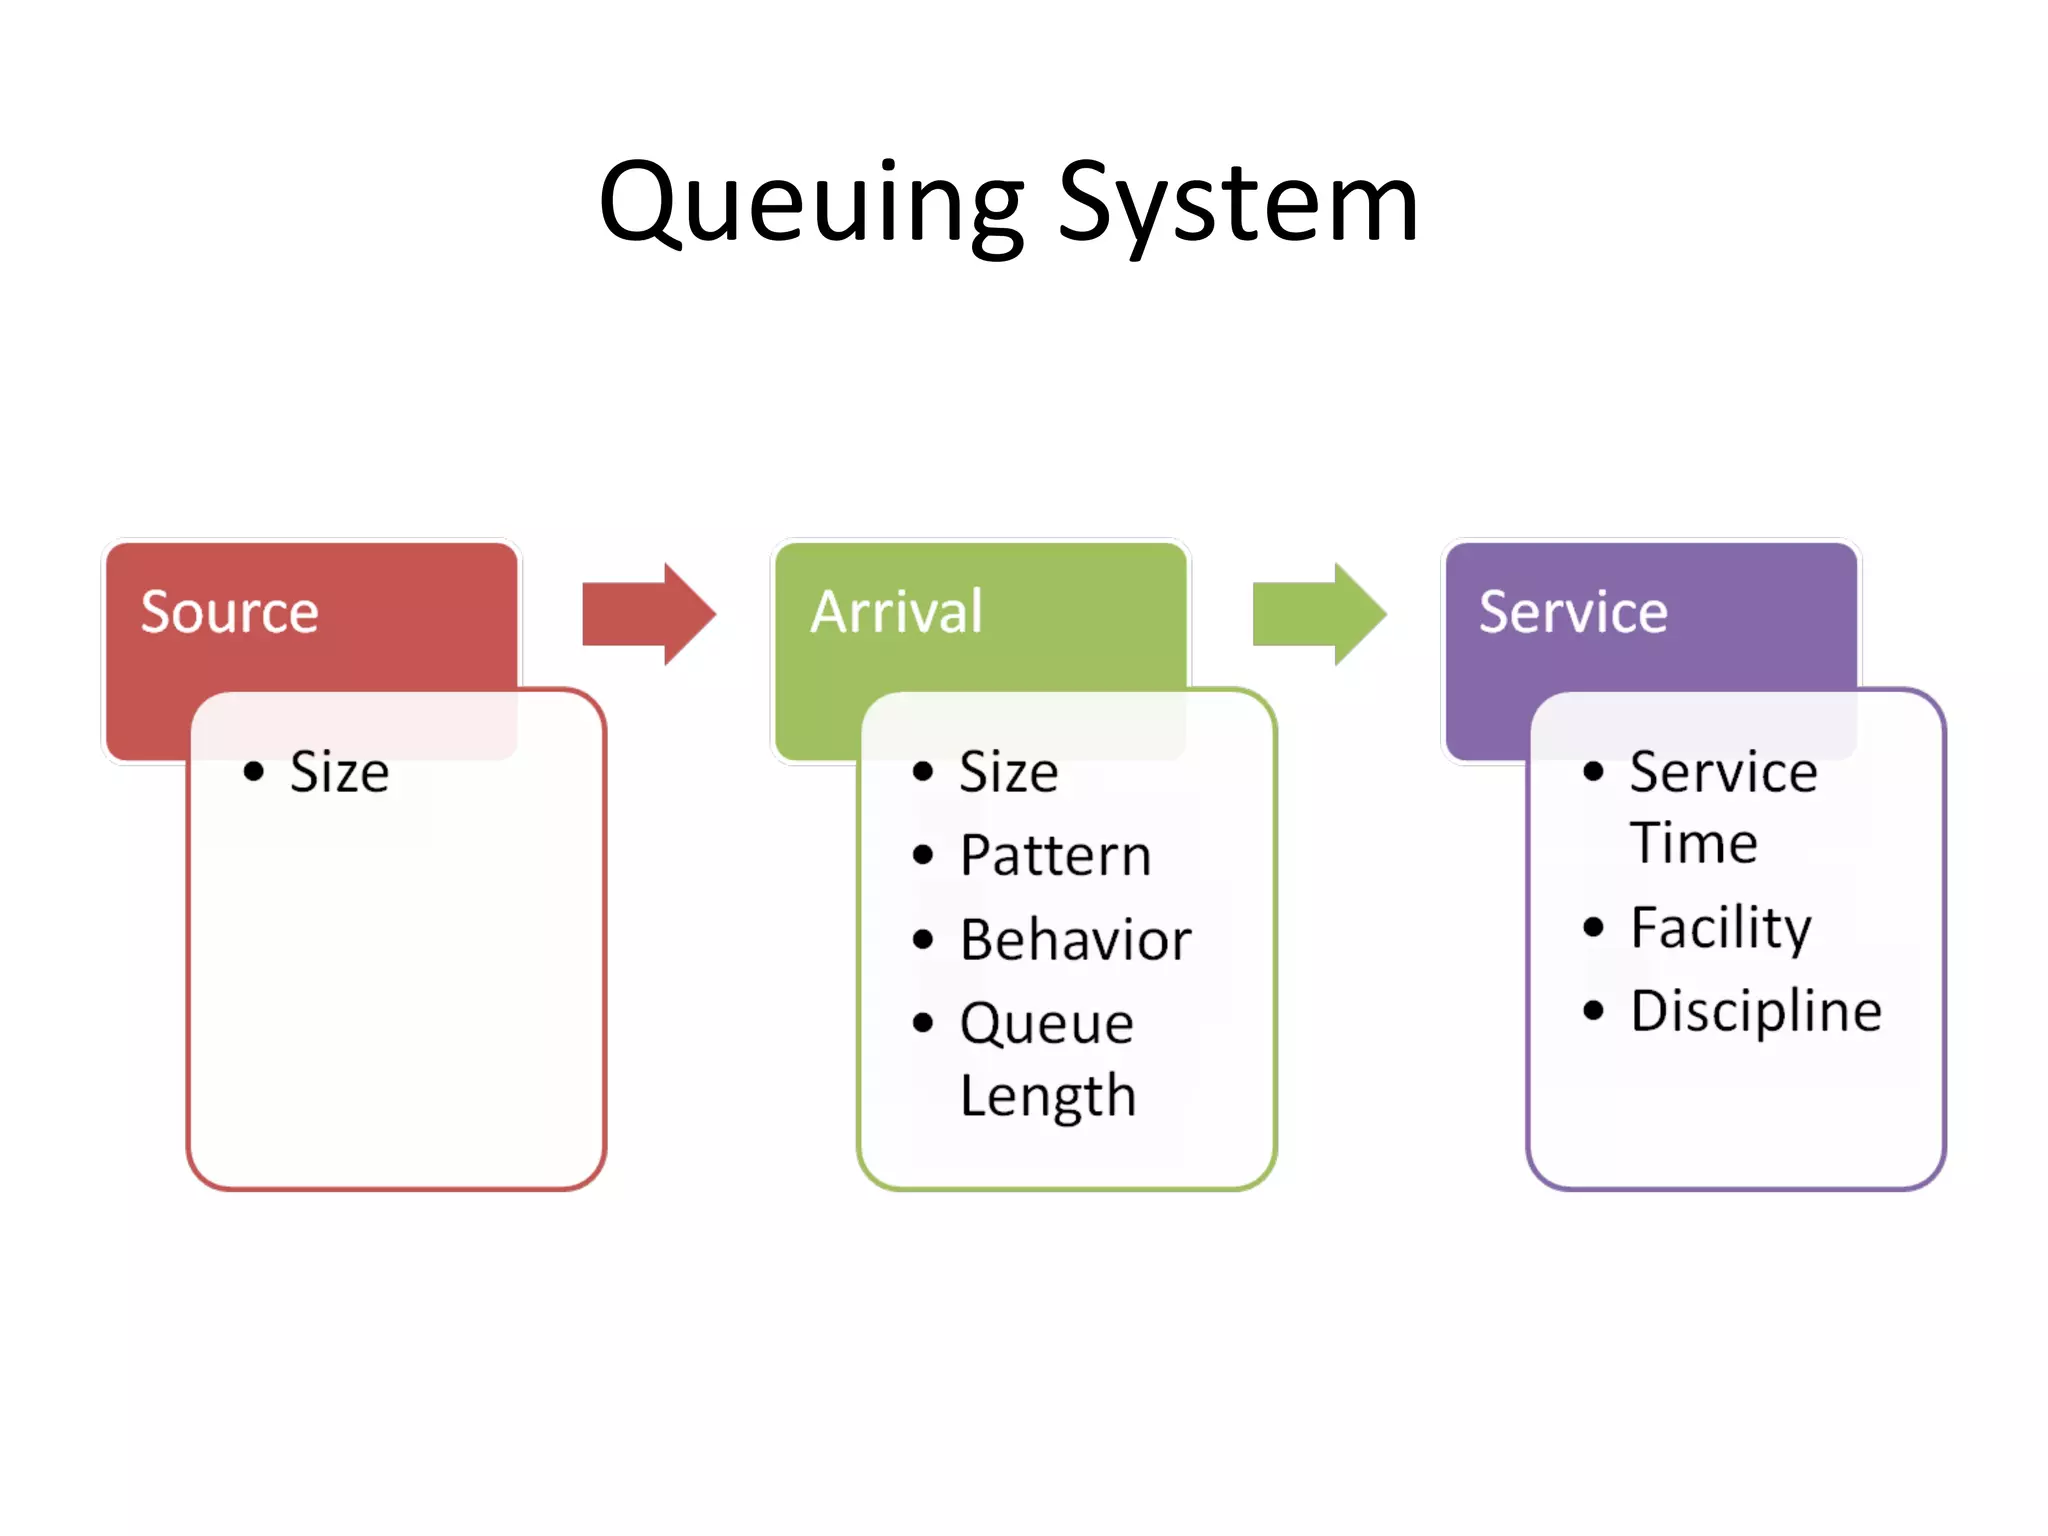
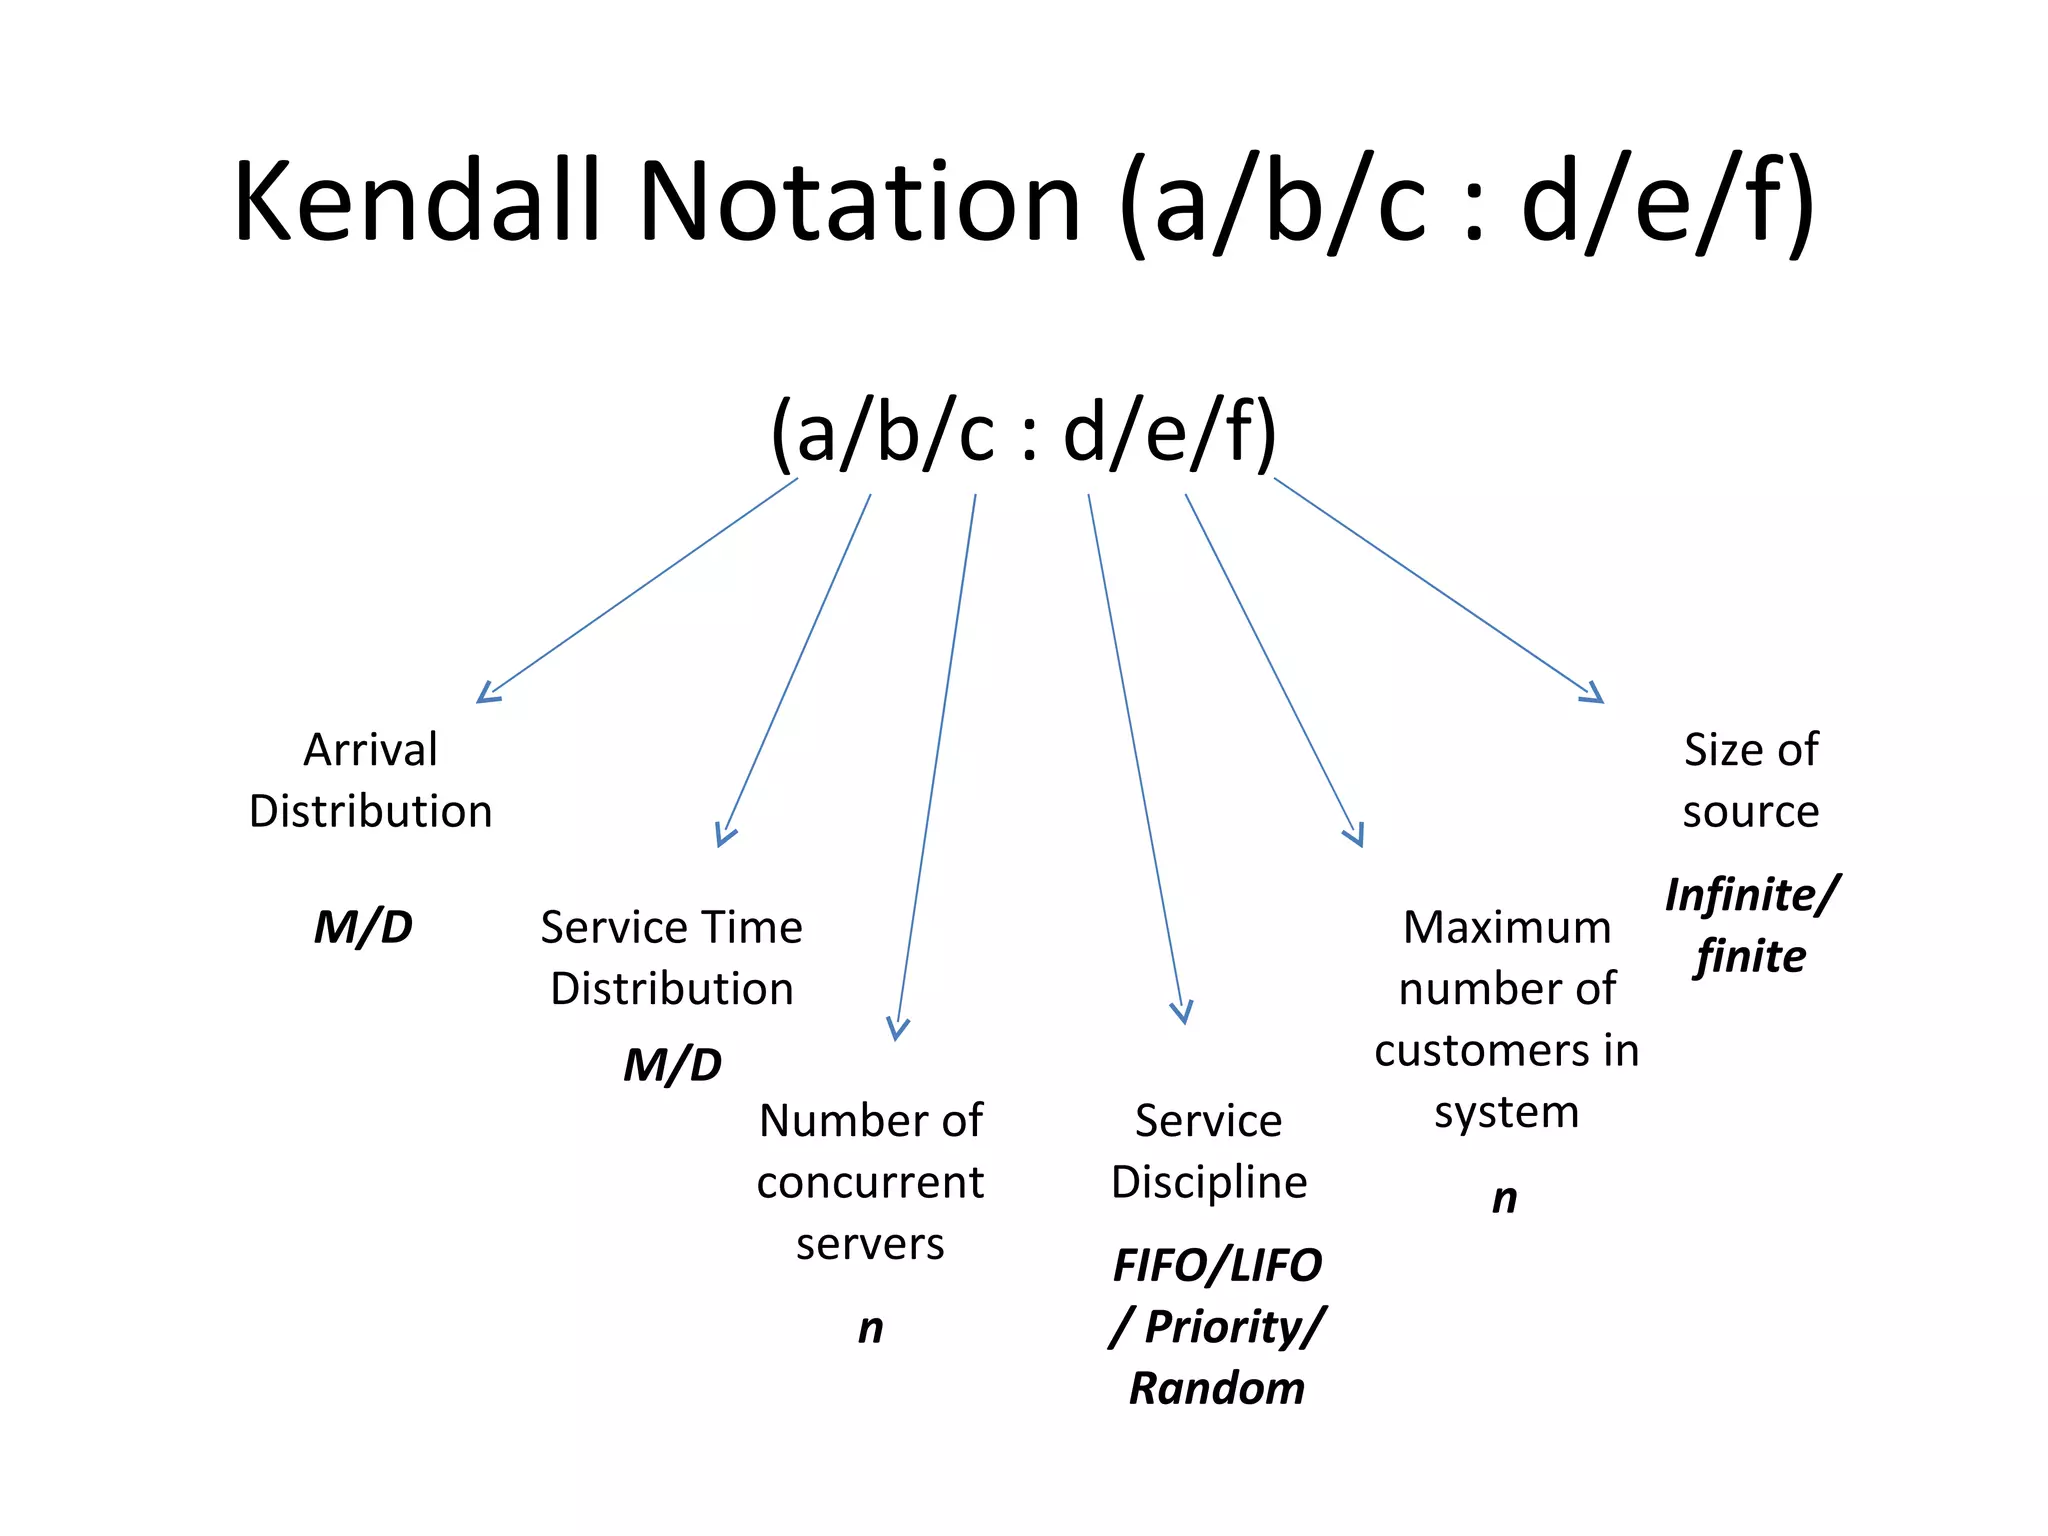
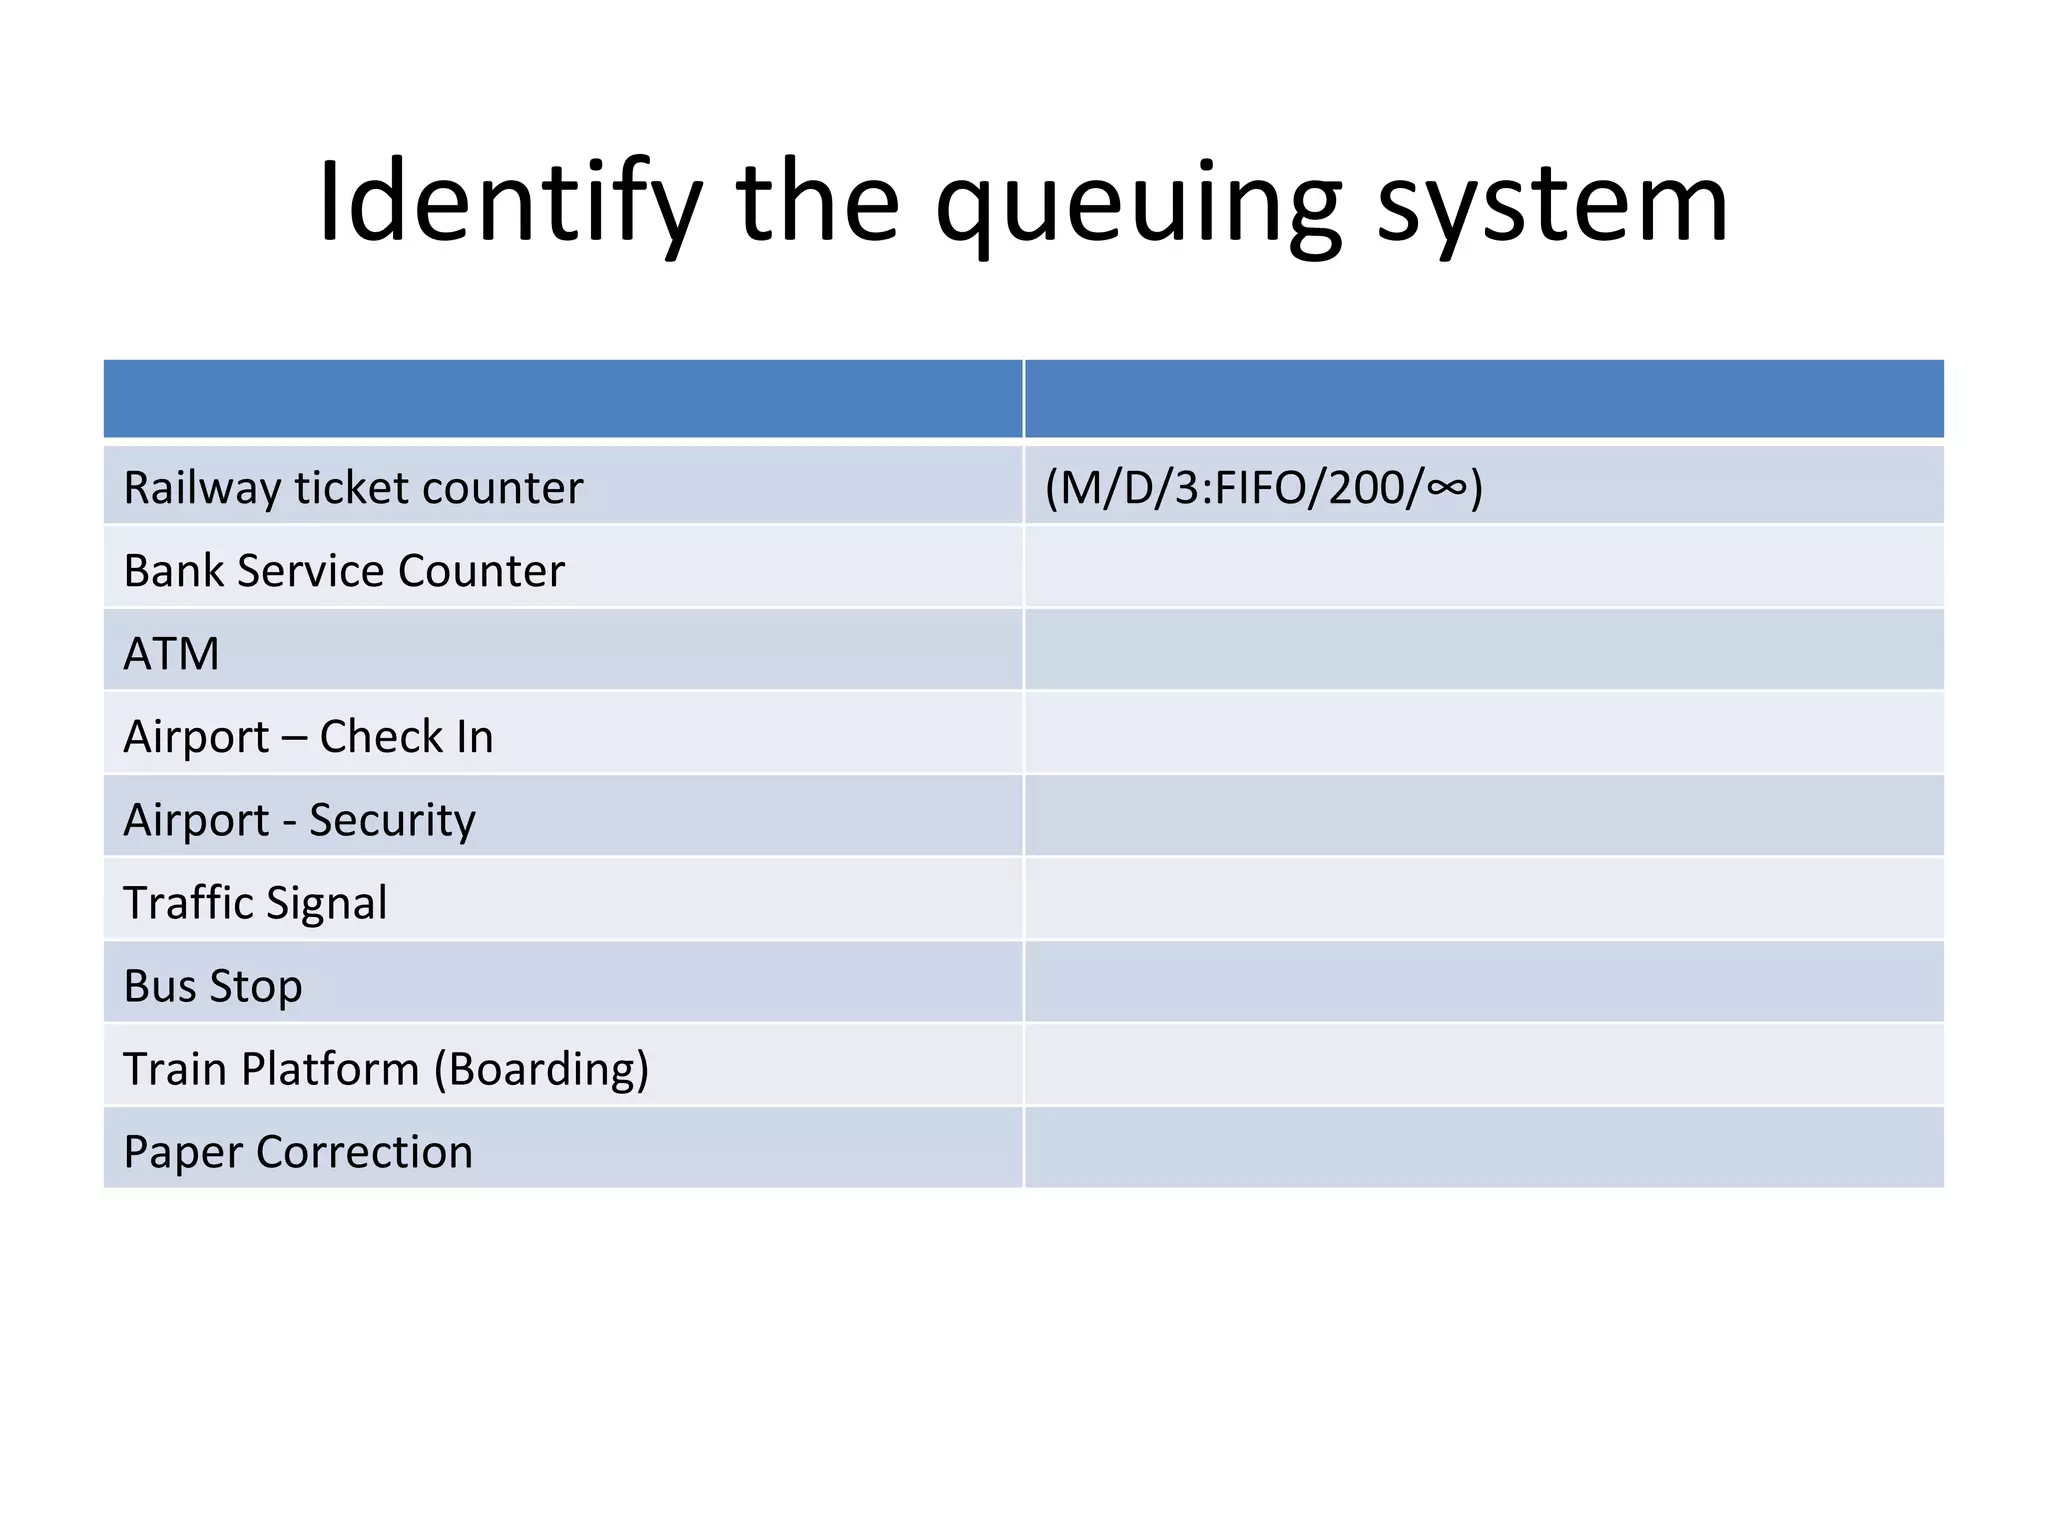
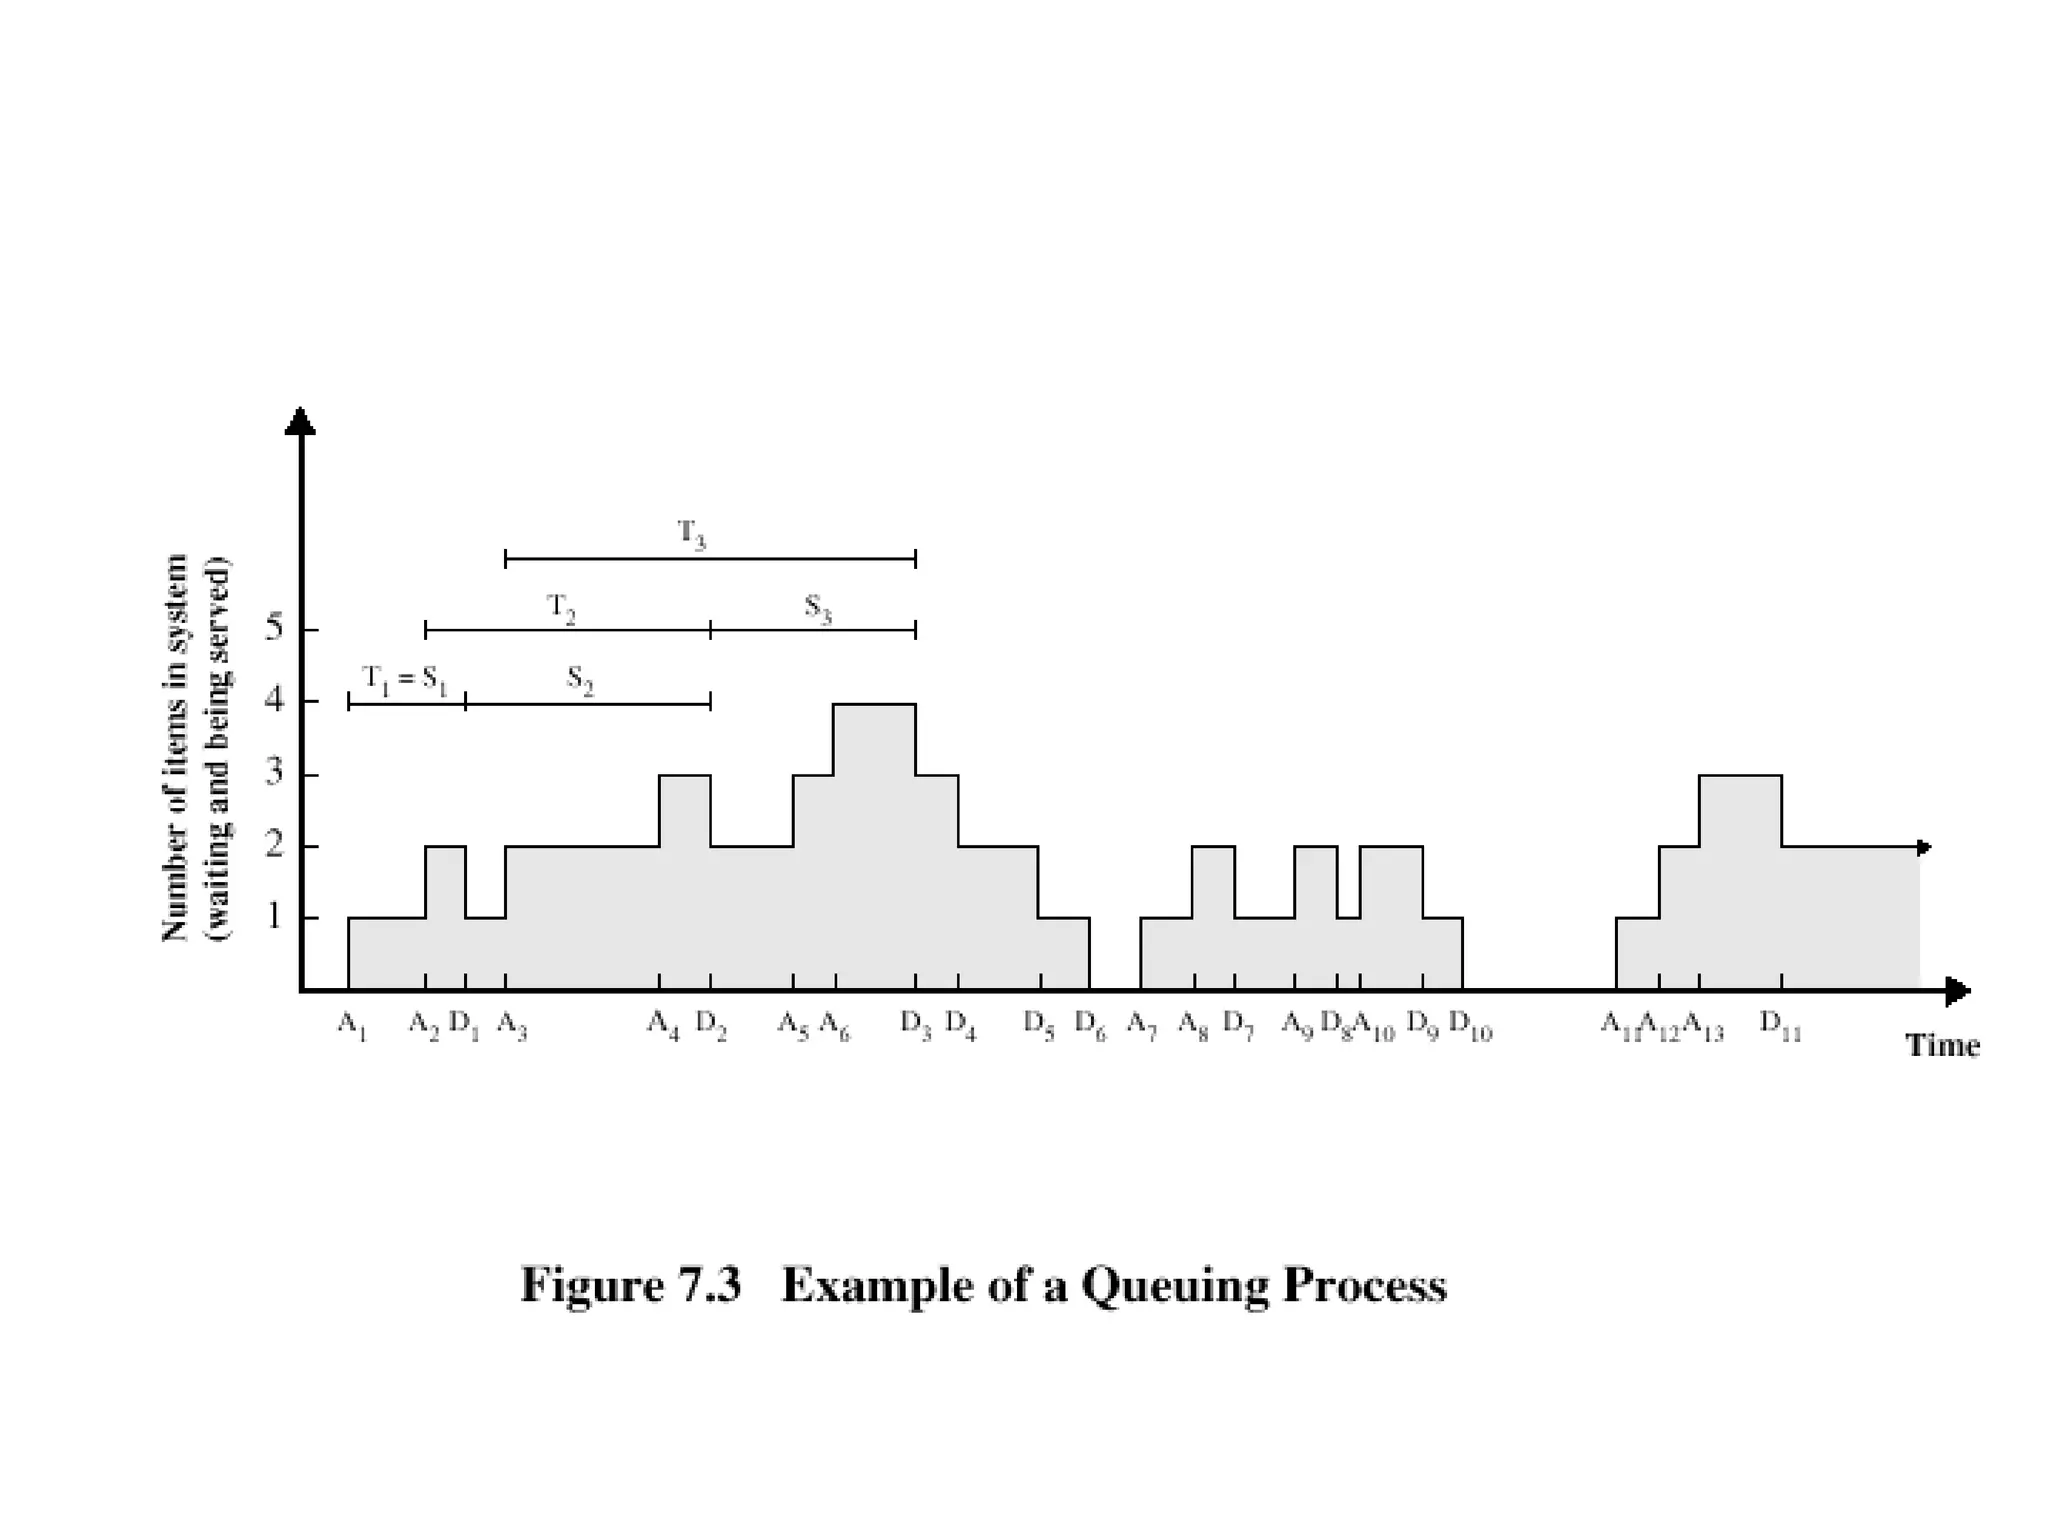
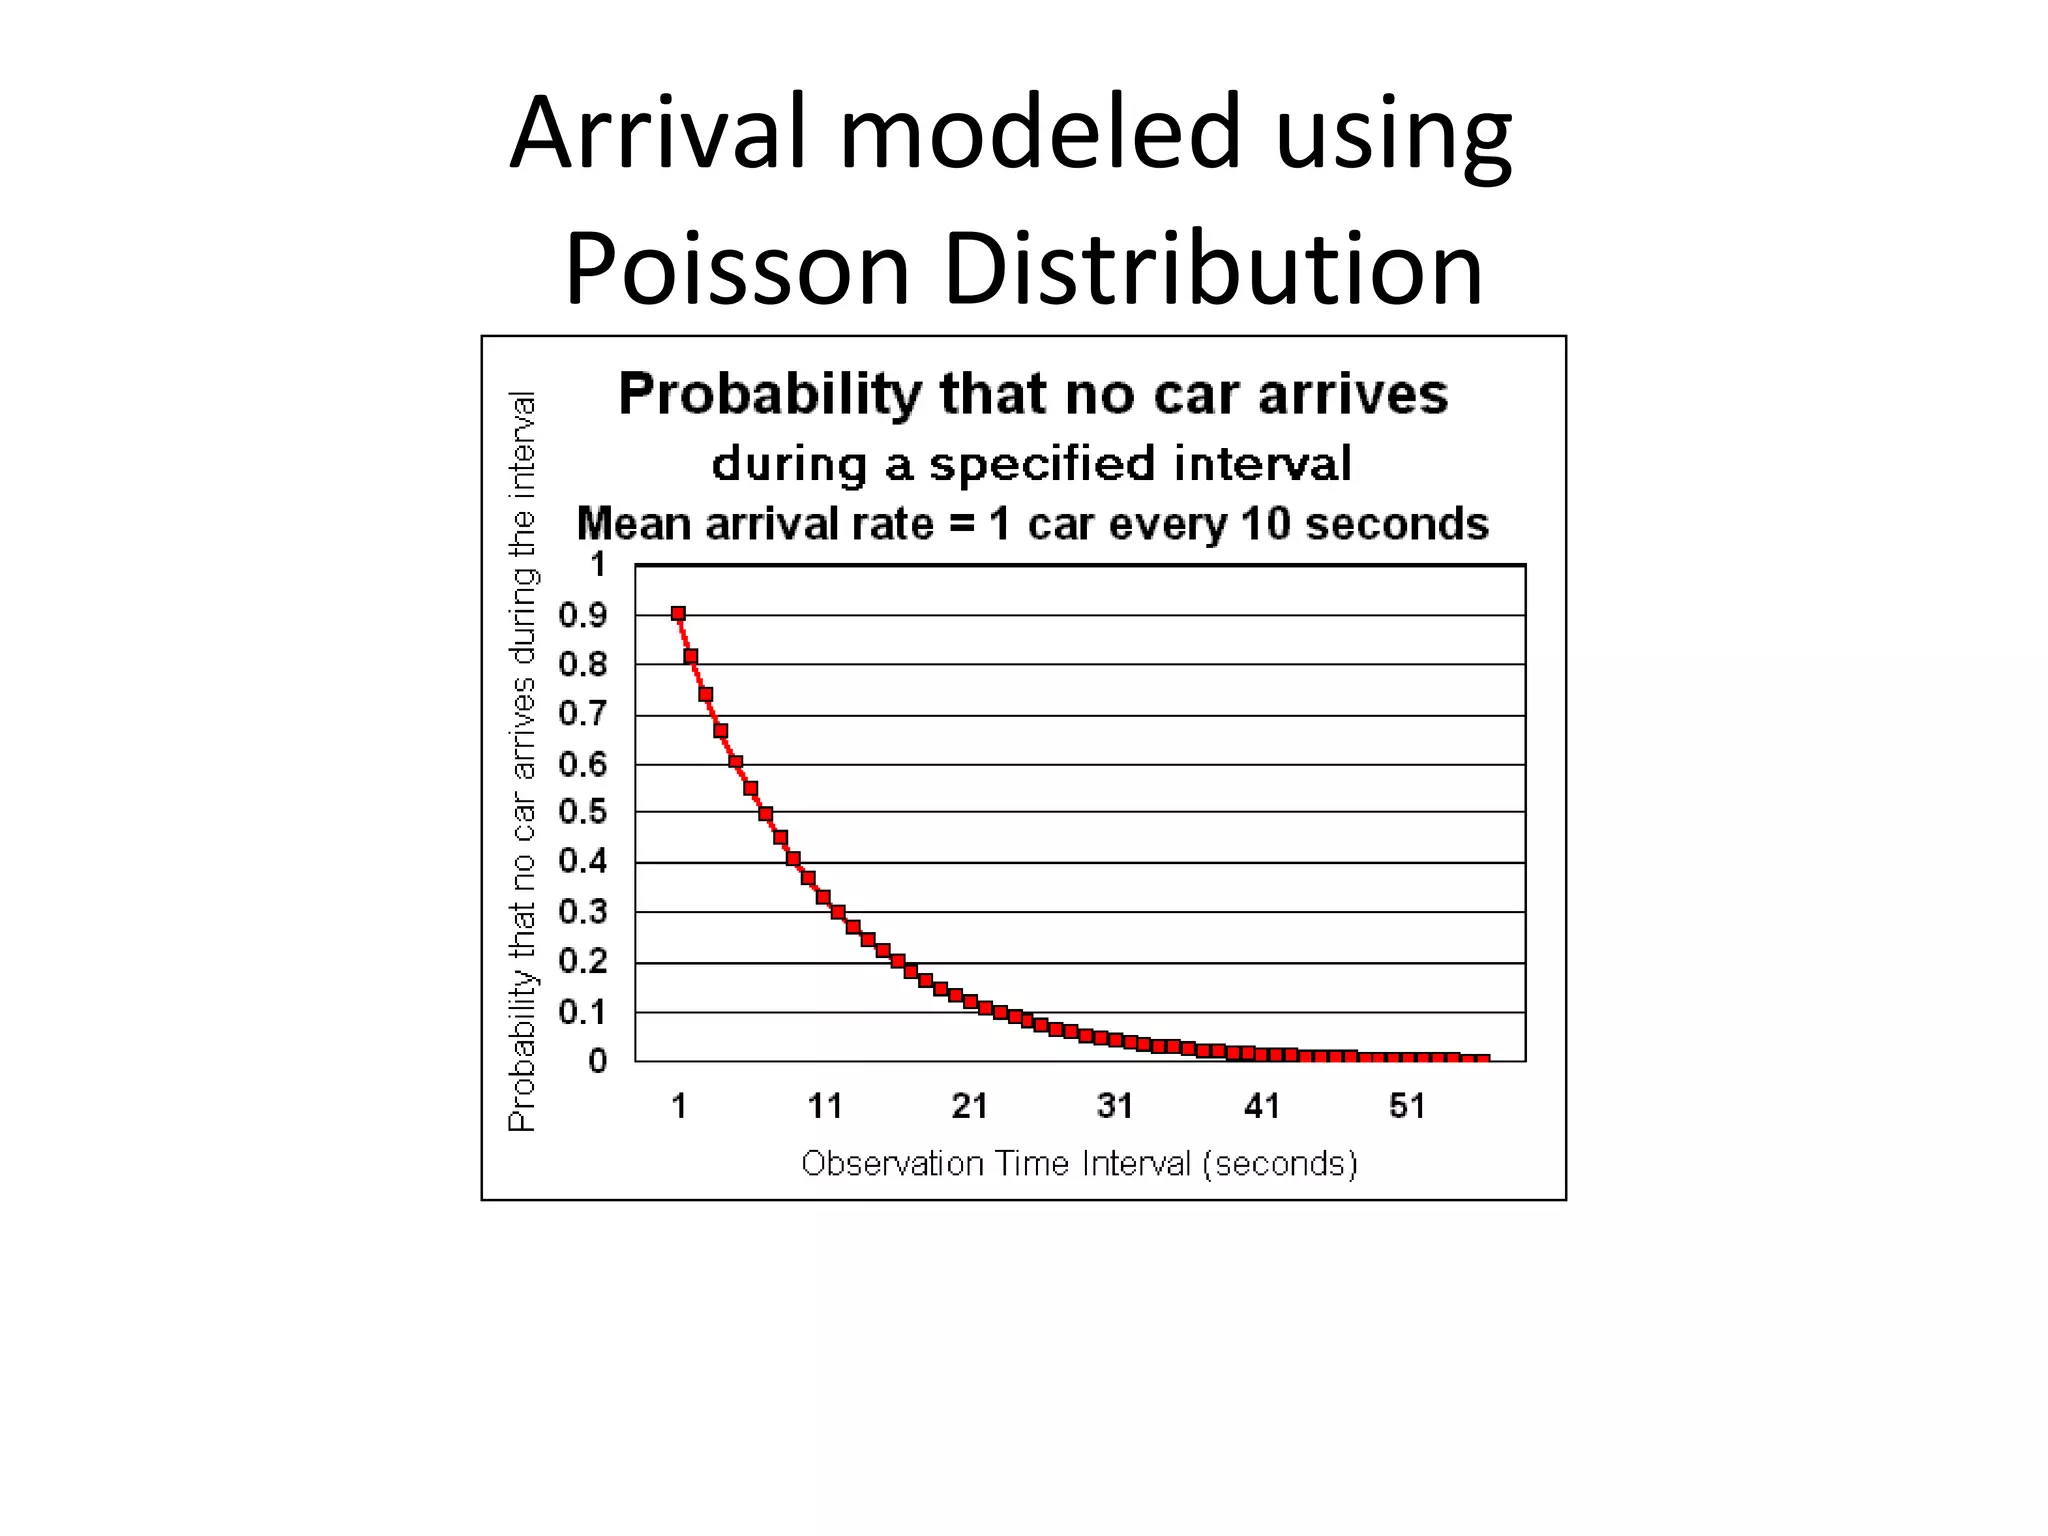
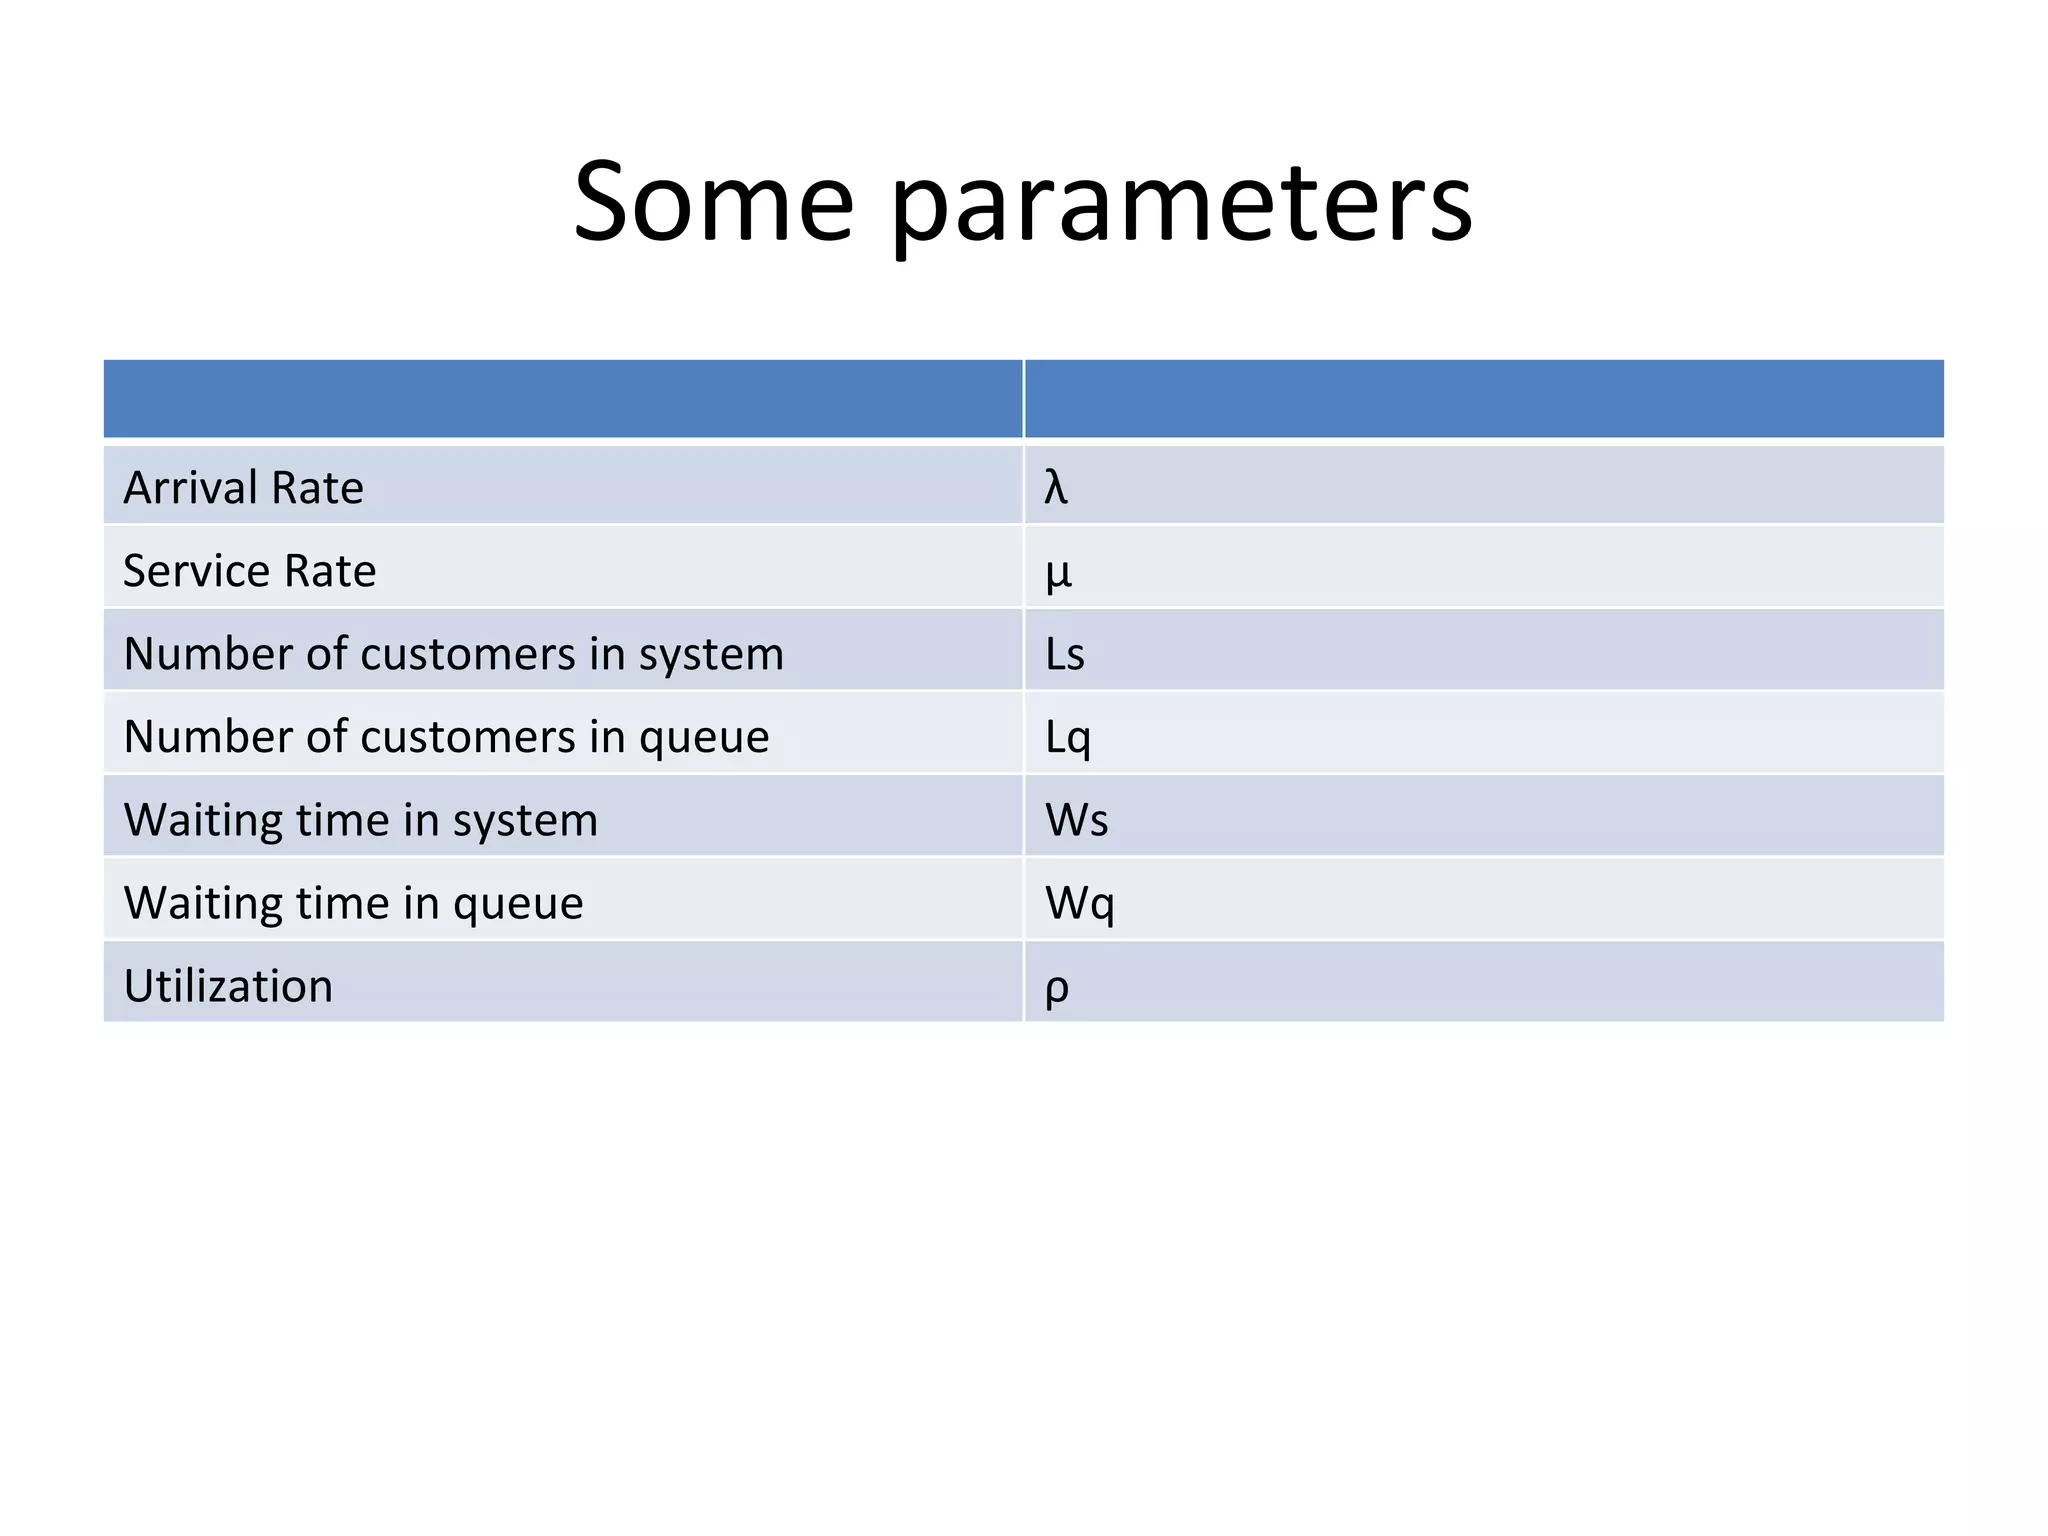
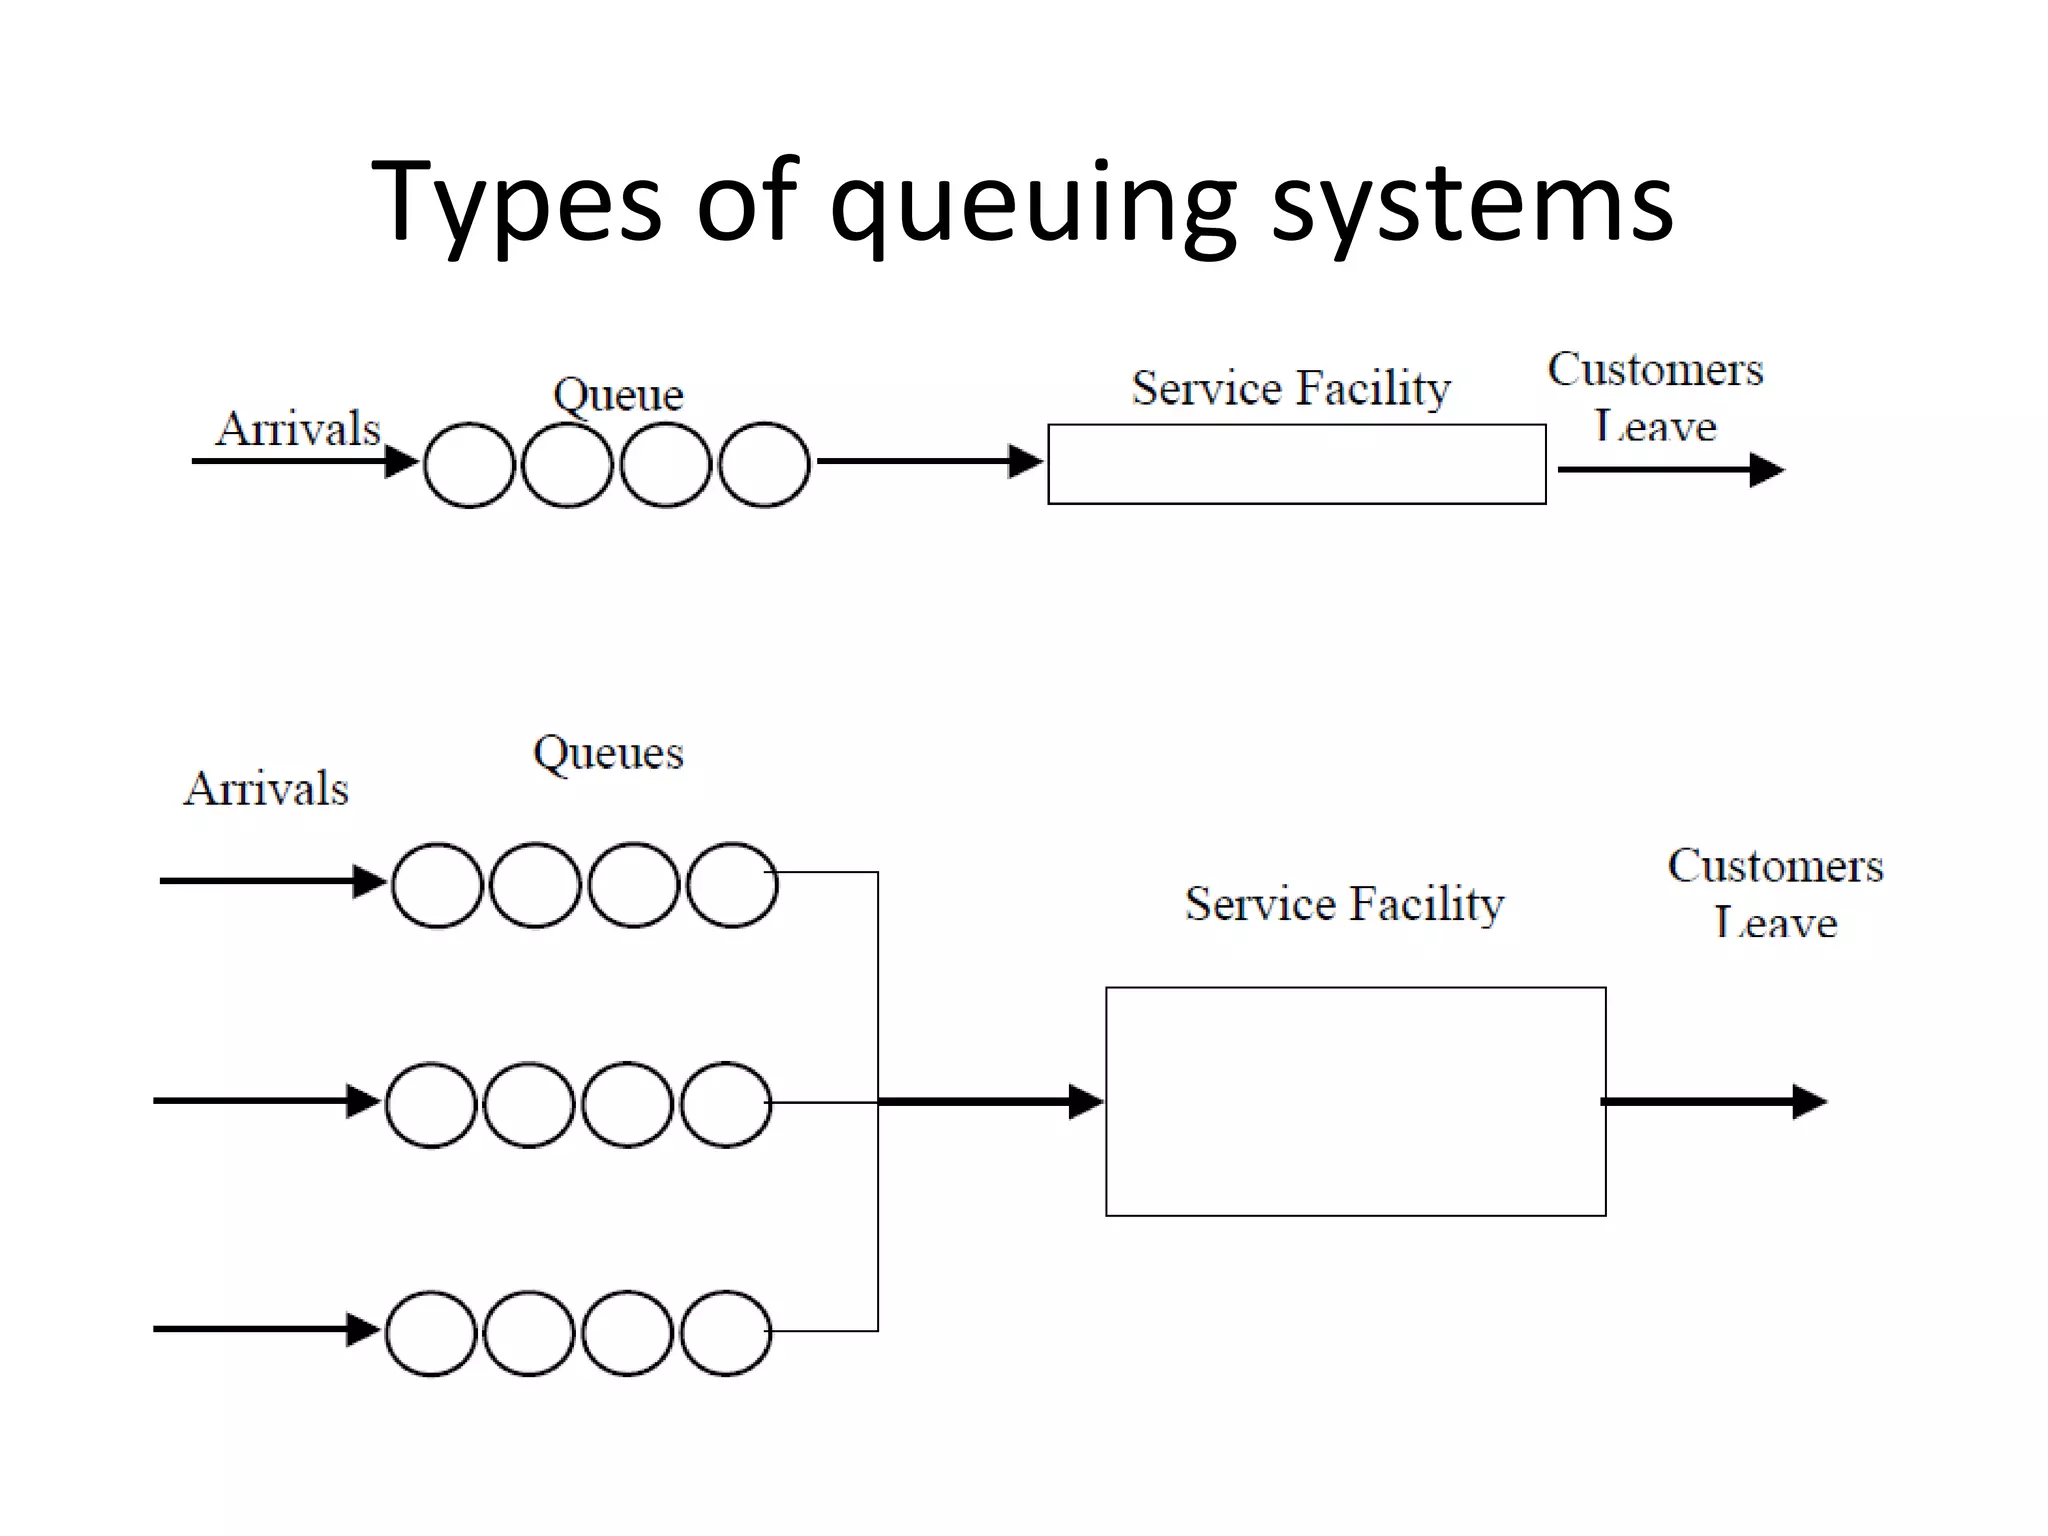

Queuing theory is the study of congestion and waiting in line systems. It examines queues that form when demand for a service exceeds the available resources, such as people waiting at a supermarket checkout, letters waiting to be processed at a post office, or cars waiting at a traffic signal. Queuing systems can be modeled and analyzed using notations like Kendall's notation to understand characteristics like expected wait times, number of servers needed, and how to manage peak traffic periods. The origins of queuing theory began with the research of A.K. Erlang in the early 1900s on modeling telephone traffic and wait times.


