Downloaded 114 times
![World Academy of Science, Engineering and Technology 49 2009
Case on Manufacturing Cell Formation Using
Production Flow Analysis
Vladimír Modrák
includes all aspects of all movements of raw materials, work
Abstract—This paper offers a case study, in which in process, or finished goods within a plant or warehouse’ [1].
methodological aspects of cell design for transformation the
production process are applied. The cell redesign in this work is Material flows can be implemented as:
tightly focused to reach optimization of material flows under real
manufacturing conditions. Accordingly, more individual techniques
1. Discrete flows, which are typical mainly for a batch
were aggregated into compact methodical procedure with aim to built production. This category involves the manufacture
one-piece flow production. Case study was concentrated on relatively of medium-sized lots of the same item or product.
typical situation of transformation from batch production to cellular The lots may be produced only once, or they may be
manufacturing. produced at regular intervals [2] .
Keywords—Product/Quantity analysis, layout, design, 2. Continuous material flows are ordinarily applied in
manufacturing process.
chemical and food industry. While these are
examples of flow production, the term also applies to
I. INTRODUCTION
the manufacture of either complex single parts or
T HE following research deals with theoretical background
for application of one-piece concept by applying the
assembled products.
principles of Product/Quantity (P-Q) analysis and Production The role of the cell formation is transformation of discrete
flow analysis (PFA). Research methodology is applied under material flows to almost continuous material flows with the
real conditions in company, which is manufacturing bicycle aim to change planning-centered production on one-piece
components. In generally, companies’ reason for radical
production. According to more authors (see for instance: [3],
changes of manufacturing process structures are mainly
[4], [5]) by implementing one-piece flow, organizations can
motivated by recognition that so called process type layout do
obtain dramatic reductions in work-in-process inventory. This
not suit just-in-time philosophy. That kind of planning-
oriented production system ends up being a system that reduction in inventory is realized due to:
requires pushing for sales. The factory push their outputs to
retailers, retailers are returning what they cannot sell and 1) Parts are not being stored in containers (unit loads) at
returned products ends up as a dead inventory. operations while they are being processed. Instead one
The concept of so-called one-piece production differs piece at a time is processed in cells and ideally only one
radically from mentioned systems. By contrast this system piece is in transit between operations.
outputs products based on the needs of the assembly
processes, which are the closest processes to the market and 2) Parts are made as they are ordered. Batches or lots of
therefore customer. Only when products have been shipped parts are not staged between operations waiting to be
out more products are ordered from manufacturing scheduled and then to be processed.
department.
Another vantage of this concept is the effect called Zero
II. RESEARCH BACKGROUND defect production [6]. It is realized by building mistake-
proofing devices into production line, in which work pieces
The sense of material flow optimisation is to help planners
are inspected one at the time. The concept one-piece flow
to satisfy customer’s needs in shortened manufacturing time
production has been introduced relatively lately, but it seems
cycles. The subject of material flow optimisation falls into
to be very significant in today's competitive and dynamic
production flow management or logistic management, which
manufacturing environment.
The closest theory to one-piece production was brought by
Burbridge [7] that is known as Production Flow Analysis
V. Modrák is with the Manufacturing Management department, Technical (PFA) for planning Group Technology (GT). Sekine [8]
University of Košice, Faculty of Manufacturing Technologies, Slovakia, purposefully analyzed the basic principles of process flow
phone: 00421-51-7722828; fax: 00421-51-7733453; e-mail:
vladimir.modrak@tuke.sk building and offered detailed case studies of how various
industries designed unique one-piece flow systems (parallel,
519](https://image.slidesharecdn.com/facilityandlayoutdesigncasestudy-120410024329-phpapp01/85/Facility-Layout-Design-Case-Study-1-320.jpg)
![World Academy of Science, Engineering and Technology 49 2009
Case on Manufacturing Cell Formation Using
Production Flow Analysis
Vladimír Modrák
includes all aspects of all movements of raw materials, work
Abstract—This paper offers a case study, in which in process, or finished goods within a plant or warehouse’ [1].
methodological aspects of cell design for transformation the
production process are applied. The cell redesign in this work is Material flows can be implemented as:
tightly focused to reach optimization of material flows under real
manufacturing conditions. Accordingly, more individual techniques
1. Discrete flows, which are typical mainly for a batch
were aggregated into compact methodical procedure with aim to built production. This category involves the manufacture
one-piece flow production. Case study was concentrated on relatively of medium-sized lots of the same item or product.
typical situation of transformation from batch production to cellular The lots may be produced only once, or they may be
manufacturing. produced at regular intervals [2] .
Keywords—Product/Quantity analysis, layout, design, 2. Continuous material flows are ordinarily applied in
manufacturing process.
chemical and food industry. While these are
examples of flow production, the term also applies to
I. INTRODUCTION
the manufacture of either complex single parts or
T HE following research deals with theoretical background
for application of one-piece concept by applying the
assembled products.
principles of Product/Quantity (P-Q) analysis and Production The role of the cell formation is transformation of discrete
flow analysis (PFA). Research methodology is applied under material flows to almost continuous material flows with the
real conditions in company, which is manufacturing bicycle aim to change planning-centered production on one-piece
components. In generally, companies’ reason for radical
production. According to more authors (see for instance: [3],
changes of manufacturing process structures are mainly
[4], [5]) by implementing one-piece flow, organizations can
motivated by recognition that so called process type layout do
obtain dramatic reductions in work-in-process inventory. This
not suit just-in-time philosophy. That kind of planning-
oriented production system ends up being a system that reduction in inventory is realized due to:
requires pushing for sales. The factory push their outputs to
retailers, retailers are returning what they cannot sell and 1) Parts are not being stored in containers (unit loads) at
returned products ends up as a dead inventory. operations while they are being processed. Instead one
The concept of so-called one-piece production differs piece at a time is processed in cells and ideally only one
radically from mentioned systems. By contrast this system piece is in transit between operations.
outputs products based on the needs of the assembly
processes, which are the closest processes to the market and 2) Parts are made as they are ordered. Batches or lots of
therefore customer. Only when products have been shipped parts are not staged between operations waiting to be
out more products are ordered from manufacturing scheduled and then to be processed.
department.
Another vantage of this concept is the effect called Zero
II. RESEARCH BACKGROUND defect production [6]. It is realized by building mistake-
proofing devices into production line, in which work pieces
The sense of material flow optimisation is to help planners
are inspected one at the time. The concept one-piece flow
to satisfy customer’s needs in shortened manufacturing time
production has been introduced relatively lately, but it seems
cycles. The subject of material flow optimisation falls into
to be very significant in today's competitive and dynamic
production flow management or logistic management, which
manufacturing environment.
The closest theory to one-piece production was brought by
Burbridge [7] that is known as Production Flow Analysis
V. Modrák is with the Manufacturing Management department, Technical (PFA) for planning Group Technology (GT). Sekine [8]
University of Košice, Faculty of Manufacturing Technologies, Slovakia, purposefully analyzed the basic principles of process flow
phone: 00421-51-7722828; fax: 00421-51-7733453; e-mail:
vladimir.modrak@tuke.sk building and offered detailed case studies of how various
industries designed unique one-piece flow systems (parallel,
519](https://image.slidesharecdn.com/facilityandlayoutdesigncasestudy-120410024329-phpapp01/75/Facility-Layout-Design-Case-Study-1-2048.jpg)
![World Academy of Science, Engineering and Technology 49 2009
L-shaped, and U-shaped floor plans) to meet their particular
needs. The basic conditions for establishing one-piece flow
systems are:
1. Make the factory layout conductive to the overall
production flow.
2. The factory must include clear pathways.
3. The production line should clearly distinguish
between material input and product output
4. The production line should consist mainly of single-
operator U-shaped cells.
5. Include thorough inspection in the layout.
6. Minimize in-process inventory.
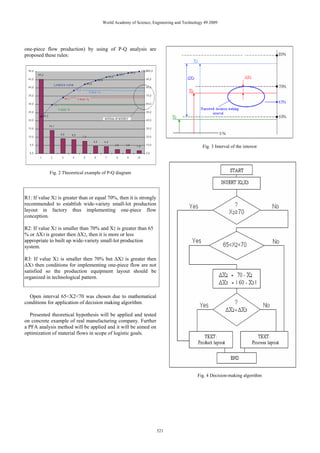
Fig. 1 Production equipment layout and material flow before cell
formation
In generally, very small work pieces are not suitable to one-
piece production due to the waste involved in the setup,
- the 20:80 ratio (line X1)
positioning, and removal of such small items. This concept is
- the 30:70 ratio (line X2)
also inappropriate if changeover times are long. - the 40:60 ratio (line X3)
III. PROBLEM AND METHOD DESCRIPTION BY A CASE STUDY X1- amount of manufactured products related to 20% of
The company, where case study was conducted, produces produced assortment
bicycle components, which differ in shapes and sizes. From X2- amount of manufactured products related to 30% of
production type point of view the company belongs under produced assortment
category of batch production. This category involves X3- amount of manufactured products related to 40% of
manufacturing of medium-sized lots of the same item or produced assortment
product. Generally speaking, lots can be produced only once,
or they can be produced at regular intervals. In the given case Outlined ratios in P-Q diagram for individual X-es are the
lots are produced more or less at regular intervals. source for decision making about production equipment
Consequently, the manufacturing equipment was layout in factory. They are as follows:
conventionally designed for higher rates of production. The
machine tools are combined with specially designed jigs and
a) if X1 approaches 80%, then building a wide-variety small-
fixtures, which increase the output rate. Flexibility of
lot production line is reasonable i.e. apply one-piece flow
production is ensured by semi-automatic machines. Company
conception,
aims its activity towards to increase volume of production by
b) if X2 lays around 70% value, decision about production
innovation of production facilities and development of
equipment layout depends more or less on intuition and
management methods. Current production equipment layout
experience of a manager, even though fuzzy criteria for such
and material flow during processing in a mentioned factory
decision making are mentioned by Sekine [8],
are depicted in Fig. 1.
c) if X3 approaches 60%, it is reasonable to organize
A. Theoretical Background for Conducting a P-Q Analysis production equipment in technological pattern due to relations
After determining current situation in production process between assortment and amount of manufactured pieces being
next key for building successful operations is an effective not suitable for implementing one-piece flow principles.
system design. An effective design should take into account
an organization’s products, facilities, and procedures for An interval of interest is described in Fig. 3, where area of
planning and controlling operations, minimum ergonomic source thesis is marked. When X2 value in P-Q diagram
requirements for equipment, and short and long-term goals. A intersects with Lorence curve at about 70% (see Fig. 3 for
system design helps to define a products costs structure, narrow decision making interval) manager is having hard time
determines an organizations competitive position for several deciding about production layout since there are no clear
years. It is essential to find a design that meets present and criterions for such decision. It is up to his knowledge to make
future needs. It should not tie operations to outdated a right decision. To eliminate uncertainty in decision making a
technology. It produces superior products and enhances mathematical algorithm (Fig. 4) is offered for clear decision
organization competitive abilities. First important step for an parameters.
effective system design is Product—Quantity (P-Q) analysis. ∆X2 (in Fig. 3) is difference between actual amount of
Sekine and Arai [9] recommend taking a P-Q Analysis as products X2 and 70% margin defined by theory [%].
criterion for suitability of one-piece flow concept by using 3 ∆X3 (in Fig. 3) is difference between actual amount of
following ratios (see Fig. 2): products X3 and 60% margin defined by theory [%]
For defining unambiguous criterions in decision making
process between process layout and product layout (typical for
520](https://image.slidesharecdn.com/facilityandlayoutdesigncasestudy-120410024329-phpapp01/85/Facility-Layout-Design-Case-Study-2-320.jpg)
![World Academy of Science, Engineering and Technology 49 2009
B. Initial Data for Conducting P-Q Analysis be disintegrated into groups according to the group
Initial production values needed for conducting P-Q technology concepts. Multi-product process chart based on
analysis are given Table I. They serve for drawing of P-Q original process layout is showed in figure 6.
diagram and Lorenz Curve showed in Fig. 5.
TABLE I
INITIAL PRODUCTION DATA
Semi- Cumul. Cumul.
product Quantity Quantity share
No. (pcs/yr) (pcs/yr) (%)
1 405870 405 870 405 870
2 270580 676 450 676 450
3 266966 943 416 943 416
4 256311 1 199 727 1 199 727
5 101700 1 301 427 1 301 427
6 88990 1 390 417 1 390 417
7 76276 1 466 693 1 466 693
8 69404 1 536 097 1 536 097
9 53704 1 589 801 1 589 801 Fig. 6 Multi-product process chart
10 39176 1 628 977 1 628 977
11 34702 1 663 679 1 663 679 Based on multi-product process chart further steps of
12 29382 1 693 061 1 693 061
Production flow analysis can be applied. Each stage in PFA
seeks to eliminate delays in production flows and operational
wastes in a progressively smaller area of the factory. PFA can
be defined as comprehensive method for material flow
analysis, part family formation, design of manufacturing cells,
and facility layout design that was developed in the early 70.s
[10]. By PFA related groups of parts are identified and
rearranged into a new pattern that brings together packs with
similar machine sequences. A mathematical formulation of the
production flow analysis optimization problem was developed
for instance by Villa and Bandera [11]. By applying the
results of PFA (also called as cluster analysis), a production
equipment layout with optimized lines can be modeled. Basic
principle of cluster analysis is shown in Fig. 7.
Fig. 5 Actual P-Q diagram (P- product type, Q-quantity)
According to previously determined preconditions, the
30:70 ratio (line X2) is greater then 70% what does it mean
that condition R1 of a source thesis was completed for
implementing of one-piece conception. Fig. 7 Simple example of cluster analysis
In the table are presented only decisive parts of company
production program that have a relevance to the After gradual transformation of incident matrix “A” that
manufacturing process design. The semi-products are divided was derived from Table II, it was created a model of
into three assembled groups. First group of components is production equipment layout with optimized 6 lines that is
represented by frames of bikes. Second group consist from shown in Fig. 8.
different types of back forks and in third group are clustered
different types of front forks.
C. Decomposition of Technological Operations and Layout
Redesign
Broad set of working activities done in a manufacturing
department for a given assortment of parts to be processed can
522](https://image.slidesharecdn.com/facilityandlayoutdesigncasestudy-120410024329-phpapp01/85/Facility-Layout-Design-Case-Study-4-320.jpg)
![World Academy of Science, Engineering and Technology 49 2009
based on criteria of P-Q analysis. On the other hand,
transforming of current production equipment layout to 6 lines
led to improvement of more important economical aspects in a
company.
ACKNOWLEDGMENT
This paper was partially supported by finance from VEGA
Grants No. 1/4153/07.
REFERENCES
[1] D.M. Lambert, M.C. Cooper, and J. D. Pagh, “Supply Chain
Management: Implementation Issues and Research Opportunities.” The
Fig. 8 A new 6-line production equipment layout international Journal of Logistics Management, 9, (2), 1998, 1-19.
[2] M. P. Groover, Automation, production systems, and computer-
integrated manufacturing. Prentice-Hall, Englewood Cliffs, NJ, 1987.
In real conditions, the cells are often organized into a U- [3] A. Robinson, Continuous Improvement in Automation - a Systematic
shaped layout, which is considered appropriate when there is a Approach to Waste Reduction. Productivity Press, Cambridge,
variation in the workflow among the parts made in the cell. MA,1991.
Because it is also actual for the case in mentioned company, [4] A. Houshyar and G. Peters, “Impact of one piece flow on economic data
quality and shop floor data collection.” Journal of the Academy of
redesigned layout (Fig. 9) of production processes consists of Business and Economics, March, 2003.
lines using U shaped cells. It also allows the multifunctional [5] S. C. Graves, H. C. Meal, D. Stefek and A. H. Zeghmi, “Scheduling of
workers in the cell to move easily in between machines. re-entrant flow-shops.” Journal of Operations Management 3 (4), 1983,
pp. 197–207.
[6] S. Tsuchiva, Quality Maintenance: Zero Defects through Equipment
Management, TWI Press, 1997.
[7] J. L. Burbridge, Production Flow Analysis for Planning Group
Technology. Clarendon Press, Oxford, UK, 1989.
[8] K. Sekine, One Piece Flow: Cell Design for Transforming the
Production Process. Portland, Oregon Productivity Press, 1992
[9] K. Sekine and K. Arai, Kaizen for Quick Changeover: Going Beyond
SMED, Productivity Press, Portland, OR, 1992.
[10] S. A. Irani, Handbook of Cellular Manufacturing Systems. New York,
John Wiley, 1999Defects
[11] A. Villa and C. Bandera, “Optimization of Production Flow Patterns by
use of Intelligent CAD Tools” Annals of the CIRP, Vol. 40/12/1991.
Vladimír Modrák obtained PhD degree in Mechanical Engineering
Technology in 1989. Begin with 2003 he is in position of head of Department
of Manufacturing Technologies at Technical University of Košice, Faculty of
manufacturing Technologies. He became a Full Professor in Manufacturing
Technologies in 2007.
Fig. 9 Product layout disposition after transformation
IV. CONCLUSION
Presented transformation of production process can be
viewed as perspective way of optimization of material flows
by changing production equipment layout and achieving the
goals of company logistics. In generally, material flow
optimization belongs among complex engineering and
managerial problems, which have not been satisfactorily
solved yet. Obviously, this complexity could not be presented
in above research in a full scale. Conducting this study from
one side helped to verify the effectiveness of decision-making
523](https://image.slidesharecdn.com/facilityandlayoutdesigncasestudy-120410024329-phpapp01/85/Facility-Layout-Design-Case-Study-5-320.jpg)

This case study examines transforming a company's production process from batch to cellular manufacturing through cell formation and optimizing material flows. The company produces bicycle components in batches using semi-automatic machines. The study applies production flow analysis and one-piece flow concepts to rearrange equipment into cells and transform discrete batch flows into continuous one-piece flows. Key aspects of the transformation included analyzing current product-quantity ratios to determine new layouts, minimizing in-process inventory through one-piece production, and inspecting pieces individually to enable zero-defect production. The goal was to change from a planning-centered batch process to a more flexible and responsive one-piece production system.


