Daily Technical Report:12 April 2019
•
0 likes•12 views

The Nifty index opened flat but gained momentum late in the day, closing up 12 points near its daily high. On the daily chart, Nifty has formed a bullish candle with lower shadows, indicating buying at lower levels. It has found support at its 20-day simple moving average. The index is trading between 11700-11550 and a break above 11630 could lead it toward 11680-11700, while a break below 11550 risks a fall to 11500-11470. Technical indicators point to continued short to medium term strength in the index.

Recommended
Recommended
More Related Content
What's hot
What's hot (20)
Similar to Daily Technical Report:12 April 2019
Similar to Daily Technical Report:12 April 2019 (15)
More from Axis Direct
More from Axis Direct (20)
Recently uploaded
Recently uploaded (20)
Daily Technical Report:12 April 2019
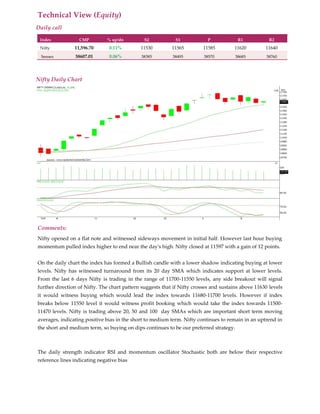
- 1. Technical View (Equity) Daily call Index CMP % up/dn S2 S1 P R1 R2 Nifty 11,596.70 0.11% 11530 11565 11585 11620 11640 Sensex 38607.01 0.06% 38385 38495 38570 38685 38760 Nifty Daily Chart Comments: Nifty opened on a flat note and witnessed sideways movement in initial half. However last hour buying momentum pulled index higher to end near the day's high. Nifty closed at 11597 with a gain of 12 points. On the daily chart the index has formed a Bullish candle with a lower shadow indicating buying at lower levels. Nifty has witnessed turnaround from its 20 day SMA which indicates support at lower levels. From the last 6 days Nifty is trading in the range of 11700-11550 levels, any side breakout will signal further direction of Nifty. The chart pattern suggests that if Nifty crosses and sustains above 11630 levels it would witness buying which would lead the index towards 11680-11700 levels. However if index breaks below 11550 level it would witness profit booking which would take the index towards 11500- 11470 levels. Nifty is trading above 20, 50 and 100 day SMAs which are important short term moving averages, indicating positive bias in the short to medium term. Nifty continues to remain in an uptrend in the short and medium term, so buying on dips continues to be our preferred strategy. The daily strength indicator RSI and momentum oscillator Stochastic both are below their respective reference lines indicating negative bias
- 2. The trend deciding level for the day is 11585. If NIFTY trades above this level then we may witness a further rally up to 11620-11640-11675 levels. However, if NIFTY trades below 11585 levels then we may see some profit booking initiating in the market, which may correct up to 11565-11530-11505 levels STOCKS IDEAS FOR THE DAY Company Name BUY/SELL RANGE Stop Loss Target ACC BUY Above 1680 1665 1700/1720 KSCL BUY Above 481 477 486/490