Weekly Technical Report :30 April 2019
•
0 likes•12 views

Axis Direct presents daily derivatives report presenting recommendations based on technical analysis. For trading in derivatives visit https://simplehai.axisdirect.in/offerings/products/derivatives

Recommended
Recommended
More Related Content
What's hot
What's hot (20)
Similar to Weekly Technical Report :30 April 2019
Similar to Weekly Technical Report :30 April 2019 (20)
More from Axis Direct
More from Axis Direct (20)
Recently uploaded
Recently uploaded (20)
Weekly Technical Report :30 April 2019
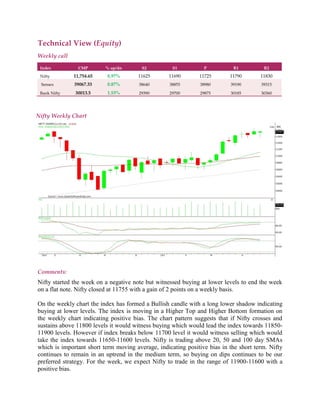
- 1. Technical View (Equity) Weekly call Index CMP % up/dn S2 S1 P R1 R2 Nifty 11,754.65 0.97% 11625 11690 11725 11790 11830 Sensex 39067.33 0.87% 38640 38855 38980 39190 39315 Bank Nifty 30013.5 1.53% 29390 29700 29875 30185 30360 Nifty Weekly Chart Comments: Nifty started the week on a negative note but witnessed buying at lower levels to end the week on a flat note. Nifty closed at 11755 with a gain of 2 points on a weekly basis. On the weekly chart the index has formed a Bullish candle with a long lower shadow indicating buying at lower levels. The index is moving in a Higher Top and Higher Bottom formation on the weekly chart indicating positive bias. The chart pattern suggests that if Nifty crosses and sustains above 11800 levels it would witness buying which would lead the index towards 11850- 11900 levels. However if index breaks below 11700 level it would witness selling which would take the index towards 11650-11600 levels. Nifty is trading above 20, 50 and 100 day SMAs which is important short term moving average, indicating positive bias in the short term. Nifty continues to remain in an uptrend in the medium term, so buying on dips continues to be our preferred strategy. For the week, we expect Nifty to trade in the range of 11900-11600 with a positive bias.
- 2. The weekly strength indicator RSI is moving upwards and is quoting above its reference line indicating positive bias. However momentum oscillator Stochastic has turned negative from the overbought zone indicating a possible consolidation or a down move in the near term The trend deciding level for the day is 11725. If NIFTY trades above this level then we may witness a further rally up to 11790-11830-11890 levels. However, if NIFTY trades below 11725 levels then we may see some profit booking initiating in the market, which may correct up to 11690-11625-11590 levels Bank Nifty Weekly Chart Bank Nifty started the week on positive note however it witnessed selling pressure at higher levels making a low around 29435 levels. Short covering along with buying support at lower levels led index to close at 30014 with a loss of 210 points on a weekly basis. On the weekly chart the index has formed a Bearish candle with a long lower shadow indicating buying at lower levels. The chart pattern suggests that if Bank Nifty crosses and sustains above 30200 levels it would witness buying which would lead the index towards 30400-30500 levels. However if index breaks below 29800 level it would witness selling which would take the index towards 29600-29400 levels. Bank Nifty is trading below 20 day SMA which is important short term moving averages, indicating negative bias in the short term however it manage to sustain above 50 and 100 day SMA which supports bullish sentiments in medium to long term. Bank
- 3. Nifty continues to remain in an uptrend in the medium term, so buying on dips continues to be our preferred strategy. For the week, we expect Bank Nifty to trade in the range of 30400-29400 with a positive bias. The daily strength indicator RSI is marginally above its reference line while momentum oscillator Stochastic has turned negative indicating negative bias. The trend deciding level for the day is 38980. If BANK NIFTY trades above this level then we may witness a further rally up to 39190-39315-39530 levels. However, if BANK NIFTY trades below 38980 levels then we may see some profit booking initiating in the market, which may correct up to 38855-38640-38515 levels STOCKS IDEAS FOR THE DAY Company Name BUY/SELL CMP Stop Loss Target AUBANK BUY Above 639 634 645/650 KOTAKBANK BUY Above 1382 1370 1395/1410