Downloaded 125 times

This document contains three examples of descriptive statistics: 1. Roger Ebert's movie rating frequencies which show the distribution of his ratings. The median and most common rating was 3.0 stars. 2. Profit margins for department stores in 1925, with measures like the mean, standard deviation, and percentiles. 3. Monthly rainfall in Philadelphia from 1825-1869, with a frequency distribution of the data.
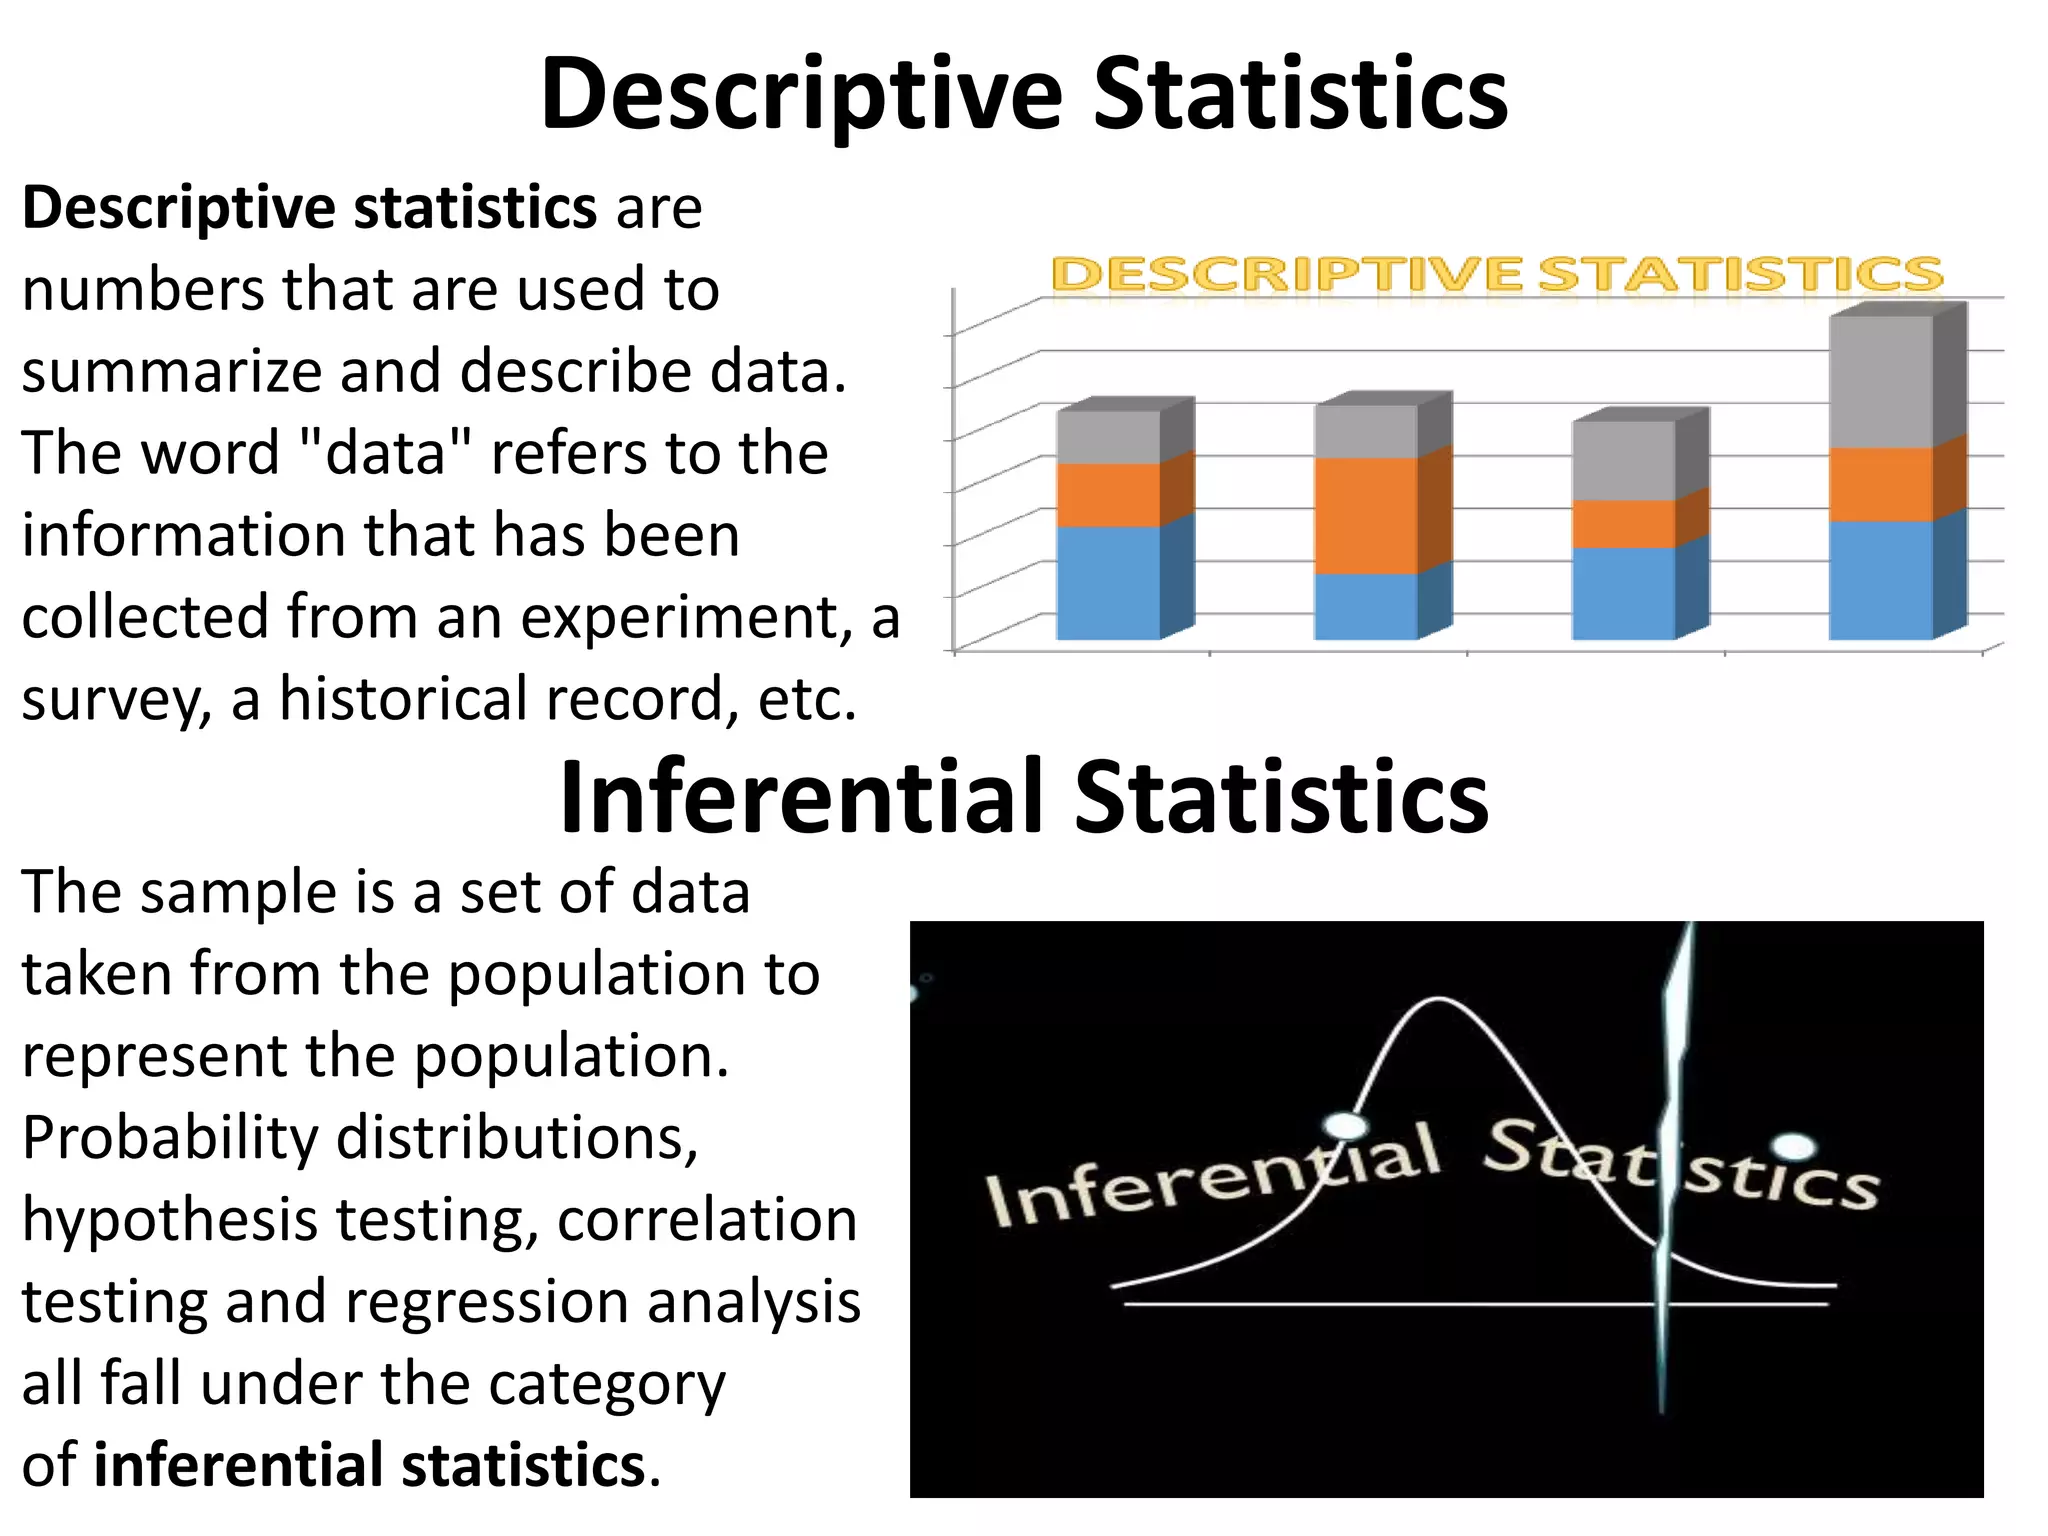
Descriptive statistics summarize data from experiments or surveys; inferential statistics use samples for hypothesis testing.
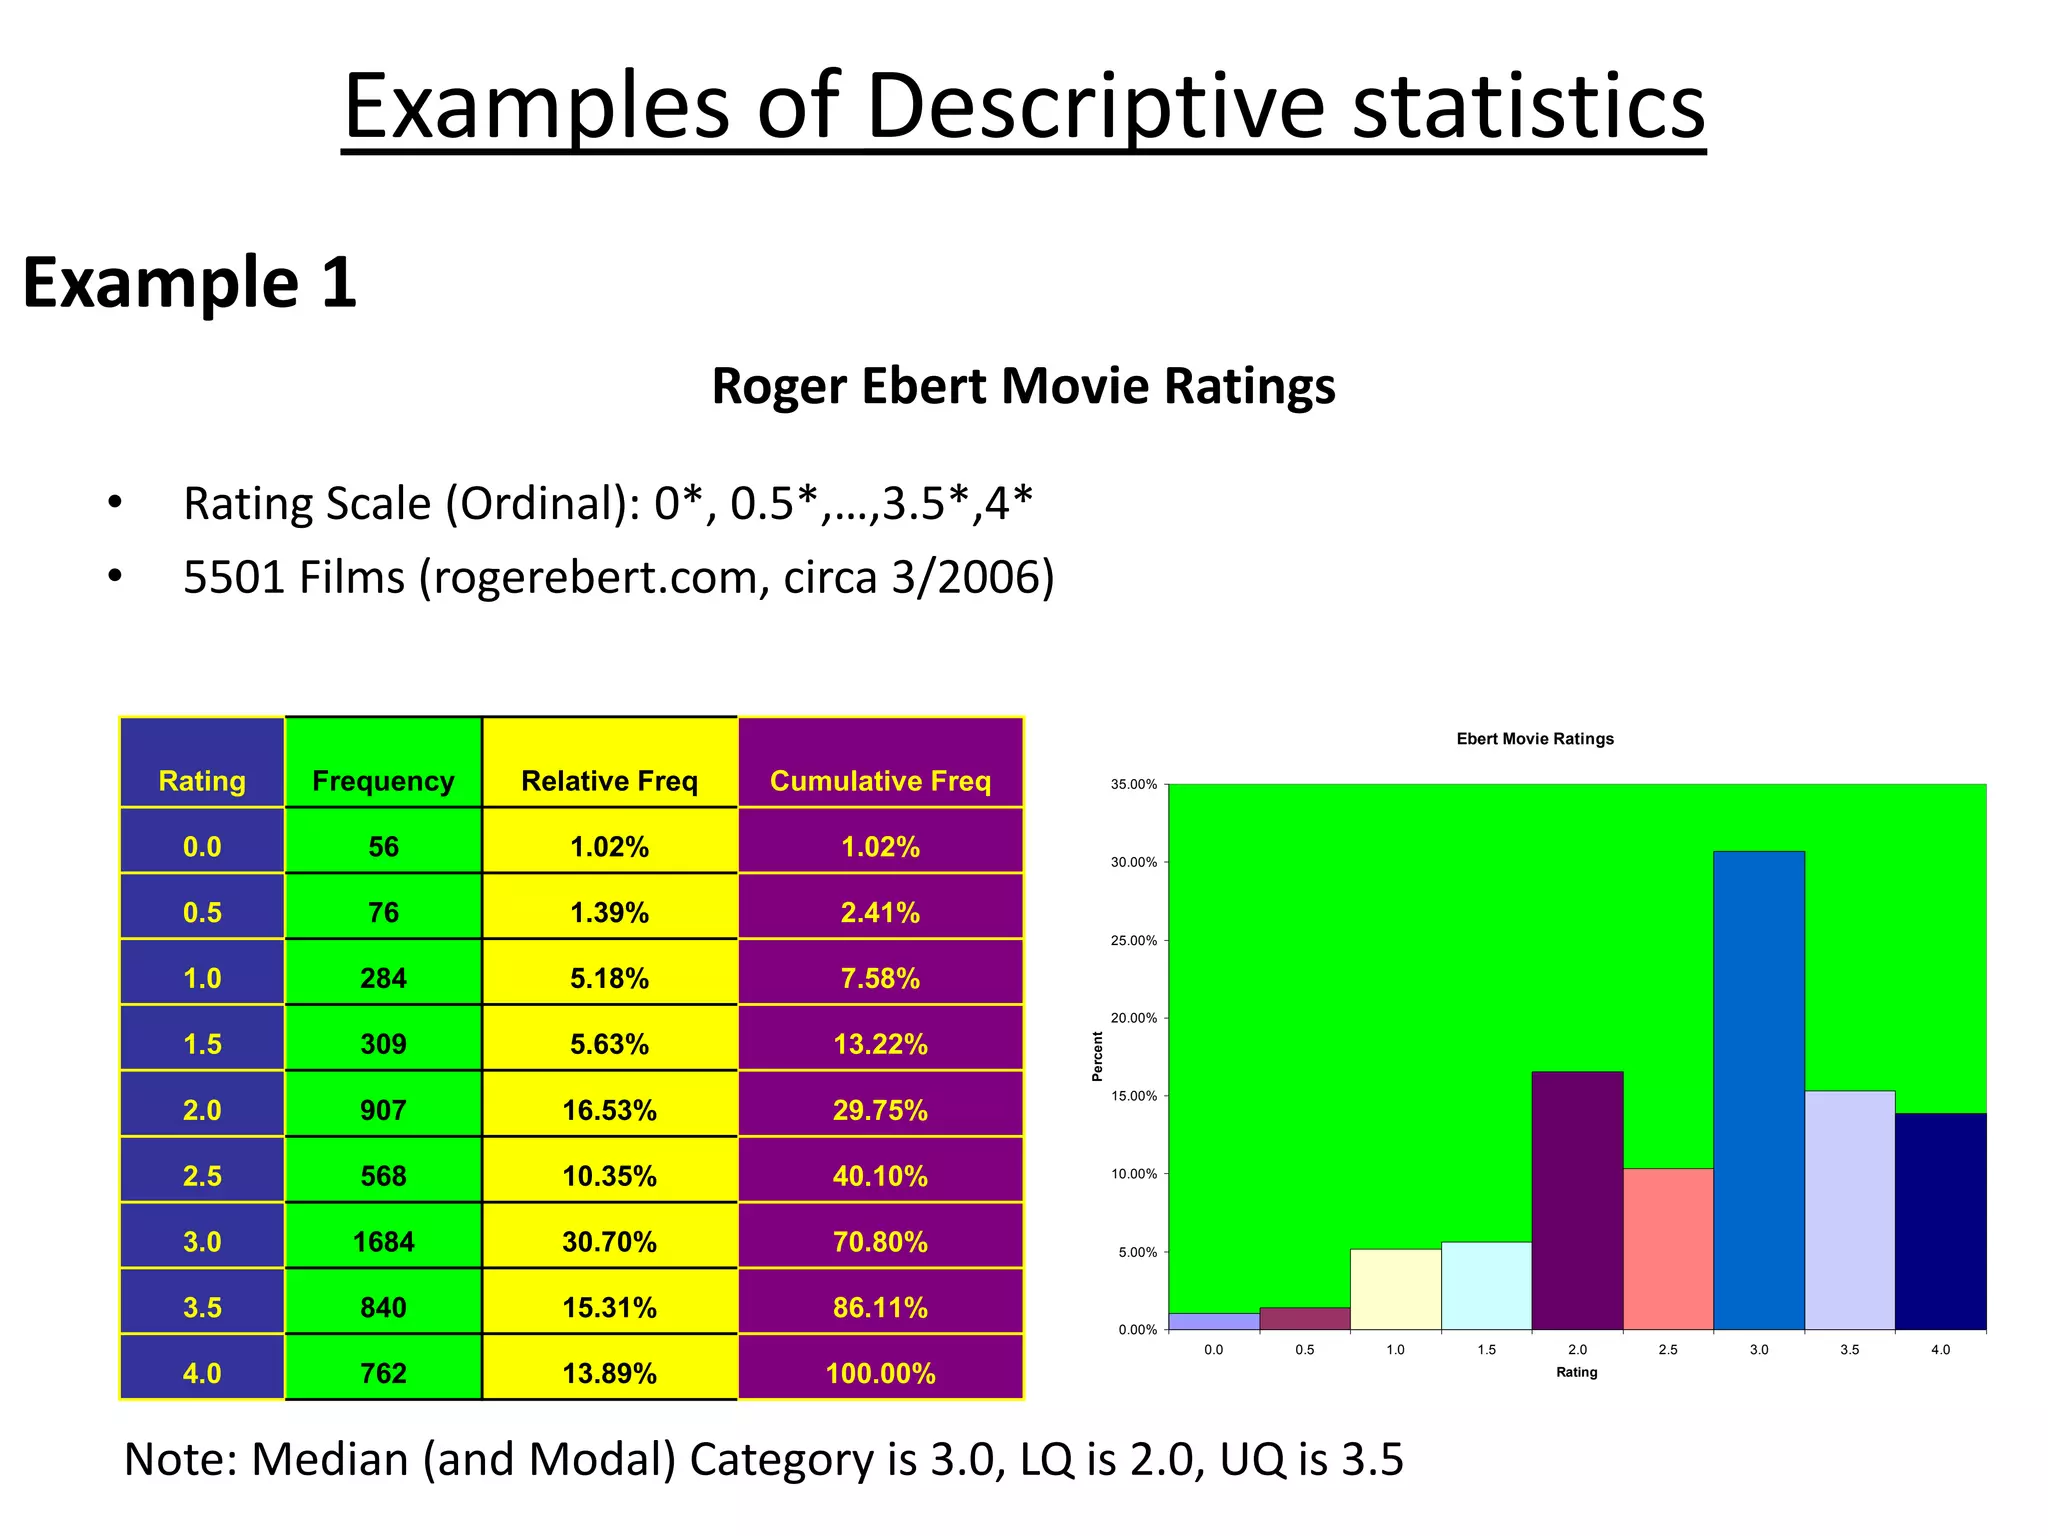
Analysis of 5501 films rated by Roger Ebert using an ordinal scale; median rating is 3.0 with various statistical measures detailed.
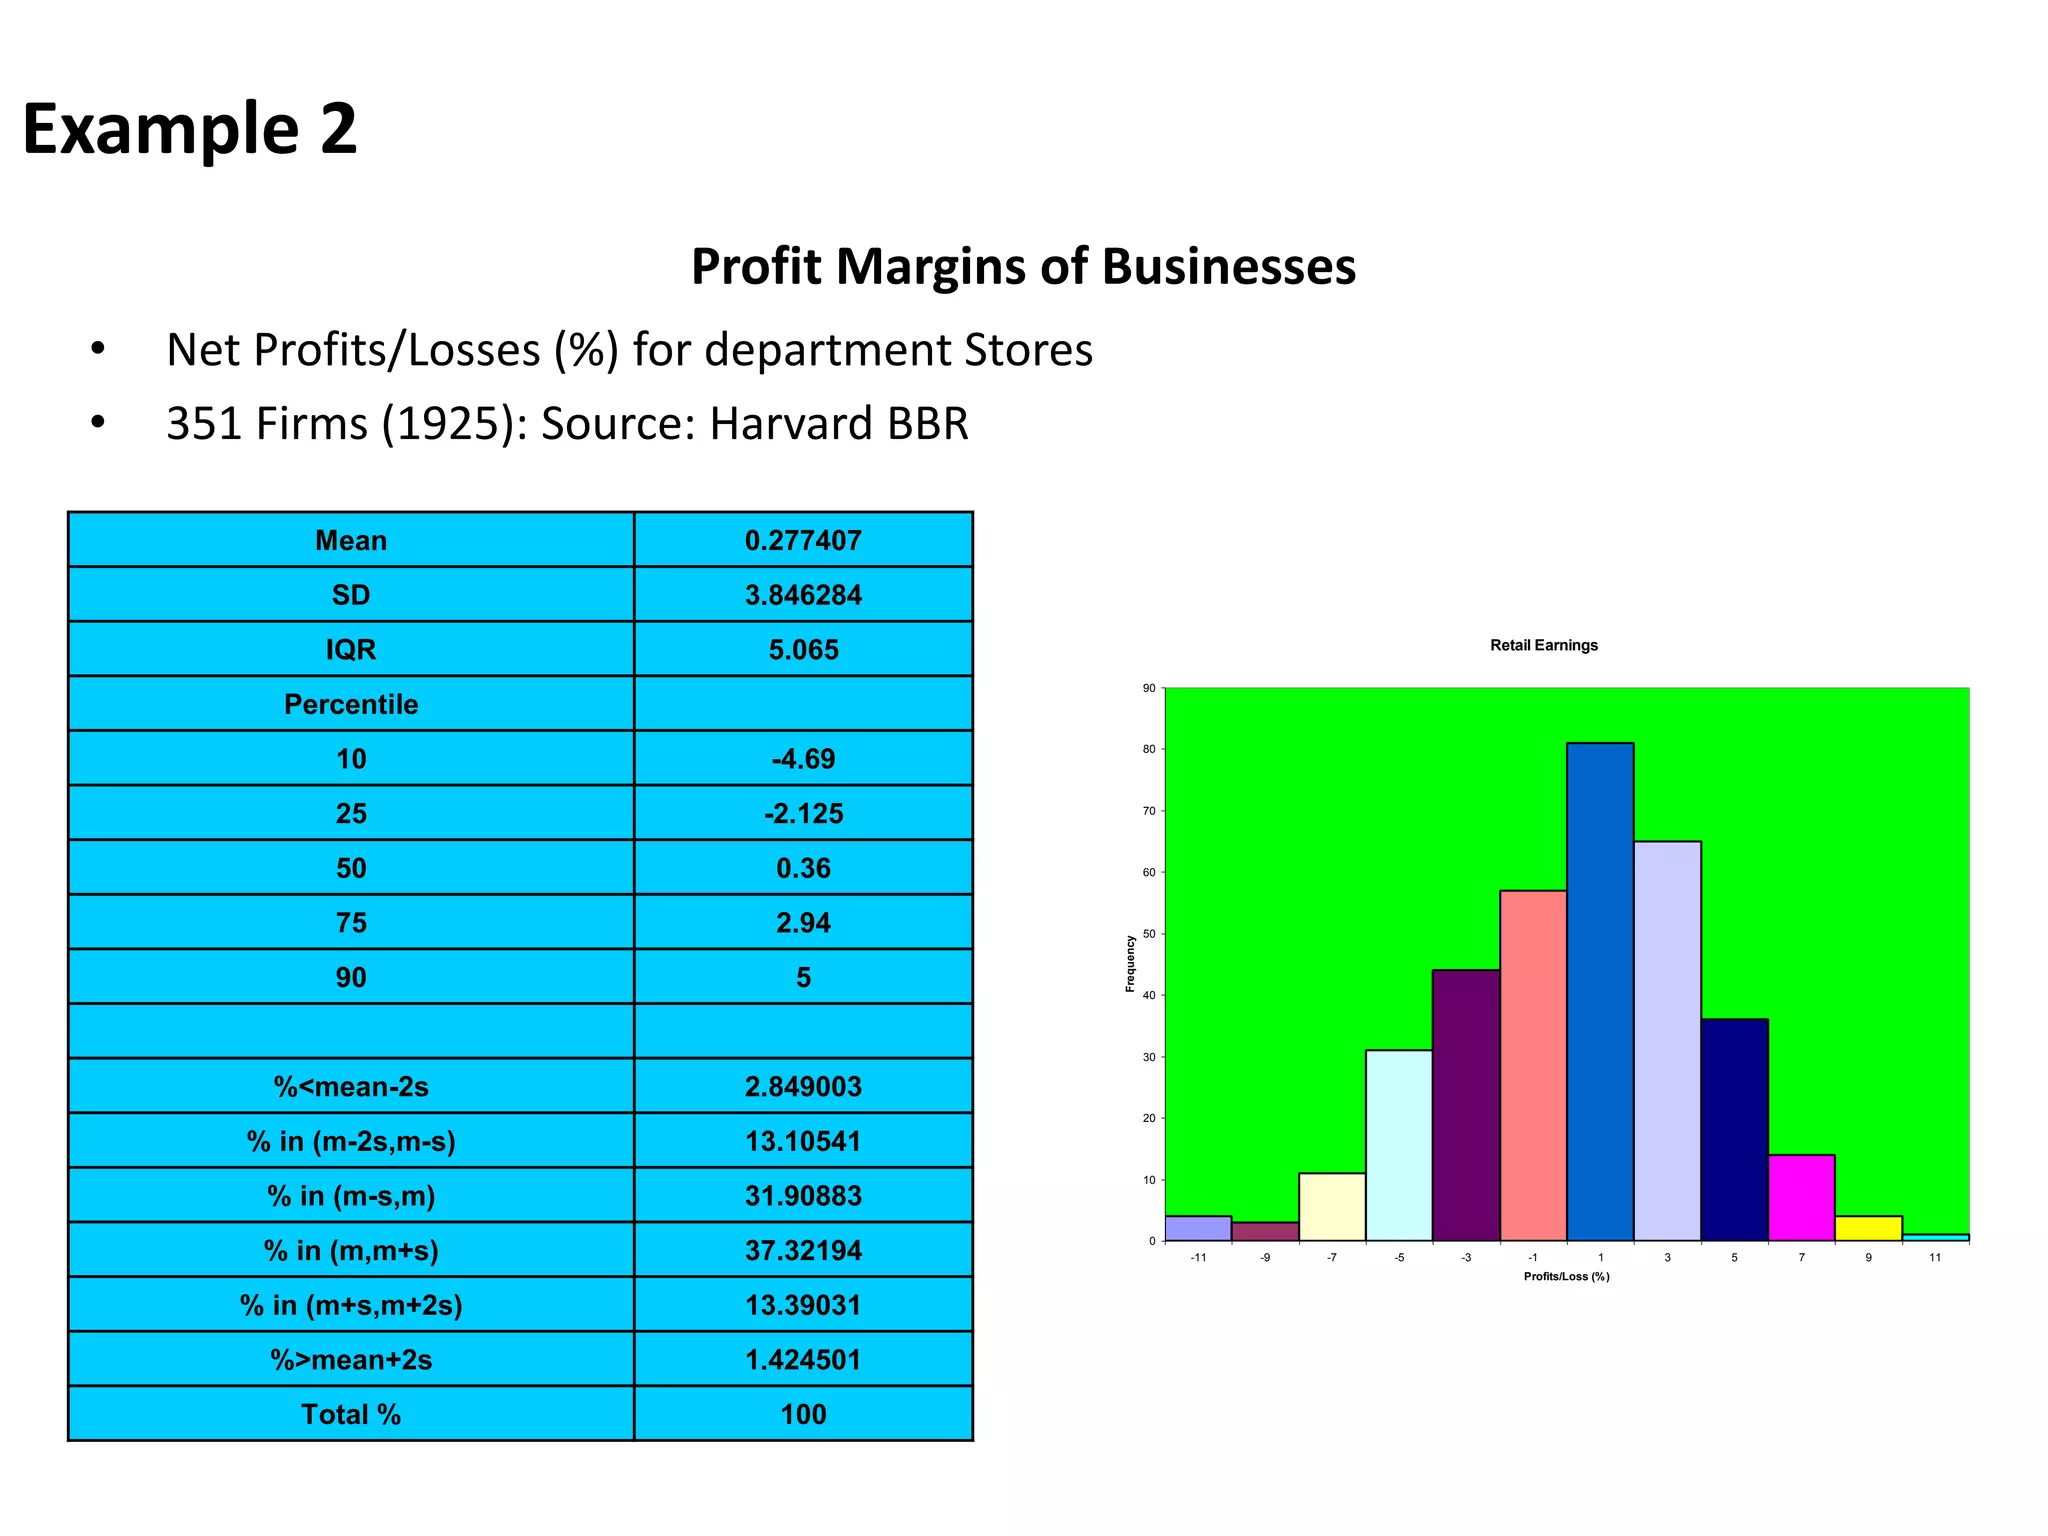
Analysis of profit margins for 351 department stores in 1925; mean profit at 0.28% with detailed statistical metrics provided.
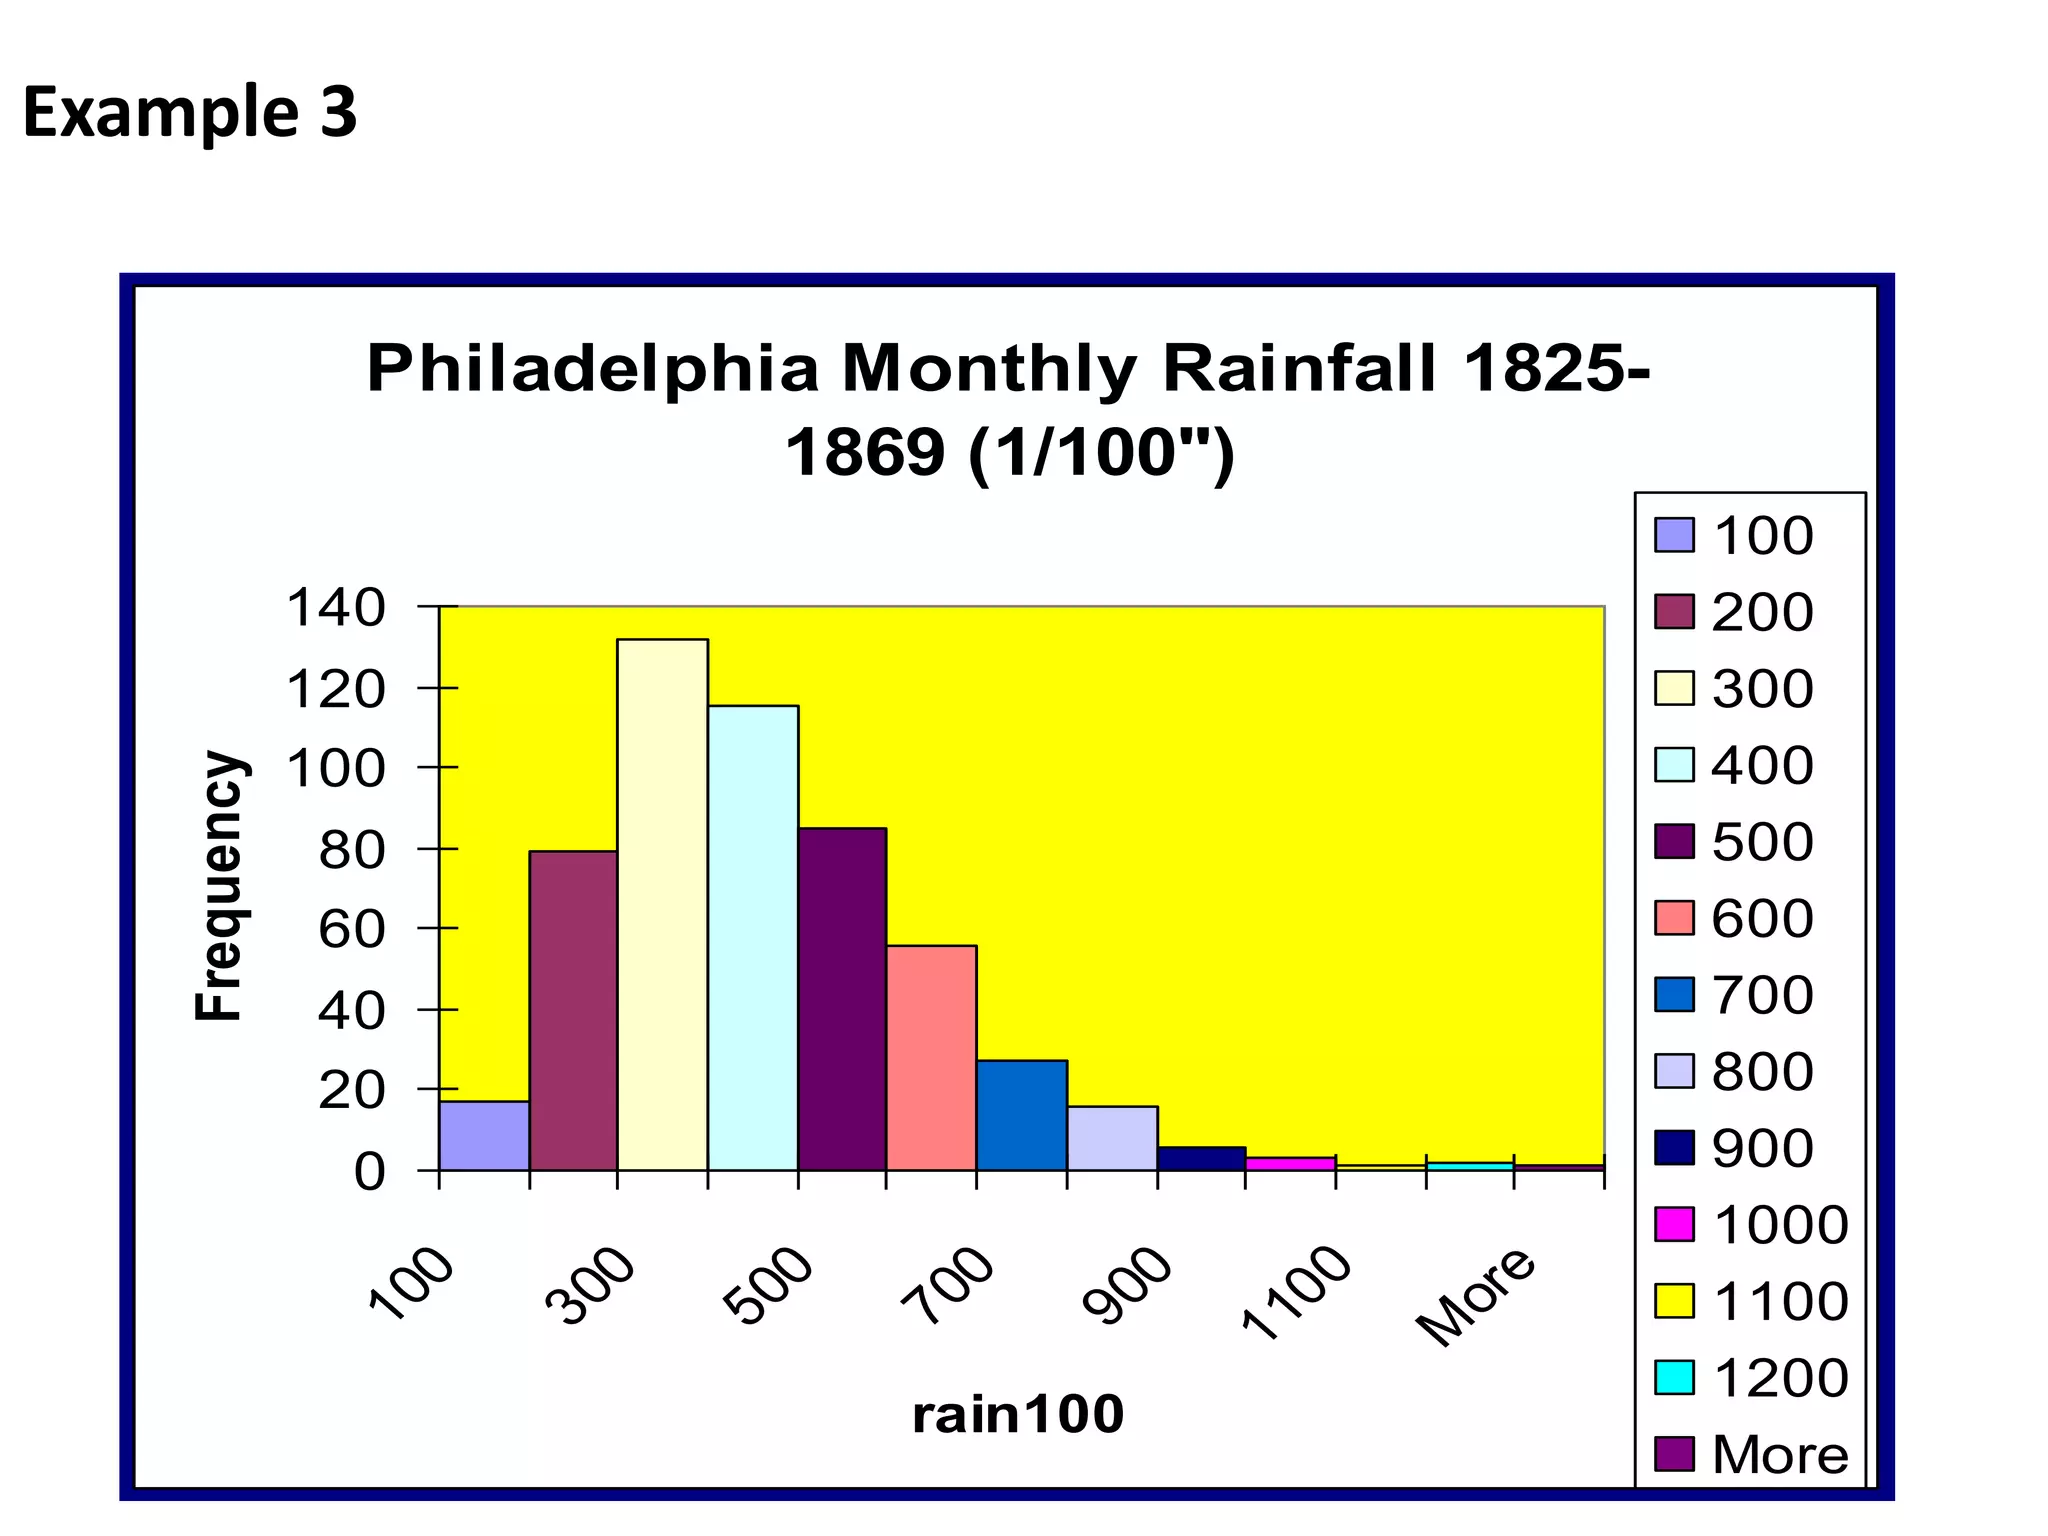
Monthly rainfall data from 1825 to 1869 in Philadelphia, illustrated with frequency distribution.


![[DSC Europe 25] Boris Perkovic - Lost in performance.pptx](https://cdn.slidesharecdn.com/ss_thumbnails/uq5hrp7vsuahqkxzifux-1-251204082258-fd2ee09d-thumbnail.jpg?width=640&height=640&fit=bounds)


![[DSC Europe 25] Jim Sterne - Adopting Generative AI Capabilities Into the Ent...](https://cdn.slidesharecdn.com/ss_thumbnails/sxhpofuorcagxsaulkmt-3-251204082258-7e66bc48-thumbnail.jpg?width=640&height=640&fit=bounds)


![[DSC Europe 25] Nikola Rajovic - Hardware Technologies Under the Hood: RISC-V...](https://cdn.slidesharecdn.com/ss_thumbnails/o2gptrmtoyqndgoshwgq-dsc2025-tenstorrent-rajovic-251205090438-814685f5-thumbnail.jpg?width=640&height=640&fit=bounds)


