statsppt this is statistics ppt for giving knowledge about this topic
2.
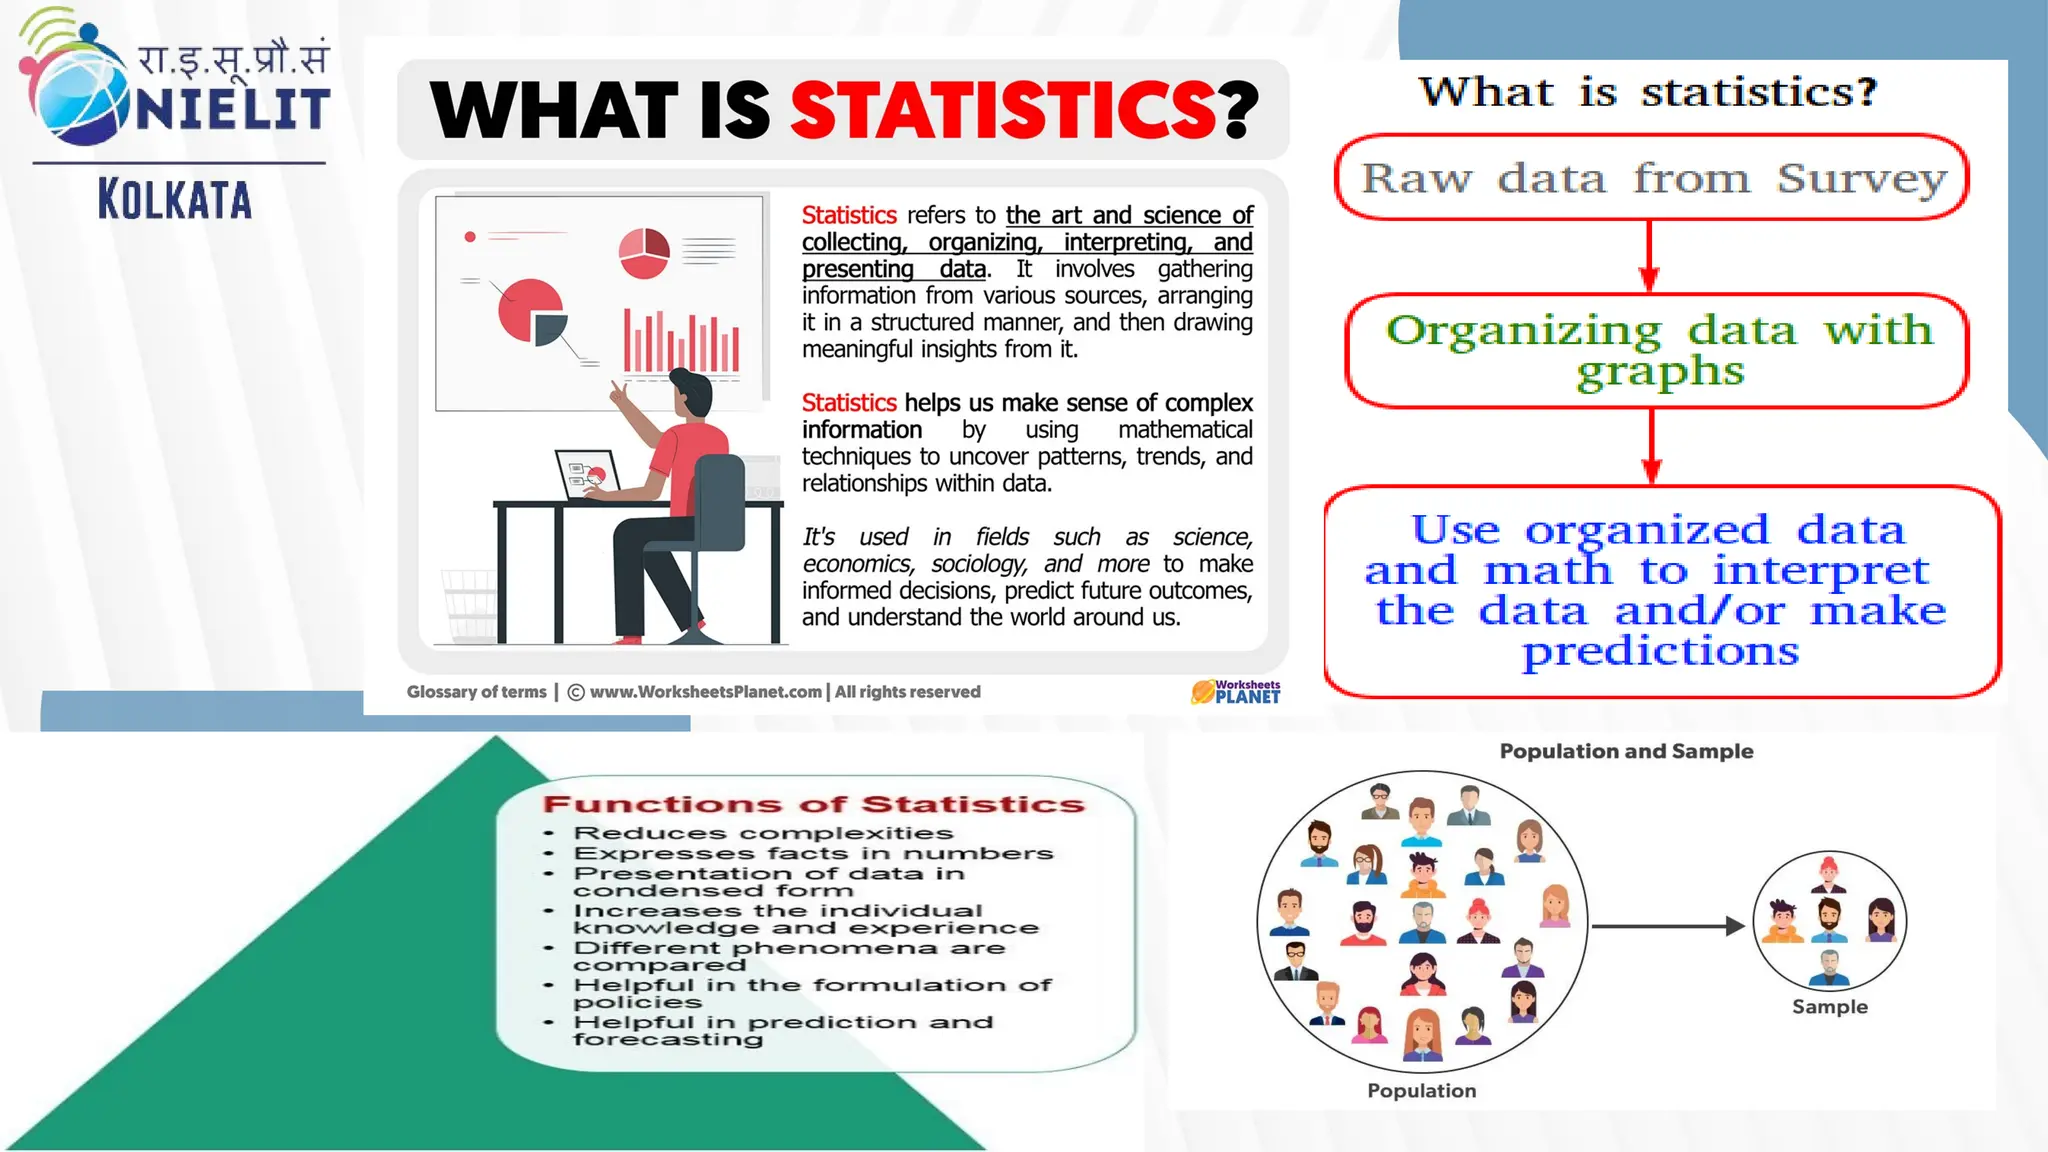
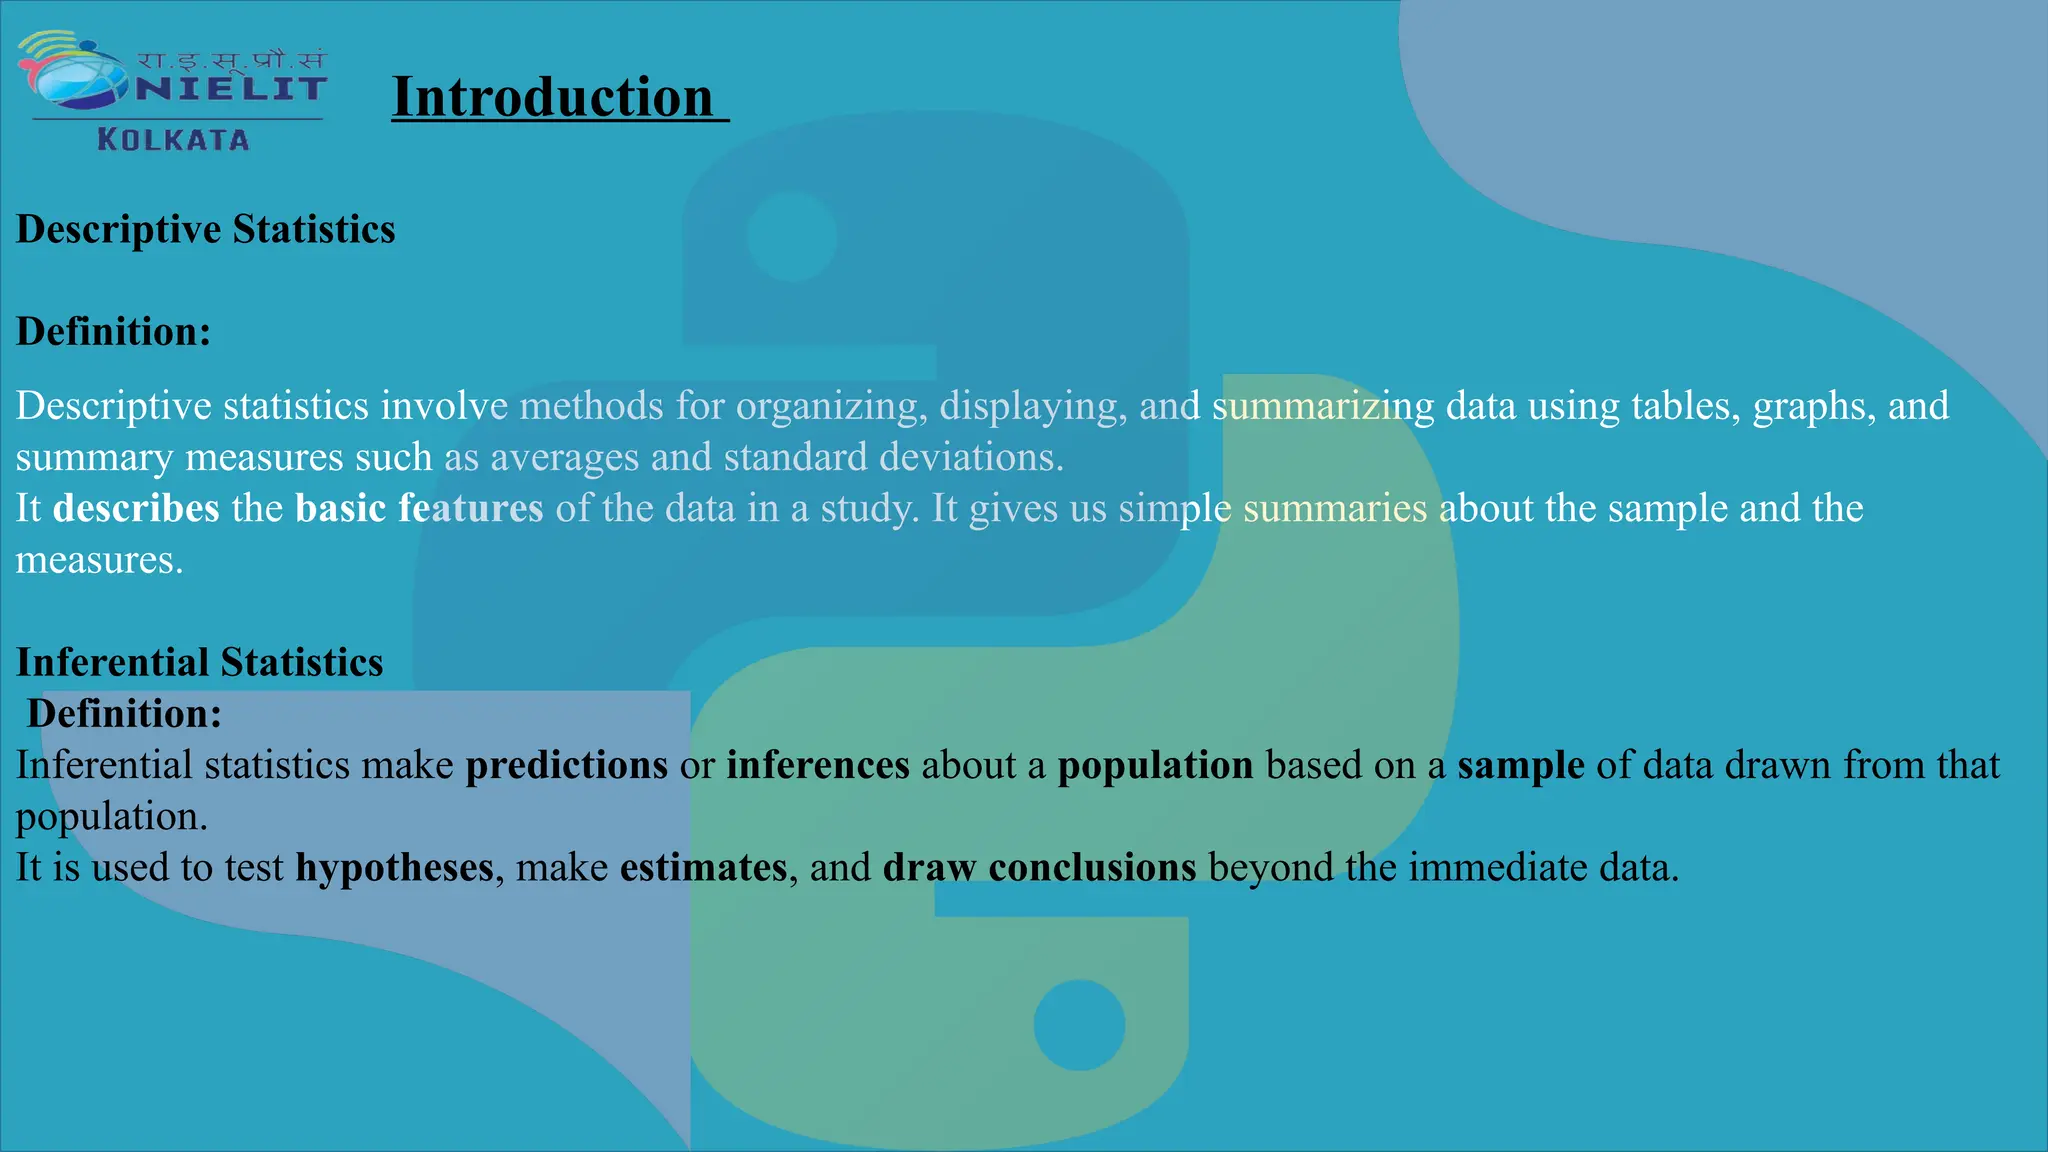
Descriptive statistics involvemethods for organizing, displaying, and summarizing data using tables, graphs, and
summary measures such as averages and standard deviations.
It describes the basic features of the data in a study. It gives us simple summaries about the sample and the
measures.
Introduction
Descriptive Statistics
Definition:
Inferential Statistics
Definition:
Inferential statistics make predictions or inferences about a population based on a sample of data drawn from that
population.
It is used to test hypotheses, make estimates, and draw conclusions beyond the immediate data.
3.
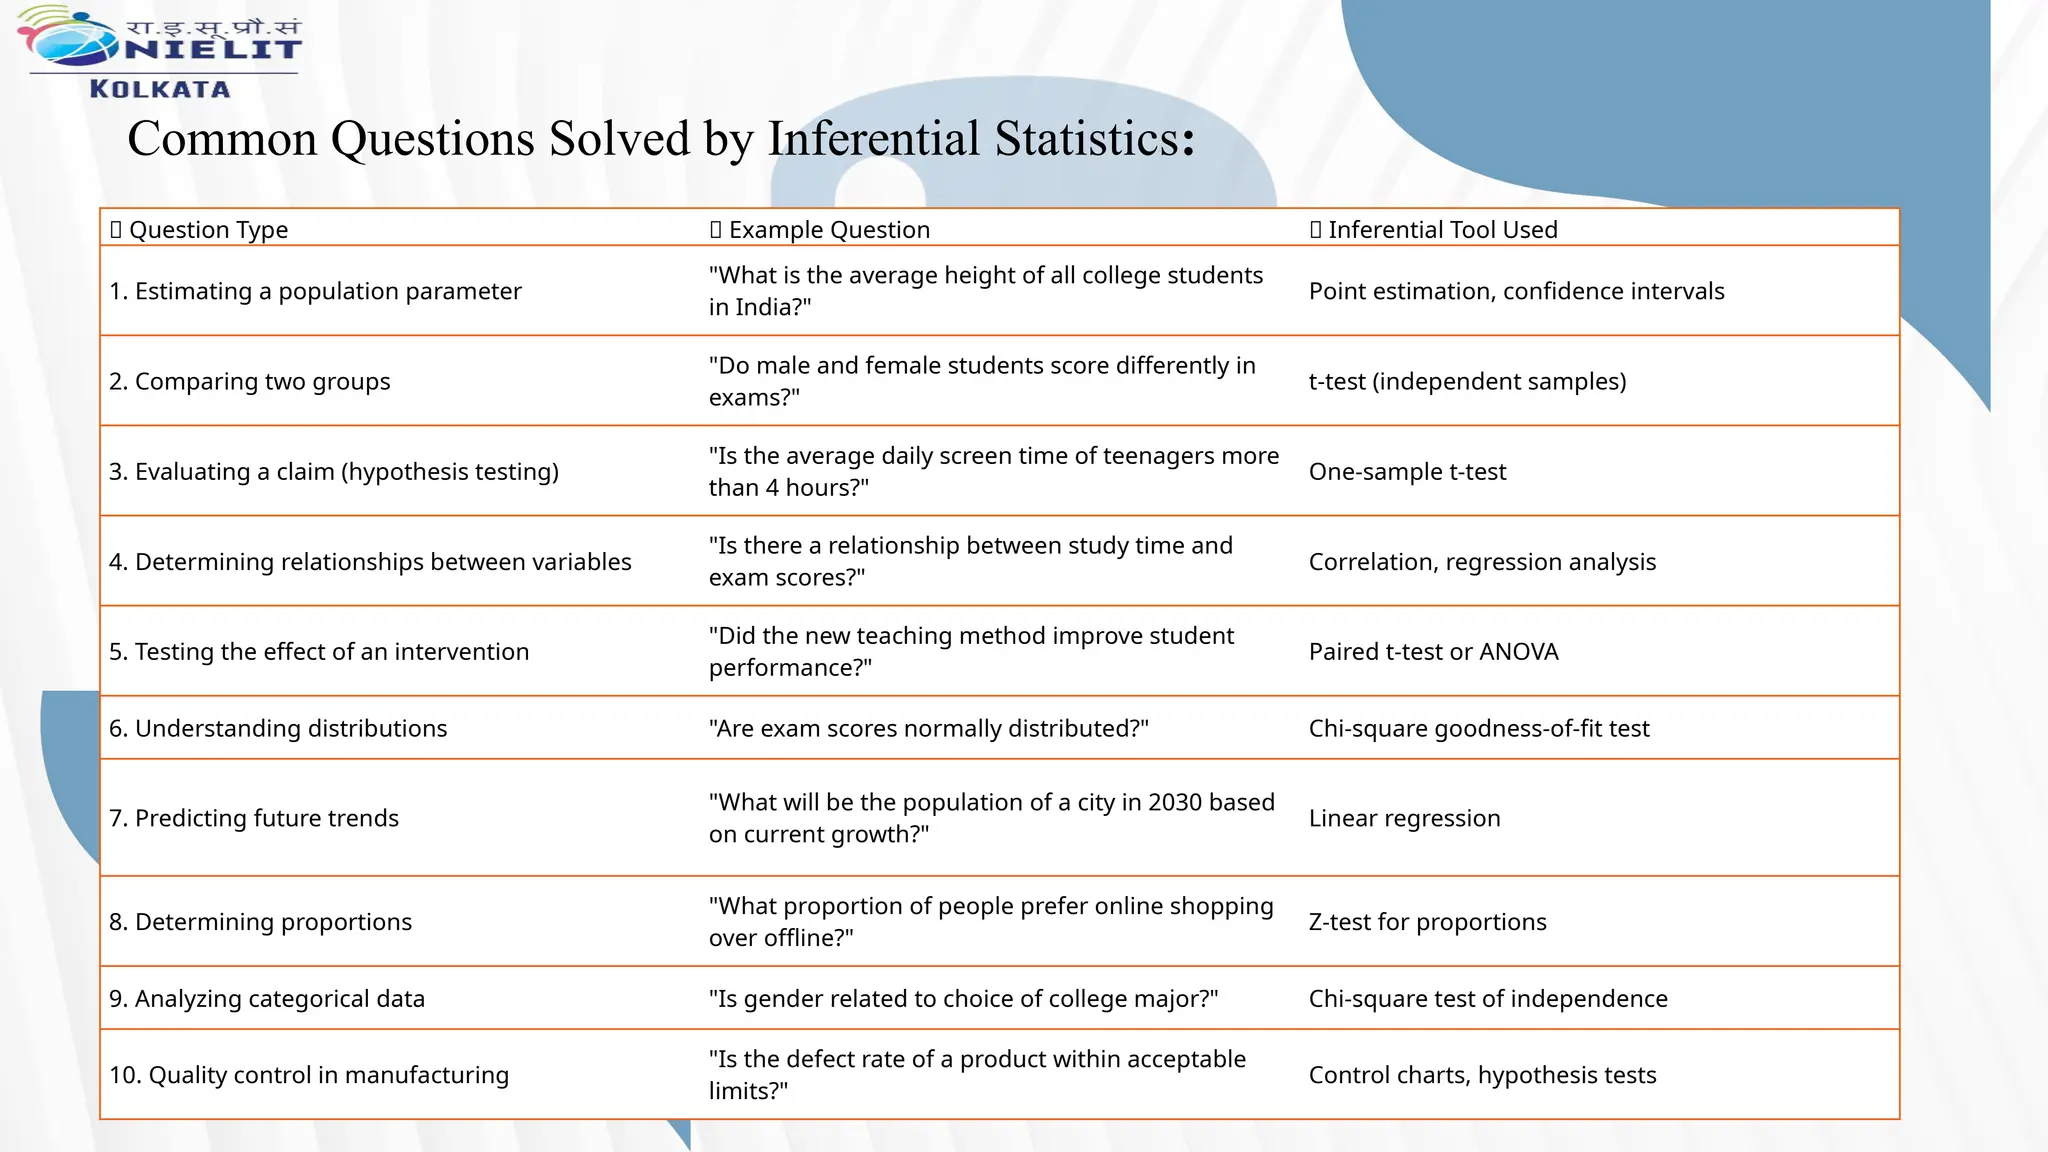
Common Questions Solvedby Inferential Statistics:
📌 Question Type 🧠 Example Question 🔧 Inferential Tool Used
1. Estimating a population parameter
"What is the average height of all college students
in India?"
Point estimation, confidence intervals
2. Comparing two groups
"Do male and female students score differently in
exams?"
t-test (independent samples)
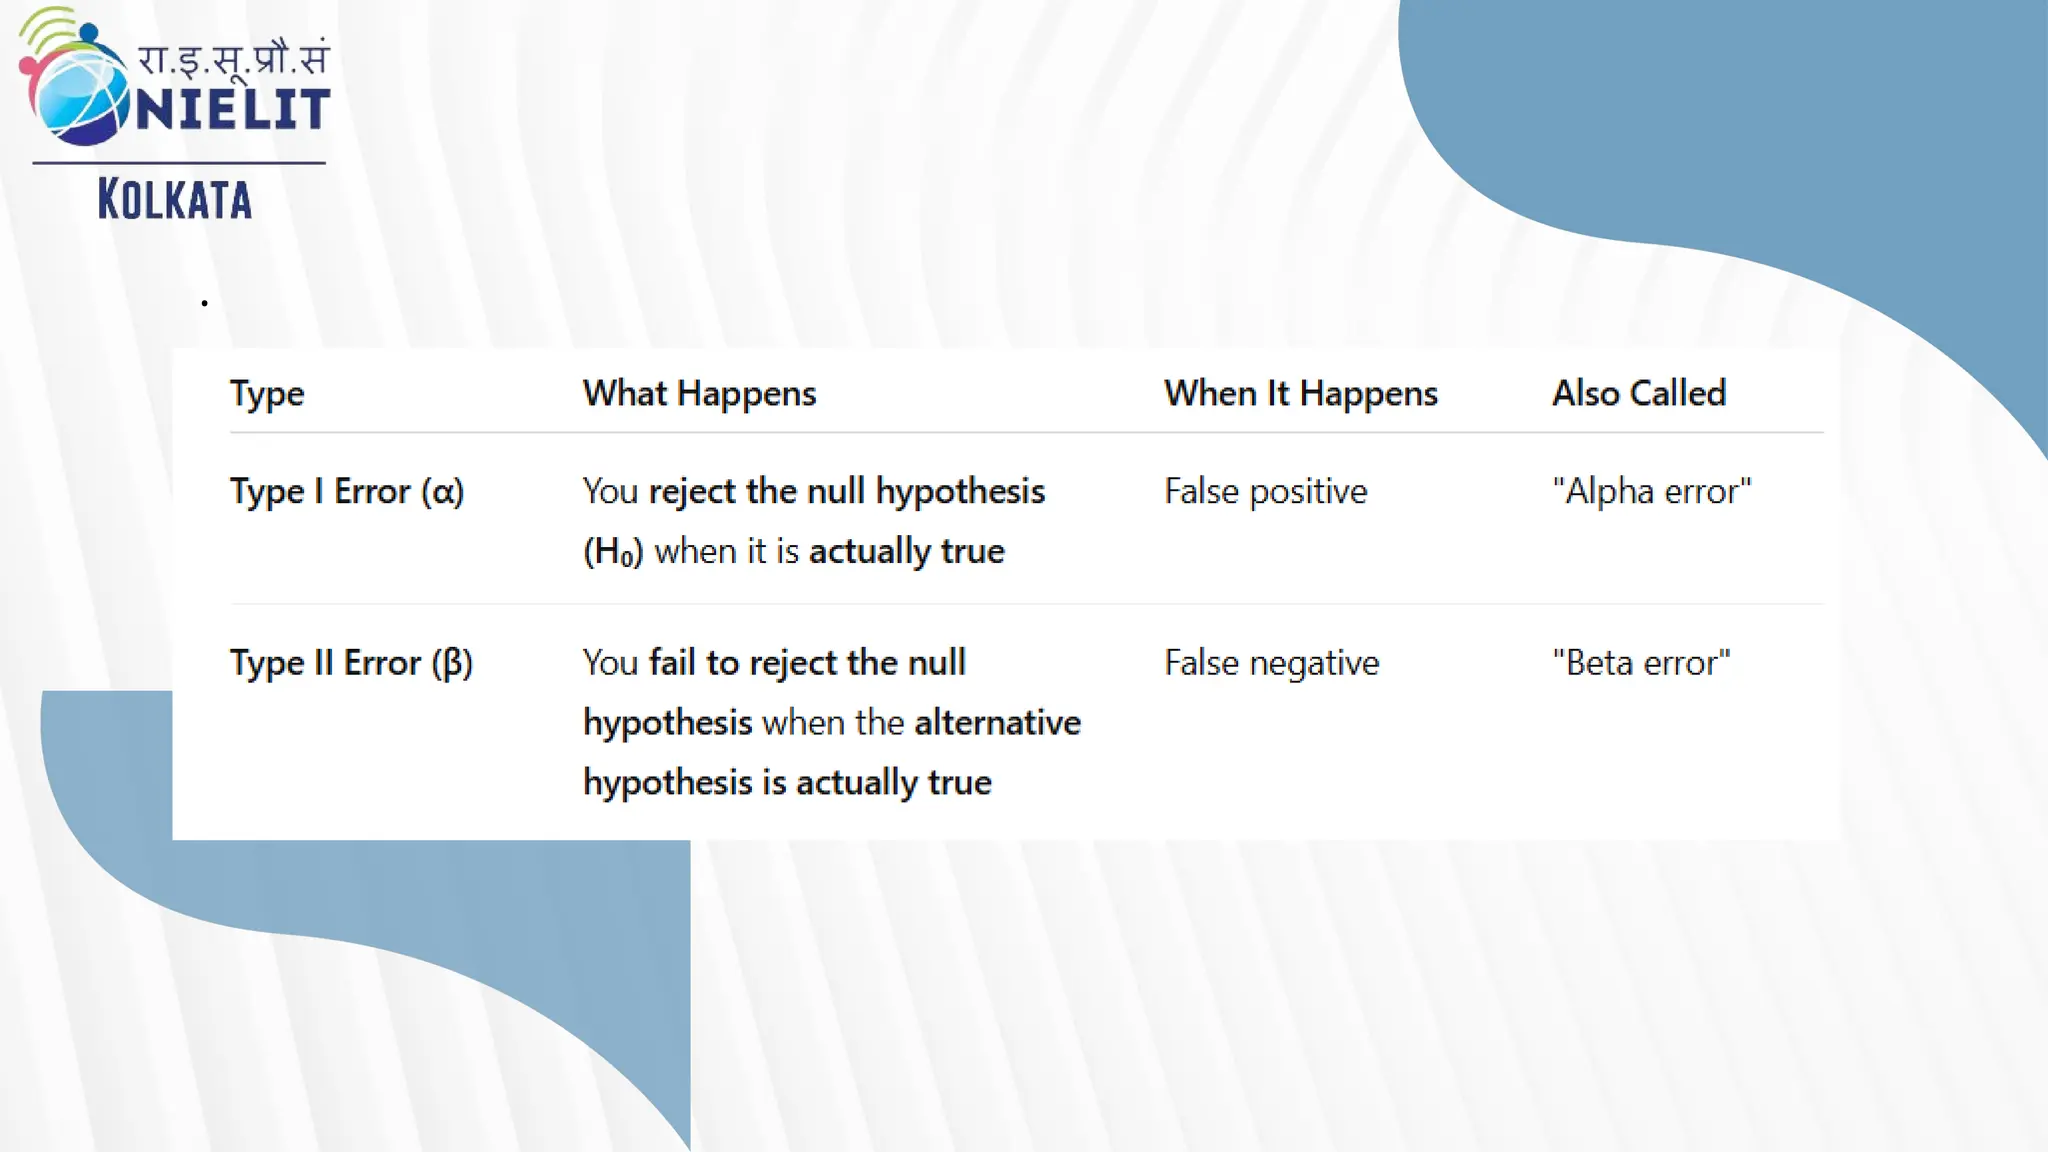
3. Evaluating a claim (hypothesis testing)
"Is the average daily screen time of teenagers more
than 4 hours?"
One-sample t-test
4. Determining relationships between variables
"Is there a relationship between study time and
exam scores?"
Correlation, regression analysis
5. Testing the effect of an intervention
"Did the new teaching method improve student
performance?"
Paired t-test or ANOVA
6. Understanding distributions "Are exam scores normally distributed?" Chi-square goodness-of-fit test
7. Predicting future trends
"What will be the population of a city in 2030 based
on current growth?"
Linear regression
8. Determining proportions
"What proportion of people prefer online shopping
over offline?"
Z-test for proportions
9. Analyzing categorical data "Is gender related to choice of college major?" Chi-square test of independence
10. Quality control in manufacturing
"Is the defect rate of a product within acceptable
limits?"
Control charts, hypothesis tests
4.
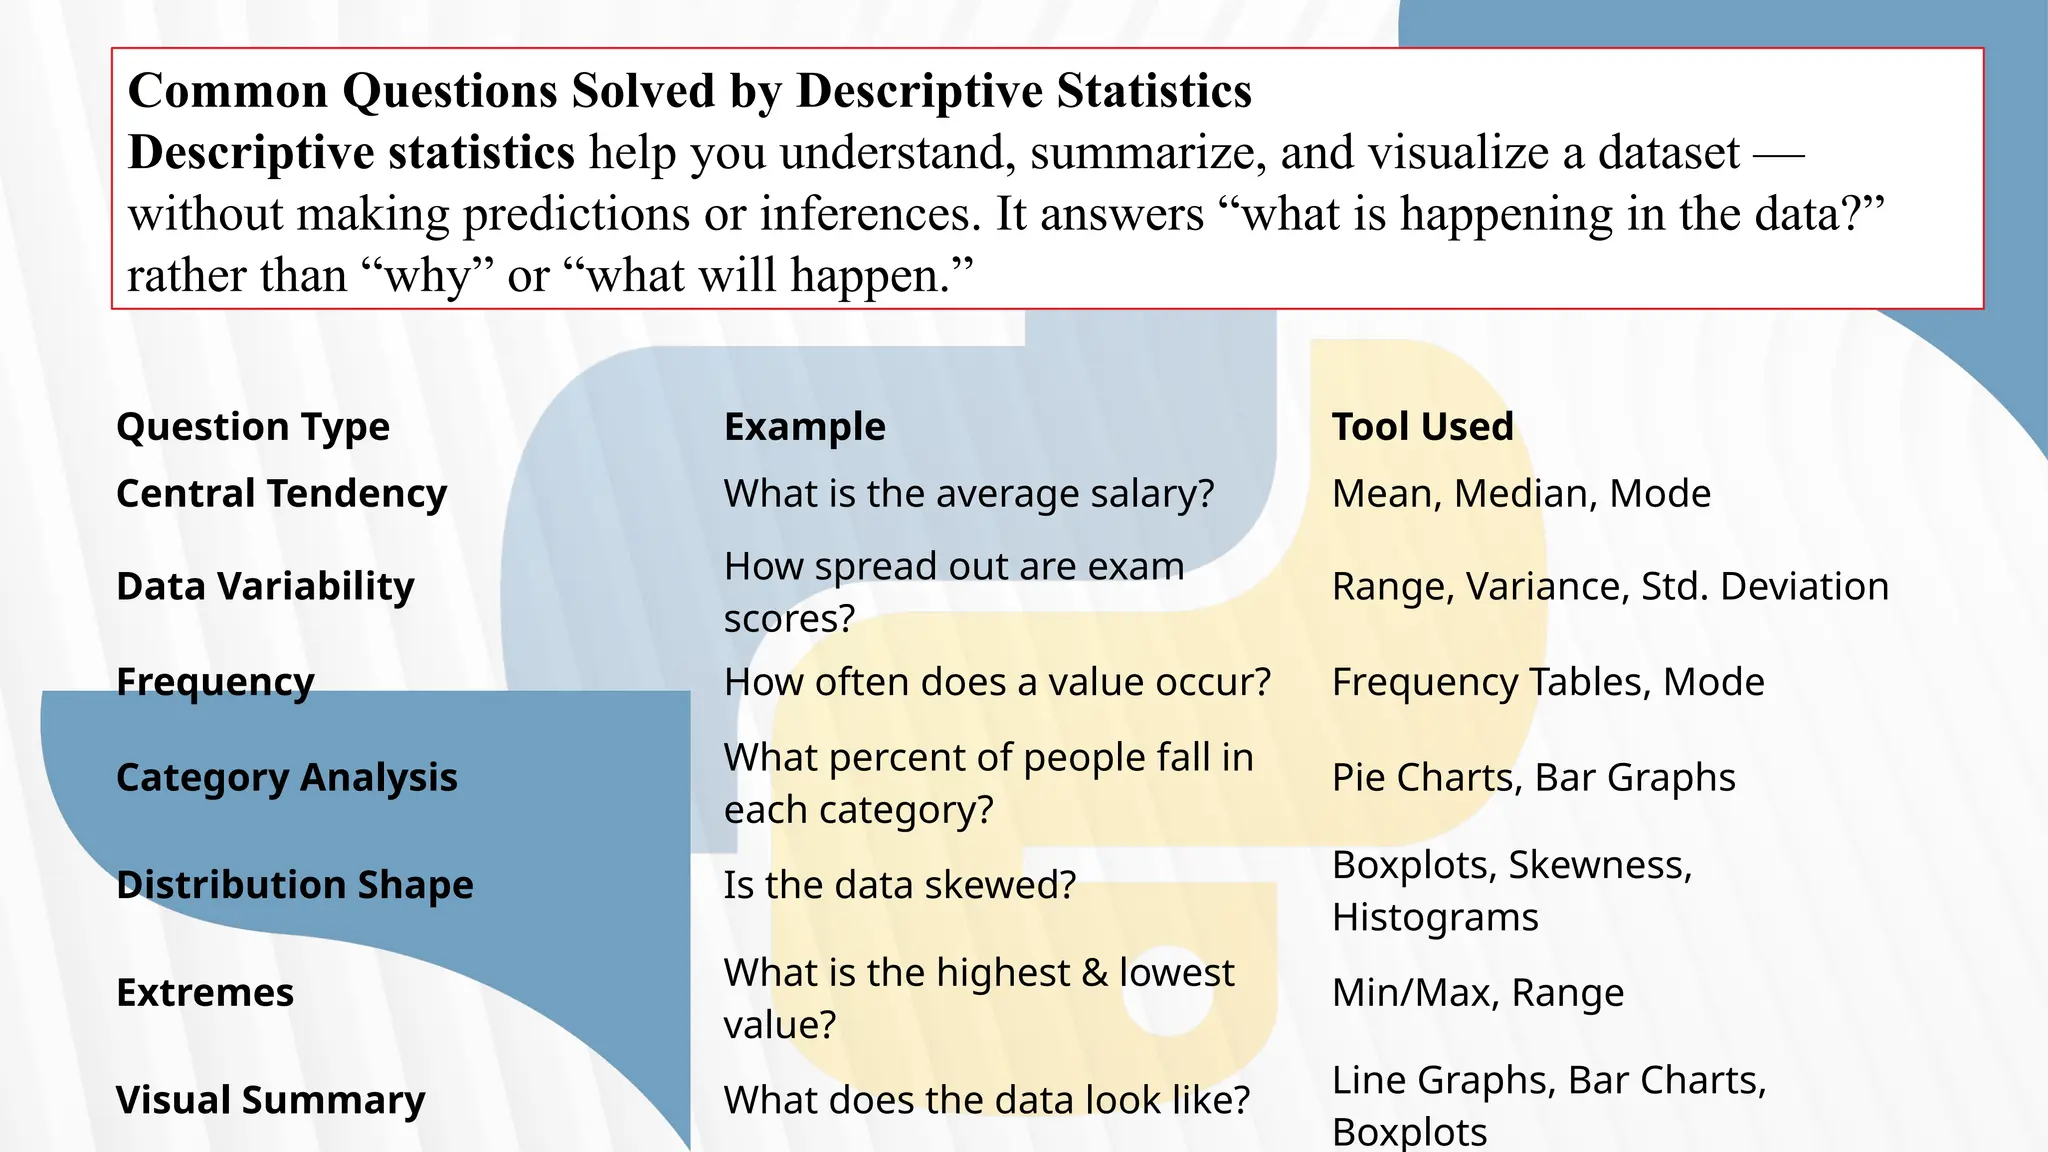
Common Questions Solvedby Descriptive Statistics
Descriptive statistics help you understand, summarize, and visualize a dataset —
without making predictions or inferences. It answers “what is happening in the data?”
rather than “why” or “what will happen.”
Question Type Example Tool Used
Central Tendency What is the average salary? Mean, Median, Mode
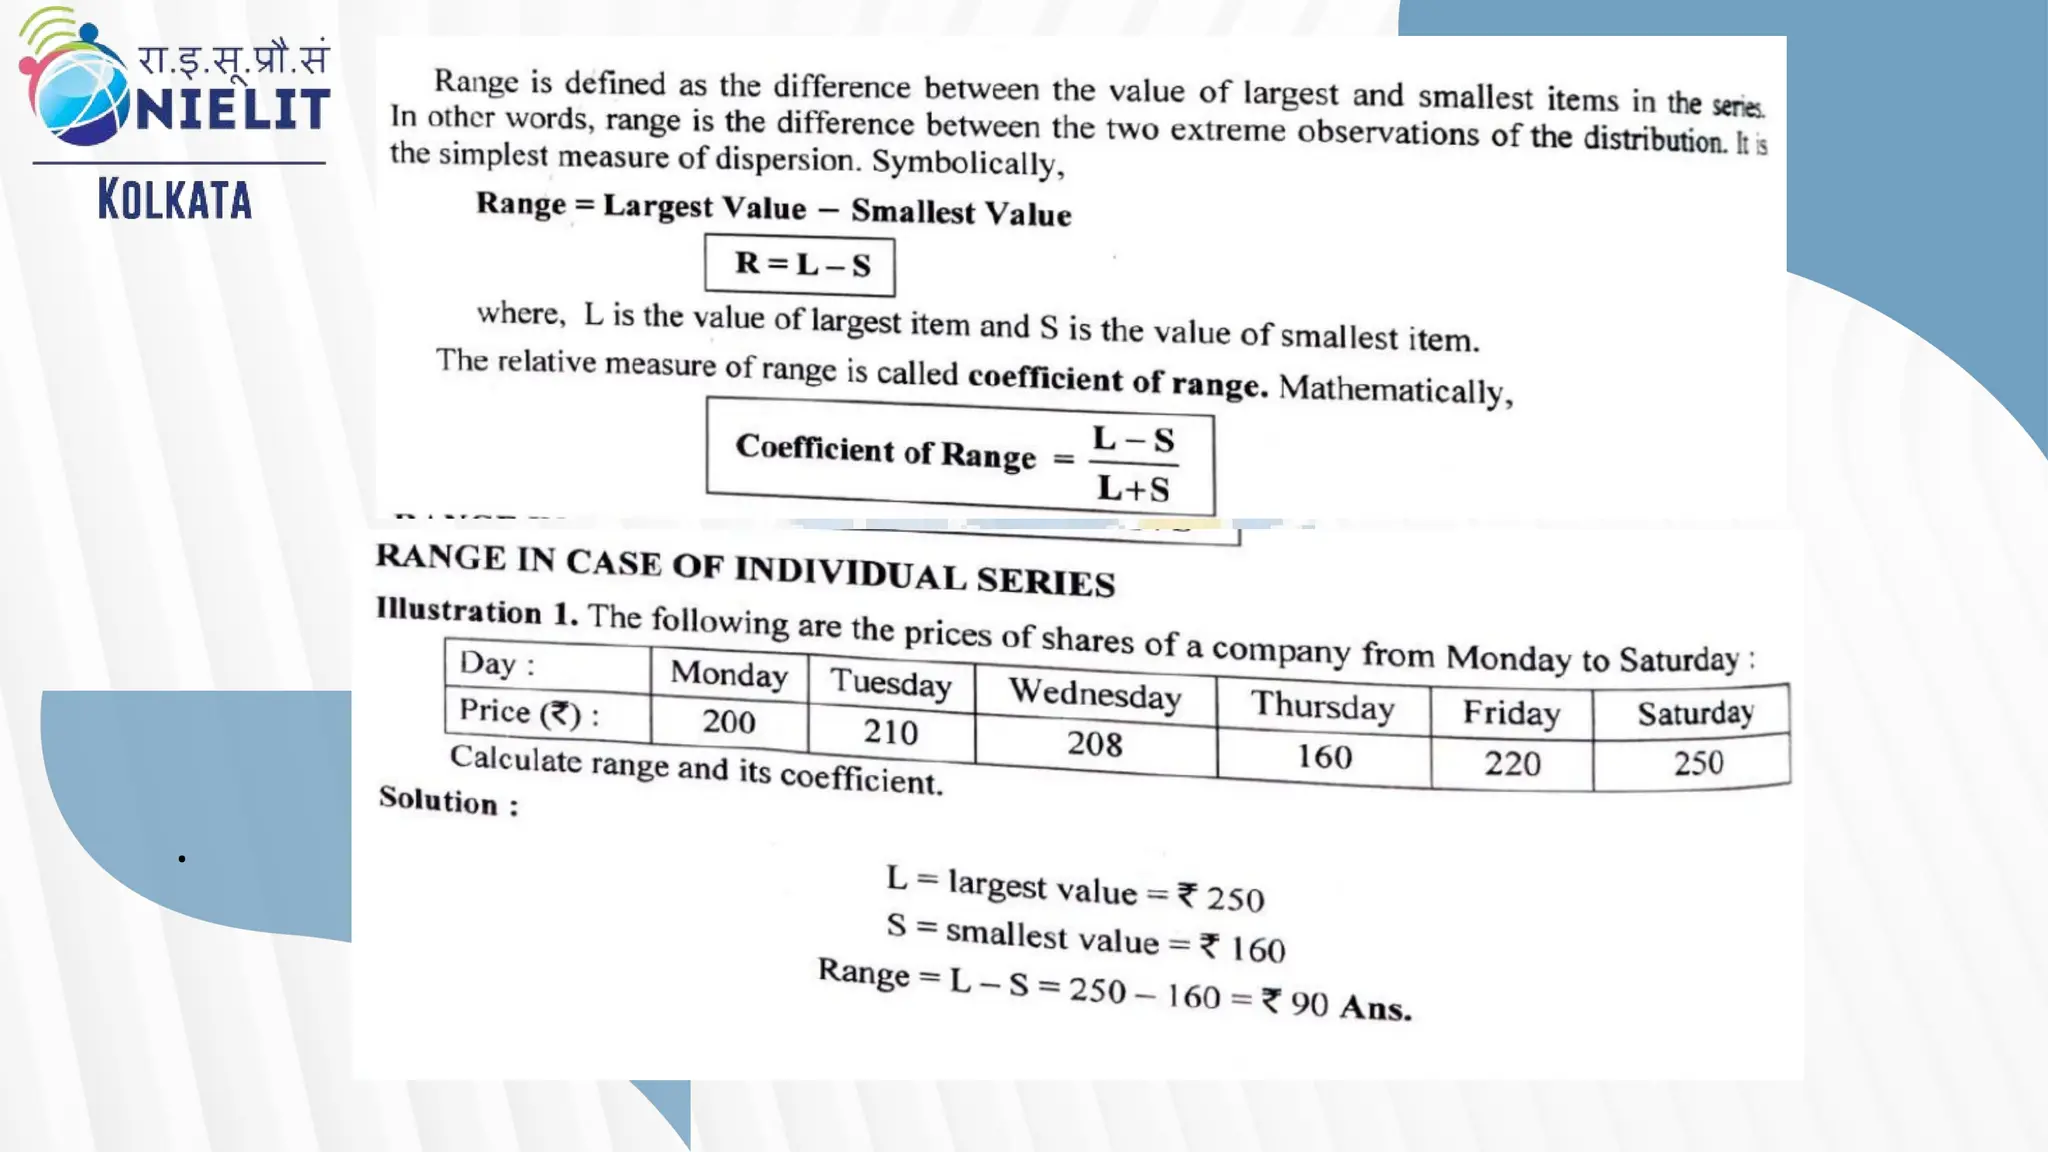
Data Variability
How spread out are exam
scores?
Range, Variance, Std. Deviation
Frequency How often does a value occur? Frequency Tables, Mode
Category Analysis
What percent of people fall in
each category?
Pie Charts, Bar Graphs
Distribution Shape Is the data skewed?
Boxplots, Skewness,
Histograms
Extremes
What is the highest & lowest
value?
Min/Max, Range
Visual Summary What does the data look like?
Line Graphs, Bar Charts,
Boxplots
5.
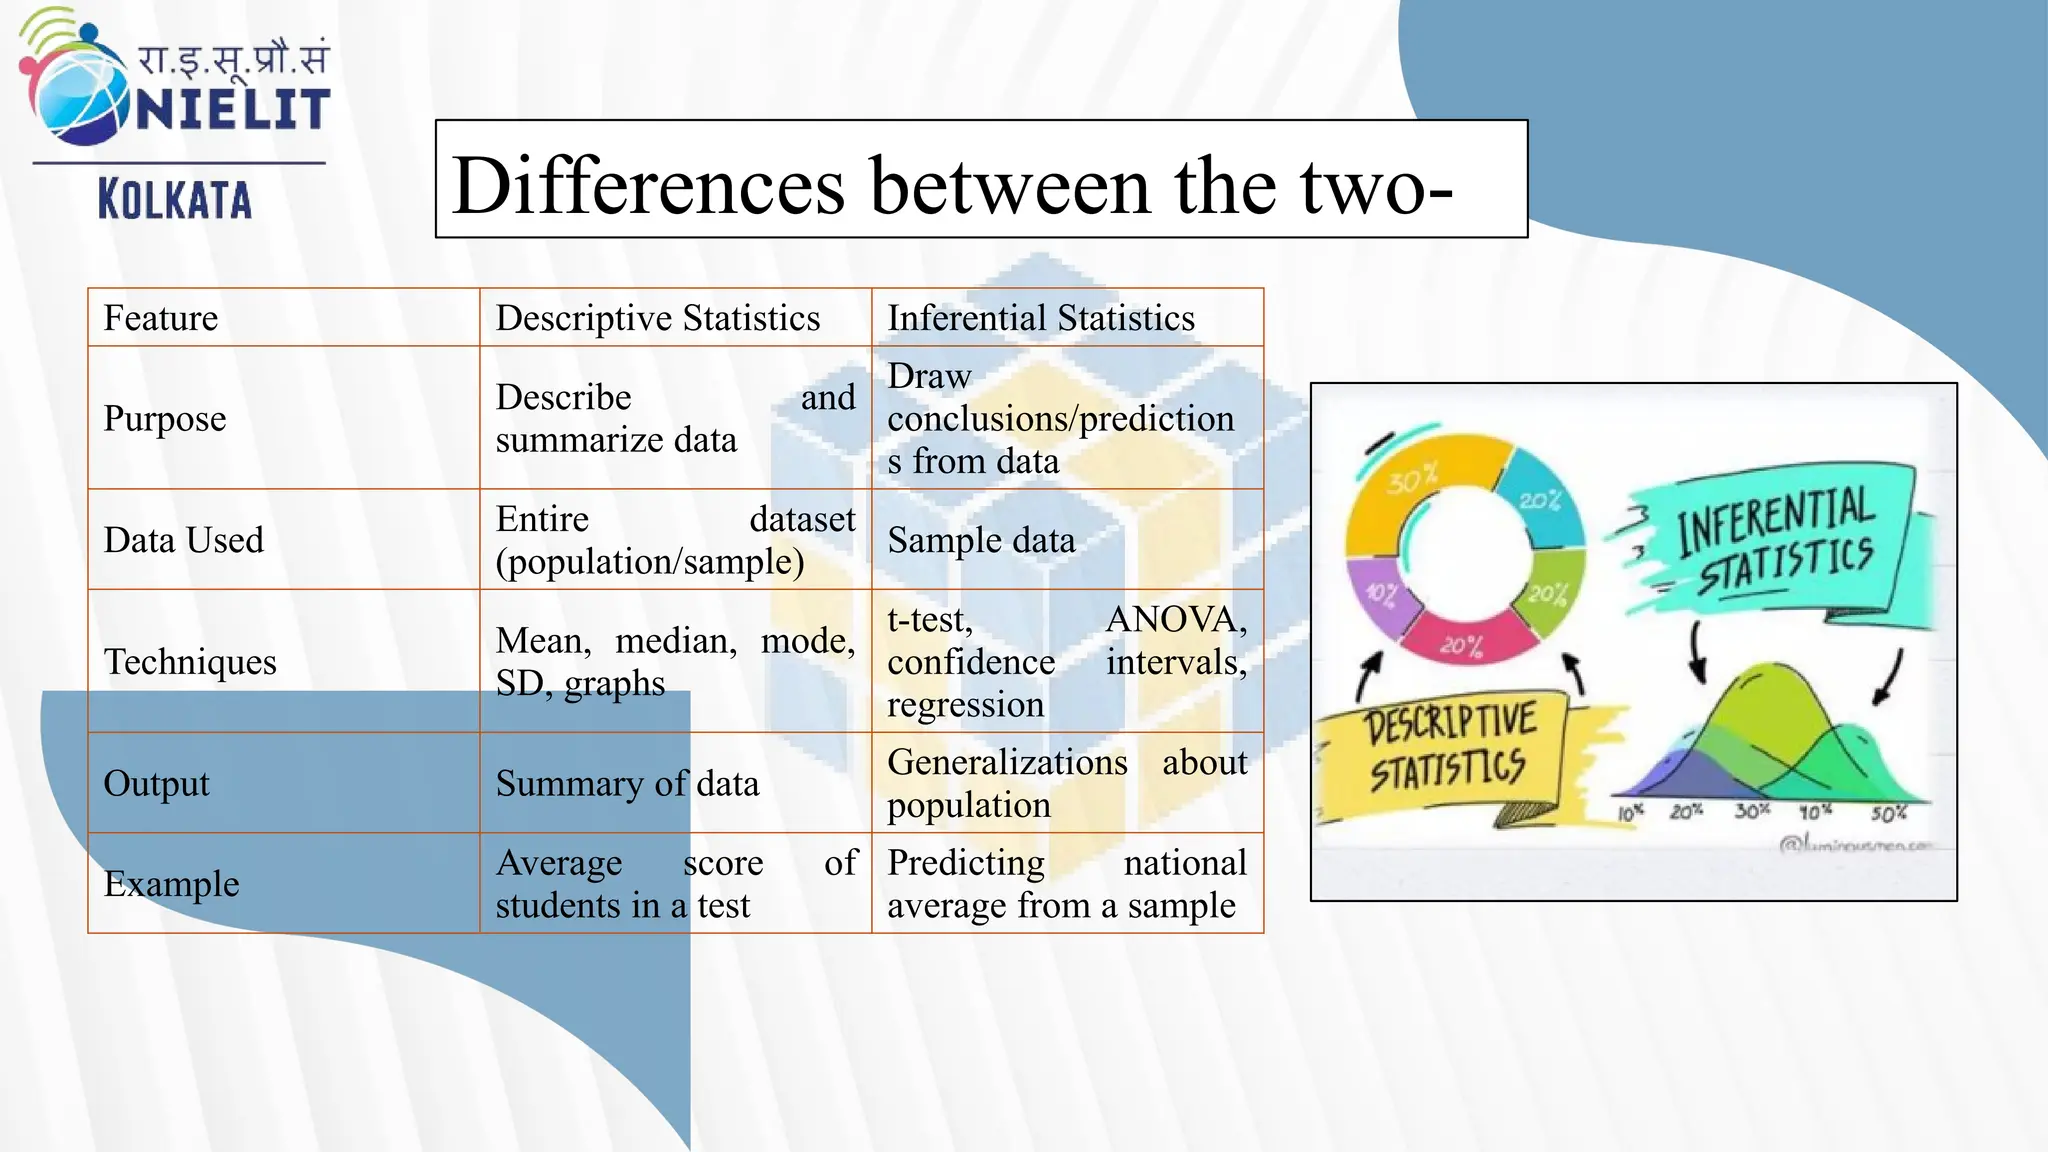
Feature Descriptive StatisticsInferential Statistics
Purpose
Describe and
summarize data
Draw
conclusions/prediction
s from data
Data Used
Entire dataset
(population/sample)
Sample data
Techniques
Mean, median, mode,
SD, graphs
t-test, ANOVA,
confidence intervals,
regression
Output Summary of data
Generalizations about
population
Example
Average score of
students in a test
Predicting national
average from a sample
Differences between the two-
6.
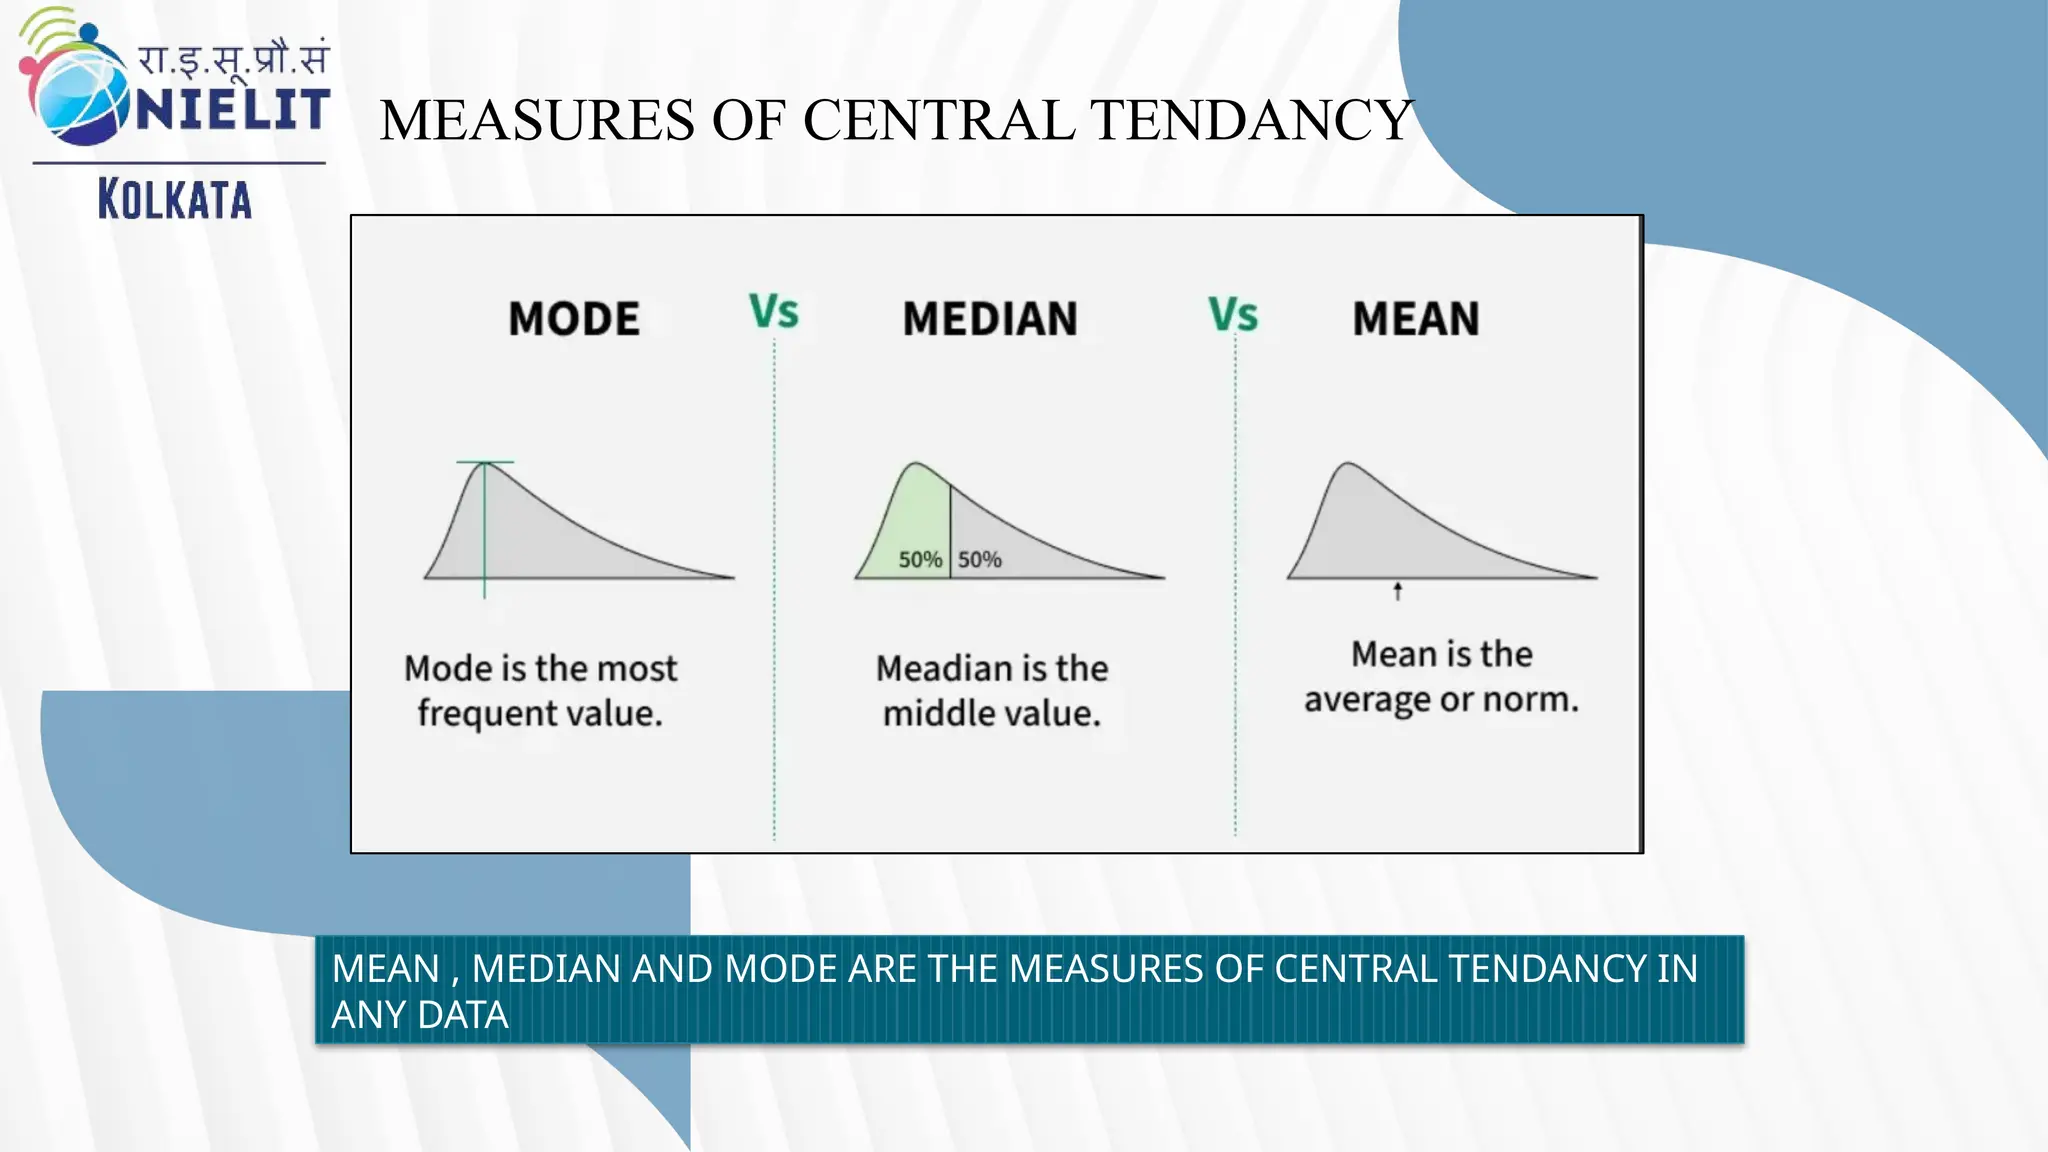
MEASURES OF CENTRALTENDANCY
MEAN , MEDIAN AND MODE ARE THE MEASURES OF CENTRAL TENDANCY IN
ANY DATA
8.
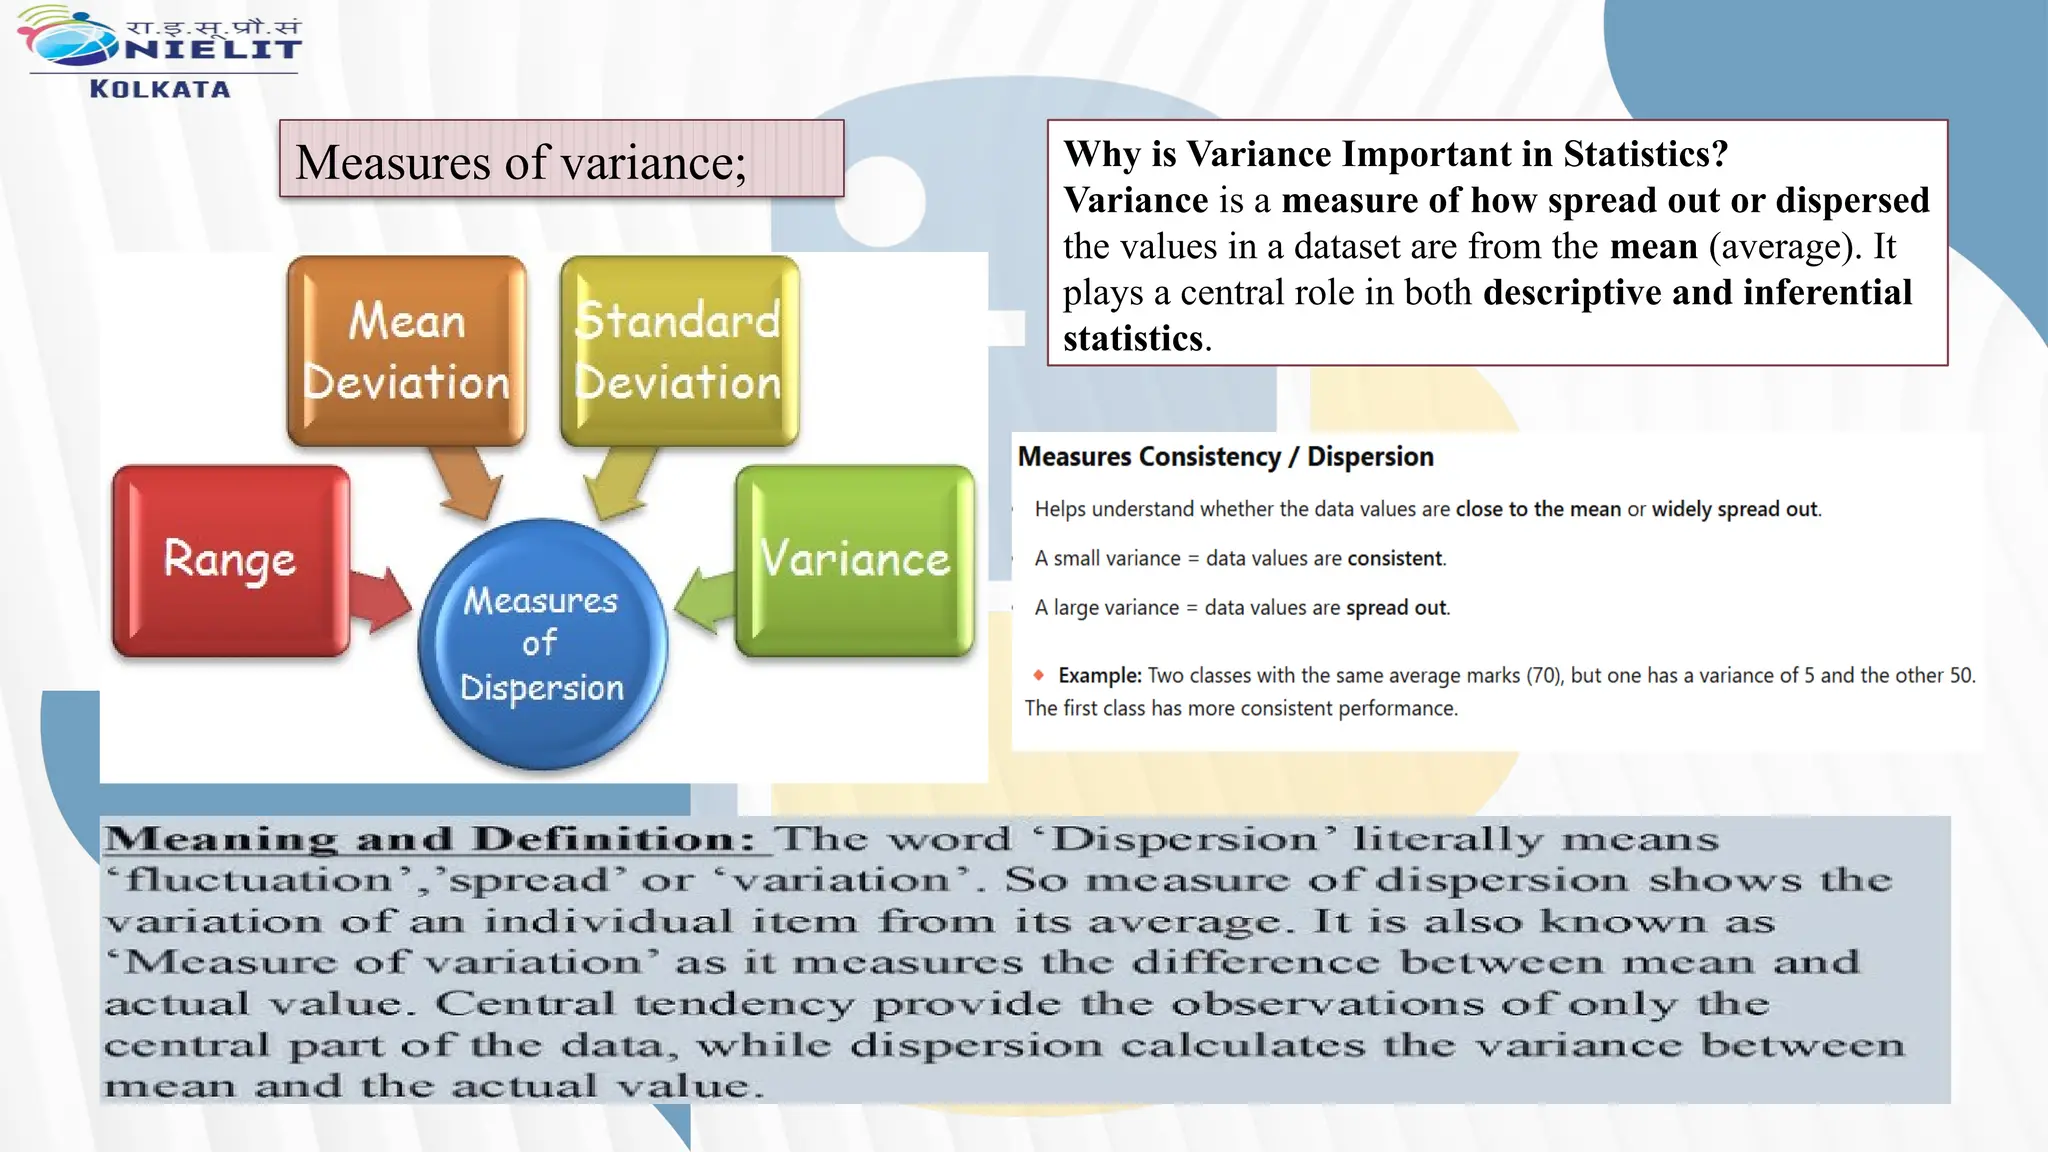
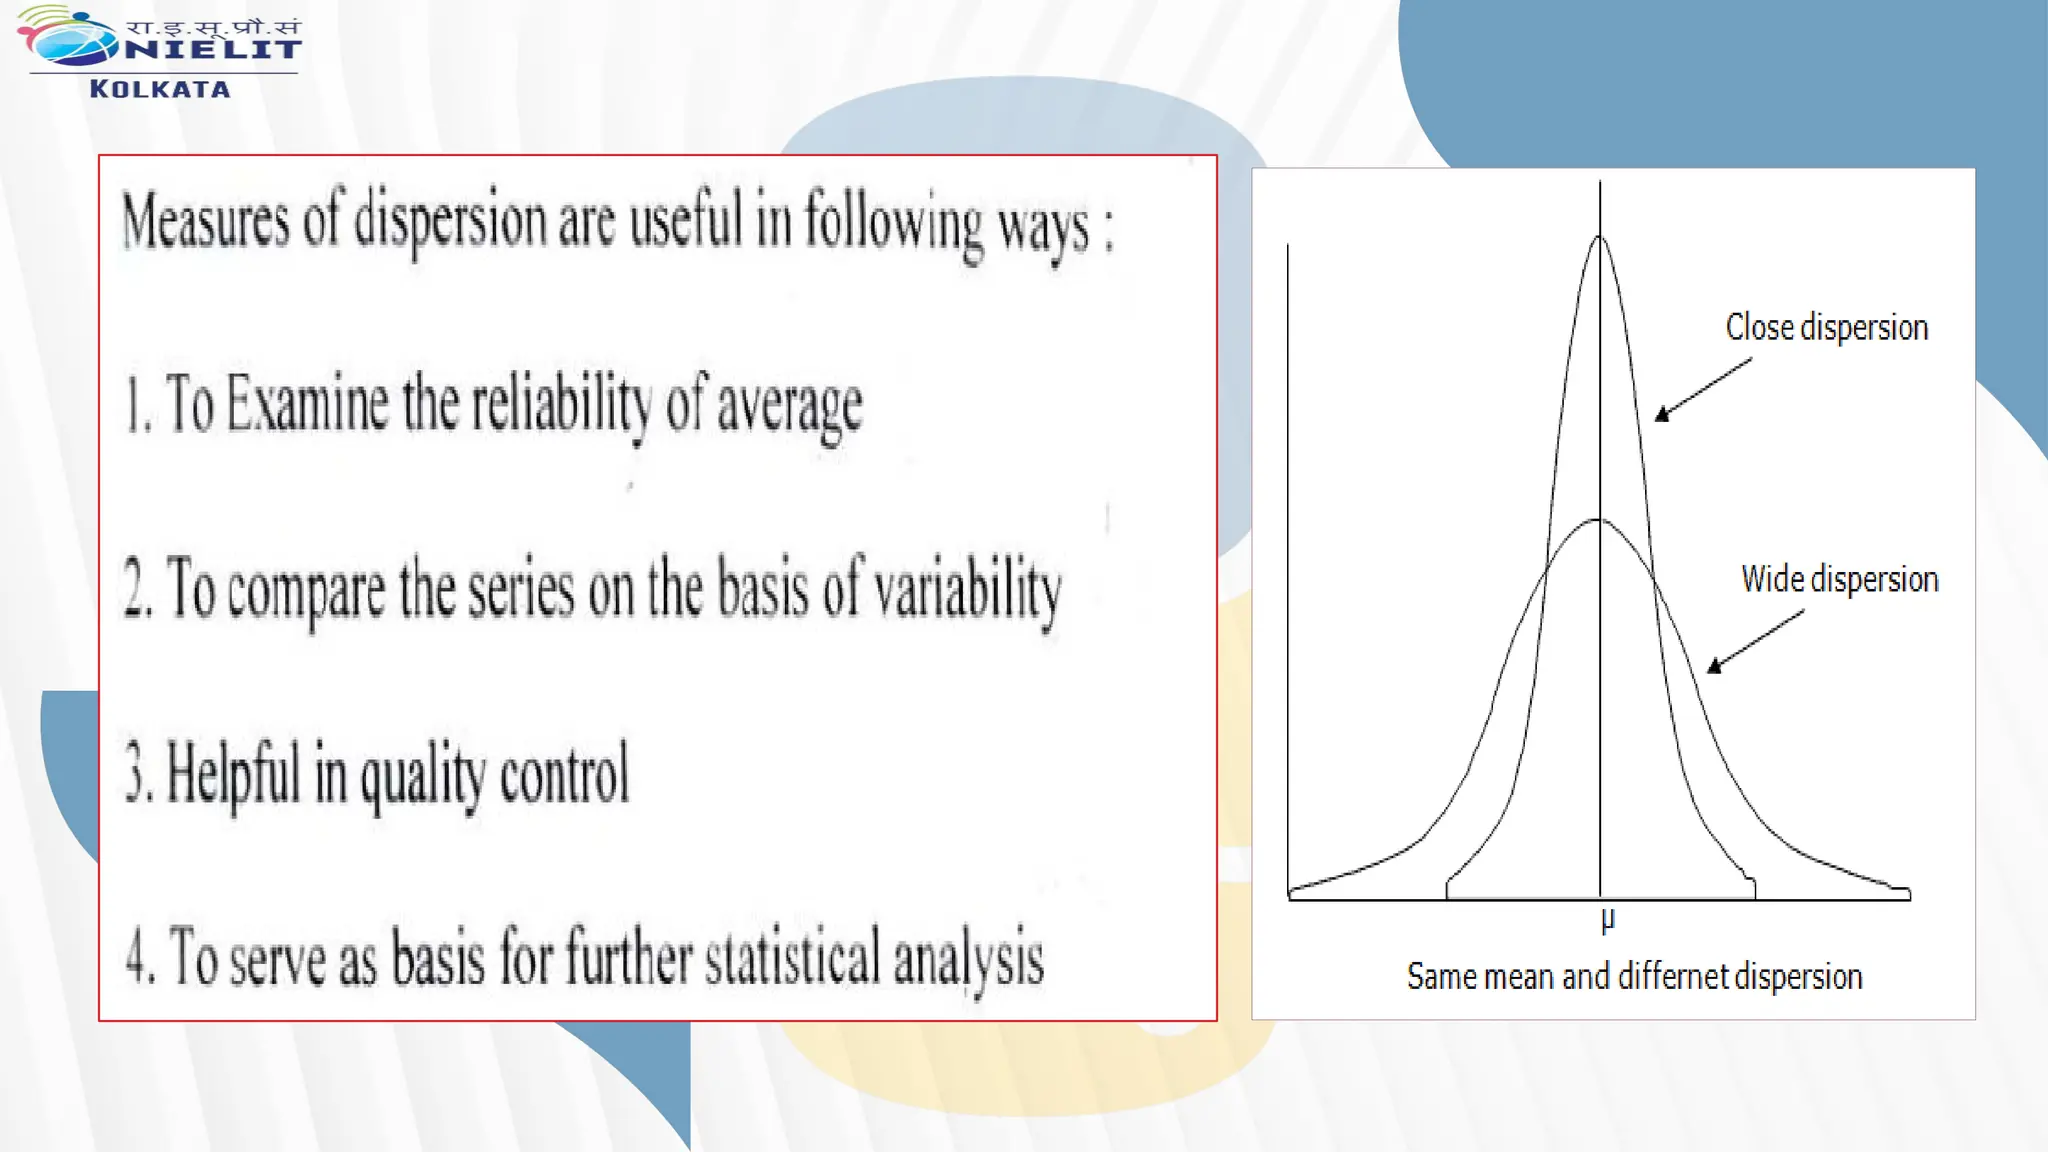
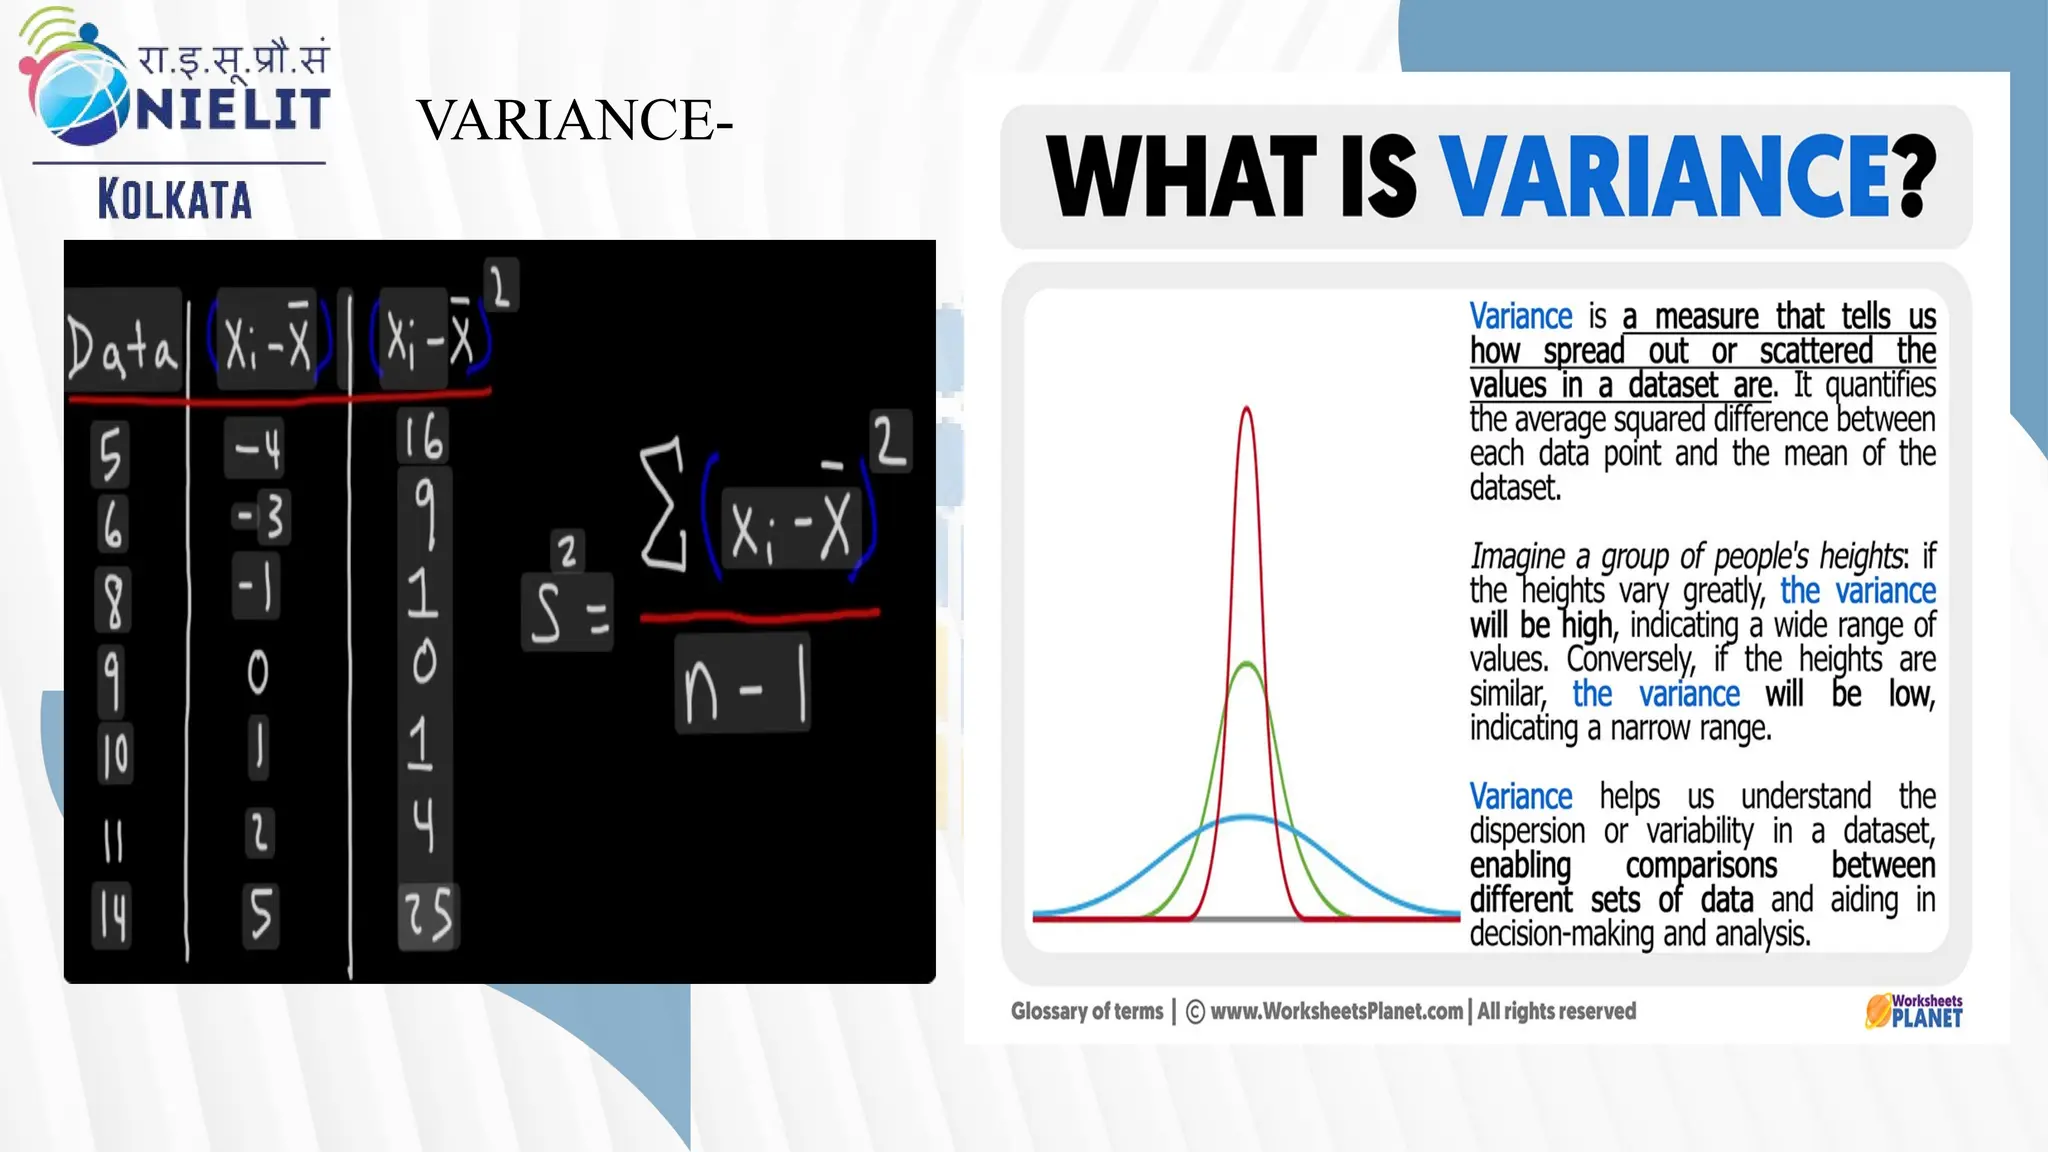
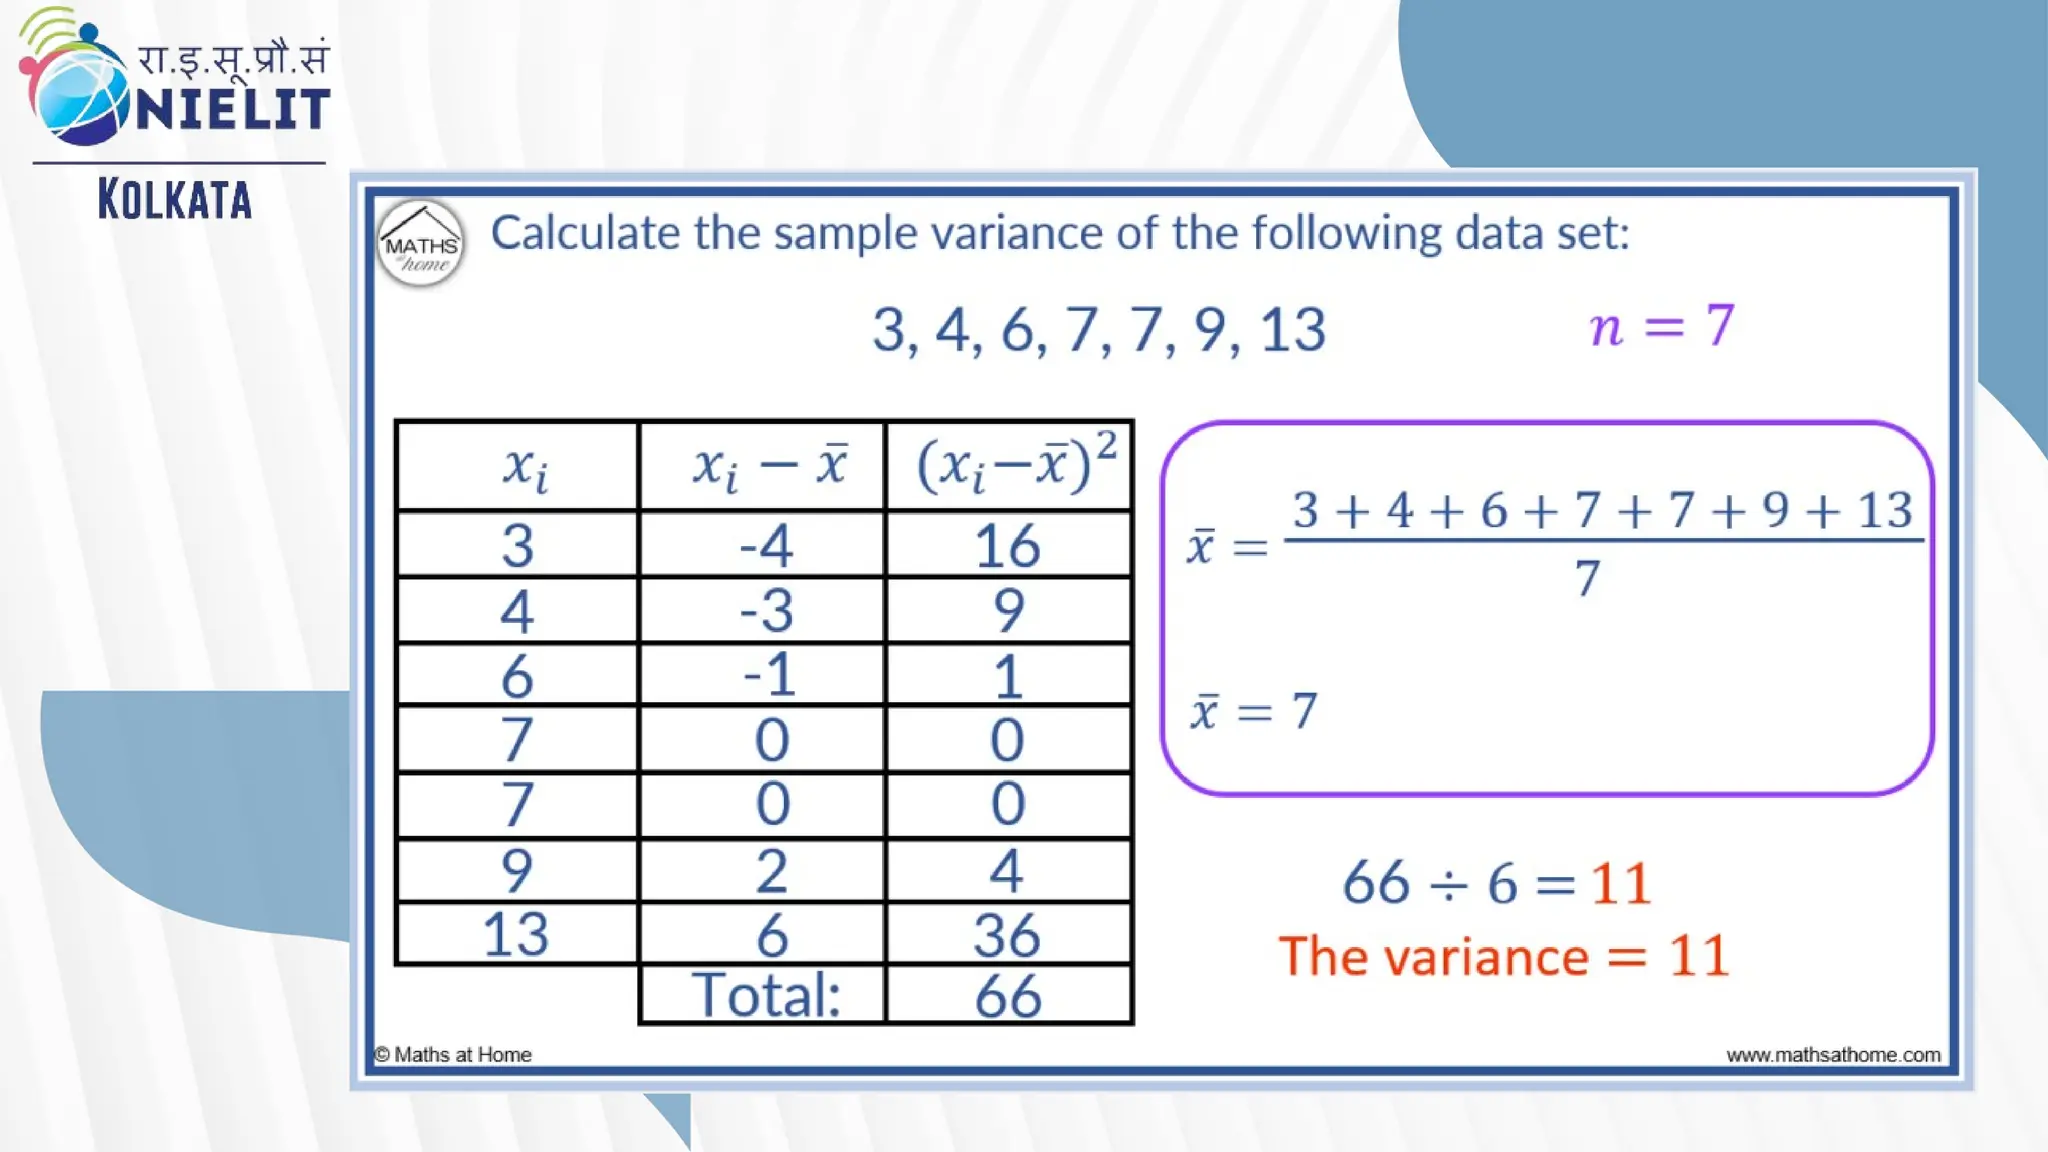
Measures of variance;Why is Variance Important in Statistics?
Variance is a measure of how spread out or dispersed
the values in a dataset are from the mean (average). It
plays a central role in both descriptive and inferential
statistics.


![[DSC Europe 25] Max Talanov - Non digital NNs.pptx](https://cdn.slidesharecdn.com/ss_thumbnails/wif8tr3gtua74qvtopke-non-digital-nns-251205090438-26b0eea6-thumbnail.jpg?width=640&height=640&fit=bounds)


![[DSC Europe 25] Jim Sterne - Adopting Generative AI Capabilities Into the Ent...](https://cdn.slidesharecdn.com/ss_thumbnails/sxhpofuorcagxsaulkmt-3-251204082258-7e66bc48-thumbnail.jpg?width=640&height=640&fit=bounds)

![[DSC Europe 25] Bogdan Daniel Maruneac - AI - It starts with you.pptx](https://cdn.slidesharecdn.com/ss_thumbnails/odov3snhrcqs9hx5ny2n-4-251205085715-f1daacfe-thumbnail.jpg?width=640&height=640&fit=bounds)
