
![Solving the problem with SPSS:
Evaluating normality (Cont…)
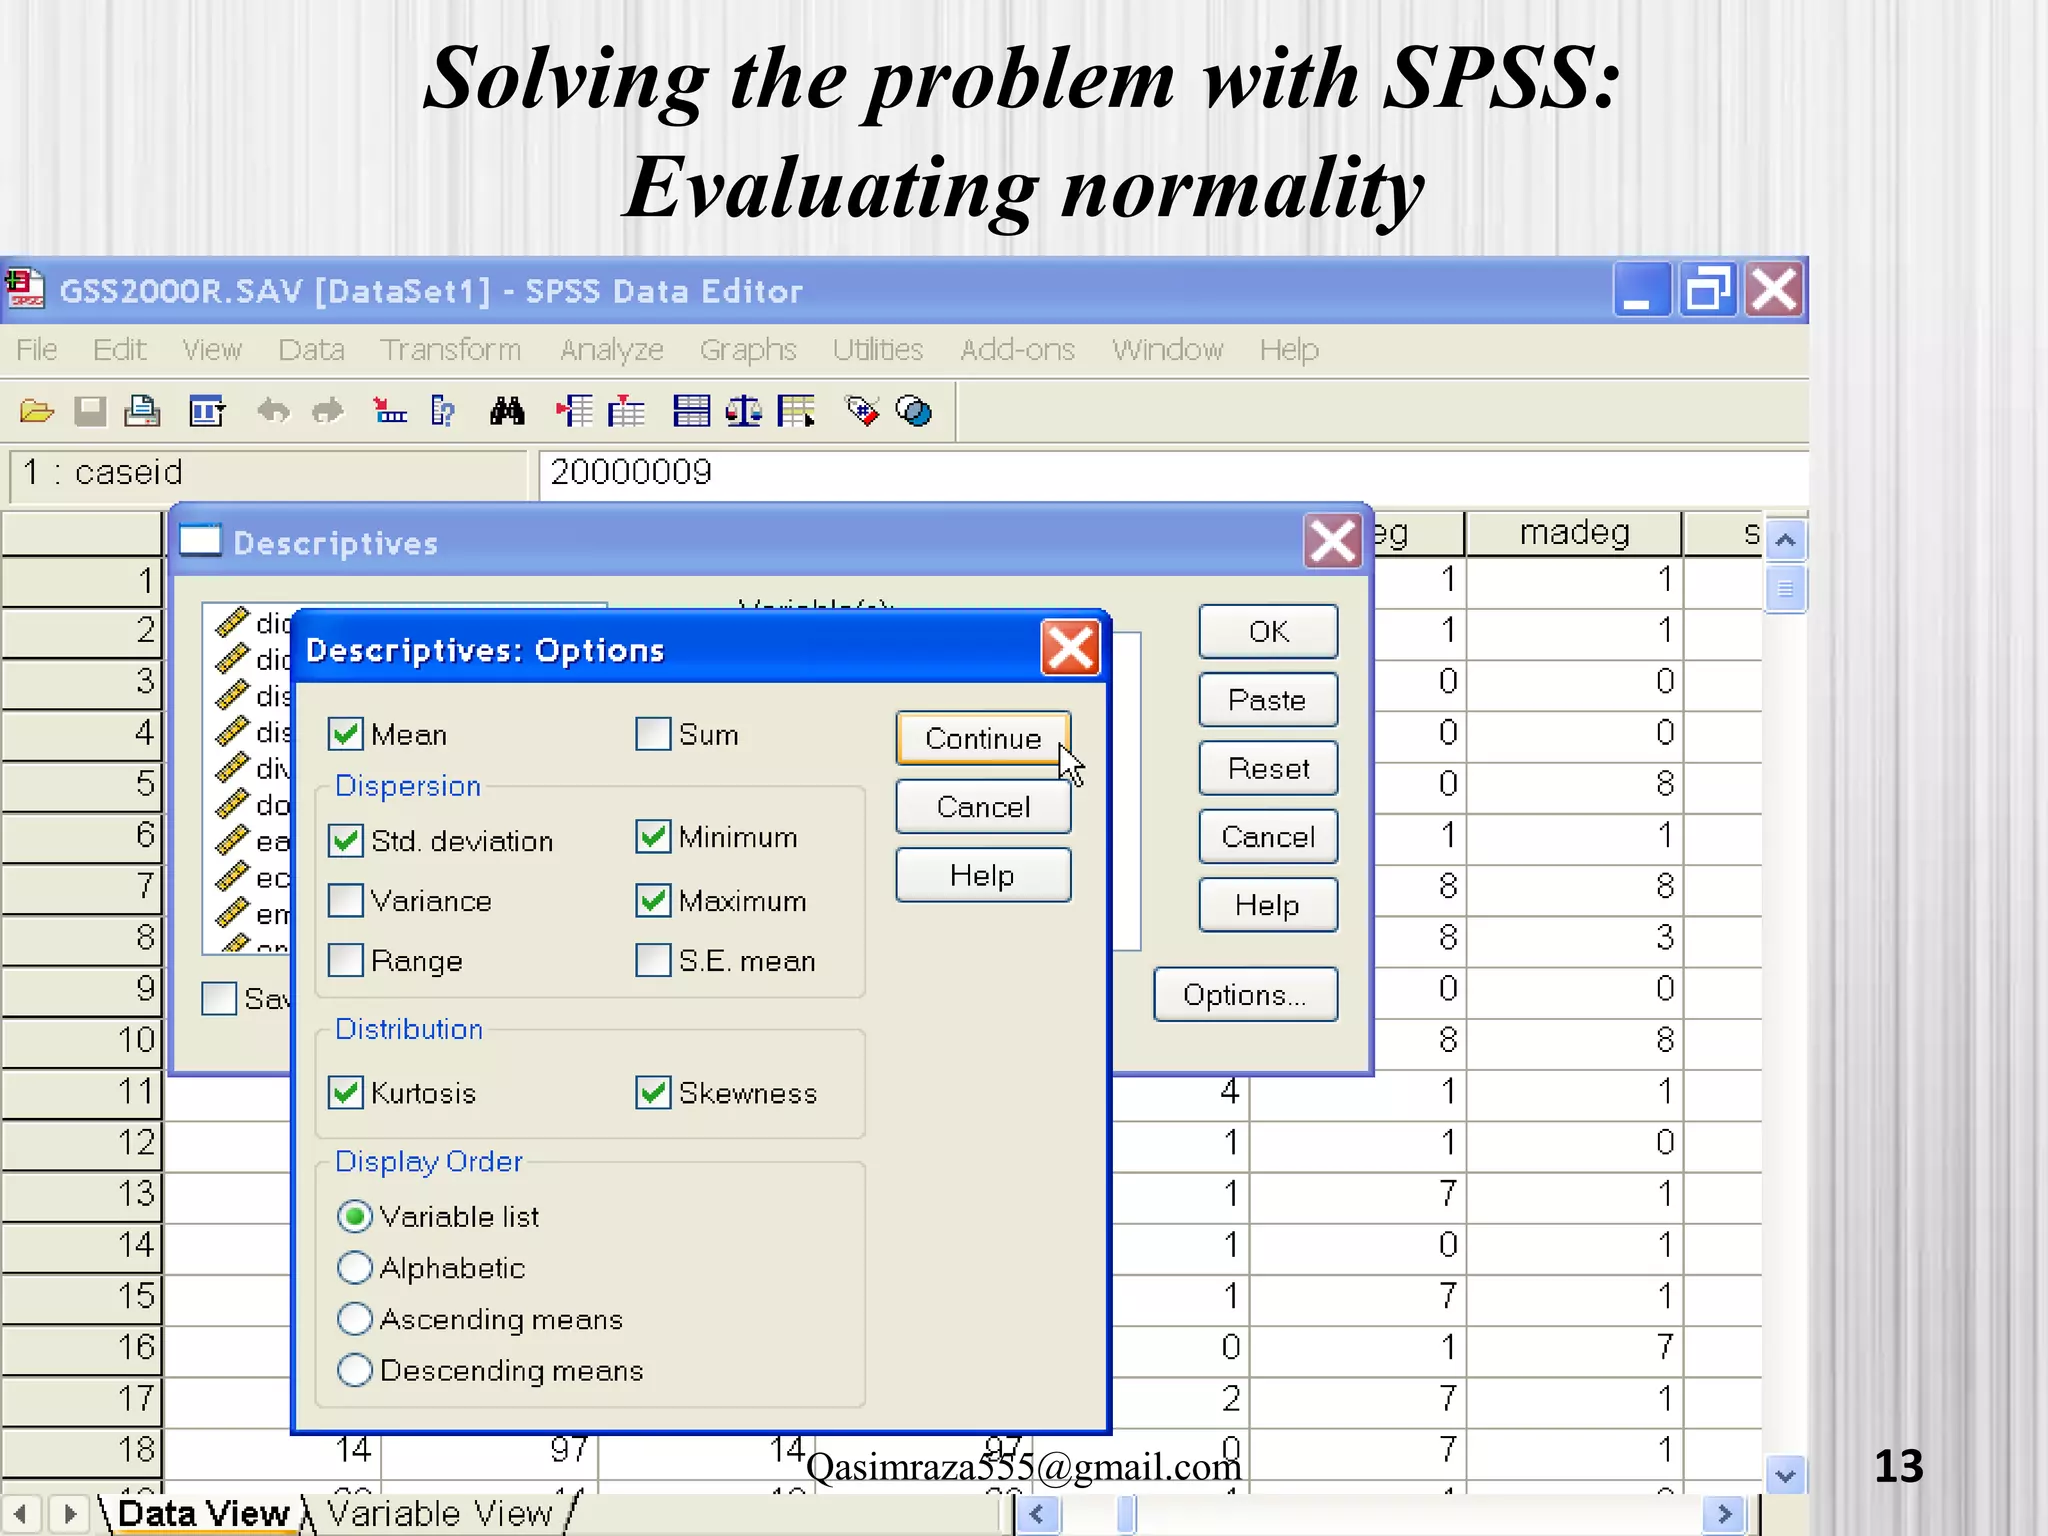
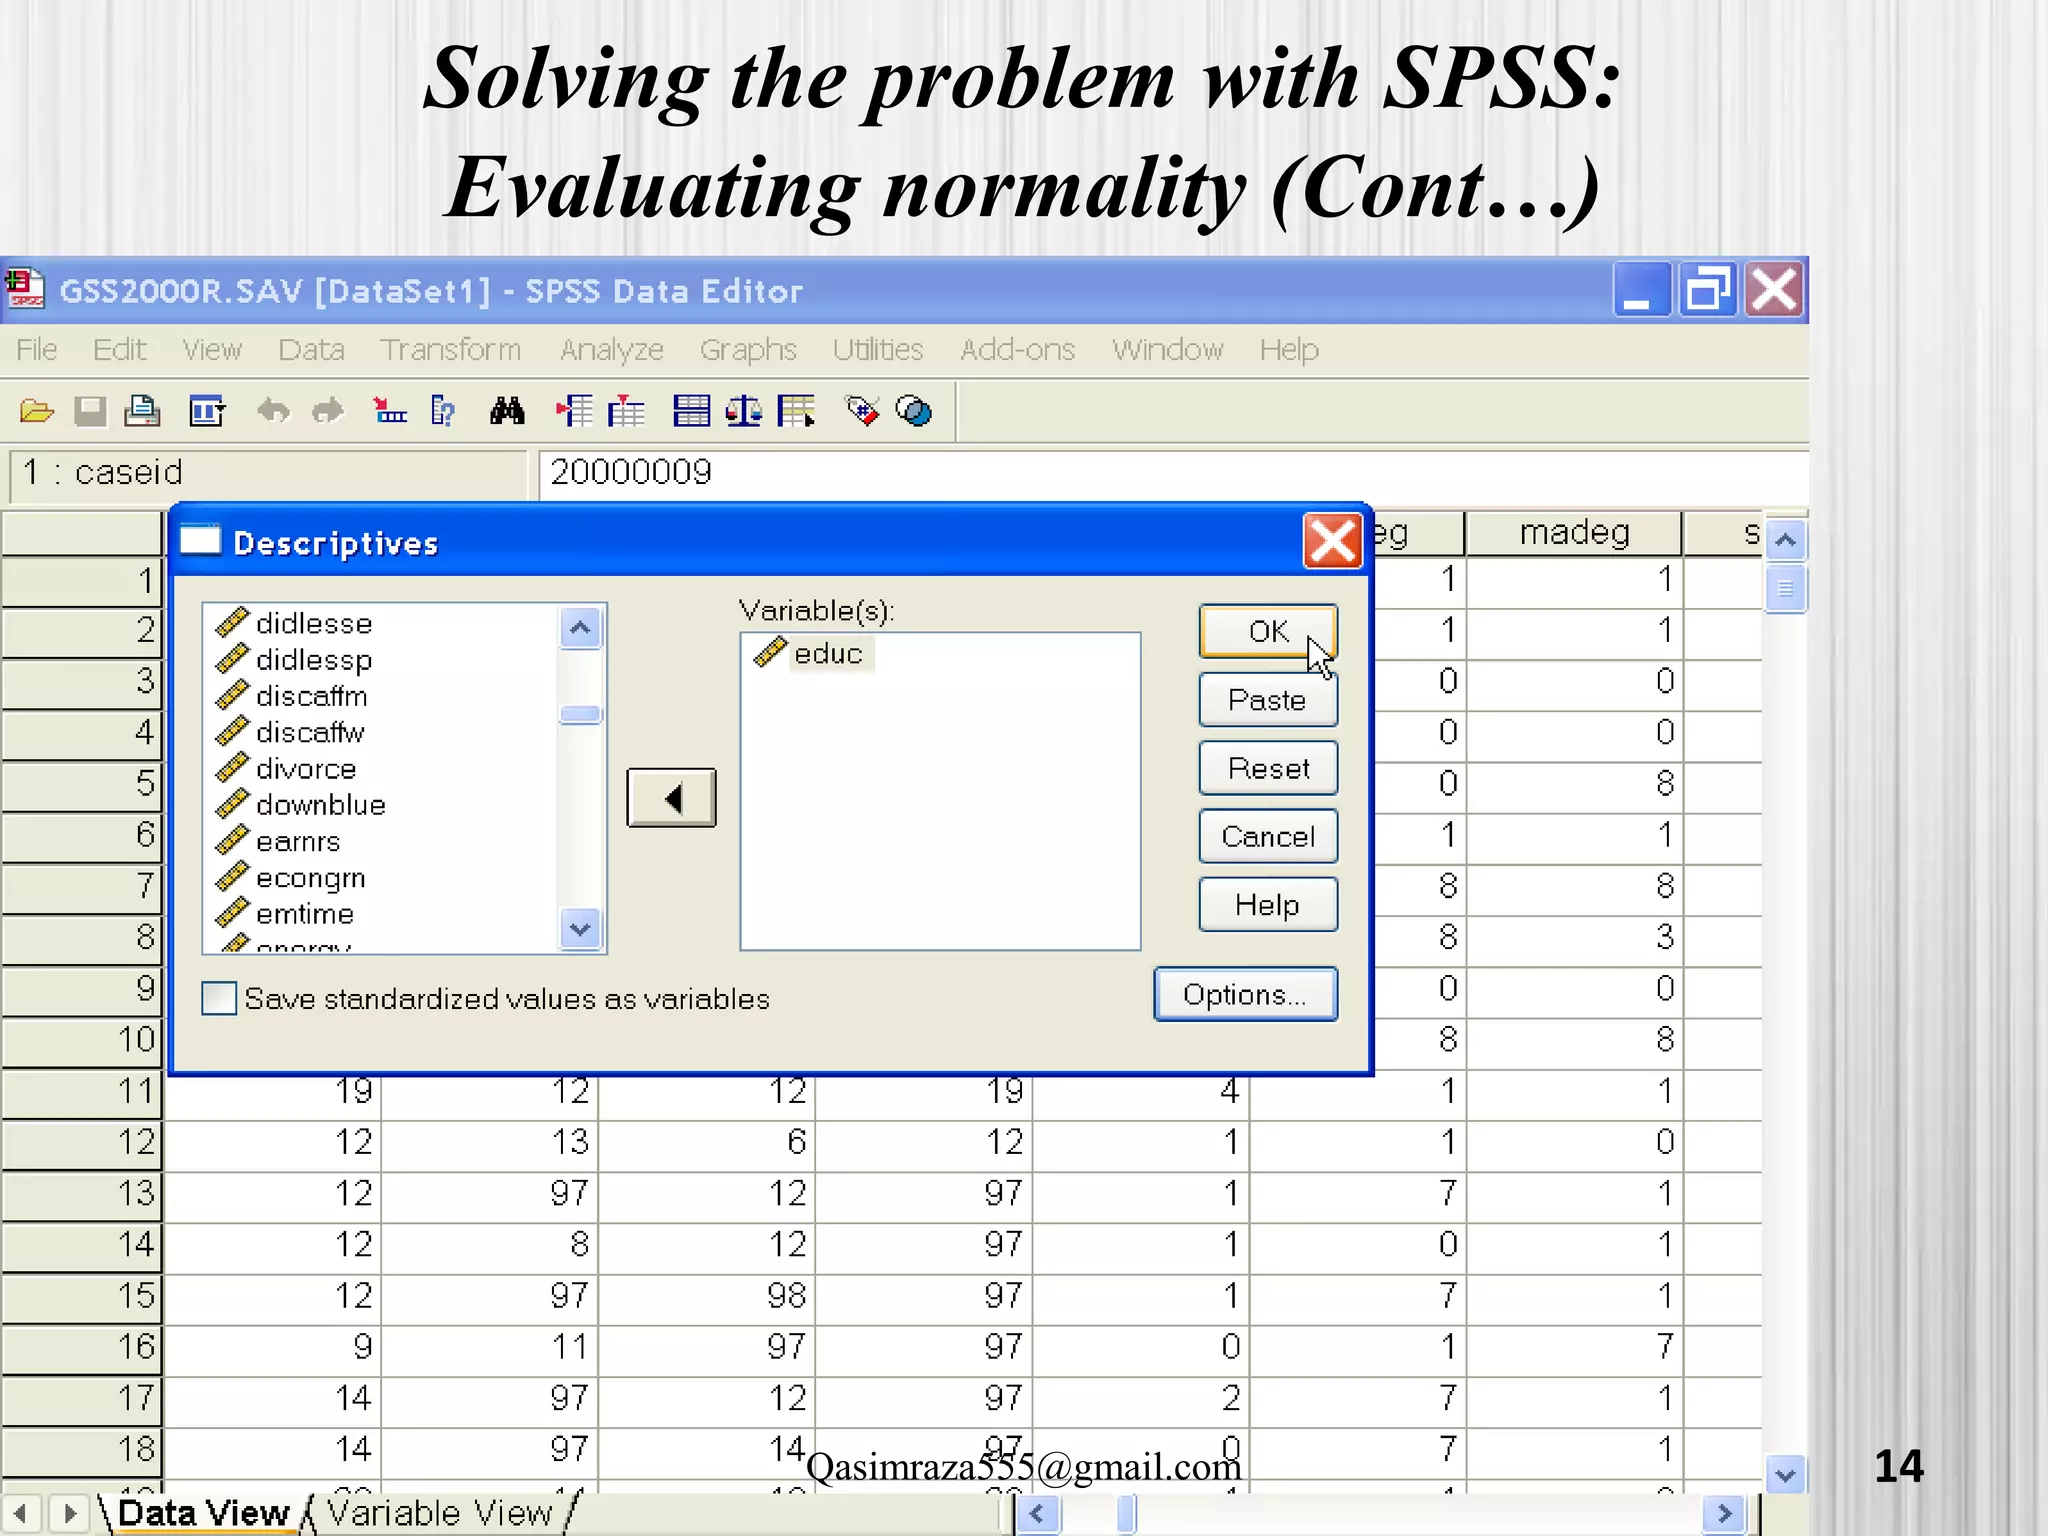
"Highest year of school completed" [educ] did
not satisfy the criteria for a normal
distribution. The skewness of the distribution
(-.137) was between -1.0 and +1.0, but the
kurtosis of the distribution (1.246) fell outside
the range from -1.0 to +1.0.
Having failed the normality requirement using
this criteria, we will see if we can apply the
central limit theorem.
15Qasimraza555@gmail.com](https://image.slidesharecdn.com/t-testindependantsamplepairedsampleandanova-130507030010-phpapp02/75/T-test-independant-sample-paired-sample-and-anova-15-2048.jpg)


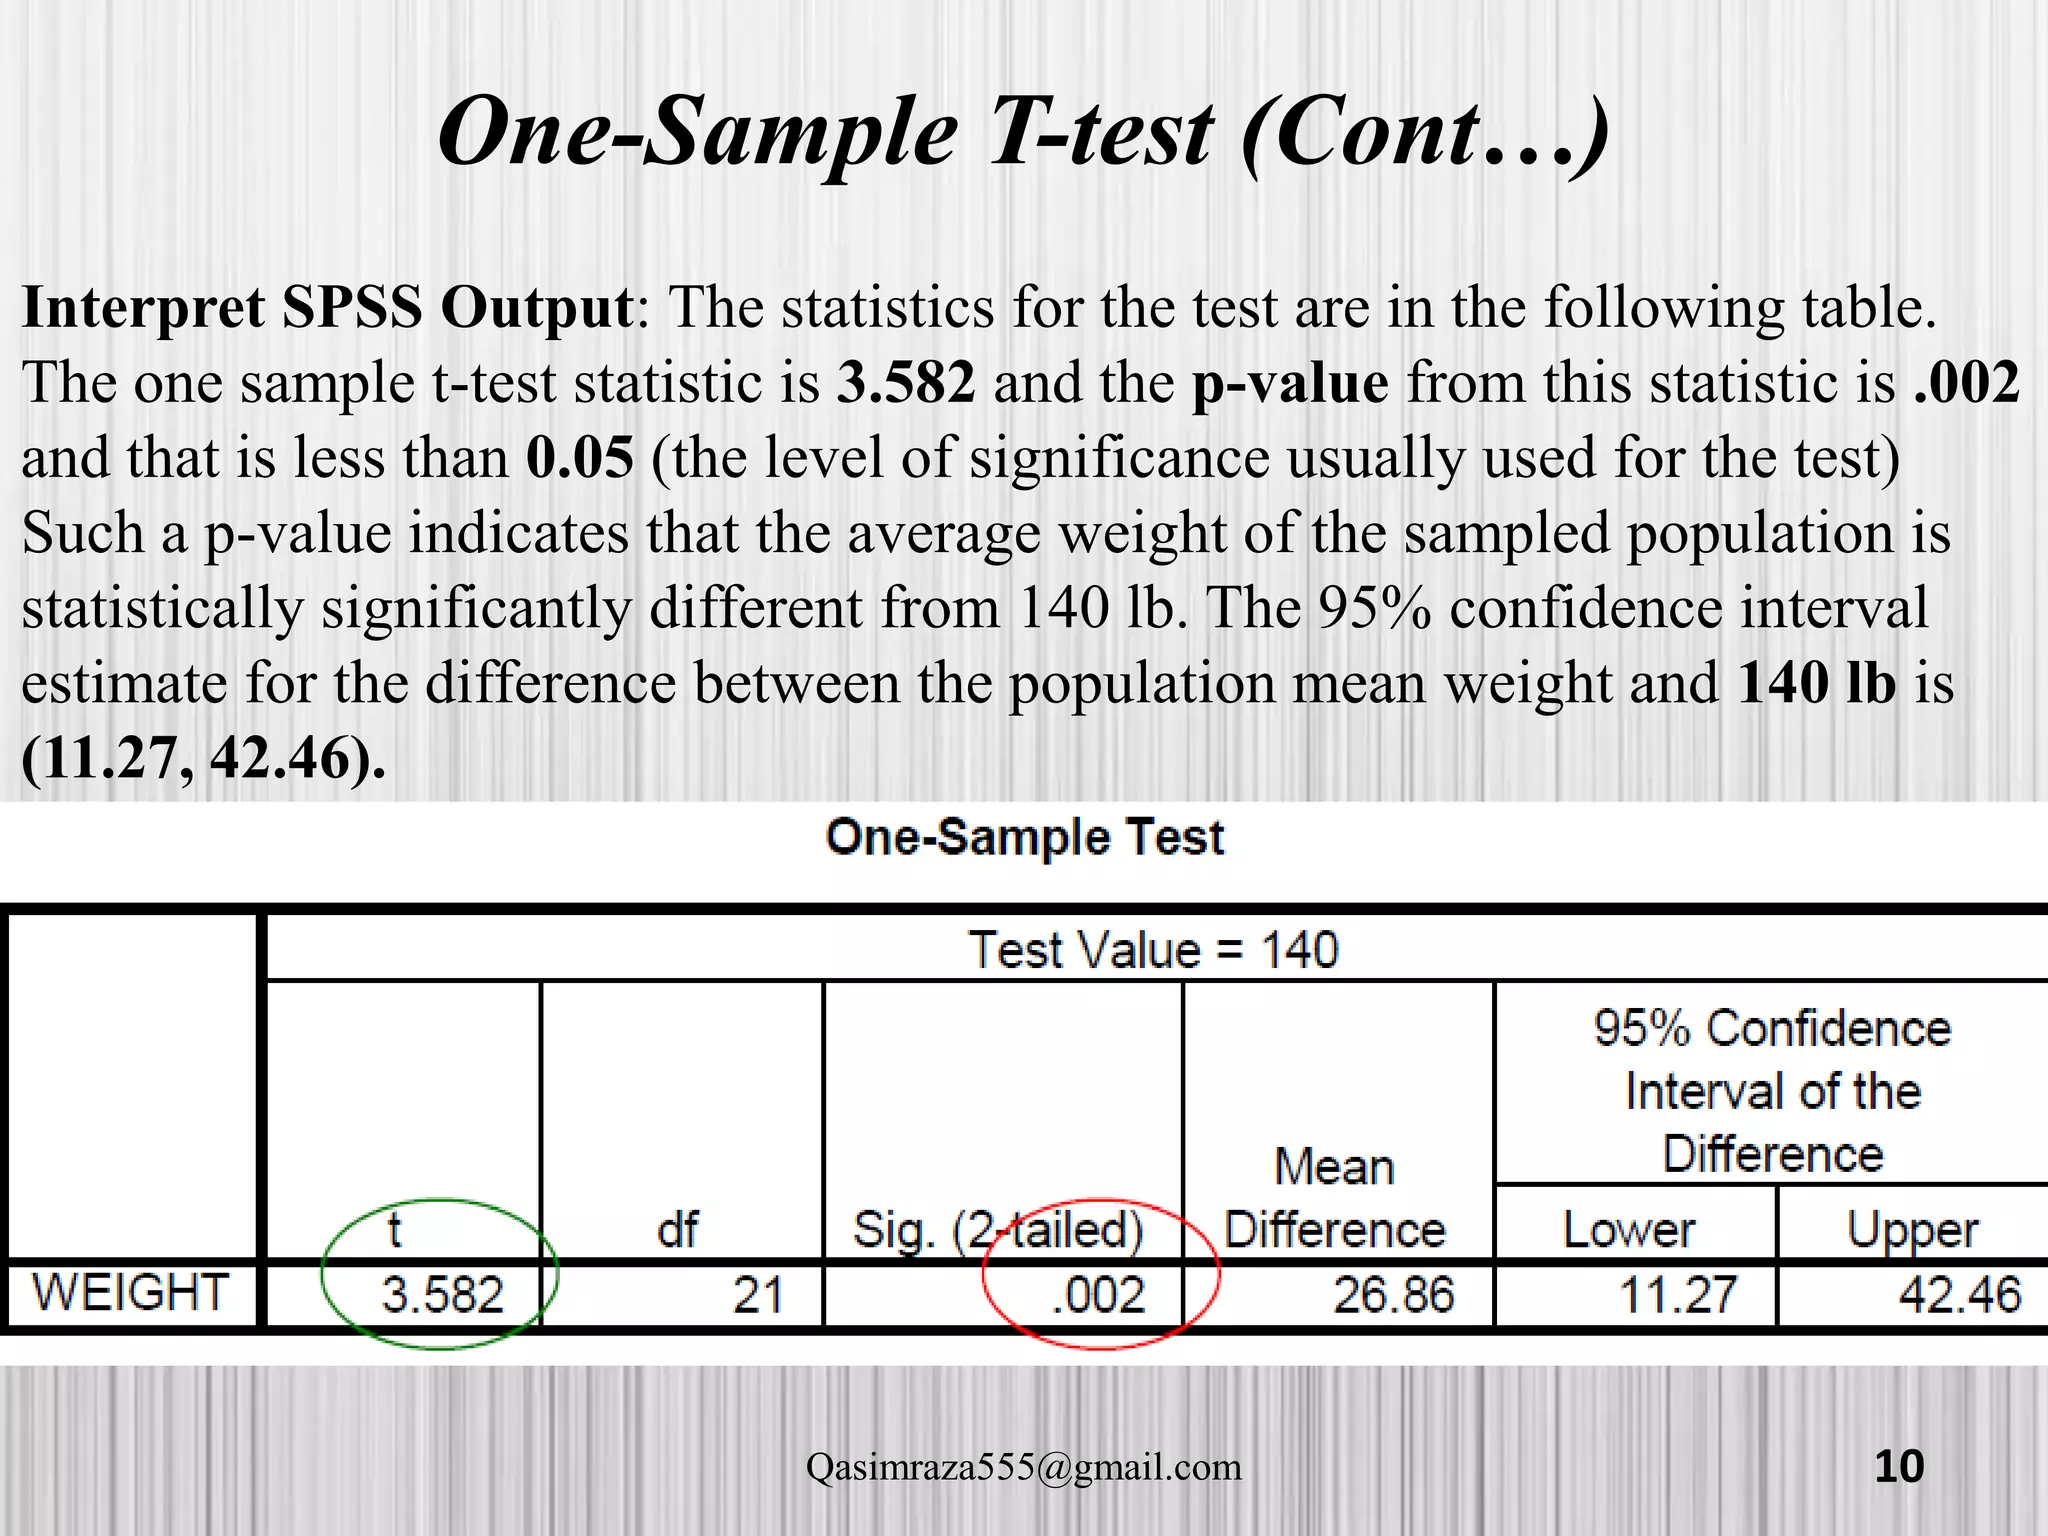
The document discusses various statistical analyses that can be performed in SPSS, including t-tests, ANOVA, and post-hoc tests. It provides details on one-sample t-tests, independent t-tests, paired t-tests, one-way ANOVA tests, and evaluating assumptions like normality. Examples are given on how to conduct these tests in SPSS and how to interpret the output. Guidance is provided on follow-up post-hoc tests that can be used after ANOVA to examine differences between specific groups.


