1. The document discusses statistical tests for comparing groups, including the t-test and ANOVA.
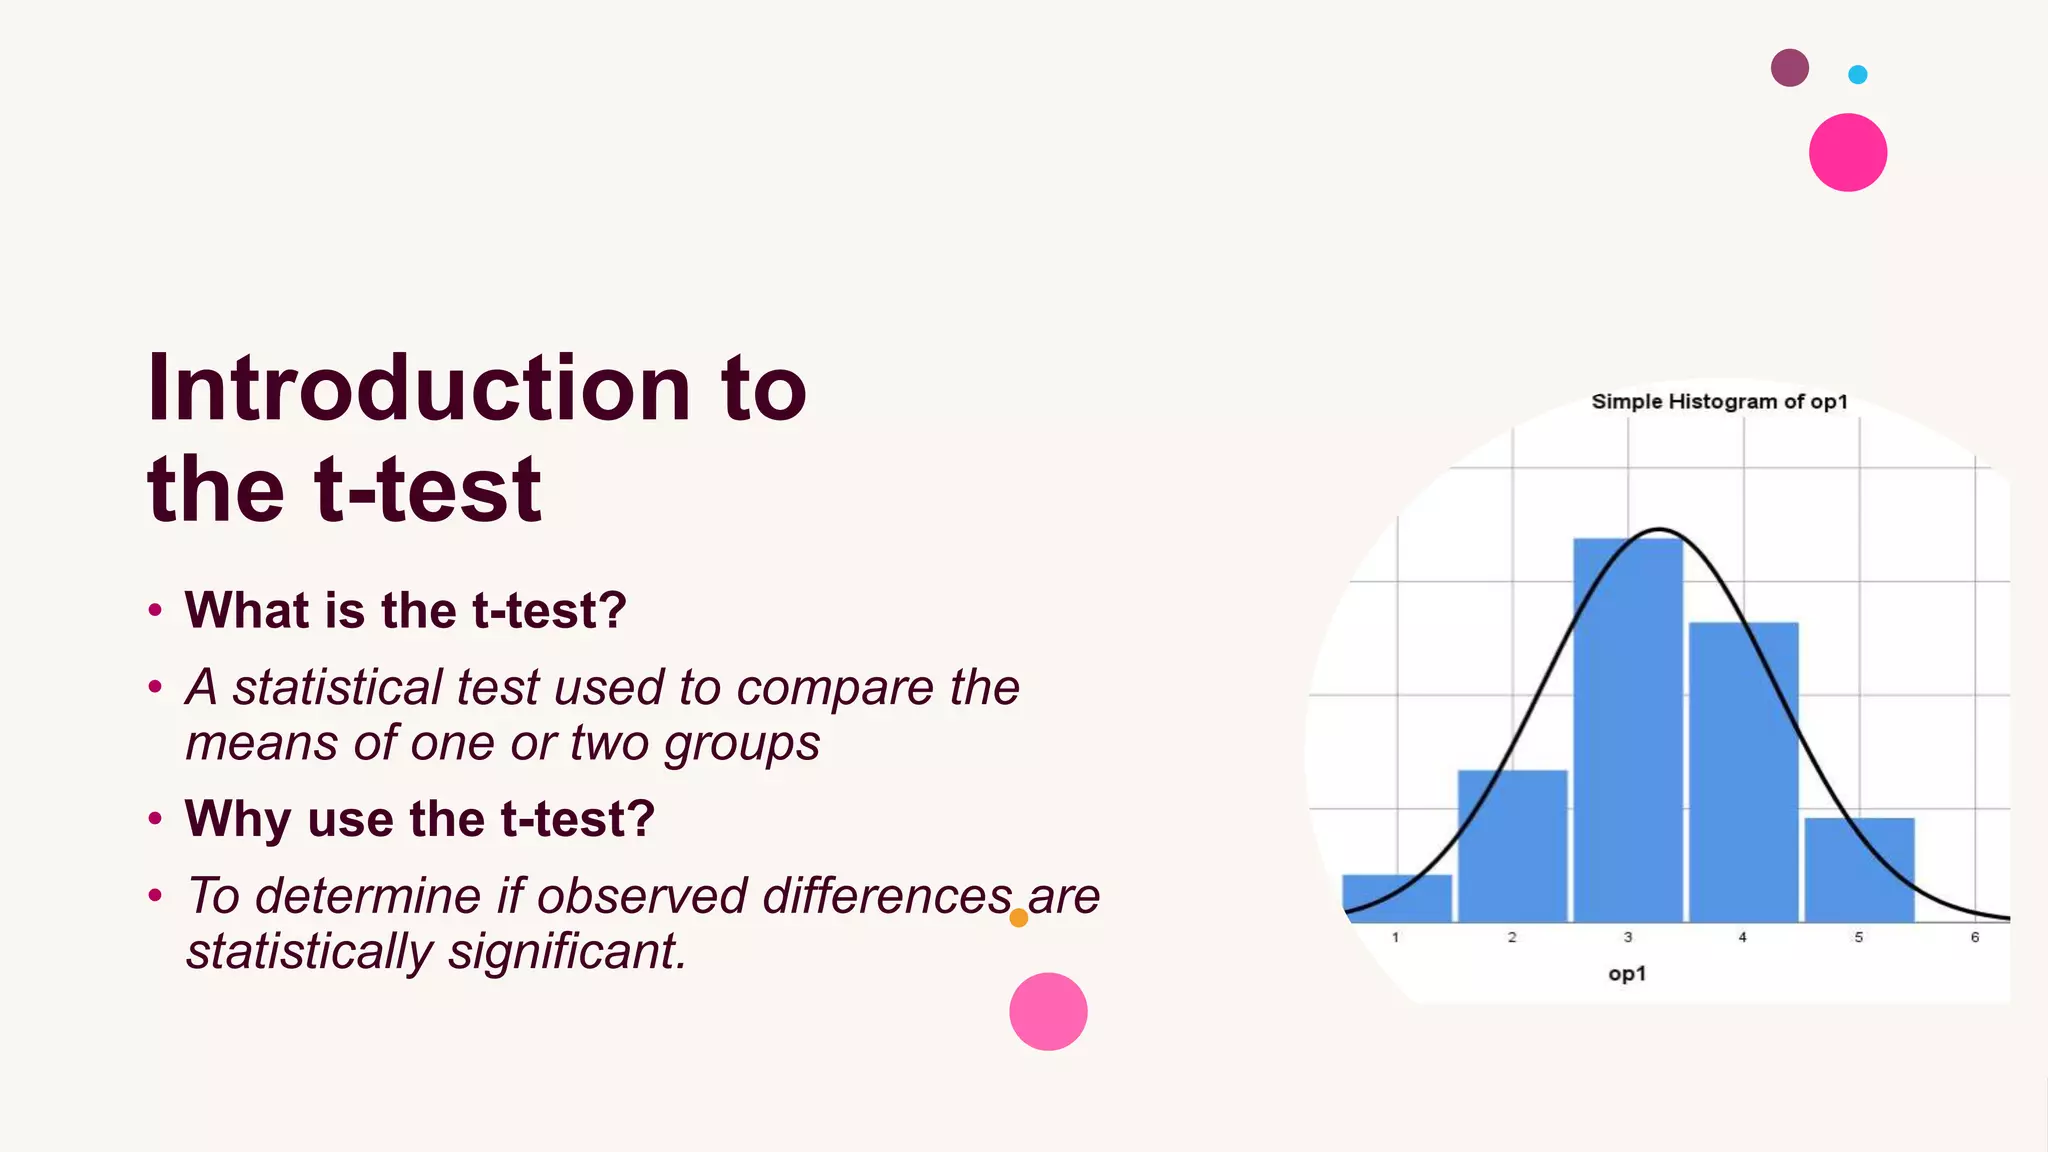
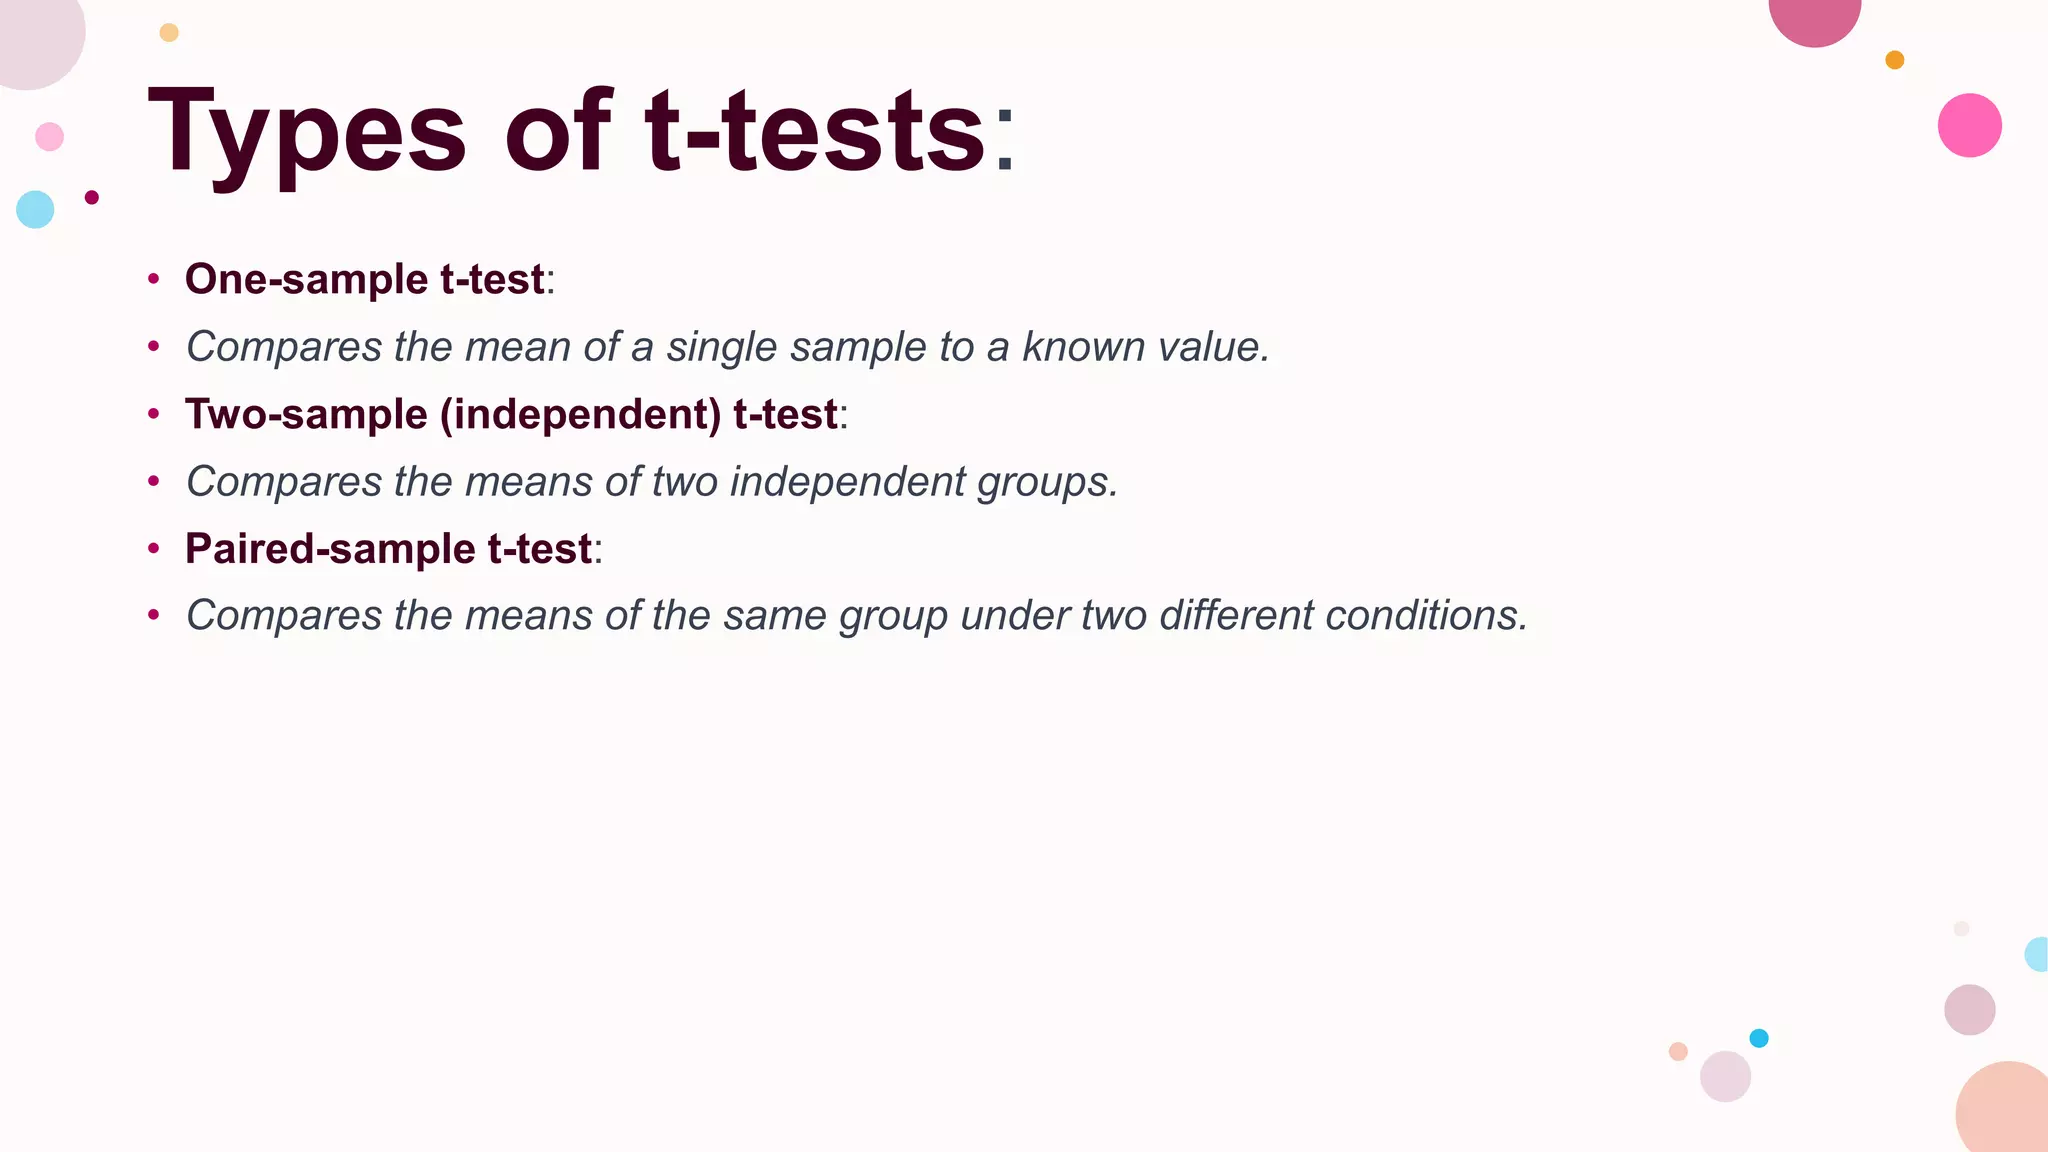
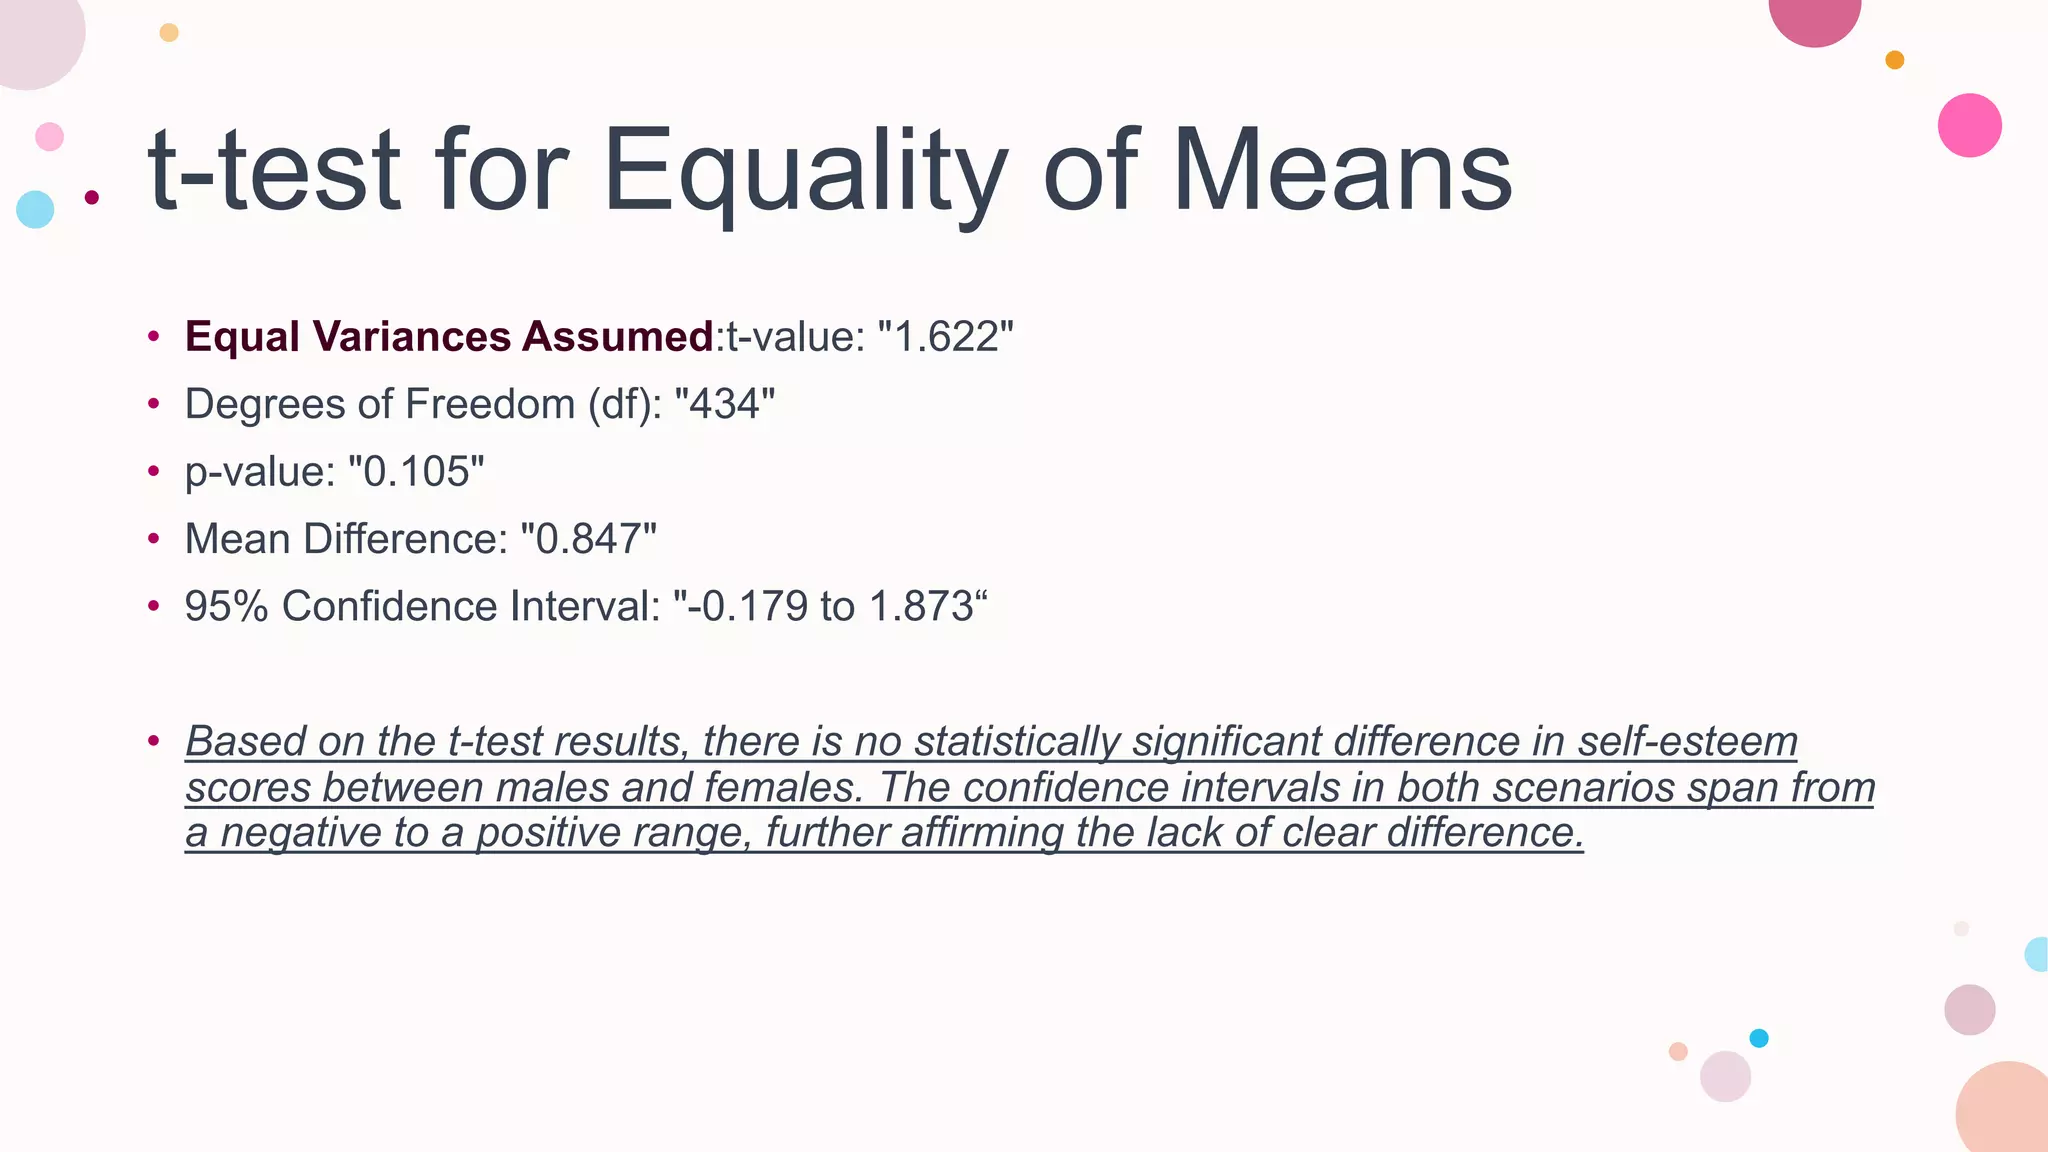
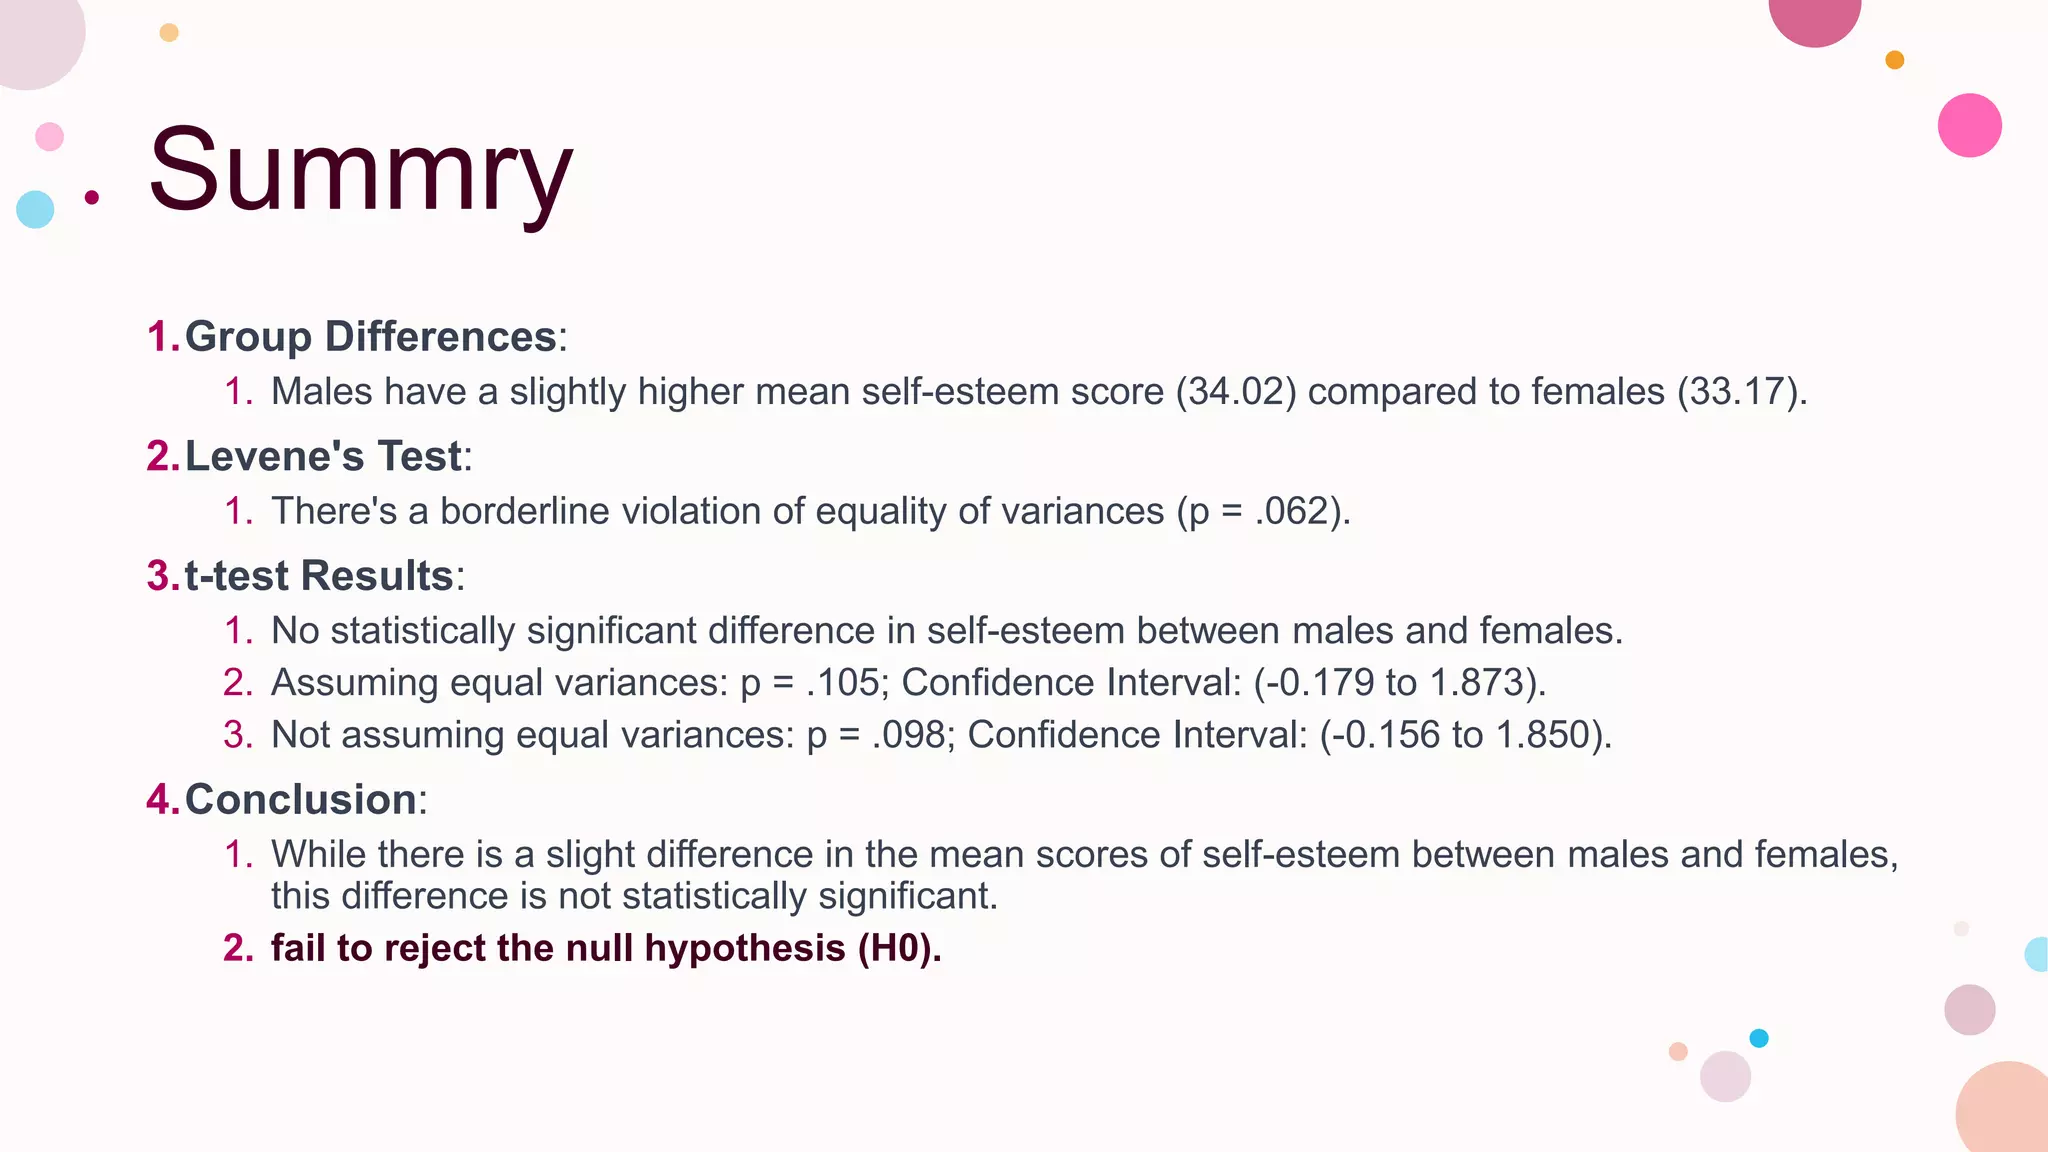
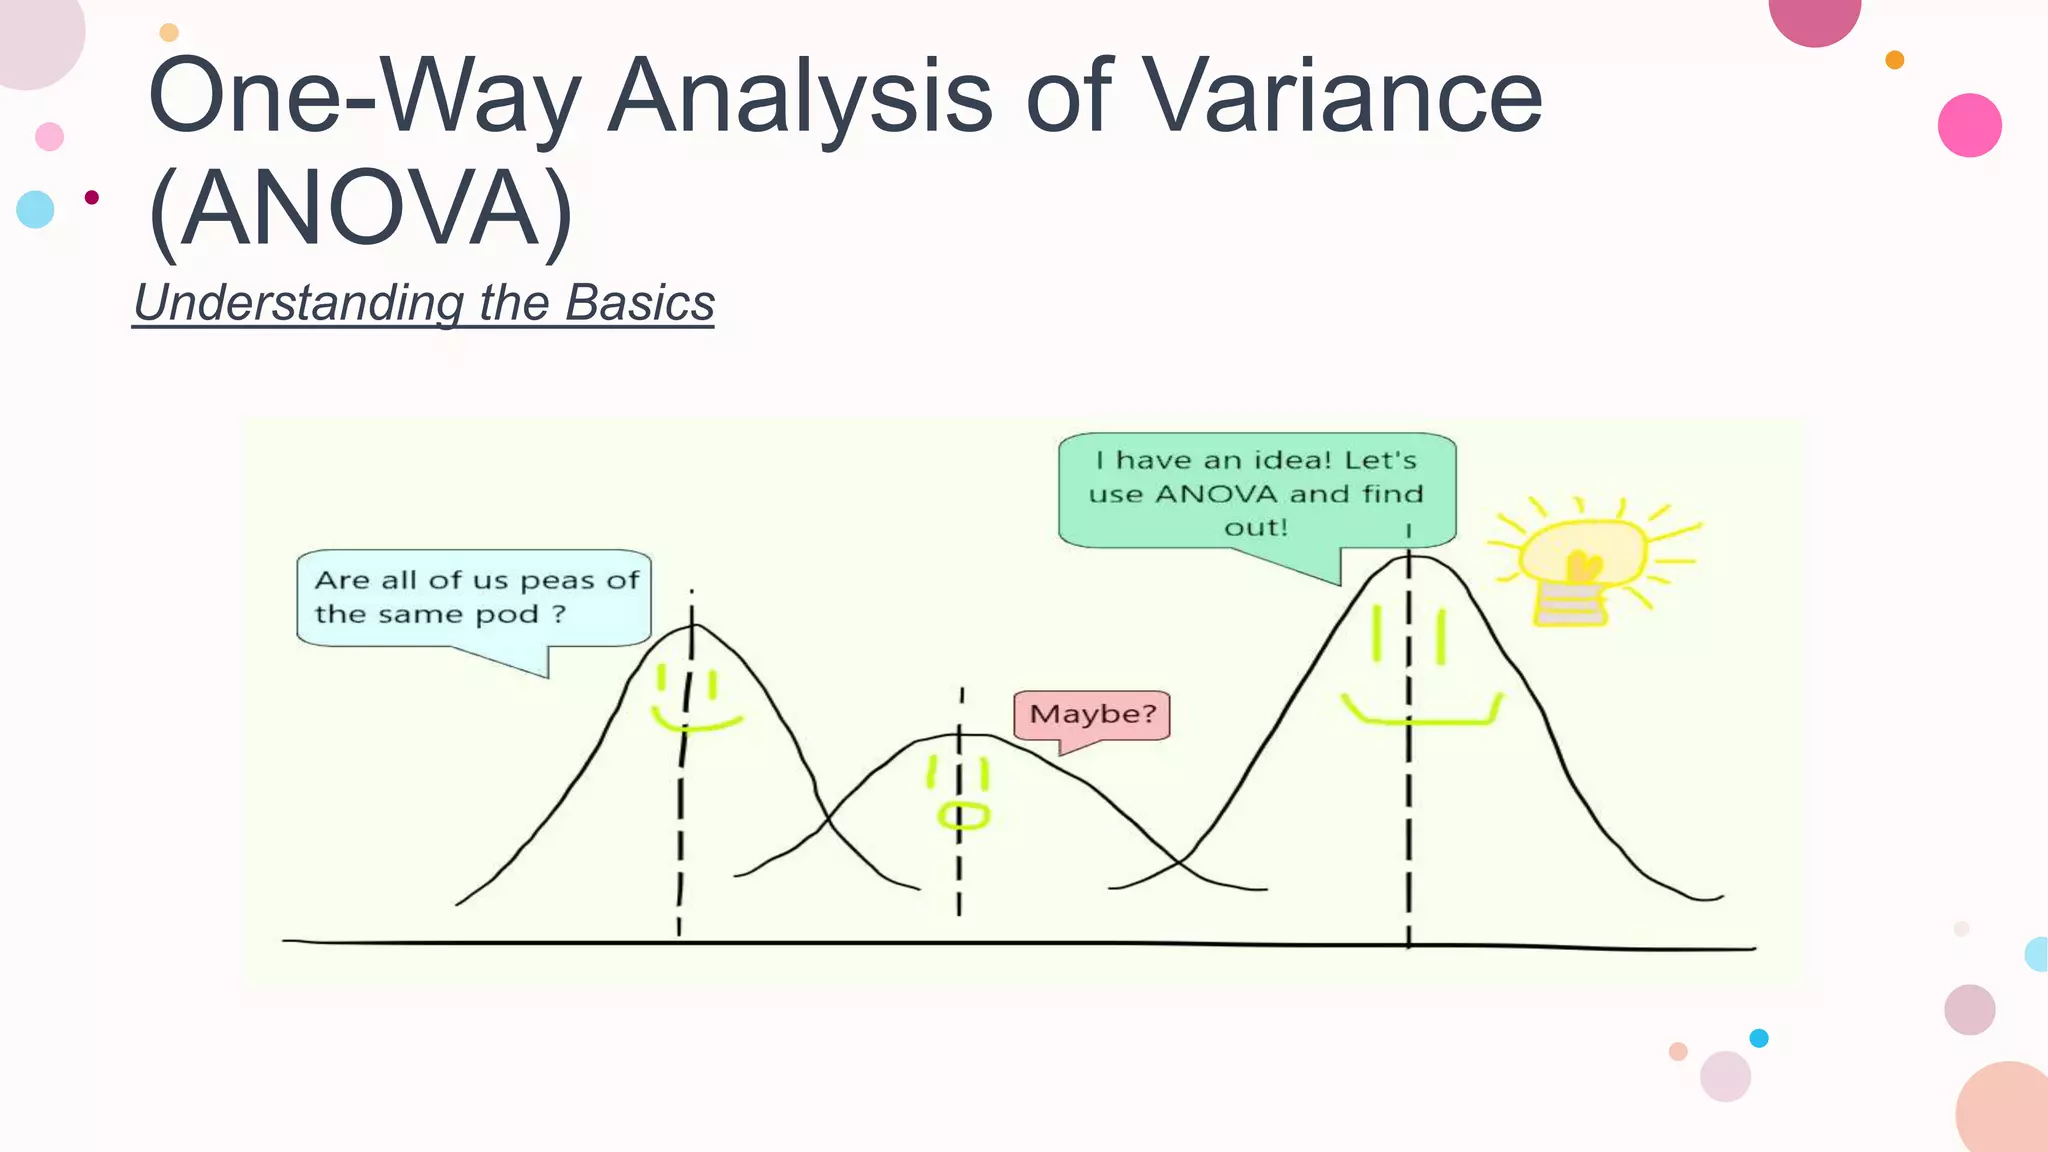
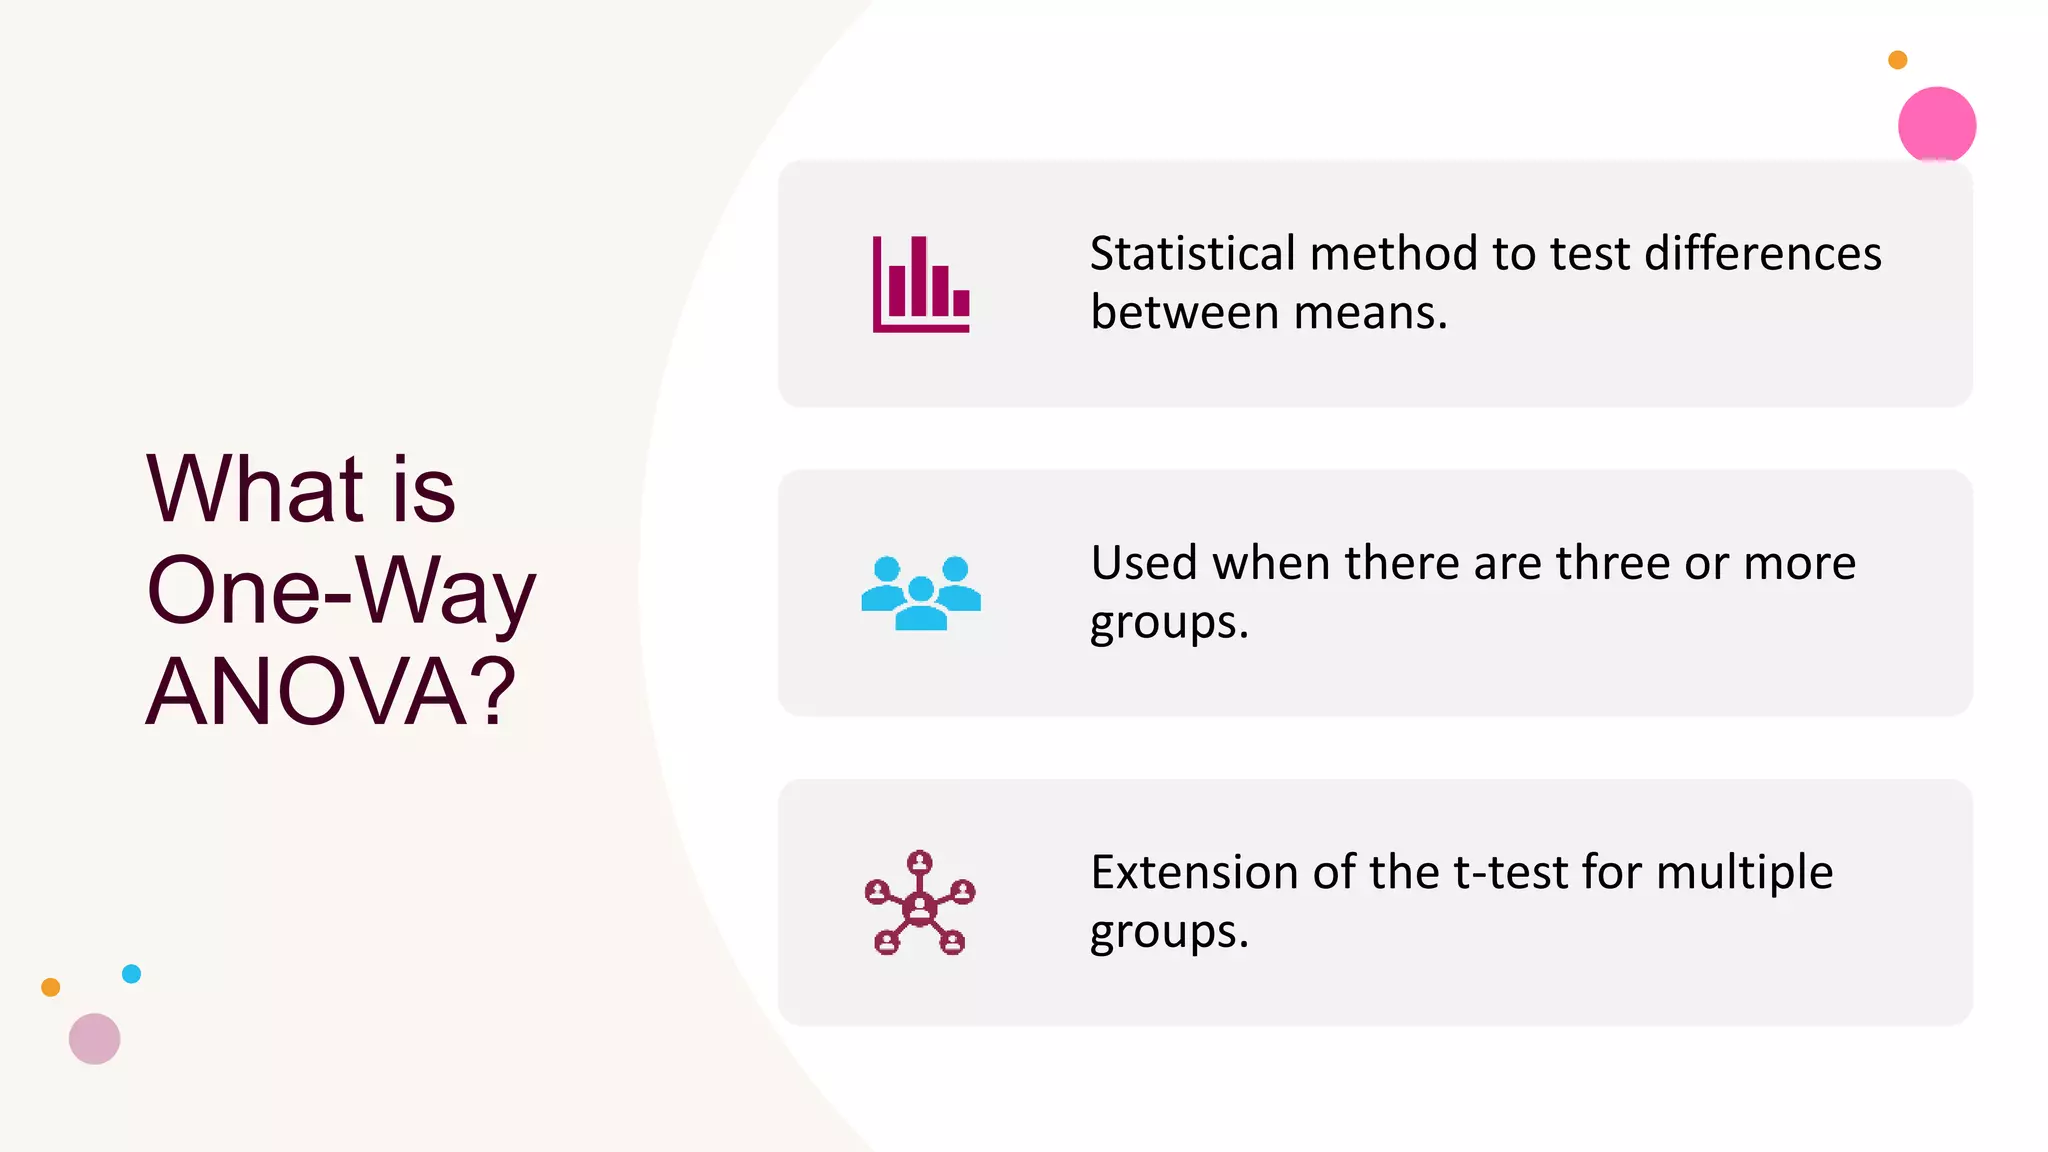
2. The t-test is used to compare the means of two groups and ANOVA is an extension for comparing more than two groups.
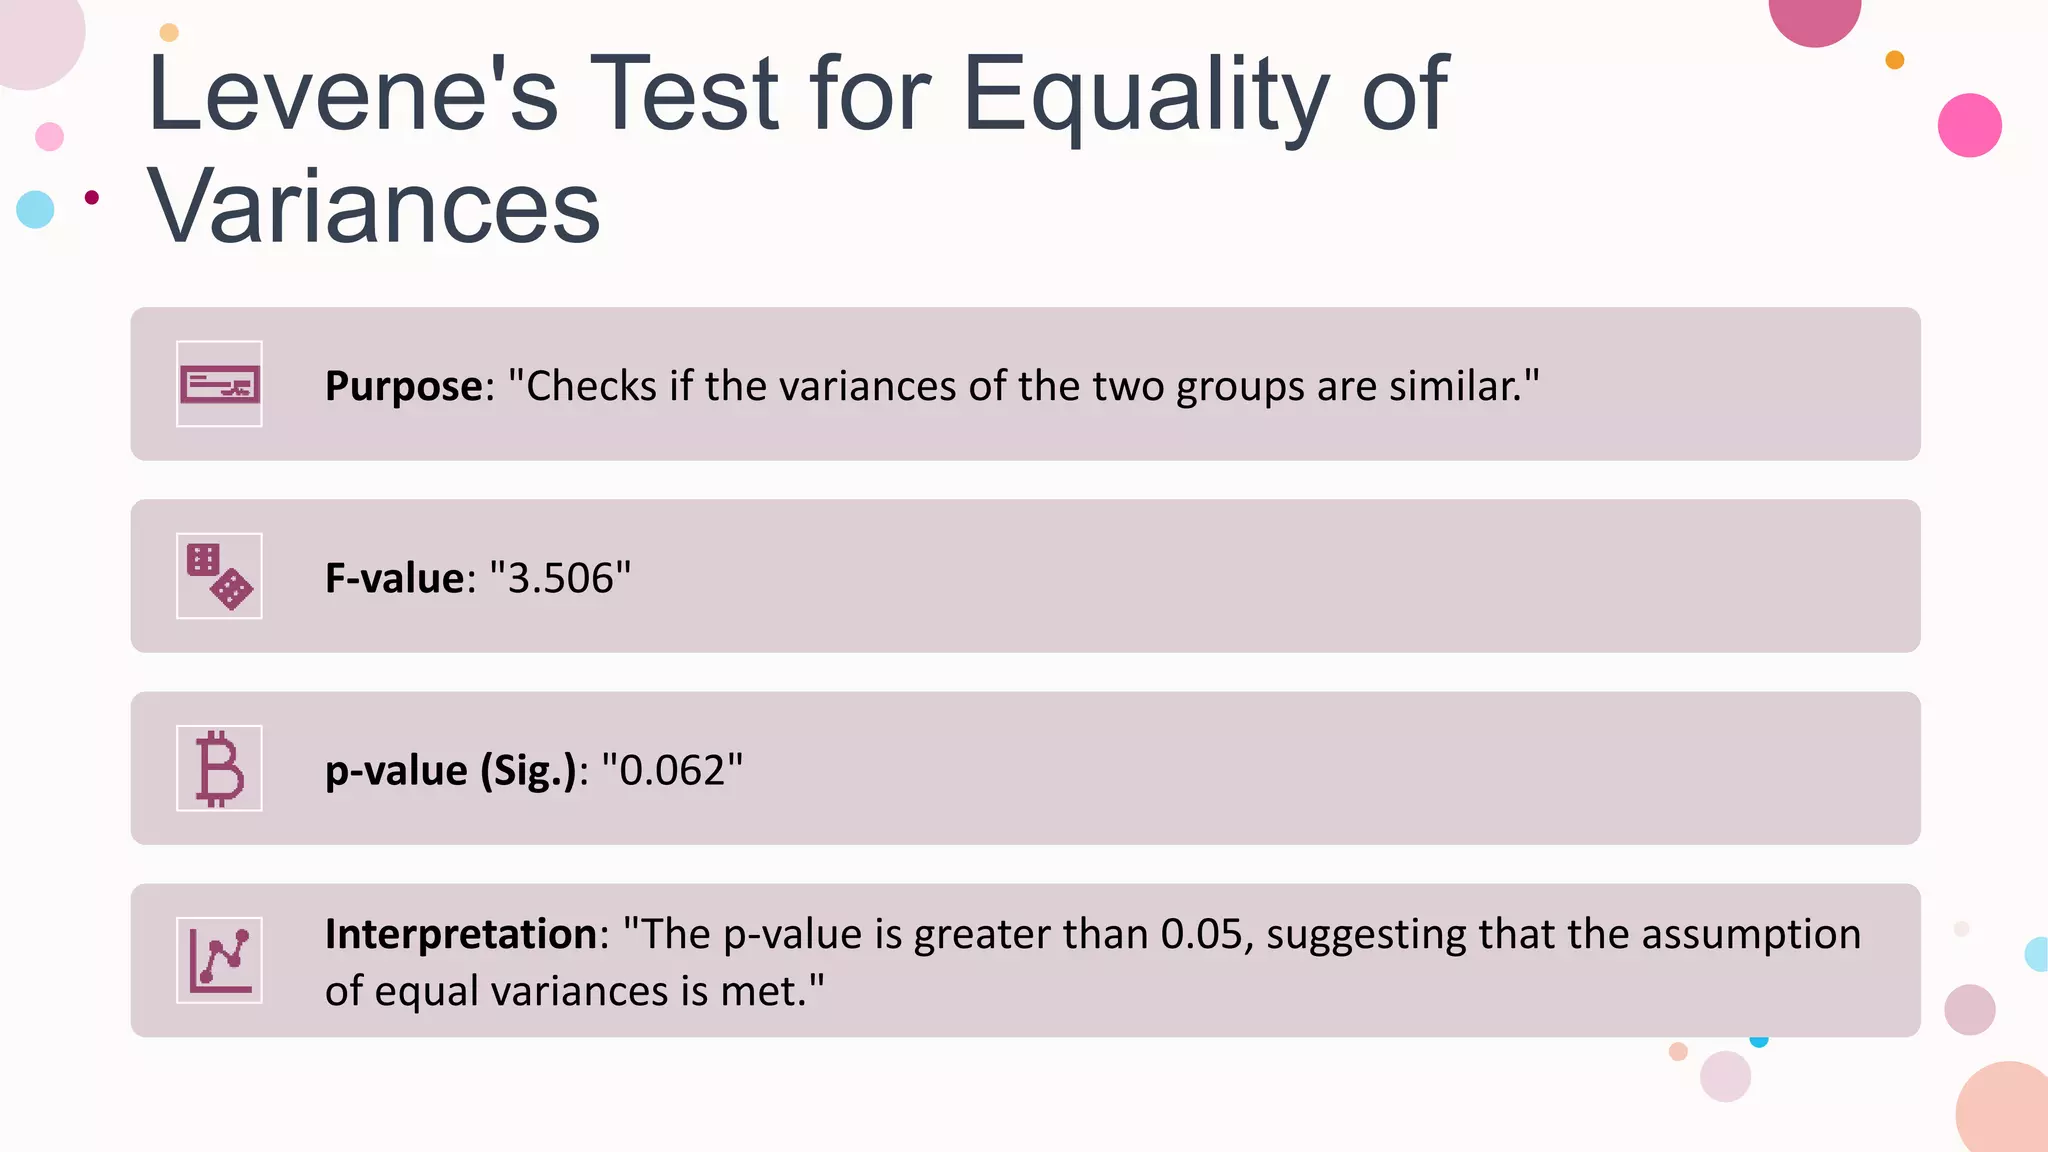
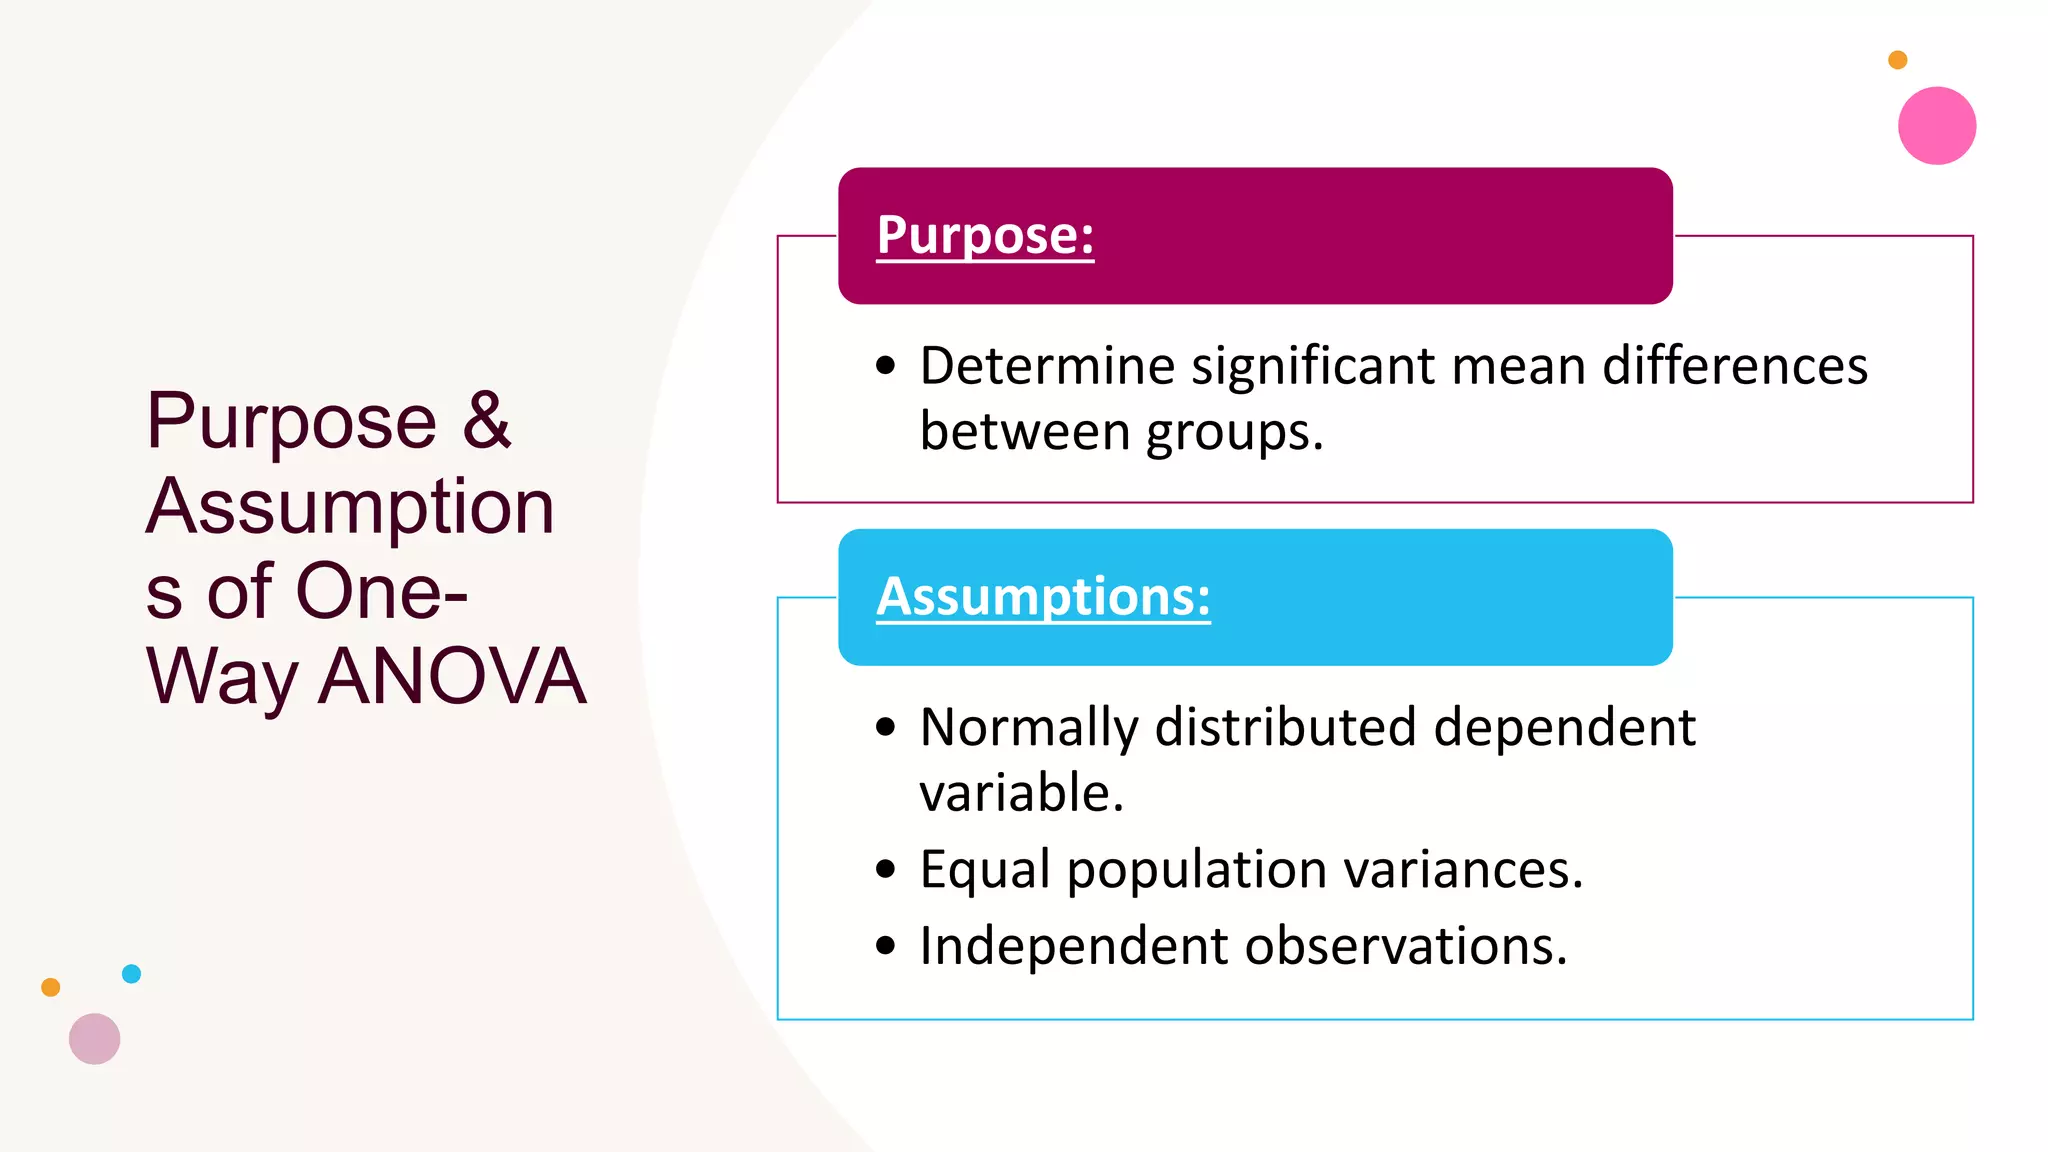
3. Key assumptions for these tests include normal distribution of data, equal variances between groups, and independent observations.
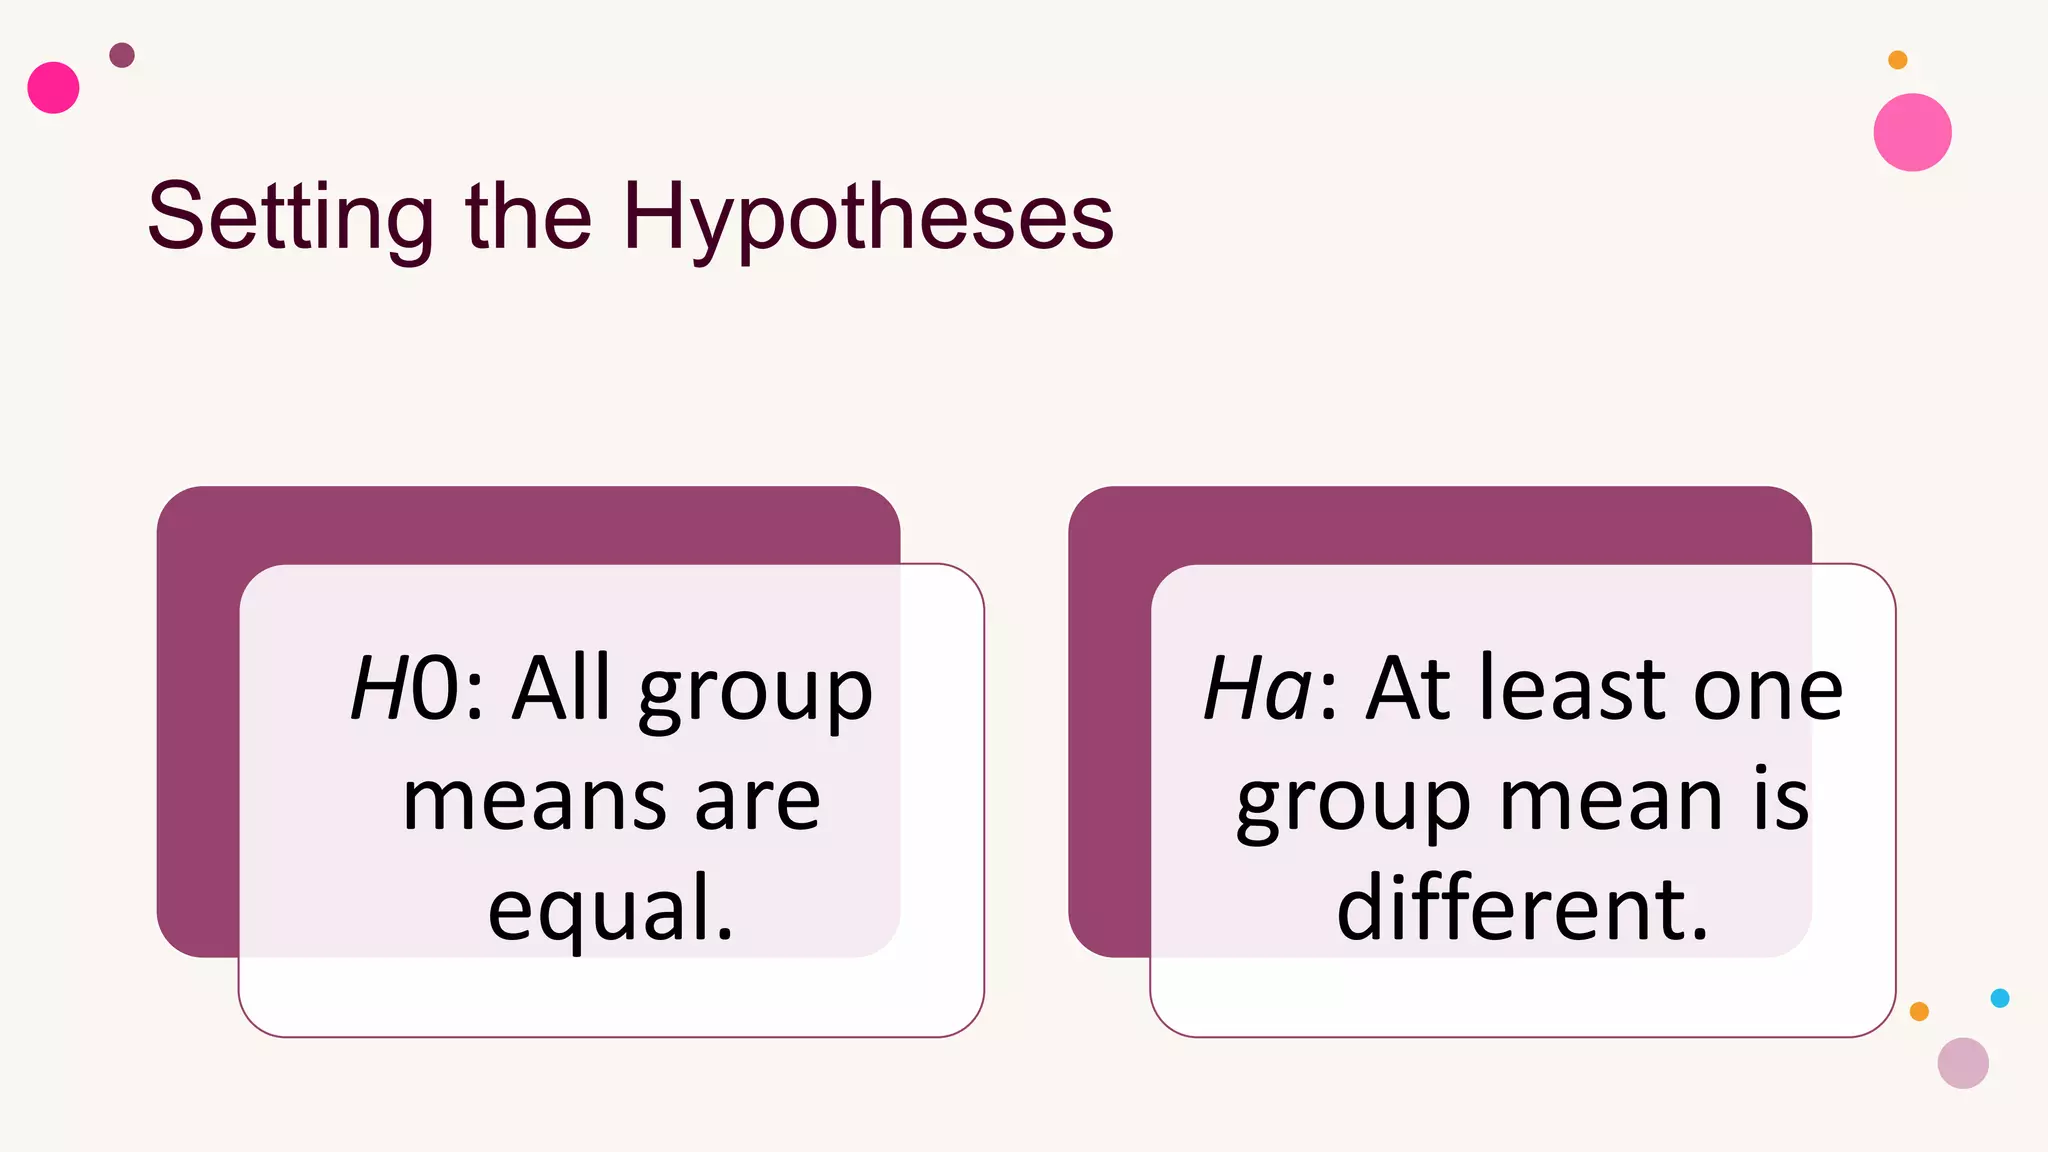
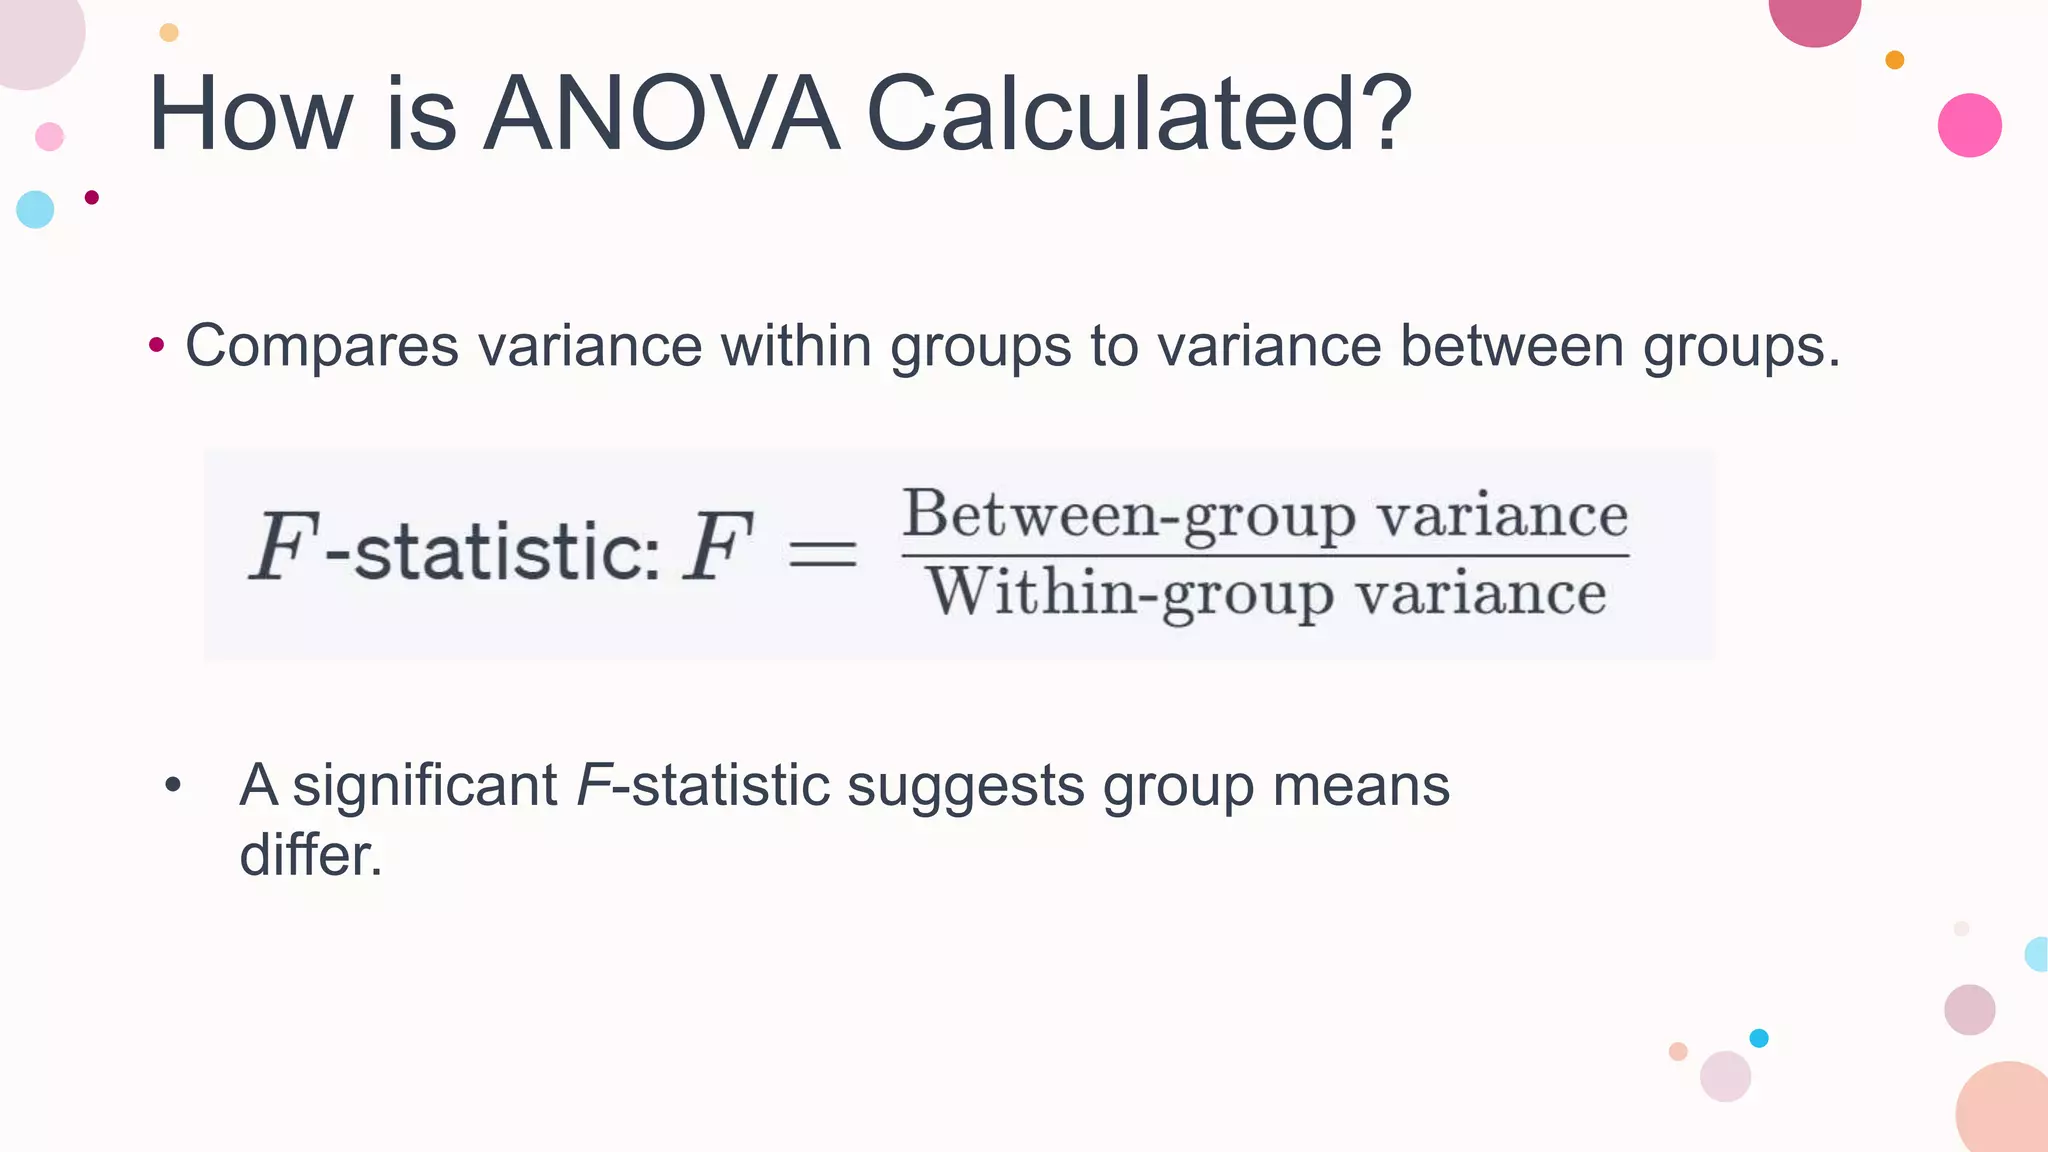
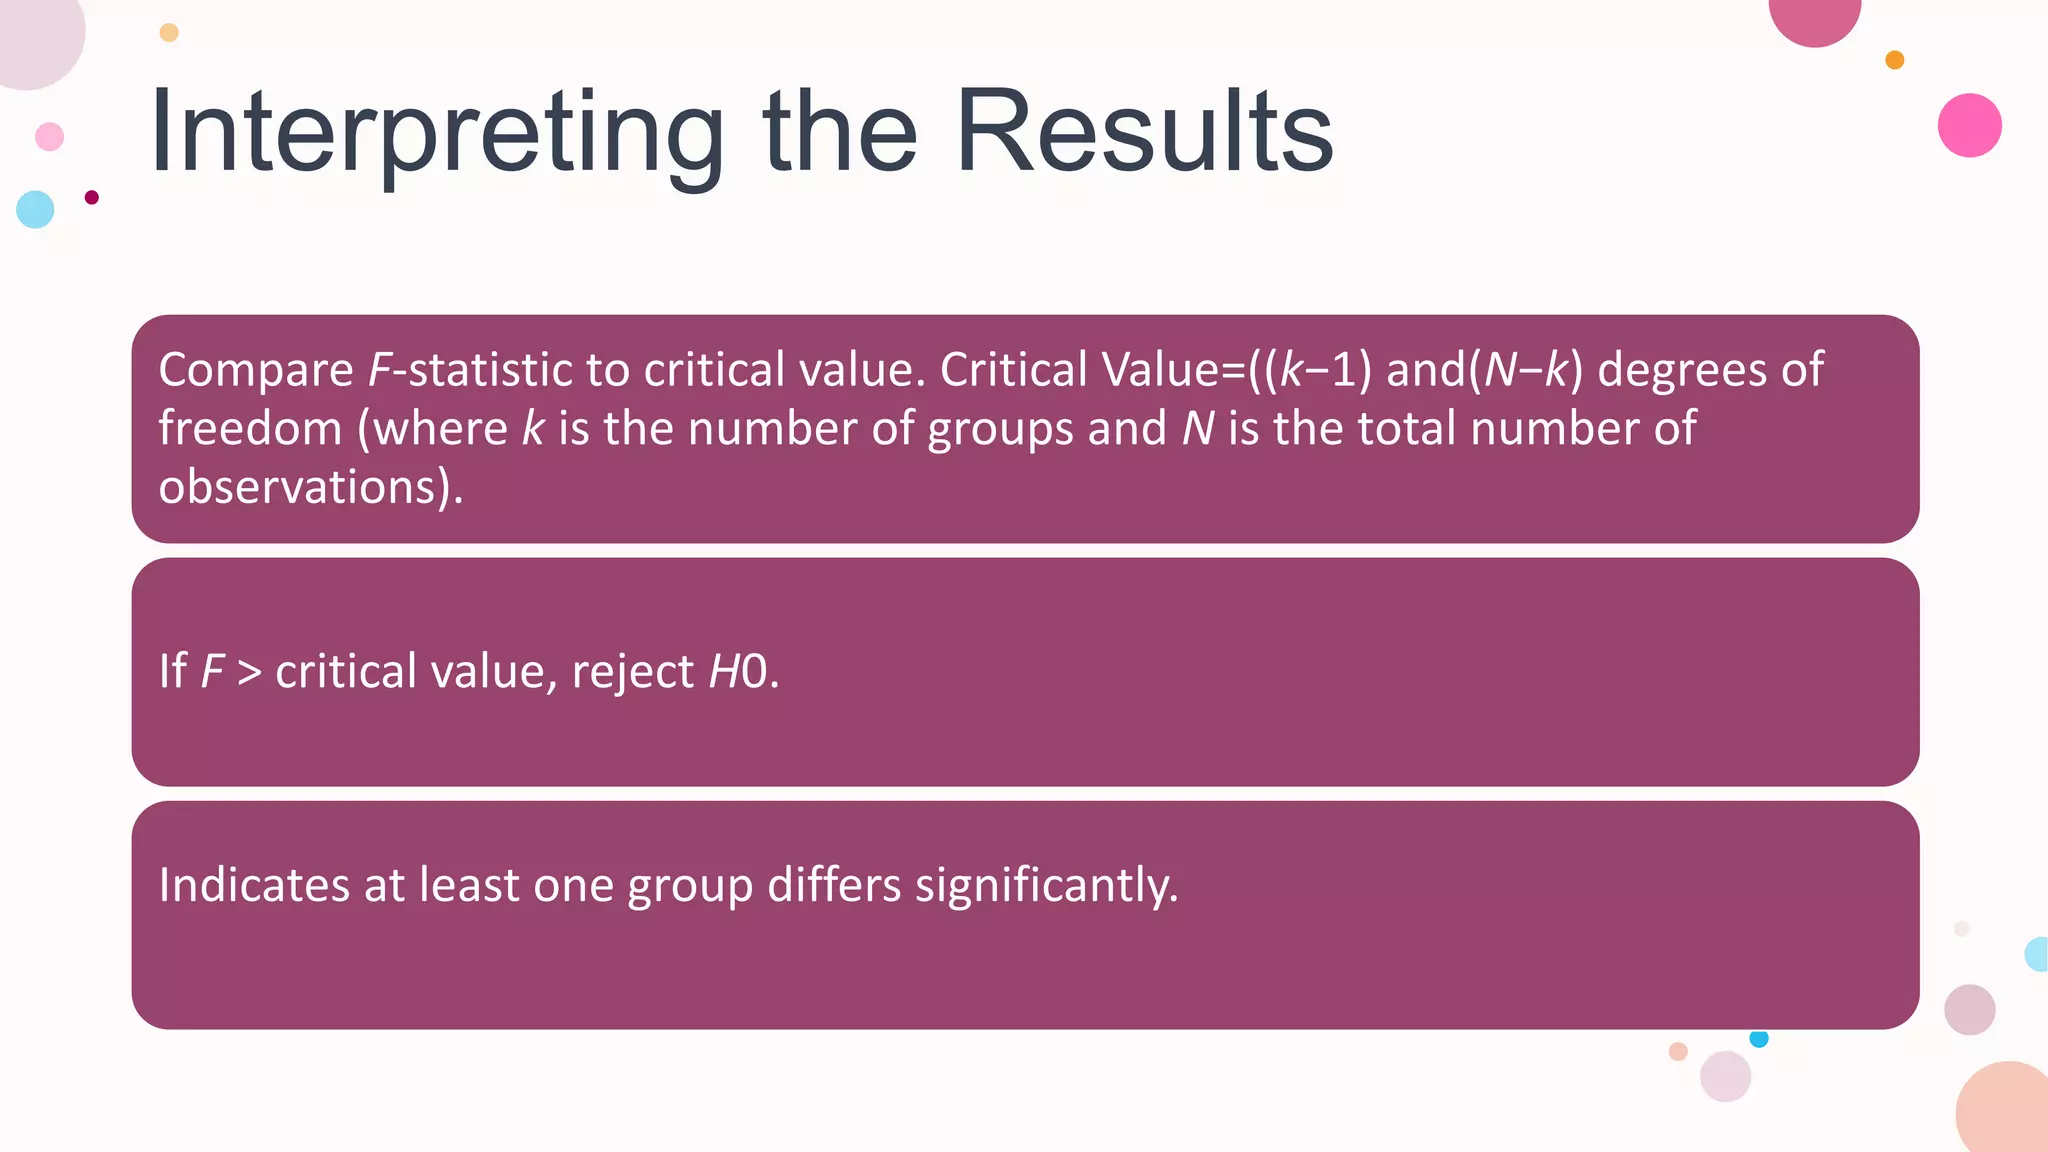
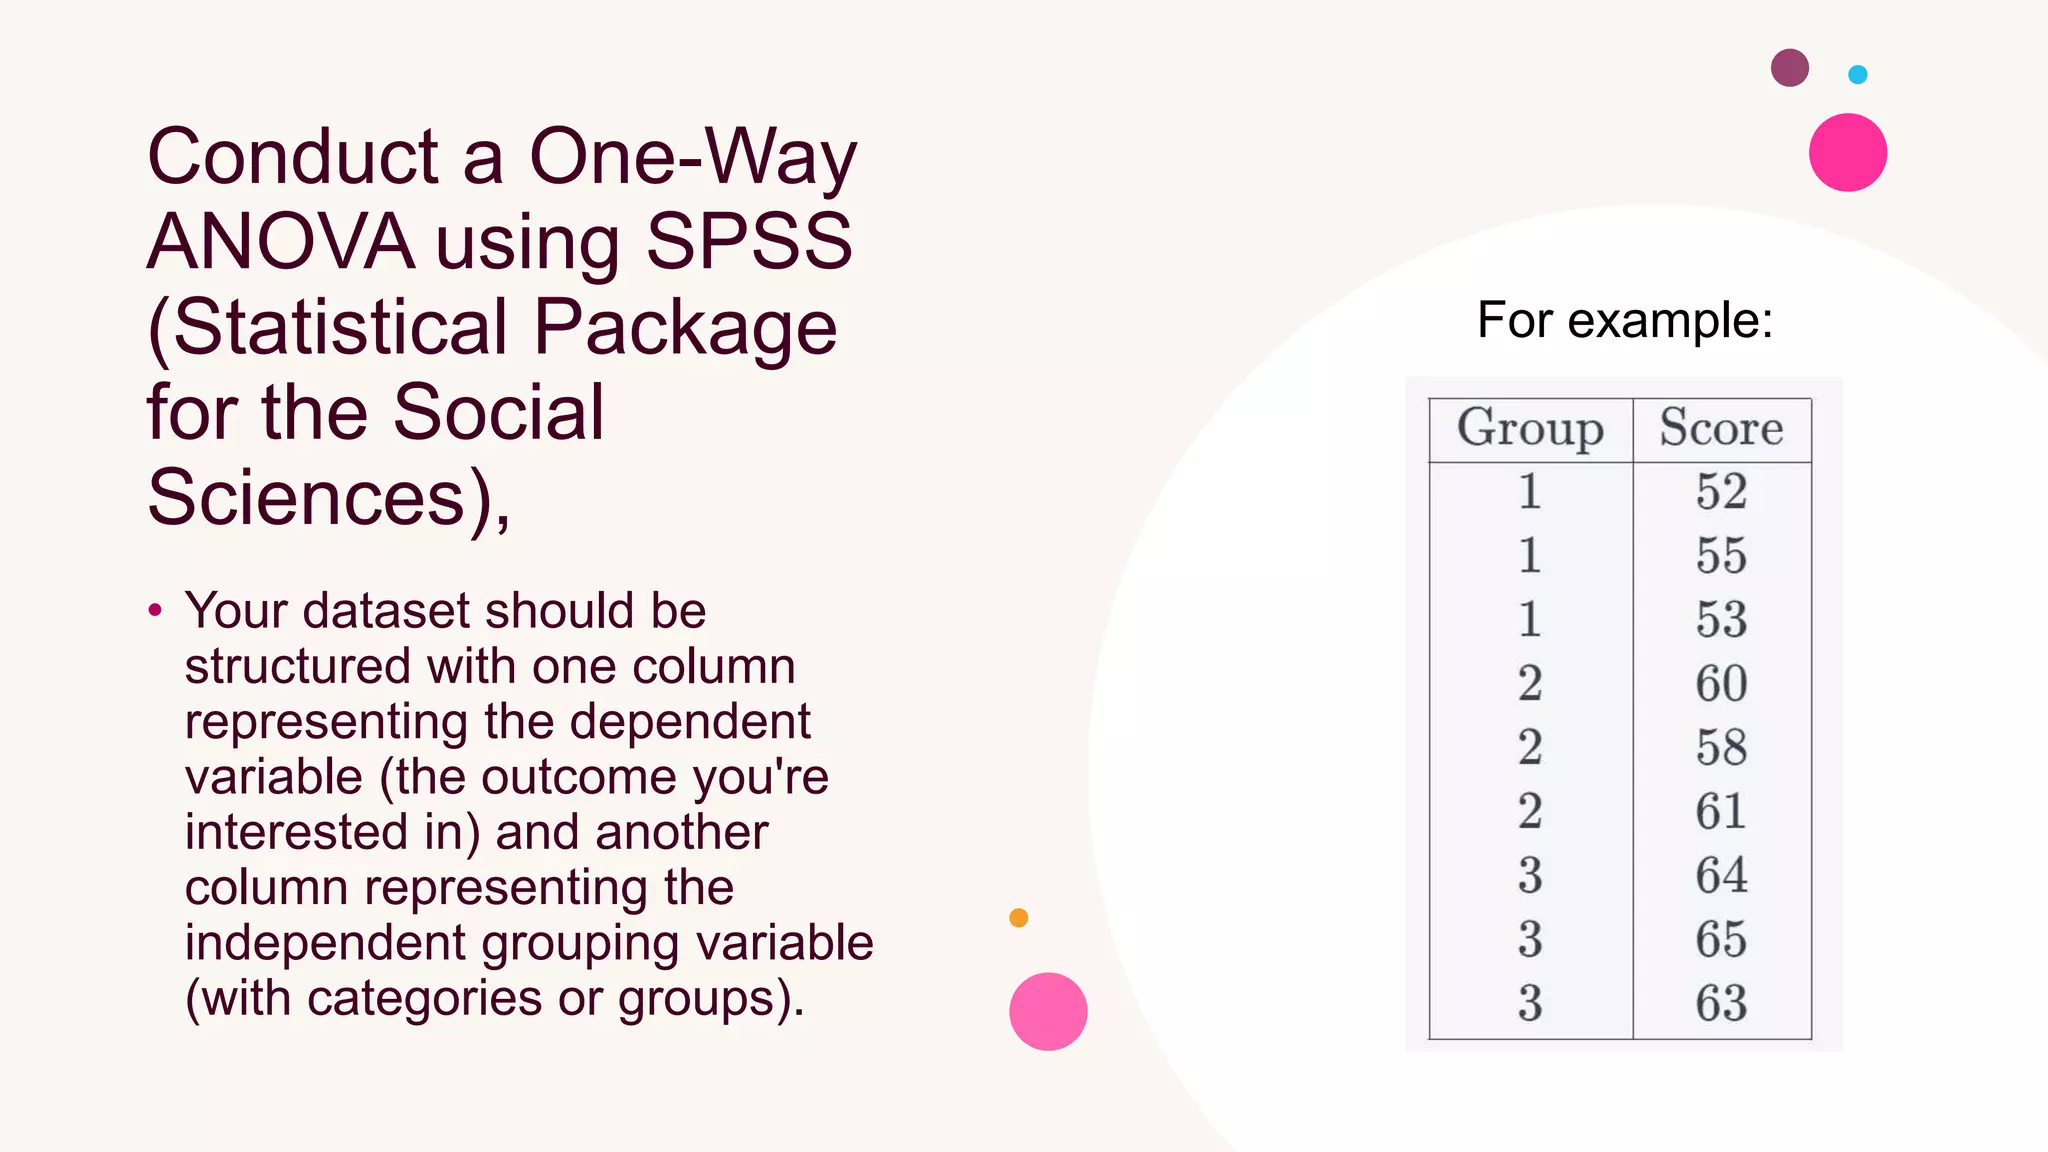
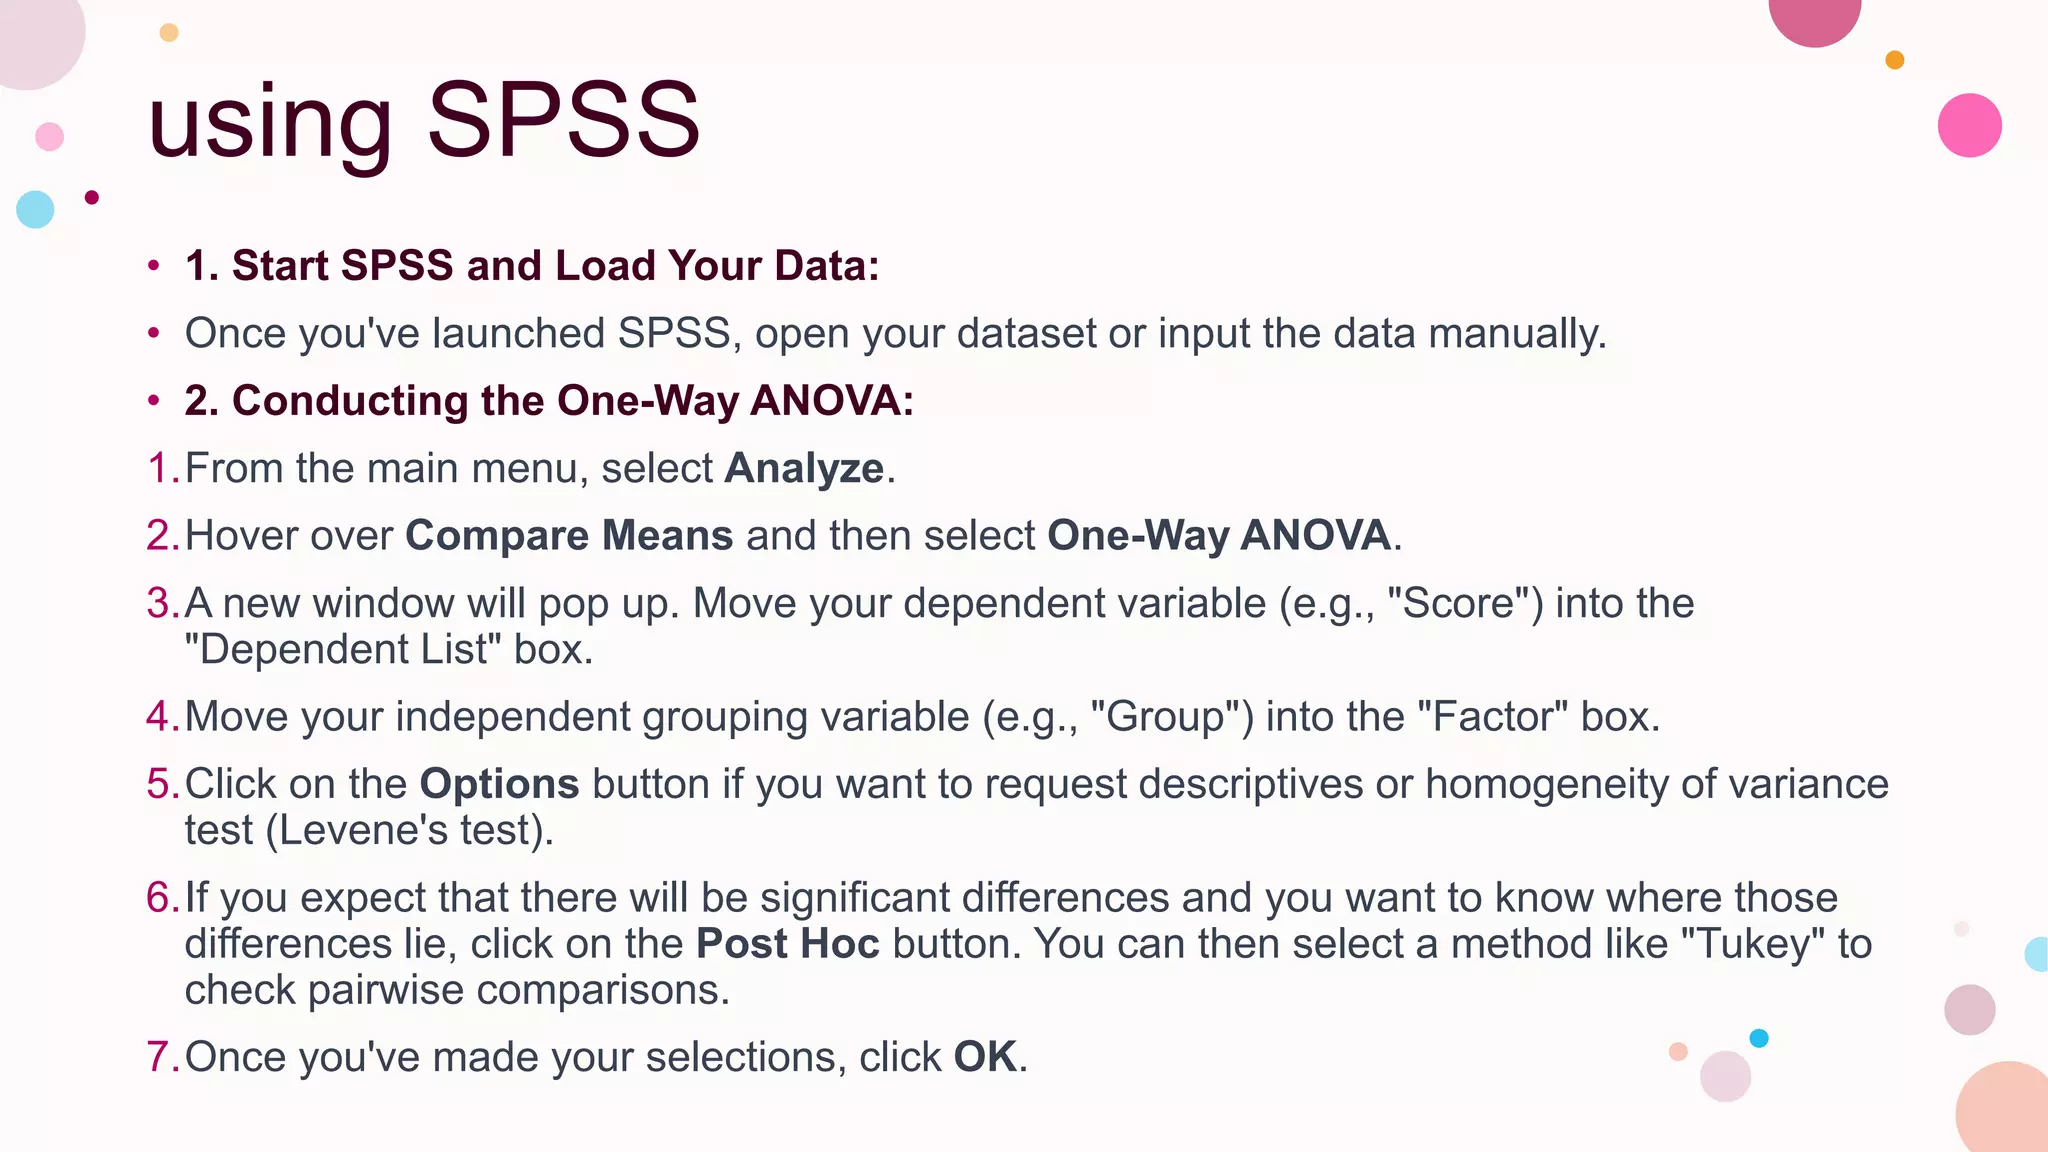
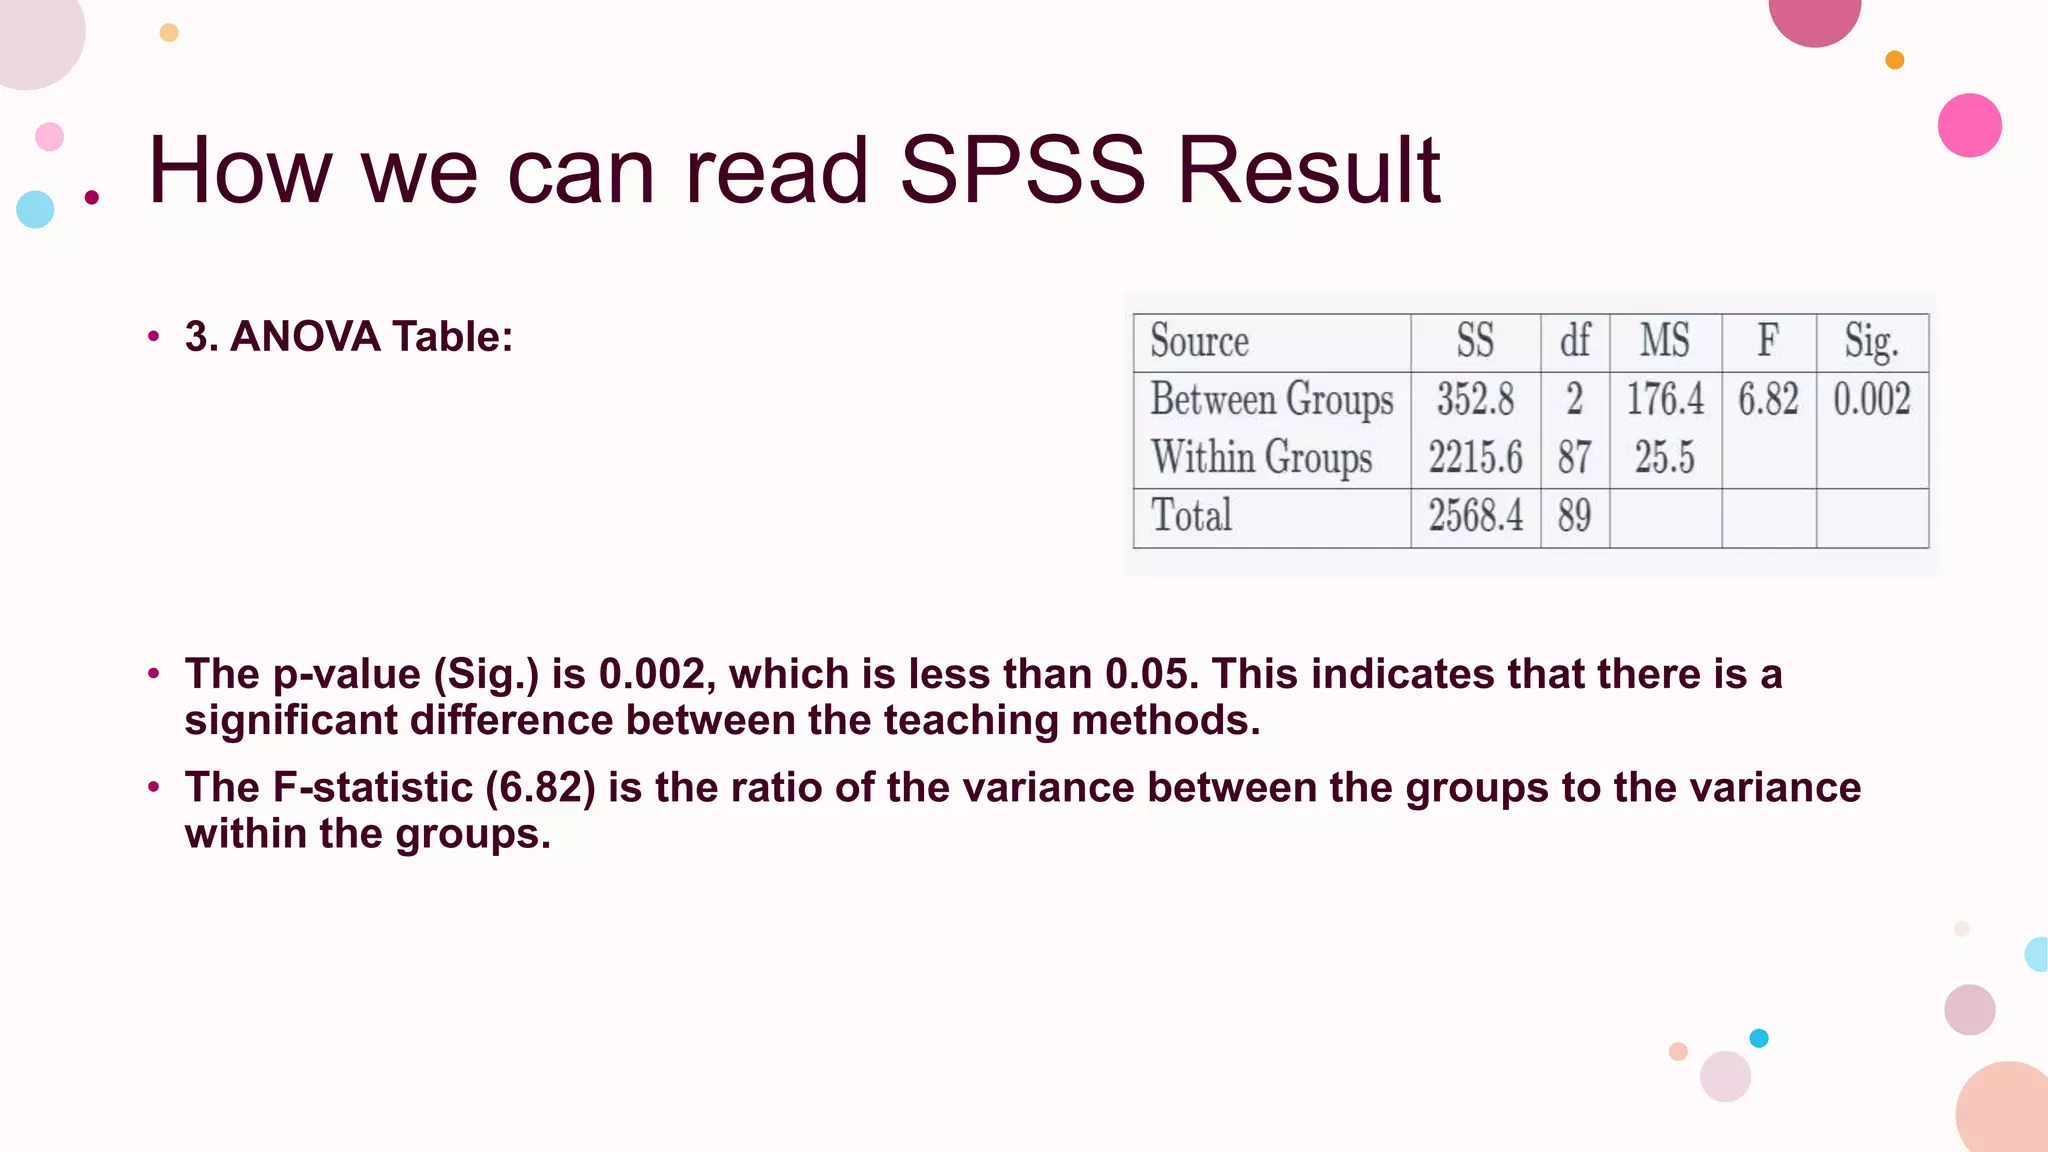
4. Steps for conducting an ANOVA in SPSS are described, including interpreting the F-statistic to determine if group means are significantly different.