Chapter 2.ppt of macroeconomics by mankiw 9th edition
Weekly Review 07-08-10
1. Weekly Review
August 7, 2010
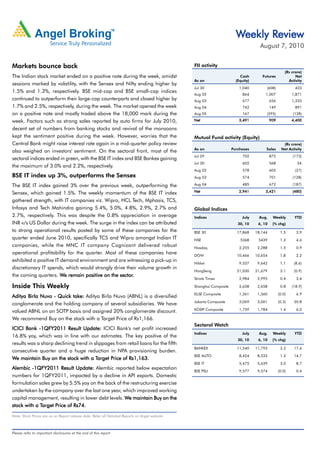
Markets bounce back FII activity
(Rs crore)
The Indian stock market ended on a positive note during the week, amidst Cash Futures Net
As on (Equity) Activity
sessions marked by volatility, with the Sensex and Nifty ending higher by
Jul 30 1,040 (608) 433
1.5% and 1.3%, respectively. BSE mid-cap and BSE small-cap indices
Aug 02 864 1,007 1,871
continued to outperform their large-cap counterparts and closed higher by Aug 03 677 656 1,333
1.7% and 2.5%, respectively, during the week. The market opened the week Aug 04 742 149 891
on a positive note and mostly traded above the 18,000 mark during the Aug 05 167 (295) (128)
week. Factors such as strong sales reported by auto firms for July 2010, Net 3,491 909 4,400
decent set of numbers from banking stocks and revival of the monsoons
kept the sentiment positive during the week. However, worries that the Mutual Fund activity (Equity)
Central Bank might raise interest rate again in a mid-quarter policy review (Rs crore)
As on Purchases Sales Net Activity
also weighed on investors' sentiment. On the sectoral front, most of the
Jul 29 702 875 (173)
sectoral indices ended in green, with the BSE IT index and BSE Bankex gaining
Jul 30 602 568 34
the maximum of 3.0% and 2.2%, respectively.
Aug 02 578 605 (27)
BSE IT index up 3%, outperforms the Sensex Aug 03 574 701 (128)
The BSE IT index gained 3% over the previous week, outperforming the Aug 04 485 672 (187)
Sensex, which gained 1.5%. The weekly momentum of the BSE IT index Net 2,941 3,421 (480)
gathered strength, with IT companies viz. Wipro, HCL Tech, Mphasis, TCS,
Infosys and Tech Mahindra gaining 5.4%, 5.0%, 4.8%, 2.9%, 2.7% and Global Indices
2.7%, respectively. This was despite the 0.8% appreciation in average Indices July Aug. Weekly YTD
INR v/s US Dollar during the week. The surge in the index can be attributed 30, 10 6, 10 (% chg)
to strong operational results posted by some of these companies for the BSE 30 17,868 18,144 1.5 3.9
quarter ended June 2010, specifically TCS and Wipro amongst Indian IT NSE 5368 5439 1.3 4.6
companies, while the MNC IT company Cognizant delivered robust Nasdaq 2,255 2,288 1.5 0.9
operational profitability for the quarter. Most of these companies have DOW 10,466 10,654 1.8 2.2
exhibited a positive IT demand environment and are witnessing a pick-up in
Nikkei 9,537 9,642 1.1 (8.6)
discretionary IT spends, which would strongly drive their volume growth in
HangSeng 21,030 21,679 3.1 (0.9)
the coming quarters. We remain positive on the sector.
sector.
Straits Times 2,984 2,995 0.4 3.4
Inside This Weekly Shanghai Composite 2,638 2,658 0.8 (18.9)
KLSE Composite 1,361 1,360 (0.0) 6.9
Aditya Birla Nuvo - Quick take: Aditya Birla Nuvo (ABNL) is a diversified
Jakarta Composite 3,069 3,061 (0.3) 20.8
conglomerate and the holding company of several subsidiaries. We have
KOSPI Composite 1,759 1,784 1.4 6.0
valued ABNL on an SOTP basis and assigned 20% conglomerate discount.
We recommend Buy on the stock with a Target Price of Rs1,166.
Sectoral Watch
ICICI Bank -1QFY2011 Result Update: ICICI Bank's net profit increased
Indices July Aug. Weekly YTD
16.8% yoy, which was in line with our estimates. The key positive of the
30, 10 6, 10 (% chg)
results was a sharp declining trend in slippages from retail loans for the fifth
BANKEX 11,540 11,793 2.2 17.6
consecutive quarter and a huge reduction in NPA provisioning burden.
BSE AUTO 8,424 8,533 1.3 14.7
Target Price
We maintain Buy on the stock with a Target Price of Rs1,163.
BSE IT 5,475 5,639 3.0 8.7
Alembic -1QFY2011 Result Update: Alembic reported below expectation
BSE PSU 9,577 9,574 (0.0) 0.4
numbers for 1QFY2011, impacted by a decline in API exports. Domestic
formulation sales grew by 5.5% yoy on the back of the restructuring exercise
undertaken by the company over the last one year, which improved working
capital management, resulting in lower debt levels. We maintain Buy on the
Target Price
stock with a Target Price of Rs74.
Note: Stock Prices are as on Report release date; Refer all Detailed Reports on Angel website.
Please refer to important disclosures at the end of this report
2. Fundamental Focus | August 7, 2010
Focus
Aditya Birla Nuvo - Buy Price - Rs811
Target Price - Rs1,166
Quick take - Deep Value
Aditya Birla Nuvo (ABNL) is a diversified conglomerate and the d) Other Financial Services (excluding Birla Sunlife AMC): The
Financial
holding company of several subsidiaries having business company's Other Financial Services (excluding Birla Sunlife
interests in insurance, asset management, financial services, AMC) comprise the NBFC, broking, private equity, wealth
garments, carbon black, insulators, rayon, fertilisers, IT and management and general insurance advisory segments. We
ITeS businesses. The company also holds ~25% stake in Idea have valued this segment on P/E basis.
Cellular. e) Life Insurance business: ABNL holds 74% stake in its
ABNL's Business Structure insurance arm. We have valued the segment on the basis of
'Embedded Value' and 'Value for New Business' declared by the
company in 1QFY2011. We have assigned a holding company
discount of 20% to ABNL's stake value.
f) Asset Management: ABNL holds 50% in Birla Sunlife Asset
Management Company (BSAMC). We have valued the AMC at
3.5% of the assets under management (AUM) as declared by
the company in 1QFY2011.
g) Telecom: ABNL holds 25.4% stake in Idea Cellular (Idea).
We have valued this stake on the basis of market cap of Idea at
Source: Company, Angel Research
our target price of Rs55 and assigned 30% holding company
On account of the diverse nature of ABNL's businesses, we have discount to the same.
adopted the sum-of-the-parts (SOTP) methodology to evaluate
h) We have considered net debt, on a standalone basis, as we
the company.
have valued the standalone businesses on the EV parameter.
Valuation Methodology Outlook and Valuation
a) Manufacturing business: The company's manufacturing
ABNL has started delivering improved performance in its
business constitutes carbon black, fertilisers, insulators, rayon
manufacturing businesses. The BPO and garments businesses
and textiles, which we have valued on EV/EBIDTA basis.
have been profitable since the last two quarters. The insurance
b) Garment: We have valued this segement on EV/Sales basis, business and the AMC are also well geared to benefit from the
as the company has yet to report profit at the EBIDTA level. significant market opportunity lying ahead. We have valued
c) IT-ITeS: We have valued the IT-ITeS segment (88.3%) holding
IT-ITeS:
-ITeS ABNL on SOTP basis and assigned 20% conglomerate discount.
of ABNL) on Mcap/Sales basis, as the business is at the Target Price
We recommend a Buy on the stock, with a Target Price of
stabilisation stage. Rs1,166.
SOTP valuation
Research Analyst - Viraj Nadkarni
For Private Circulation Only | Angel Broking Ltd: BSE Sebi Regn No : INB 010996539 / CDSL Regn No: IN - DP - CDSL - 234 - 2004 / PMS Regn Code: PM/INP00000154 6 Angel Securities Ltd:BSE: INB010994639/INF010994639 NSE: INB230994635/INF230994635 Membership numbers: BSE 028/NSE:09946 2
3. Fundamental Focus | August 7, 2010
Focus
3i Infotech - Buy Price - Rs64
Target Price - Rs100
1QFY2011 Result Update
Performance Highlights book position (representing assured revenue stream for the next
seven months), which currently stands at Rs1,730cr, comprising
Y/E March 1QFY11 4QFY10 % chg 1QFY10 % chg
(Rs cr) (qoq) (yoy) 60% of IT solutions business revenue and the remaining of
Net revenue 637 628 1.4 598 6.6 transaction services business.
EBITDA margin (%) 19.5 19.7 (0.2) 19.9 (0.4)
Outlook and valuation
PAT 61 (167) - 87 (29.5)
Source: Company, Angel Research 3i Infotech maintained its top-line guidance in the range of
Rs2,740cr-2,814cr for FY2011E, growth of 11-14% yoy. This is
3i Infotech reported subdued results, with the top line witnessing
miniscule growth of 1.4% qoq. Despite slight EBITDA margin represented by a strong pipeline with a pending order book
dip, the company reported net profit in 1QFY2011 v/s net loss position, which currently stands at Rs1,730cr. We believe the
clubbing of the erstwhile products segment and the IT services
witnessed in 4QFY2010.
segment under the IT solutions business segment would help
3i Infotech recorded subdued 1QFY2011 performance: 3i the company to meet the upcoming demand for the bundled
Infotech's top line grew by 1.4% qoq (6.6% yoy) to Rs637cr, led offerings of IT products and services, thus enhancing the value
by 2.6% qoq growth in IT solutions business (the erstwhile proposition in the IT solutions business. Thus, we expect 3i
products segment and the IT services segment will be clubbed Infotech to post a 14% CAGR in revenue over FY2010-12E.
under the IT solutions business segment from 1QFY2011). However, the ongoing operational and growth-related initiatives
Despite a 10% wage hike effective in 1QFY2011, 3i Infotech are expected to exert pressure on margins, thereby resulting in
was able to maintain EBITDA margin at 19.5%, thereby a 6.4% CAGR in the bottom line over FY2010-12E. Hence, we
witnessing a slight dip of 26bp qoq (46bp yoy). Depreciation have revised our Target Price downwards to Rs100 (Rs129),
Target Price
costs increased on a sequential basis, while the tax rate increased implying a P/E multiple of 6x FY2012E earnings and continue
to 7.5% in 1QFY2011 from 5.9% in 4QFY2010. Thus, the to maintain a Buy recommendation on the stock.
bottom line excluding one-time exceptional income and
expenses declined by 25.7% qoq (up 3.9% yoy) to Rs61cr, while
the bottom line including one-time exceptional income and
expenses stood at Rs61cr in 1QFY2011 compared to a net loss
Key Financials (Consolidated)
of Rs167cr in 4QFY2010 (on account of write-off related to Y/E March (Rs cr) FY2009 FY2010 FY2011E FY2012E
the Kiosk business), but was down by 29.5% yoy. Net sales 2,286 2,449 2,756 3,200
Re-defining business to derive better value proposition: The
Re- % chg 89.6 7.1 12.6 16.1
clubbing of the erstwhile products segment and the IT services Net profit 282 33 291 333
segment under the IT solutions business segment would help 3i % chg 59.7 (88.1) 770.0 14.3
Infotech to meet the upcoming demand for the bundled offerings
EBITDA margin (%) 19.3 19.7 18.6 18.2
of IT products and services. Further, through the company's
global delivery centres, these integrated offerings are expected FDEPS (Rs) 21.6 1.7 14.6 16.7
to get a boost in demand, which will enhance the value P/E (x) 3.0 32.3 4.4 3.8
proposition in the IT solutions business by undertaking several P/BV (x) 0.7 1.0 0.8 0.7
cross-selling and up-selling opportunities. RoE (%) 28.8 2.9 21.0 18.6
Management's FY2011E guidance maintained: Management RoCE (%) 14.4 12.7 14.1 15.6
continued to maintain its top-line growth guidance in the range
EV/Sales (x) 1.1 1.2 1.0 0.8
of Rs2,740cr-2,814cr for FY2011E, a yoy increase of 11-14%.
EV/EBITDA (x) 5.6 5.9 5.1 4.0
This is represented by a strong pipeline with a pending order
Source: Company, Angel Research; Price as on August 3, 2010
Research Analyst - Vibha Salvi
For Private Circulation Only | Angel Broking Ltd: BSE Sebi Regn No : INB 010996539 / CDSL Regn No: IN - DP - CDSL - 234 - 2004 / PMS Regn Code: PM/INP00000154 6 Angel Securities Ltd:BSE: INB010994639/INF010994639 NSE: INB230994635/INF230994635 Membership numbers: BSE 028/NSE:09946 3
4. Fundamental Focus | August 7, 2010
Focus
Anant Raj Industries - Buy Price - Rs120
Target Price - Rs178
1QFY2011 Result Update
Performance Highlights During the quarter, ARIL acquired 15.5 acres (FSI of 2) of land
Y/E March 1QFY11 4QFY10 % chg 1QFY10 % chg
for Rs85cr (Rs531/sq. ft.) at Gurgaon Sec 91. The company
(Rs cr) (qoq) (yoy) intends to launch it as a mid-income residential project over
Net sales 103 34 203.4 105 (1.5) the next six months. This is in line with the company's strategy
EBITDA 57 26 117.0 76 (25.2) to acquire land at a cheaper cost.
OPM margin (%) 55.0 76.9 (2,191bp) 72.4 (1,741bp)
PAT 46 31 48.1 69 (33.5) Outlook
Source: Company, Angel Research
ARIL is trading at 42% discount to our one-year forward NAV,
Anant Raj Industries' (ARIL) 1QFY2011 results were in line with which gives a margin of safety, given its low-cost land bank
our expectations. ARIL's net sales grew by 203.4% qoq (down situated at prime locations and a well-capitalised balance sheet.
1.5% yoy) to Rs103cr. During the quarter, ARIL changed its Target Price
We maintain Buy on the stock with a Target Price of Rs178,
accounting method for booking revenue to gross-sales method one-year
which is at 15% discount to our one-year forward NAV. NAV
from net-of-costs method, which resulted in lower OPM (55%).
Thus, PAT grew by 48.1% qoq to Rs45.8cr. We maintain a Buy
view on the stock.
1QFY2011 revenue driven by new residential launches: During
1QFY2011, ARIL launched two residential projects in NCR,
Kapashera (0.28mn sq. ft.) and Manesar (1mn sq. ft.) for
Rs5,000/sq. ft. and Rs2,500/sq. ft., respectively. The Kapashera
property has been entirely sold (112 flats) and ~50% of the
Manesar property (500 flats) has been sold out so far. During
the quarter, ARIL booked Rs82cr of revenue from its Kapashera
property.
Change in accounting method and revenue mix impact Key Financials (Consolidated)
margins: Historically, ARIL's revenue has been driven by land/
Y/E March (Rs cr) FY2009 FY2010 FY2011E FY2012E
FSI sale and rental income, where it booked revenue on net
Net Sales 251 286 491 995
sales basis, excluding land cost. In 1QFY2011, ARIL changed
its accounting method to gross sales, resulting in lower OPM at % chg (58.5) 14.2 71.5 102.7
55%, from its high of 85-95%. We expect OPM to remain at the Profit
Net Profit 207 238 209 434
current level, with increasing share of residential projects. % chg (52.5) 14.9 (12.1) 107.4
Improving visibility in rental income: ARIL's rental revenue grew EBITDA (%) 88.0 90.3 52.7 58.2
by 20.7% qoq to Rs18cr. The company earned Rs4.5cr from EPS (Rs) 6.6 7.6 6.6 13.8
the Manesar IT Park project, Rs8.1cr from three hotels, Rs1.2cr
P/E (x) 18.2 15.8 18.0 8.7
from Karol Bagh Mall and Rs3.6cr from Jhandewalan and Faiz
Road. Further, we expect ARIL's Manesar and Kirti Nagar P/BV (x) 1.1 1.0 1.0 0.9
properties to reach their peak occupancy levels in 6-9 months, RoE (%) 6.7 6.9 5.6 10.6
as leasing activity improves. Management has indicated that RoCE (%) 6.5 6.7 6.0 12.2
its Kirti Nagar property (0.75mn sq. ft.) has been pre-leased to
EV/Sales (x) 12.4 11.1 6.8 3.9
the extent of 0.3mn sq. ft. at Rs100/sq. ft. and expects tenants
EV/EBITDA (x) 14.1 12.3 13.0 6.7
to move in by October 2010. Rentals at the Kirti Nagar Mall
Source: Company, Angel Research; Price as on August 5, 2010
have been renegotiated from Rs150/sq. ft., as indicated earlier
by the management. Research Analyst - Param Desai/Mihir Salot
For Private Circulation Only | Angel Broking Ltd: BSE Sebi Regn No : INB 010996539 / CDSL Regn No: IN - DP - CDSL - 234 - 2004 / PMS Regn Code: PM/INP00000154 6 Angel Securities Ltd:BSE: INB010994639/INF010994639 NSE: INB230994635/INF230994635 Membership numbers: BSE 028/NSE:09946 4
5. Fundamental Focus | August 7, 2010
Focus
Alembic - Buy Price - Rs57
Target Price - Rs74
1QFY2011 Result Update
Performance Highlights Rs35.0cr (Rs32.8cr).
Y/E March 1QFY11 4QFY10 % chg 1QFY10 % chg Net profit down 6%: Alembic reported net profit of Rs11.5cr
(Rs cr) (qoq) (yoy) (Rs 12.3cr), down 6.4% yoy on the back of lower sales during
Net Sales 279 267 4.6 291 (4.0)
the quarter. On the positive front, interest cost decreased by
Other Income 1 1 28.3 1 -
45.4% yoy to Rs4.4cr (Rs8.1cr) as debt levels have reduced to
Operating Profit 28 18 56.9 30 (8.2)
Interest 4 6 (28.8) 8 (45.4) Rs360cr from Rs408cr in FY2010 following improvement in
Profit
Net Profit 11 0 - 12 (6.4) working capital management.
Source: Company, Angel Research
Outlook and Valuation
Alembic reported below expectation numbers for 1QFY2011
We have valued Alembic on SOTP basis, with a Target Price of
impacted by de-growth on the export API front. The domestic
Rs74 valuing Alembic Pharma at Rs47 per share. Alembic's
formulation sales grew by 5.5% yoy on the back of the
30% stake in Alembic Pharma has been taken at Rs11 per share
restructuring exercise undertaken by the company over the last
and the loss-making API business at Rs5 per share. We have
one year, which improved working capital management
conservatively valued the land asset of 70 acre at Rs500/sq. ft
resulting in lower debt levels.
resulting in Rs11 per share. We maintain a Buy on the stock as
Revenues below estimates, impacted by export API segment: de-merger
de-merger of the company into - Alembic and Alembic Pharma
Alembic reported revenues of Rs279.1cr (Rs290.6cr), down long-term
- is a long-term positive as it will unlock value for both the
4.0% yoy on the back of subdued performance by the export businesses and pave the way to rope in future investors.
API segment. The domestic formulation sales grew by a mere
5.5% to Rs145.0cr (Rs137.4cr) on account of the restructuring
exercise undertaken by the company last year. As a result, debtor
days of the segment fell from 80 days last year to 40 days
currently. The company expects the domestic formulation sales
to grow in line with the industry average from next quarter
onwards. During the quarter, the domestic API sales grew by a Key Financials
strong 76.3% yoy to Rs37.2cr (Rs21.1cr). Y/E March (Rs cr) FY2009 FY2010 FY2011E FY2012E
Exports were subdued during the quarter with sales coming in Net Sales 1,116 1,138 1,266 1,393
at Rs98.5cr (Rs132.0cr), down 25.4% impacted by the API % chg 11.2 2.0 11.2 10.0
segment. The export API segment de-grew by 37.6% to Rs65.0cr
Profit
Net Profit 11 40 75 85
(Rs104.1cr) on the back of pricing pressure and slower volume
% chg (90.3) 265.1 89.2 13.3
off-take in the regulated markets. However, formulation sales
grew by a healthy 20.0% to Rs33.6cr (Rs28.0cr) driven by the EPS (Rs) 0.8 2.9 5.6 6.4
regulated markets. The company filed 3 ANDAs during the EBITDA Margin (%) 11.2 9.9 12.4 12.0
quarter taking its cumulative filings to 31 ANDAs with 9 P/E (x) 72.2 19.2 10.2 9.0
approvals in the US.
RoE (%) 16.0 11.3 18.9 18.5
OPM impacted by lower sales: Alembic reported OPM of 9.9% RoCE (%) 11.1 7.3 14.3 14.8
(10.3%), which was lower than estimated due to
P/BV (x) 2.4 2.1 1.8 1.6
lower-than-expected sales on the domestic formulation front.
EV/Sales (x) 1.1 1.0 0.9 0.8
The company clocked gross margins of 47.4% (46.5%) on the
back of lower raw material cost (including purchase of traded EV/EBITDA (x) 9.9 11.6 7.2 6.6
goods), while employee expenses increased by 6.7% yoy to Source: Company, Angel Research; Price as on August 2, 2010
Research Analyst - Sarabjit Kour Nangra/Sushant Dalmia
For Private Circulation Only | Angel Broking Ltd: BSE Sebi Regn No : INB 010996539 / CDSL Regn No: IN - DP - CDSL - 234 - 2004 / PMS Regn Code: PM/INP00000154 6 Angel Securities Ltd:BSE: INB010994639/INF010994639 NSE: INB230994635/INF230994635 Membership numbers: BSE 028/NSE:09946 5
6. Fundamental Focus | August 7, 2010
Focus
Bhushan Steel - Buy Price - Rs1,559
Target Price - Rs1,979
1QFY2011 Result Update
Performance Highlights Volume growth sweetened by increasing EBITDA/tonne: With
EBITDA/tonne:
the commissioning of BSL's Phase-III expansion plan, we expect
Y/E March 1QFY11 1QFY10 % chg 4QFY10 % chg
sales volume to grow at a 26.2% CAGR over FY2010-15E,
(Rs cr) (yoy) (qoq)
much higher than its peers. Despite BSL not being integrated,
Net sales 1,373 1,305 5.2 1,609 (14.7)
cost of production is expected to be low due to a) its unique
EBITDA 408 297 37.4 419 (2.7)
combination of BF-EAF technology to produce steel and b) lower
% margin 29.7 22.8 696bp 26.1 366bp
conversion costs. The usage of BF-EAF technology will result in
Net profit 206 172 19.7 241 (14.6)
lower coal costs. Hence, we expect EBITDA to register a 42.3%
Source: Company, Angel Research
CAGR over FY2010-12E through a combination of BF-EAF
Result highlights technology and low conversion cost. Thus, BSL is expected to
Muted top-line performance led by lower sales volume: BSL's
top-line earn EBITDA/tonne of US $331 in FY2011E and US $345 in
sales volume declined by 14.4% yoy and 21.2% qoq to 309,333 FY2012E.
tonnes, of which flat sales accounted for 215,808 tonnes and Outlook and valuation
long products sales stood at 93,525 tonnes. However, on the
positive side, average gross realisation increased by 23.9% yoy At Rs1,559, the stock is trading at 7.3x FY2011E and 6.0x
and 9.3% qoq to Rs47,879/tonne. Consequently, net revenue FY2012E EV/EBITDA. We expect BSL to post a 26.2% CAGR in
grew by 5.2% yoy but fell by 14.7% qoq to Rs1,373cr. The volumes over FY2010-15E on completion of its Phase-III
1.9mn tonne hot strip mill is under trial runs and BSL produced expansion plan by October 2012E along with EBITDA/tonne
62,789 tonnes of hot rolled steel during the quarter. The mill is increasing to US $331 in FY2011E. Moreover, with debt/equity
expected to be commissioned in 2QFY2011. expected to decline from 3.3x in FY2009 to 2.0x in FY2012E,
Target Price
we maintain our Buy rating on the stock with a Target Price of
EBITDA margin expands by 696bp yoy: Despite muted
EBITDA EV/EBITDA
Rs1,979, valuing the stock at 6.5x FY2012E EV/EBITDA .
top-line performance, EBITDA margin expanded by 696bp yoy
and 366bp qoq to 29.7% mainly on account of lower
raw-material cost. Raw-material cost as a percentage of revenue
fell to 54.6% in 1QFY2011 as compared to 66.1% in 1QFY2010 Key Financials
and 60.8% in 4QFY2010. Consequently, EBITDA grew by 37.4% Y/E March (Rs cr) FY2009 FY2010E FY2011E FY2012E
yoy to Rs408cr. EBITDA/tonne increased to US $289 from US Net sales 4,943 5,641 6,290 7,131
$232 in 4QFY2010 and US $169 in 1QFY2010. % chg 18.3 14.1 11.5 13.4
Net profit came in at Rs206cr: While interest expense increased Net profit 421 829 968 1,259
by 60.4% yoy and 43.0% qoq to Rs79cr, interest income fell by % chg (0.6) 96.9 16.7 30.0
82.8% yoy and 88.9% qoq to Rs6cr. Consequently, net profit
EPS (Rs) 99.2 195.3 228.0 296.4
increased by 19.7% yoy to Rs206cr but declined 14.6% qoq.
EBITDA margin (%) 20.8 25.7 37.5 41.1
Investment rationale
P/E (x) 15.7 8.0 6.8 5.3
Entering a new orbit: BSL has undertaken an expansion plan
P/BV (x) 2.7 2.0 1.6 1.2
in Orissa to increase its foothold in the industry. With the
RoE (%) 20.8 29.2 26.0 26.1
commissioning of its new HR plant in 2QFY2011E, BSL is moving
from being a steel converter to a leading primary producer of RoCE (%) 8.7 10.0 12.6 14.0
steel, extending its presence in the steel value chain. Phase-III EV/Sales (x) 2.9 3.0 2.7 2.5
is currently under execution and is expected to come on stream EV/EBITDA (x) 14.2 11.5 7.3 6.0
by 3QFY2013E. Source: Company, Angel Research; Price as on August 2, 2010
Research Analyst - Paresh Jain/Pooja Jain
For Private Circulation Only | Angel Broking Ltd: BSE Sebi Regn No : INB 010996539 / CDSL Regn No: IN - DP - CDSL - 234 - 2004 / PMS Regn Code: PM/INP00000154 6 Angel Securities Ltd:BSE: INB010994639/INF010994639 NSE: INB230994635/INF230994635 Membership numbers: BSE 028/NSE:09946 6
7. Fundamental Focus | August 7, 2010
Focus
Godawari Power & Ispat - Buy Price - Rs236
Target Price - Rs313
1QFY2011 Result Update
Performance Highlights In the current quarter (2QFY2011), the company has
restarted the billet and ferro alloy plant. Consequently, power
Particulars 1QFY11 1QFY10 % chg 4QFY10 % chg
(Rs cr) yoy qoq sales volumes are expected to dip in 2QFY2011.
Net Sales 196 217 (9.6) 238 (17.8) The sponge iron prices have increased by ~Rs1,000 and
EBITDA 36 32 14.1 47 (22.8)
are currently at Rs16,000/tonne.
% margin 18.4 14.6 383bp 19.6 (119bp)
Profit
Net Profit 13 14 (12.8) 23 (46.0) The 0.6mn tonne pellet plant at Ardent Steel started
Source: Company, Angel Research commercial production from August 01, 2010.
Mediocre 1QFY2011: GPIL's net revenue fell by 9.6% yoy to Outlook and Valuation
Rs196cr on account of: a) reduced production of sponge iron
due to technical issues (61,535 tonnes v/s 69,808 tonnes in At Rs236, the stock is trading at 3.9x FY2011E and 2.2x
1QFY2010 and 80,359 tonnes in 4QFY2010), and b) lower FY2012E EV/EBITDA. On a P/BV basis, it is trading at 1.0x
sales of billets and ferro alloys as GPIL had temporarily shut FY2011E and 0.8x FY2012E estimates. We expect GPIL's
down the steel plant and sold power at attractive realisations of earnings to log in 93.6% CAGR over FY2010-12E, given ramp
Rs 5.12/unit. Sponge iron realisation increased by 22.5% yoy up in iron ore mining capacity and the starting up of commercial
(flat sequentially) to Rs15,365/tonne. Pellet production moved production of pellets at Ardent Steel. We maintain a Buy on the
up to 55,396 tonnes from 48,305 tonnes in 4QFY2010. Target Price
stock, with a revised Target Price of Rs313 (Rs322), valuing the
Average pellet realisation stood at Rs7,252/tonne. EV/EBITDA
stock at 3.5x FY2012E EV/EBITDA .
EBITDA margins disappoint Although EBITDA margins grew
EBITDA disappoint:
by 383bp to 18.4% yoy, sequentially margins dipped by 119bp.
This was mainly on account of: a) increase in coal cost to
Rs3,000/tonne from Rs2,800/tonne in 4QFY2010, and
b) usage of high-priced iron ore from NMDC (32,000 tonnes),
which resulted in incremental costs of ~Rs10cr. Consequently,
EBITDA increased 14.1% yoy to Rs36cr, but fell by 22.8% qoq. Key Financials (Consolidated)
Net income came in lower by 12.8% yoy to Rs13cr. Y/E March (Rs cr) FY2009 FY2010 FY2011E FY2012E
Key result Highlights Net Sales 1,092 822 1,039 1,265
% chg 34.8 (24.7) 26.3 21.8
Production of sponge iron was low during the quarter due
to technical problems. Management is trying to resolve the issue Profit
Net Profit 62 53 124 197
and production is expected to be on similar lines in 2QFY2011. % chg (37.4) (15.7) 136.8 58.3
Pellet production in 2QFY2011 is expected to be at same FDEPS (Rs) 22.3 18.8 44.5 70.5
levels as in 1QFY2011. EBITDA margin (%) 11.3 15.9 23.7 26.1
During the quarter the company sold ~10,000 tonnes of P/E (x) 10.6 12.6 5.3 3.4
iron ore purchased from NMDC to third parties, which is P/BV (x) 1.4 1.3 1.0 0.8
expected to have contributed ~Rs1.0cr to the operating profit.
RoE (%) 14.7 11.0 22.2 27.5
The sponge iron plant is expected to use high-priced iron RoCE (%) 12.6 10.5 18.4 24.0
ore (~10,000 tonnes) in 2QFY2011 also. This is mainly on
EV/Sales (x) 0.9 1.4 0.9 0.6
account of high magnetic content in the iron ore from its Ari
EV/EBITDA (x) 7.7 8.6 3.9 2.2
Dongri mines. We expect the usage to decrease as pellet
Source: Company, Angel Research, Price as on August 4, 2010
production stabilises.
Research Analyst - Paresh Jain/Pooja Jain
For Private Circulation Only | Angel Broking Ltd: BSE Sebi Regn No : INB 010996539 / CDSL Regn No: IN - DP - CDSL - 234 - 2004 / PMS Regn Code: PM/INP00000154 6 Angel Securities Ltd:BSE: INB010994639/INF010994639 NSE: INB230994635/INF230994635 Membership numbers: BSE 028/NSE:09946 7
8. Fundamental Focus | August 7, 2010
Focus
GIPCL - Buy Price - Rs113
Target Price - Rs135
1QFY2011 Result Update
Performance Highlights to GEB, - it is GIPCL's single largest customer. The company's
expansion plans are also on track, which we believe will help it
Particulars 1QFY11 4QFY10 % chg 1QFY10 % chg
(Rs cr) yoy yoy continue on growth path.
Net Revenue 253 254 (0.6) 253 (0.1)
We expect the company's to register CAGR of 32.5% and 28.3%
Operating Profit 64 62 3.3 62 3.2
in top-line and bottom-line respectively, over FY2010E-12E.
OPM (%) 25.4 24.4 96bp 24.5 82bp
Profit
Net Profit 42 36 15.9 29 42.3 We expect RoE to improve from 8.8% in FY2010 to 12.4% in
Source: Company, Angel Research FY2012E following commissioning of new plants. At the CMP
of Rs113, the stock is trading at 1.2x P/BV and EV/MW of Rs3.5cr
GIPCL posted 42.3% yoy improvement in net profit to Rs42cr
on its FY2012E estimates, which we believe is attractive
for 1QFY2011, despite a flat performance on the top-line front.
compared to its peers. We maintain a Buy on the stock, with a
Bottom-line grew on the back of lower tax expense resulting
Price
Target Price of Rs135.
from the tax refunds received for the earlier years and booked
during the quarter. The company had a net tax credit of Rs2.5cr
during 1QFY2011 as against Rs6.3cr of tax expenses recorded
in 1QFY2010. The recently set up 250MW Surat lignite power
plant (SLPP) expansion is currently at the trial phase and did
not contribute to top-line during 1QFY2011.
Bottom-line up 42.3% aided by lower tax expenses: GIPCL's
1QFY2011 top-line remained flat at Rs253cr despite the 5%
reduction in sales volume to 786MU. De-growth in sales volume
was off-set by the 5% improvement in realisations. Operating
profit grew 3.2% yoy to Rs64cr on better realisations. OPM for
the quarter stood at 25.4%, up 82bp yoy. Net profit increased
42.3% yoy to Rs42cr.
Key financials (Standalone)
Operational Highlights: In 1QFY2011, GIPCL's total power
Y/E March (Rs cr) FY2009 FY2010 FY2011E FY2012E
generation stood at 786MU. Power generation at the Vadodara
stations I and II stood at 303MU and 277MU, respectively. The Net Sales 1,155 939 1,265 1,648
company's 250MW Surat lignite power plant-I (SLPP-I) generated % chg 23.5 (18.7) 34.7 30.3
509MU during the quarter. PLF of the 145MW Vadodara-I facility Profit
Net Profit 85.8 106.8 149.4 175.8
remained flat at 95.5% (95.0%), while PLF of the 165MW
% chg (16.1) 24.4 39.9 17.7
Vadodara-II declined by 349bp to 76.8% (80.3%). PLF of the
OPM (%) 18.2 23.3 25.4 24.5
250MW SLPP-I fell by 578bp to 93.2% (99.0%) during the
quarter. EPS (Rs) 5.7 7.1 9.9 11.6
Outlook and Valuation P/E (x) 19.9 16.0 11.4 9.7
P/BV (x) 1.4 1.4 1.3 1.2
We remain positive on the domestic power industry, as we expect
it to grow in line with the country's GDP growth. India's peak RoE (%) 7.4 8.8 11.5 12.4
power demand (in excess of 11%) gives substantial opportunity RoCE (%) 6.1 5.8 8.2 8.4
to players like GIPCL. Moreover, in the last few years, there has EV/Sales (x) 2.2 2.9 2.4 2.1
been significant improvement in GEB's financial position, which
EV/EBITDA (x) 12.1 12.7 9.6 8.7
will indirectly benefit GIPCL, as it sells around 80% of its power
Source: Company, Angel Research, Price as on August 6, 2010
Research Analyst - Rupesh Sankhe/V Srinivasan
For Private Circulation Only | Angel Broking Ltd: BSE Sebi Regn No : INB 010996539 / CDSL Regn No: IN - DP - CDSL - 234 - 2004 / PMS Regn Code: PM/INP00000154 6 Angel Securities Ltd:BSE: INB010994639/INF010994639 NSE: INB230994635/INF230994635 Membership numbers: BSE 028/NSE:09946 8
9. Fundamental Focus | August 7, 2010
Focus
ICICI Bank - Buy Price - Rs940
Target Price - Rs1,163
1QFY2011 Result Update
Performance Highlights of 70% from September 30, 2010 to March 31, 2011. The
bank's restructured loans stood at Rs3,737cr, down 29.6%
Particulars 1QFY11 4QFY10 % chg 1QFY10 % chg
(Rs cr) yoy yoy sequentially. It may be noted here that cummulative restructuring
Net interest income 1,991 2,035 (2.2) 1,985 0.3 of the bank is one of the lowest in the sector at 2.0% of total
Pre-prov. profit 2,188 2,399 (8.8) 2,529 (13.5) loans and 7.1% of net worth, indicating relatively comfortable
PAT 1,026 1,006 2.0 878 16.8 asset quality, going forward. As a result, we have factored in
Source: Company, Angel Research NPA provisions to decline by 37.7% in FY2011E and 16.3% in
ICICI Bank's net profit increased 16.8% yoy, which was in line FY2012E.
with our estimates. The key positive of the results was a sharp Strong capital adequacy: Driven by its large net worth, capital
declining trend in slippages from retail loans for the fifth adequacy continued to be strong at 20.2%, comprising
consecutive quarter and a huge reduction in NPA provisioning substantial Tier-1 component of 14.0%.
burden. We maintain a Buy on the stock. Outlook and Valuation
Advances de-grow yoy: The advances increased by 1.8% qoq
de-grow The result of the bank's strategies over the last eighteen months
(however, declined by 6.9% yoy) to Rs1,84,378cr, while the has been a substantially improved ratio of branches to networth
deposits declined marginally by 0.5% qoq (fell by 4.4% yoy) to that will ensure a far more favourable cost of funds. Moreover,
Rs2,00,913cr during 1QFY2011. The drop in the advances a lower risk balance sheet is expected to drive down NPA
book was attributed to the repayments from retail, and provisioning costs that will enable RoE of 15.5% by FY2012E
short-term corporate loans. Partly due to this, NII growth (with further upside from financial leverage). At the CMP the ,
remained muted at 0.3% yoy. bank's core banking business (after adjusting Rs307 per share
However, an important reason for the bank's lack of NIM towards value of the subsidiaries) is trading at 1.7x FY2012E
improvement on a yoy basis in spite of substantially improved ABV of Rs381 (including subsidiaries, the stock is trading at
CASA ratio is the lower risk profile of the bank's loan book. We 1.8x FY2012E ABV of Rs520). We value the bank's subsidiaries
expect this reduction in risk (and consequent lower yield on at Rs307 per share and the core Bank at Rs856 (2.25x FY2012E
advances), to result in a 72bp decline in NPA provisioning costs ABV). We maintain a Buy on the stock, with a Target Price of
Target Price
by 2012E eventually reflecting in an improvement in RoA from Rs1,163, implying an upside of 23.8% from current levels.
1.0% to 1.4% over FY10-12E, commensurate with the
improvement in CASA ratio.
Key Financials
de-growth:
Non-interest income growth low due to loan book de-growth:
Y/E March (Rs cr) FY2009 FY2010 FY2011E FY2012E
Non-interest income was down 11.1% qoq and 19.6% yoy to
NII 9,092 8,114 8,659 10,835
Rs1,681cr on account of 77.2% yoy decline in treasury gains at
Rs163cr (from Rs714cr in 1QFY2010 and Rs196cr in % chg 10.9 (10.8) 6.7 25.1
4QFY2010). Core fee income grew by 7.1% yoy to Rs1,413cr. Profit
Net Profit 3,423 4,024 5,028 6,906
We expect non-interest income, excluding treasury, to grow in % chg (17.7) 17.5 24.9 37.4
line with loan growth during FY2011E.
NIM (%) 2.6 2.4 2.4 2.5
Asset quality stabilising; lower provisioning cost, going forward:
EPS (Rs) 30.7 36.1 45.1 61.9
The bank's asset quality showed signs of stabilising, with a sharp
declining trend in slippages in retail loans, which fell from P/E (x) 30.6 26.0 20.8 15.2
Rs1,300cr in 1QFY2010 to Rs500cr in 4QFY2010 and Rs200cr P/ABV (x) 2.2 2.1 1.9 1.8
in 1QFY2011. The bank's gross NPA ratio was stable RoA (%) 0.9 1.0 1.2 1.4
sequentially at 5.1%. The provision coverage ratio improved to
RoE (%) 9.2 9.7 11.7 15.5
64.8% in 1QFY2011 (59.5% in 4QFY2010). The RBI has
Source: Company, Angel Research, Price as on August 2, 2010
extended the deadline to meet the coverage ratio requirement
Research Analyst - Vaibhav Agrawal/Amit Rane/Shrinivas Bhutda
For Private Circulation Only | Angel Broking Ltd: BSE Sebi Regn No : INB 010996539 / CDSL Regn No: IN - DP - CDSL - 234 - 2004 / PMS Regn Code: PM/INP00000154 6 Angel Securities Ltd:BSE: INB010994639/INF010994639 NSE: INB230994635/INF230994635 Membership numbers: BSE 028/NSE:09946 9
10. Fundamental Focus | August 7, 2010
Focus
India Cements - Buy Price - Rs105
Target Price - Rs139
1QFY2011 Result Update
Performance Highlights completion and is expected to be commissioned in 2QFY2011.
The company is also in the process of setting up two captive
Y/E March 1QFY11 4QFY10 % chg 1QFY10 % chg
(Rs cr) (qoq) (yoy) power plants (CPPs) of 50MW each in Tamil Nadu and Andhra
Net Revenue 883 974 (9.4) 960 (8.1) Pradesh. While the Tamil Nadu plant is expected to be
Operating Profit 91 160 (43.5) 314 (71.2) operational in 1QFY2012, the Andhra Pradesh plant is expected
OPM (%) 10.3 15.2 (495)bp 32.7 (2,244)bp to be operational in 4QFY2012. The company has also
Profit
Net Profit 25 38 (34.8) 144 (82.7)
completed the formalities for obtaining the coal mining rights
Source: Company, Angel Research
in Indonesia to meet its coal requirements for power generation
India Cements' net sales de-grew by 8.1% yoy during 1QFY2011 and cement manufacturing. India Cements plans to incur total
on account of the substantial decline in prices in Andhra Pradesh, capex of Rs1,100cr over the next three years towards capacity
which contributes around 45% of the company's overall expansion.
revenues. The net plant realisation (NPR) for the quarter stood
Outlook and Valuation
at Rs2,501/tonne, down 21% yoy. The management indicated
that it is looking at increasing the proportion of its sales volume We expect the pricing pressure in the southern region to continue
from Tamil Nadu and Kerala to 60% (from the current 50%) to over the next few quarters on the back of excess capacity and
achieve better realisation. lack of demand particularly in Andhra Pradesh due to reduced
government spending on infrastructure and housing projects.
Operating profit down 71.2%: On the operating front, the
SOTP
TP-based Target
We maintain a Buy on the stock with the SOTP-based Target
company's margins fell by 2,244bp yoy to 10.3% (32.7%) on
Price of Rs139.
account of the fall in realisations and increase in raw material
and freight costs. The company's operating profit stood at
Rs91cr, down 71.2% yoy. Net profit dropped 82.7% yoy to
Rs25cr primarily due to the poor operating performance.
Bottom-line was however, bolstered by the Rs26.4cr of profit
Key Financials (Standalone)
booked from the stake sale in Bharati Cement. Adjusting the
Y/E March (Rs cr) FY2009 FY2010 FY2011E FY2012E
foreign exchange translation loss of Rs11.6cr (Rs21cr gain in
1QFY2010) and exceptional income from stake sale, net profit Net Sales 3,427 3,771 3,680 4,167
stood at Rs Rs10.2cr. % chg 12.1 10.1 (2.4) 13.2
Operating performance: During the quarter, India Cements Profit
Net Profit 432 354 87 130
dispatched 2.65mt of cement, up 11% yoy. While the company's % chg (32.2) (18.0) (75.5) 49.9
net plant realisation declined by 21.2% yoy to Rs2,501/tonne, OPM (%) 29.1 21.9 12.4 15.0
raw material and freight costs per tonne also increased by 27.8%
FDEPS (Rs) 15.3 11.5 2.8 4.2
and 30.3% yoy to Rs439 and Rs693 respectively, during the
P/E(x) 6.8 9.1 37.0 24.7
quarter. Freight costs rose due to the increased lead distance
as the company recorded higher dispatches to the Tamil Nadu P/BV(x) 1.0 0.9 0.9 0.9
market. Power costs also increased due to higher use of RoE(%) 14.7 9.1 2.1 3.0
generators on account of the power shortage in Andhra Pradesh. RoCE(%) 14.1 9.6 2.7 4.5
Operating profit per tonne of cement stood at Rs393, down by
EV/Sales (x) 1.4 1.4 1.5 1.2
a whopping 68.1% yoy.
EV/tonne 59 69 74 68
Capacity expansions well on track: The company is currently
EV/EBITDA 4.9 6.4 11.9 8.0
setting up a 1.5mtpa green-field plant at Rajasthan, through
Source: Company, Angel Research; Price as on August 4, 2010
its subsidiary, Indo Zinc. The plant is at an advanced stage of
Research Analyst - Rupesh Sankhe/V Srinivasan
For Private Circulation Only | Angel Broking Ltd: BSE Sebi Regn No : INB 010996539 / CDSL Regn No: IN - DP - CDSL - 234 - 2004 / PMS Regn Code: PM/INP00000154 6 Angel Securities Ltd:BSE: INB010994639/INF010994639 NSE: INB230994635/INF230994635 Membership numbers: BSE 028/NSE:09946 10