Market outlook 22.10.10
•
0 likes•80 views

The document provides an analysis and outlook of the Indian stock market and various companies. It includes the following key points: 1) The Indian stock market indices ended the day with gains of 2% as foreign funds invested in the IPO of Coal India, boosting sentiments. 2) In the coming session, the market may see further gains if indices trade above certain threshold levels in the first half hour, or declines if below those levels. 3) Summaries of quarterly results from companies like TCS, Ambuja Cement, and ACC are provided, along with previews of upcoming results from Wipro and Bank of India.

Recommended
More Related Content
What's hot
What's hot (20)
Viewers also liked
Viewers also liked (19)
Similar to Market outlook 22.10.10
Similar to Market outlook 22.10.10 (18)
More from Angel Broking
More from Angel Broking (20)
Recently uploaded
Recently uploaded (20)
Market outlook 22.10.10
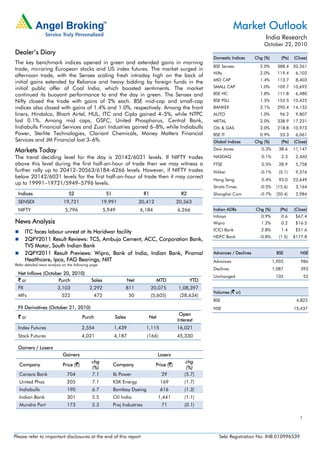
- 1. Market Outlook India Research October 22, 2010 Dealer’s Diary Domestic Indices Chg (%) (Pts) (Close) The key benchmark indices opened in green and extended gains in morning BSE Sensex 2.0% 388.4 20,261 trade, mirroring European stocks and US index futures. The market surged in Nifty 2.0% 119.4 6,102 afternoon trade, with the Sensex scaling fresh intraday high on the back of MID CAP 1.4% 113.7 8,403 initial gains extended by Reliance and heavy bidding by foreign funds in the initial public offer of Coal India, which boosted sentiments. The market SMALL CAP 1.0% 109.7 10,692 continued its buoyant performance to end the day in green. The Sensex and BSE HC 1.8% 111.8 6,480 Nifty closed the trade with gains of 2% each. BSE mid-cap and small-cap BSE PSU 1.5% 155.5 10,422 indices also closed with gains of 1.4% and 1.0%, respectively. Among the front BANKEX 2.1% 290.4 14,152 liners, Hindalco, Bharti Airtel, HUL, ITC and Cipla gained 4–5%, while NTPC AUTO 1.0% 96.2 9,807 lost 0.1%. Among mid caps, GSFC, United Phosphorus, Central Bank, METAL 2.0% 338.9 17,231 Indiabulls Financial Services and Zuari Industries gained 6–8%, while Indiabulls OIL & GAS 2.0% 218.8 10,973 Power, Sterlite Technologies, Clariant Chemicals, Money Matters Financial BSE IT 0.9% 53.3 6,061 Services and JM Financial lost 3–6%. Global Indices Chg (%) (Pts) (Close) Markets Today Dow Jones 0.3% 38.6 11,147 The trend deciding level for the day is 20142/6031 levels. If NIFTY trades NASDAQ 0.1% 2.3 2,460 above this level during the first half-an-hour of trade then we may witness a FTSE 0.5% 28.9 5,758 further rally up to 20412–20563/6184–6266 levels. However, if NIFTY trades Nikkei -0.1% (5.1) 9,376 below 20142/6031 levels for the first half-an-hour of trade then it may correct Hang Seng 0.4% 93.0 23,649 up to 19991–19721/5949–5796 levels. Straits Times -0.5% (15.6) 3,164 Indices S2 S1 R1 R2 Shanghai Com -0.7% (20.4) 2,984 SENSEX 19,721 19,991 20,412 20,563 NIFTY 5,796 5,949 6,184 6,266 Indian ADRs Chg (%) (Pts) (Close) Infosys 0.9% 0.6 $67.4 News Analysis Wipro 1.2% 0.2 $16.5 ITC faces labour unrest at its Haridwar facility ICICI Bank 2.8% 1.4 $51.6 HDFC Bank -0.8% (1.5) $177.8 2QFY2011 Result Reviews: TCS, Ambuja Cement, ACC, Corporation Bank, TVS Motor, South Indian Bank 2QFY2011 Result Previews: Wipro, Bank of India, Indian Bank, Piramal Advances / Declines BSE NSE Healthcare, Ipca, FAG Bearings, NIIT Advances 1,905 986 Refer detailed news analysis on the following page Declines 1,087 392 Net Inflows (October 20, 2010) Unchanged 105 52 ` cr Purch Sales Net MTD YTD FII 3,103 2,292 811 20,075 1,08,397 Volumes (` cr) MFs 522 472 50 (5,605) (28,634) BSE 4,822 FII Derivatives (October 21, 2010) NSE 15,437 Open ` cr Purch Sales Net Interest Index Futures 2,554 1,439 1,115 16,021 Stock Futures 4,021 4,187 (166) 45,330 Gainers / Losers Gainers Losers chg chg Company Price (`) Company Price (`) (%) (%) Canara Bank 704 7.1 Ib Power 29 (5.7) United Phos 205 7.1 KSK Energy 169 (1.7) Indiabulls 190 6.7 Bombay Dyeing 616 (1.3) Indian Bank 301 5.5 Oil India 1,441 (1.1) Mundra Port 173 5.3 Praj Industries 71 (0.1) 1 Please refer to important disclosures at the end of this report Sebi Registration No: INB 010996539
- 2. Market Outlook | India Research ITC faces labour unrest at its Haridwar facility ITC, which is expanding its manufacturing facility at Haridwar, is facing labour unrest. The strike is against a decision of suspension of an employee on disciplinary grounds. The strike, which started on Monday, has hampered production. However, we are not aware of the complete details. Management and the workers on strike are set to meet on Saturday to resolve the issue. Investment in the factory is worth `300cr–`400cr, for the expansion of business in consumer care and food items. The Uttarakhand government has allotted eight-nine acres to ITC to expand the facility. We maintain our Neutral view on the stock. Result Reviews – 2QFY2011 TCS TCS reported its 2QFY2011 numbers, which were way ahead of street as well as our expectations on the revenue as well as profitability fronts. The company’s revenue stood at US $2,004mn (v/s our expectation of US $1,927mn), reporting 11.7% qoq growth. This is the first quarter ever when the company registered an incremental revenue of US $210mn qoq (against Infosys at US $111mn). Strong growth was possible on the back of volume growth of 11.2% (v/s our expectation of 8.1%). EBIT margins expanded by 86bp qoq (v/s our expectation of flat growth) to historic high of 28%. The company managed to counter the 166bp negative impact of promotion and variable allowances by productivity gains of 95bp, SG&A efficiency gains of 54bp and favourable exchange impact of 103bp. PAT stood at `2,106cr (v/s our estimate of `1,990cr), posting 14% qoq growth. The company remains our top pick amongst Tier-I IT companies because of its diversified portfolio on all fronts service wise, industry exposure wise as well as geography wise. At the CMP of `986, the stock is trading at 21x FY12E EPS of `47, with 5% upside to our target of `1,032. We remain positive on the stock and will be revising our estimates upwards post the conference call. Ambuja – 3QCY2010 Ambuja’s standalone top line declined by 2.9% yoy, which was in line with our estimates. The decline was despite a 6.1% yoy increase in despatches to 4.4mn tonnes, aided by capacity additions. Thus, the top-line decline was on account of an 8.5% yoy decline in realisations to `3,595/tonne. On the operating front, the company’s OPM declined by 1,174bp yoy to 19.1% on account of lower realisation and higher import of high-cost imported coal and pet coke. Coal imports increased due to lower availability of domestic linkage coal. Further, increased production of clinker during the quarter resulted in a 38% increase in power costs, thereby lowering the operating margin. The bottom line declined by 52.2% yoy to `152cr, well below our estimates. At the current levels, the stock is trading at an EV/EBITDA of 9x and EV/tonne of US $160 based on CY2011E estimates. We remain Neutral on the stock. October 22, 2010 2
- 3. Market Outlook | India Research ACC – 3QCY2010 ACC’s 3QCY2010 standalone net sales declined by 16.9% yoy and were in line with our estimates. The decline was on the back of the 3.7% fall in despatches to 4.83mn tonnes coupled with a 13.8% yoy fall in realisations to `3,390/tonne. Despatches declined due to severe monsoons and floods in various parts of the country. The volume of cement despatches was also partially affected due to the shutdown in Wadi-II for Kiln expansion, which lasted for most of the quarter. On the operating front, the company’s margins fell by a huge 2,223bp yoy to 13.5% (35.7%) on account of the fall in realisation and increased slag, fly ash and power costs. The company’s substantial presence in the southern region dented its realisations, as price hikes carried out in September did not have much impact on overall quarterly realisations. Net profit declined by 77.0% yoy to `100cr, primarily on account of the 62.8% drop in operating profits and higher depreciation and interest costs. We remain Neutral on the stock. Corporation Bank Corporation Bank announced its 2QFY2011 results. The bank registered moderate net profit growth of 20.6% yoy to `352cr, above our estimates of `303cr, mainly on account of lower provisioning expenses and lower tax rate than built in by us. Advances grew strongly by 7.7% qoq and 32.7% yoy compared to marginal industry qoq growth of ~0.6%, while deposits increased by 6.5% qoq and 19.8% yoy compared to ~1.6% sequential industry growth. This led to a 42.0% yoy increase in NII, in line with our estimates. Calculated NIM declined marginally by 3bp sequentially to 2.58%. Operating costs increased by 35.9% yoy and 7.2% qoq to `368cr. The cost-to-income ratio stood at 39.1%, substantially higher than its eight-quarter average of 35.3%. Gross and net NPA ratios stood at 1.05% (1.11% in 1QFY2011) and 0.39% (0.43% in 1QFY2011), respectively, implying a provision coverage ratio of 78.5%, including write-offs (76.7% in 1QFY2011). The bank’s CAR continued to be healthy at 14.5% with Tier-I at 8.3%. At the CMP, the stock is trading at 1.33x FY2012E ABV, which is close to our target multiple 1.30x FY2012E ABV for the bank. Hence, we maintain a Neutral recommendation on the stock. TVS Motor For 2QFY2011, TVS Motor (TVSM) reported 43% yoy top-line growth to `1,616cr, which was marginally above our expectation of `1,587cr and largely aided by ~33.4% yoy jump in volumes. Net average realisation for the quarter was up 6.8% yoy at `30,285 (`28,349 in 2QFY2010), largely due to richer product mix and higher motorcycle and three-wheeler volumes during the quarter. On the operating front, EBITDA margin came in 15bp below our estimate at 6.7%, a jump of 20bp qoq and 117bp yoy. Raw-material cost for the quarter increased by almost 200bp yoy. However, about 285bp yoy saving of other expenditure helped the company to perform better at the EBITDA level. Net profit grew 123.1% yoy to `54.8cr (`24.6cr in 2QFY2010), as against our estimate of `52.1cr, largely aided by improved operating performance and lower interest cost for 2QFY2011. At current levels, the stock is trading at 17x FY2011E and 13x FY2012E earnings. We maintain our Neutral view on the stock. At present, our fair value for the stock works out to be `76. October 22, 2010 3
- 4. Market Outlook | India Research South Indian Bank South Indian Bank announced its 2QFY2011 results. The bank registered moderate net profit growth of 6.1% yoy to `77cr, above our estimates of `63cr, mainly on account of better-than-estimated operating performance both on the NII and non-interest income fronts. Advances grew by healthy 4.9% qoq and 35.7% yoy, while deposits increased by 7.4% qoq and by 27.3% yoy. This resulted in 19.4% yoy growth in NII. On a sequential basis, calculated NIMs suggest a ~35bp improvement. Gross and net NPA ratios stood at 1.27% (1.33% in 1QFY2011) and 0.38% (0.39% in 1QFY2011), respectively, implying a provision coverage ratio of 70.5%, excluding write-offs (71.0% in 1QFY2011). The bank’s CAR continued to be healthy at 15.9%. We would be revising our estimates post interaction with the management. At the CMP, the stock is trading at 1.6x FY2012E ABV, which we believe is expensive relative to peers and its own historical range. Hence, we maintain a Neutral recommendation on the stock. Result Previews – 2QFY2011 Wipro Wipro is set to announce its 2QFY2011 results. We expect the company to post IT services revenue of US $1,286mn with 6.8% qoq growth. Growth is expected on the back of volume growth of 6.1% and cross-currency benefit of 0.7%. Overall, at the consolidated level, we expect the company to record strong revenue growth of 13% qoq at `8,177cr on the back of strong growth in its IT products segment. EBIT margins are expected to dip by 34bp to 19.7% because of the ramp-up in the thin-margin IT products business. PAT is expected to come in at `1,352cr, reporting 2.5% qoq growth. At the CMP, the stock is trading at 18.3x FY2012 EPS of `25.7. The stock is currently under review. Bank of India Bank of India is scheduled to announce its 2QFY2011 results. We expect the bank to report strong net interest income growth of 29.1% on a yoy basis to `1,820cr. Non-interest income is expected to decline by 25.8% yoy. The cost-to-income ratio is expected to go up sequentially by ~150bp to 40.9% from 39.4%. Growth in pre-provision profit is expected to be a moderate 13.8% yoy. Net profit is expected to go up by a robust 96.4% on a yoy basis to `635cr, primarily on account of lower provisioning expenses. Net profit is expected to increase by a robust 96.4% yoy, but it is expected to decline by 12.4% qoq to `635cr. At the CMP, the stock is trading at valuations of 1.7x FY2012E ABV. We have a Neutral rating on the stock. Indian Bank Indian Bank is scheduled to announce its 2QFY2011 results. The bank is expected to post healthy growth of 26.2% yoy in net interest income to `958cr. Non-interest income is expected to increase by 22.1% yoy, but it is expected to come down by 18.5% sequentially. Net profit growth is expected to be muted at 1.3% on a yoy basis and 2.3% on a qoq basis to `377cr on account of higher provisioning expenses due to lower base. At the CMP, the stock is trading at valuations of 1.4x FY2012E ABV. We have a Neutral rating on the stock. October 22, 2010 4
- 5. Market Outlook | India Research Piramal Healthcare Piramal Healthcare (Piramal) is expected to post a 15.1% decline in its top line to `849cr, as domestic business was transferred to Abbott Labs during the quarter. As a result, the company is expected to report a 349bp contraction in OPM to 14.2%. However, on the back of strong other income, the company is expected to report net profit of `101cr, down mere 5.3% during the quarter. We maintain Neutral on the stock at these levels. Ipca Laboratories For 2QFY2011, Ipca Laboratories (Ipca) is expected to post top-line growth of 13.6% to `487cr. The company is expected to post strong growth on the export as well as the domestic fronts. The company is witnessing strong traction in the anti-malarial segment, both in the domestic and export fronts. OPMs are expected to compress by 88bp to 22.6% on the back of an increase in employee expenses. However, net profit is expected to rise by 13.5% to `73cr, driven by top-line growth and lower interest cost. We maintain our Neutral rating on the stock at these levels. FAG Bearings FAG Bearings is set to announce its 3QCY2010 results. The company is expected to report 34.3% yoy growth in revenue to `274cr for the quarter. On the operating front, the company is expected to post a 643bp yoy improvement in operating profit margin to 18.9%. Net profit is expected to increase by a substantial 95.6% yoy to `32.4cr. The stock rating is under review. NIIT NIIT is set to announce its 2QFY11 results. We expect the company to post a 6% yoy decline in revenue to `337.9cr. The decline is on the back of the high base effect of last year, whereby the school learning solution (SLS) segment reported strong performance on the back of execution of Gujarat government’s order. We expect 12% yoy growth in the individual learning solution (ILS) segment and 2% yoy growth in the corporate learning solutions (CLS) segment. EBITDA margins are expected to expand by 180bp yoy due to better product mix in CLS and higher growth in more profitable segments like ILS. PAT is expected to grow by 13% qoq to `295cr on the back of strong profitability. We remain positive on the education sector and prefer this stock. At the CMP of `67.6, the stock is trading at attractive valuation of 10.2x FY2012 EPS. The stock is currently under review. October 22, 2010 5
- 6. Market Outlook | India Research Economic and Political News Bombay HC says 'No' to lift stay on sand mining across state Food inflation falls to 15.53% Gujarat to set up 12 new industrial hubs Corporate News Ambience plans IPO by February 2011 to raise up to `1,293 cr Govt. scraps Vedanta's alumina refinery expansion plan Hindustan Motors to spend `160cr to increase stake in unit Source: Economic Times, Business Standard, Business Line, Financial Express, Mint Events for the day Aptech Results Bank of India Results Bank of Maharashtra Results Binani Cement Results Binani Inds Results Biocon Results Chennai Petroleum Corporation Results D B Corp Results Dewan Housing Results Fag Bearings Results Finolex Inds Results Indian Bank Results Ipca Lab Results Kirloskar Oil Results Mirc Electronics Results NIIT Results Piramal Health Results SKS Microfinance Results Sobha Developers Results Wipro Results October 22, 2010 6
- 7. Market Outlook | India Research Research Team Tel: 022-4040 3800 E-mail: research@angeltrade.com Website: www.angeltrade.com DISCLAIMER This document is solely for the personal information of the recipient, and must not be singularly used as the basis of any investment decision. Nothing in this document should be construed as investment or financial advice. Each recipient of this document should make such investigations as they deem necessary to arrive at an independent evaluation of an investment in the securities of the companies referred to in this document (including the merits and risks involved), and should consult their own advisors to determine the merits and risks of such an investment. Angel Broking Limited, its affiliates, directors, its proprietary trading and investment businesses may, from time to time, make investment decisions that are inconsistent with or contradictory to the recommendations expressed herein. The views contained in this document are those of the analyst, and the company may or may not subscribe to all the views expressed within. Reports based on technical and derivative analysis center on studying charts of a stock's price movement, outstanding positions and trading volume, as opposed to focusing on a company's fundamentals and, as such, may not match with a report on a company's fundamentals. The information in this document has been printed on the basis of publicly available information, internal data and other reliable sources believed to be true, but we do not represent that it is accurate or complete and it should not be relied on as such, as this document is for general guidance only. Angel Broking Limited or any of its affiliates/ group companies shall not be in any way responsible for any loss or damage that may arise to any person from any inadvertent error in the information contained in this report. Angel Broking Limited has not independently verified all the information contained within this document. Accordingly, we cannot testify, nor make any representation or warranty, express or implied, to the accuracy, contents or data contained within this document. While Angel Broking Limited endeavours to update on a reasonable basis the information discussed in this material, there may be regulatory, compliance, or other reasons that prevent us from doing so. This document is being supplied to you solely for your information, and its contents, information or data may not be reproduced, redistributed or passed on, directly or indirectly. Angel Broking Limited and its affiliates may seek to provide or have engaged in providing corporate finance, investment banking or other advisory services in a merger or specific transaction to the companies referred to in this report, as on the date of this report or in the past. Neither Angel Broking Limited, nor its directors, employees or affiliates shall be liable for any loss or damage that may arise from or in connection with the use of this information. Note: Please refer to the important `Stock Holding Disclosure' report on the Angel website (Research Section). Also, please refer to the latest update on respective stocks for the disclosure status in respect of those stocks. Angel Broking Limited and its affiliates may have investment positions in the stocks recommended in this report. Address: Acme Plaza, ‘A’ Wing, 3rd Floor, M.V. Road, Opp. Sangam Cinema, Andheri (E), Mumbai - 400 059. Tel : (022) 3952 4568 / 4040 3800 Angel Broking Ltd: BSE Sebi Regn No : INB 010996539 / CDSL Regn No: IN - DP - CDSL - 234 - 2004 / PMS Regn Code: PM/INP000001546 Angel Capital & Debt Market Ltd: INB 231279838 / NSE FNO: INF 231279838 / NSE Member code -12798 Angel Commodities Broking (P) Ltd: MCX Member ID: 12685 / FMC Regn No: MCX / TCM / CORP / 0037 NCDEX : Member ID 00220 / FMC Regn No: NCDEX / TCM / CORP / 0302 October 22, 2010 7