🔝+919953056974 🔝young Delhi Escort service Pusa Road
Weekly Review
1. Weekly Review
August 14, 2010
Markets end flat FII activity
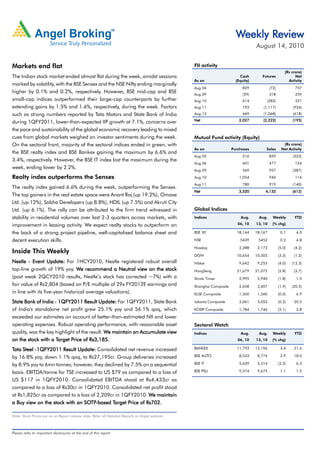
(Rs crore)
The Indian stock market ended almost flat during the week, amidst sessions Cash Futures Net
As on (Equity) Activity
marked by volatility, with the BSE Sensex and the NSE Nifty ending marginally
Aug 06 829 (72) 757
higher by 0.1% and 0.2%, respectively. However, BSE mid-cap and BSE Aug 09 (59) 318 259
small-cap indices outperformed their large-cap counterparts by further Aug 10 614 (282) 331
extending gains by 1.5% and 1.6%, respectively, during the week. Factors Aug 11 193 (1,117) (924)
such as strong numbers reported by Tata Motors and State Bank of India Aug 12 449 (1,068) (618)
Net 2,027 (2,222) (195)
during 1QFY2011, lower-than-expected IIP growth at 7.1%, concerns over
the pace and sustainability of the global economic recovery leading to mixed
cues from global markets weighed on investor sentiments during the week. Mutual Fund activity (Equity)
On the sectoral front, majority of the sectoral indices ended in green, with (Rs crore)
As on Purchases Sales Net Activity
the BSE realty index and BSE Bankex gaining the maximum by 6.6% and
Aug 05 516 839 (323)
3.4%, respectively. However, the BSE IT index lost the maximum during the
Aug 06 601 477 124
week, ending lower by 2.2%.
Aug 09 569 957 (387)
Realty index outperforms the Sensex Aug 10 1,054 940 114
Aug 11 780 919 (140)
The realty index gained 6.6% during the week, outperforming the Sensex.
Net 3,520 4,132 (612)
The top gainers in the real estate space were Anant Raj (up 19.2%), Omaxe
Ltd. (up 12%), Sobha Developers (up 8.8%), HDIL (up 7.5%) and Akruti City
Ltd. (up 6.1%). The rally can be attributed to the firm trend witnessed in Global Indices
stability in residential volumes over last 2-3 quarters across markets, with Indices Aug. Aug. Weekly YTD
improvement in leasing activity. We expect realty stocks to outperform on 06, 10 13, 10 (% chg)
the back of a strong project pipeline, well-capitalised balance sheet and BSE 30 18,144 18,167 0.1 4.0
decent execution skills. NSE 5439 5452 0.2 4.8
Nasdaq 2,288 2,173 (5.0) (4.2)
Inside This Weekly
DOW 10,654 10,303 (3.3) (1.2)
Nestle - Event Update: For 1HCY2010, Nestle registered robust overall Nikkei 9,642 9,253 (4.0) (12.3)
top-line growth of 19% yoy. We recommend a Neutral view on the stock HangSeng 21,679 21,072 (2.8) (3.7)
(post weak 2QCY2010 results, Nestle’s stock has corrected ~7%) with a Straits Times 2,995 2,940 (1.8) 1.5
fair value of Rs2,804 (based on P/E multiple of 29x FY2012E earnings and Shanghai Composite 2,658 2,607 (1.9) (20.5)
in line with its five-year historical average valuations). KLSE Composite 1,360 1,360 (0.0) 6.9
State Bank of India - 1QFY2011 Result Update: For 1QFY2011, State Bank Jakarta Composite 3,061 3,053 (0.2) 20.5
of India's standalone net profit grew 25.1% yoy and 56.1% qoq, which KOSPI Composite 1,784 1,746 (2.1) 3.8
exceeded our estimates on account of better-than-estimated NII and lower
operating expenses. Robust operating performance, with reasonable asset Sectoral Watch
quality, was the key highlight of the result. We maintain an Accumulate view Indices Aug. Aug. Weekly YTD
Target Price
on the stock with a Target Price of Rs3,185. 06, 10 13, 10 (% chg)
Tata Steel -1QFY2011 Result Update: Consolidated net revenue increased BANKEX 11,793 12,196 3.4 21.6
by 16.8% yoy, down 1.1% qoq, to Rs27,195cr. Group deliveries increased BSE AUTO 8,533 8,776 2.9 18.0
by 8.9% yoy to 6mn tonnes; however, they declined by 7.5% on a sequential BSE IT 5,639 5,514 (2.2) 6.3
basis. EBITDA/tonne for TSE increased to US $79 as compared to a loss of BSE PSU 9,574 9,675 1.1 1.5
US $117 in 1QFY2010. Consolidated EBITDA stood at Rs4,433cr as
compared to a loss of Rs30cr in 1QFY2010. Consolidated net profit stood
at Rs1,825cr as compared to a loss of 2,209cr in 1QFY2010. We maintain
We
SOTP
TP-based Target Price
a Buy view on the stock with an SOTP-based Target Price of Rs702.
Note: Stock Prices are as on Report release date; Refer all Detailed Reports on Angel website.
Please refer to important disclosures at the end of this report
2. Fundamental Focus | August 14, 2010
Focus
Nestle - Neutral Price - Rs2,805
Event Update
Nestle arranged its first analyst meet in CY2010 to discuss its volume growth and ensure long-term profitability via staggered
1HCY2010 performance and future outlook. We present the price hikes.
key takeaways:
Investments to rise, guides for aggressive capex: Driven by
Top-line growth driven by volumes, price-led growth missing:
op-line price-led robust volume growth, Nestle has guided for aggressive capex
For 1HCY2010, Nestle registered robust overall top-line growth plans and has already committed ~Rs360cr as of 1HCY2010
of 19% yoy driven largely by the 17.9% yoy volume growth in (~Rs70cr for 1HCY2009). We model in ~Rs425cr capex for
the domestic business and sharp rebound in export volumes, CY2010.
which grew 29.3% yoy.
Outlook and Valuation
Exports rebound led on higher beverage exports to Russia:
While we continue to like Nestle’s long-term growth story (best
Beverage volumes grew sharply by 27.1% yoy driven by the
play on food processing theme in India), we believe that Nestlé's
steep rebound in export volumes (beverages constituted ~70%
premium (100%) valuations to the Sensex (5yr average at ~80%)
of exports), which have picked up due to higher sales to Russia
is at risk to negative surprises, which could emerge from: 1)
(accounts for ~43% of exports).
gross margin pressures due to rising input costs, 2) competition
Maggi continues ~20%+ growth rate, competition in high-growth noodles category from HUL and GSKCHL, and
manageable: Prepared dishes (Maggi) registered a strong 3) up-tick in ad spends. Hence, we recommend Neutral view
~26% yoy volume growth despite the high base and rising on the stock (post weak 2QCY2010 result, Nestle’s stock has
competition (Horlick Foodles and Knorr Soupy Noodles) aided corrected ~7%) with a fair value of Rs2,804 (based on P/E
by well-positioned variants (Maggi Atta and Maggi Pazzta) and multiple of 29x FY2012E earnings, and in line with its 5-year
strong focus on LUP and PPP strategy historical average valuations).
Input cost inflation and staggered price hikes hurt margins:
During 2QCY2010, Nestle's overall raw material cost index
increased ~10% yoy driven by the 26%, 13%, 39% and 5% yoy
rise in the prices of fresh milk, skimmed milk powder, sugar
Key financials
and wheat respectively, while the prices of palm oil and green
coffee declined 18% and 17% yoy, respectively. Management's Y/E Dec (Rs cr) CY2009 CY2010 CY2011E CY2012E
strong focus on maintaining high volume growth across Net Sales 4,324 5,129 6,077 7,080
categories leading to limited price hikes (price-led growth in % chg 23.4 18.6 18.5 16.5
the last three quarters stood at 1%, 2% and 5%, respectively) Profit
Net Profit 534 655 768 932
coupled with high input cost inflation led to a 263bp and 138bp
% chg 29.1 22.6 17.2 21.4
yoy contraction in gross margins during 1QCY2010 and
2QCY2010, respectively. EBITDA (%) 20.0 20.2 19.0 19.2
EPS (Rs) 55.4 67.9 79.6 96.7
Going ahead, management expects good monsoons and
improved collections at its Moga factory to help control inflation P/E (x) 50.6 41.3 35.2 29.0
in the milk prices (key raw material accounting for ~34% of P/BV (x) 57.1 46.5 34.4 29.1
input costs), while correction in the sugar prices is likely to reflect RoE (%) 119.8 124.2 112.2 108.7
in yoy declines by 4QCY2010. However, rising prices of green
RoCE (%) 160.7 164.3 142.9 136.6
coffee and palm oil, up 3% and 17% yoy respectively, post
EV/Sales (x) 6.2 5.2 4.4 3.8
2QCY2010 will negate any significant gains from correction in
other inputs. Moreover, management has indicated that it is EV/EBITDA (x) 31.1 26.0 23.3 19.7
willing to compromise on near-term margins to maintain high Source: Company, Angel Research, Price as on August 10, 2010
Research Analyst - Anand Shah/Chitrangda Kapur/Sreekanth P.V.S
For Private Circulation Only | Angel Broking Ltd: BSE Sebi Regn No : INB 010996539 / CDSL Regn No: IN - DP - CDSL - 234 - 2004 / PMS Regn Code: PM/INP00000154 6 Angel Securities Ltd:BSE: INB010994639/INF010994639 NSE: INB230994635/INF230994635 Membership numbers: BSE 028/NSE:09946 2
3. Fundamental Focus | August 14, 2010
Focus
Finolex Cables - Buy Price - Rs58
Target Price - Rs85
1QFY2011 Result Update
Performance Highlights than doubled, increasing from Rs238cr in 3QFY2009 to Rs493
in1QFY2011. In the future too, the company looks to posting
Y/E March 1QFY11 4QFY10 % chg 1QFY10 % chg
(Rs cr) (qoq) (yoy) strong sales growth mainly on the back of demand revival in
Net Sales 493.1 464.0 6.3 327.8 50.4 the economy.
EBITDA 39.6 32.8 20.9 50.0 (20.7)
Margins under pressure, but stabilising: Post 3QFY2009, when
EBITDA margin (%) 8.0 7.1 15.2
the company posted losses at the operating level, margins
PAT 23.0 (5.4) - 22.0 4.5
Source: Company, Angel Research improved to 16.5% in 2QFY2010 on the back of low-cost
inventory. However, since then, margins have been declining
Finolex Cables posted a strong 50.4% growth in top-line for
and for 1QFY2011 came in at 8.0% mainly on account of the
1QFY2011 to Rs493cr (Rs328cr), which exceeded our
company's decision to not fully pass on the higher copper prices.
expectations. Sales growth was backed by robust performance
On a positive note, margins improved in 1QFY2011 qoq.
registered by the electrical cables segment, which grew 41.0%
yoy during the quarter to Rs296cr (Rs210cr). However, OPM Outlook and Valuation
was muted at 8.0% (15.2%) though sequentially it improved by Going ahead, we expect demand for low-tension (LT) cables to
97bp. With strong growth prospects in demand, we remain remain strong given the positive outlook in the user industries.
positive on the company. The EHV and HT cables plants are expected to start contributing
Strong top-line growth, sluggish margins: 1QFY2011 sales
top-line by FY2012E. We expect sales to log a CAGR of 23.2% over
increased with the electrical cables segment recording strong FY2010-12E to Rs2,458cr. However, OPM is expected to remain
growth. Copper rods and others segments sales also surged, under pressure. Hence, we revise our OPM estimates from
increasing 68.2% and 513.3% yoy, respectively. However, higher 10.2% to 10.0% in FY2011E and 10.4% to 10.2% in FY2012E.
raw material costs hit OPM, which stood at 8.0% for 1QFY2011. We expect PAT to log a CAGR of 57.4%. At current levels, the
stock is trading at 9.9x FY2011E and 6.2x FY2012E EPS. Hence,
Segment-wise performance: The electrical cables segment
Segment-wise
Target Price
we maintain a Buy on the stock, with a Target Price of Rs85.
posted strong growth of 41.0% yoy to Rs296cr (Rs210cr) mainly
on the back of higher realisations. Segment EBIT margin, at
12.2%, fell 867bp yoy mainly owing to higher raw material Key Financials
costs. However, sequentially EBIT margins increased by 288bp. Y/E March (Rs cr) FY2009 FY2010 FY2011E FY2012E
The communication cables segment registered a 20.4% yoy Net Sales 1,342 1,619 2,048 2,458
decline in sales to Rs42.7cr (Rs53.7cr). Margins of the segment % chg (3.1) 20.7 26.5 20.0
fell from 15.0% in 1QFY2010 to 8.1% in FY2011, with EBIT Profit
Net Profit (35) 58 90 143
coming in at Rs3.5cr (Rs8.1cr).
% chg - - 56.2 58.5
The copper rods segment posted sales of Rs339cr (Rs201cr) EBITDA (%) 7.6 12.2 10.0 10.2
and EBIT of Rs3.7cr (Rs2.2cr). However, most of these sales
EPS (Rs) (2.3) 3.8 5.9 9.3
were inter-segmental. Segment margins were flat yoy, at 1.1%.
P/E (x) - 15.5 9.9 6.2
Sales of the others segment grew to Rs55.7cr (Rs9.1cr). A
P/BV (x) 1.5 1.4 1.3 1.1
substantial portion of the sales was inter-segmental. The
segment recorded EBIT of Rs0.7cr in 1QFY2011, vis-à-vis a RoE (%) - 9.3 13.3 18.6
loss of Rs0.6cr in 1QFY2010. RoCE (%) 6.8 17.1 15.9 17.9
Sales on a strong growth curve: The company has recorded a EV/Sales (x) 0.6 0.5 0.4 0.4
consistent increase in top-line since 3QFY2009, when it was EV/EBITDA (x) 8.3 4.3 4.4 3.7
hit by the global economic crisis. Since then, sales have more Source: Company, Angel Research; Price as on August 10, 2010
Research Analyst - Jai Sharda
For Private Circulation Only | Angel Broking Ltd: BSE Sebi Regn No : INB 010996539 / CDSL Regn No: IN - DP - CDSL - 234 - 2004 / PMS Regn Code: PM/INP00000154 6 Angel Securities Ltd:BSE: INB010994639/INF010994639 NSE: INB230994635/INF230994635 Membership numbers: BSE 028/NSE:09946 3
4. Fundamental Focus | August 14, 2010
Focus
Hindalco-Novelis - Buy Price - Rs164
Target Price - Rs204
1QFY2011 Result Update
Performance Highlights Shipments across geographies higher yoy
(kt) 1QFY10 2QFY10 3QFY10 4QFY10 1QFY11 % yoy % qoq
Particulars 1QFY11 1QFY10 % chg 4QFY10 % chg
(US $mn) (yoy) (qoq) Total sales 691 724 683 756 779 12.7 3.0
Net sales 2,533 1,960 29.2 2,420 4.7 North America 261 266 254 282 283 8.4 0.4
Adj. EBITDA 263 124 112.1 231 13.9 Europe 212 218 204 250 249 17.5 (0.4)
% margin 10.4 6.3 406bp 9.5 84bp Asia 130 140 134 130 147 13.1 13.1
Net profit 50 143 (65.0) (1) -
South America 88 100 91 94 100 13.6 6.4
Source: Company, Angel Research
Source: Company, Angel Research
Top-line growth aided by higher shipments: Novelis, Hindalco's
op-line
Outlook and valuation
subsidiary, reported strong set of numbers for 1QFY2011. The
top line grew 29.2% yoy and 4.7% qoq to US $2,533mn, as At Rs164, the stock is trading at 6.1x FY2011E and 5.8x
total shipments increased by 12.7% yoy and 3.0% qoq to 779kt. FY2012E EV/EBITDA. Management expects Novelis to benefit
On a yoy basis, all regions registered an increase in volumes from increased demand for rolled products, which is expected
ranging from 8-18%. On a qoq basis, volumes were flat in to grow by 34% over the next five years led by Asia, Middle East
Europe but grew by 0.4-13.1% in other regions. and South America. Further, Hindalco is increasing its aluminium
Adj. EBITDA at an all-time high: Novelis reported adj. EBITDA
EBITDA capacity in India over the next two-four years. We maintain
of US $263mn, up 112.1% yoy and 13.9% qoq. This increase SOTP Target Price
Buy on Hindalco with an SOTP Target Price of Rs204.
was largely because of portfolio optimisation, increased pricing,
higher usage of scrap, reduced energy costs and a 19% dip in
SG&A expenses qoq. Consequently, adj. EBITDA/tonne touched
its all-time high at US $339/tonne. Management reiterated its
guidance of adj. EBITDA exceeding US $1bn. Interest expense
declined by US $5mn. Net profit came in at US $50mn during
the quarter.
Key Financials (Consolidated)
Key conference call takeaways
Y/E March (Rs cr) FY2009 FY2010E FY2011E FY2012E
Capex for the quarter stood at US $23mn. The full year Net sales 65,415 60,563 63,659 67,521
capex guidance is US $250mn. While US $120mn will be used
% chg 9.6 (7.4) 5.1 6.1
as maintenance capex, US $50mn will be spent on strategic
Net profit 485 3,925 3,626 3,891
projects, including de-bottlenecking of existing capacities. The
balance will be spent on capacity expansion plan in South % chg (79.7) 708.9 (7.6) 7.3
America, where the company is increasing capacity by 50% by EPS (Rs) 2.9 20.5 18.9 20.3
FY2013E at a cost of US $300mn. EBITDA margin (%) 4.6 16.1 13.0 13.8
The management indicated that it is operating at ~100% P/E (x) 58.0 8.1 8.7 8.1
utilisation levels. In the near term, volume growth of ~4-5% P/BV (x) 1.8 1.4 1.2 1.1
will be led by de-bottlenecking.
RoE (%) 2.9 20.6 15.1 14.2
Free cash flow was lower at US $34mn in 1QFY2011 as
RoCE (%) - 13.4 10.3 10.0
compared to US $213mn in 4QFY2010, as working capital
EV/Sales (x) 0.8 0.8 0.8 0.8
requirements increased due to higher LME prices and volumes.
However, management expects free cash flow in FY2011E to EV/EBITDA (x) 16.8 5.0 6.1 5.8
exceed US $355mn. Source: Company, Angel Research; Price as on August 10, 2010
Research Analyst - Paresh Jain/Pooja Jain
For Private Circulation Only | Angel Broking Ltd: BSE Sebi Regn No : INB 010996539 / CDSL Regn No: IN - DP - CDSL - 234 - 2004 / PMS Regn Code: PM/INP00000154 6 Angel Securities Ltd:BSE: INB010994639/INF010994639 NSE: INB230994635/INF230994635 Membership numbers: BSE 028/NSE:09946 4
5. Fundamental Focus | August 14, 2010
Focus
IVRCL Infrastructure - Buy Price - Rs170
Target Price - Rs216
1QFY2011 Result Update
Performance Highlights IVRCL's performance is disappointing on the execution front,
but we expect execution to pick up as the issues are temporary
Y/E March 1QFY11 1QFY10 % chg 4QFY10 % chg
(Rs cr) (qoq) (yoy) in nature. We have valued IVRCL on an SOTP basis. The
Net sales 1,106 1,110 0.3 1,890 (41.5) company's core construction business is valued at a P/E of 14x
Operating profit 100.8 99.6 1.2 198.4 (49.2) FY2012E EPS of Rs11.6 (Rs162/share), while its stake in
Net profit 28.1 35.3 (20.4) 85.3 (67.0) subsidiaries IVR Prime (Rs37/share) and Hindustan Dorr-Oliver
Source: Company, Angel Research
(Rs17/share) has been valued on an Mcap basis, post assigning
IVRCL Infrastructure (IVRCL) reported flat yoy top-line 20% holding company discount. Therefore, on the back of
performance for 1QFY2011, which was below our and street IVRCL's excellent execution track record, robust order book to
estimates. The company lost around Rs250cr in revenue for sales ratio and comfortable valuations, we maintain Buy on
the quarter on account of three projects. Management has Target Price
the stock with a Target Price of Rs216.
maintained its guidance of Rs6,700cr-Rs7,100cr, which implies
growth run rate for the next three quarters at ~30%, even at
the lower end of the guidance, which we believe is an uphill
task. Therefore, we prune our estimates. However, given the
company's past excellent track record and robust order book
rendering revenue visibility, we maintain our Buy rating on the
stock.
Top line below estimates, OPM in line with expectations: IVRCL
reported a flat top-line performance at Rs1,106cr. On the
operating front, the company posted margin of 9.1%, a tad
above our estimates of 8.6%. Below-estimate top-line
performance, cascaded at the bottom-line level, which came
in at mere Rs28.1cr.
Key Financials (Standalone)
…but margins broadly in line with expectations: IIVRCL reported Y/E March (Rs cr) FY2009 FY2010 FY2011E FY2012E
EBITDA margin of 9.1% for 1QFY2011. However, due to
Net sales 4,882 5,492 6,493 8,071
disappointing top-line performance and increased debt levels,
% chg 33.4 12.5 18.2 24.3
the bottom line reported a 20.4% decline to Rs28.1cr. We believe
there would be a revival in bottom-line growth once execution Adj. net profit 225.6 211.8 249.7 313.0
picks up. This is the consecutive fourth quarter of a declined % chg 7.1 (6.1) 17.9 25.4
performance by the company. Management has guided a EBITDA (%) 8.6 9.7 9.3 9.4
bottom line of ~Rs260cr for FY2011, which would require
FDEPS (Rs) 8.4 7.8 9.2 11.6
catching up as only Rs28.1cr of profit has been made until
1QFY2011. P/E (x) 20.4 21.7 18.4 14.7
P/BV (x) 2.5 2.4 2.2 1.9
Outlook and valuation
RoE (%) 13.2 11.4 12.4 13.8
IVRCL has a robust order book of Rs23,275cr (4.3x FY2010
RoCE (%) 12.7 13.6 13.0 13.9
revenue), which lends revenue visibility. Robust order booking
EV/Sales (x) 1.2 1.2 1.1 0.9
over the last few quarters ensures IVRCL's dependence on AP
orders has come down significantly (from 28% to current 17%). EV/EBITDA (x) 14.0 11.9 11.3 9.6
Source: Company, Angel Research; Price as on August 10, 2010
Research Analyst - Shailesh Kanani/Aniruddha Mate
For Private Circulation Only | Angel Broking Ltd: BSE Sebi Regn No : INB 010996539 / CDSL Regn No: IN - DP - CDSL - 234 - 2004 / PMS Regn Code: PM/INP00000154 6 Angel Securities Ltd:BSE: INB010994639/INF010994639 NSE: INB230994635/INF230994635 Membership numbers: BSE 028/NSE:09946 5
6. Fundamental Focus | August 14, 2010
Focus
Nagarjuna Construction - Buy Price - Rs166
Target Price - Rs201
1QFY2011 Result Update
Performance Highlights Operating margins for the quarter, on a standalone basis, came
in at 9.7% (10.4%) in line with our estimates. Interest costs
Y/E March 1QFY11 1QFY10 % chg 4QFY10 % chg
witnessed a sequential decline in spite of debt going up due to
(Rs cr) (yoy) (qoq)
low short-term borrowings rate. However, management has
Net Sales 1,086.5 1,001.0 8.5 1,522.7 (28.6)
cautioned against interest rates hardening in ensuing quarters.
Operating Profit 105.8 103.8 1.9 152.7 (30.8)
Net Profit 41.4 38.2 8.3 102.6 (59.7) Order Book Analysis: NCC's order book, which is spread across
Source: Company, Angel Research >10 verticals and major contributors include buildings, water
and roads, stood at Rs16,051cr (3.4x FY2010 revenues)
NCC posted disappointing numbers for 1QFY2011 mainly on
Outlook and Valuation:
the top-line front, which increased by a mere 8.5% v/s our
expectation of 27.4%. We have marginally pruned our estimates We believe that NCC is well-placed to leverage the opportunity
by 2-3%. However, management has maintained its guidance in the infrastructure space on account of having one of the
of Rs5,800cr for the year. Exposure to Andhra Pradesh remains most diversified order books along with exposure in most of
at ~6-7% and bills have been paid up to March 2010. Current the growth sectors. We believe that the BOT/BOOT project
receivables stand at Rs35cr. portfolio will also provide sustainable revenue stream for the
company, as it would have five operational projects by FY2011E.
Results below expectations: NCC posted disappointing numbers
NCC had mentioned earlier that it is looking for a strategic
for 1QFY2011 mainly on the top-line front, which increased
partner for its thermal power plant of 1,320MW (under financial
by a mere 8.5% as against our expectation of 27.4%. Operating
closure). But, given the recent problems at the site we believe
margins for the quarter came in at 9.7% (10.4%) in line with
that this proposed stake sale will take longer than the earlier
our estimates. Interest costs witnessed a sequential decline in
estimated time-frame. Nonetheless, we maintain our SOTP
spite of debt going up on account of low short-term borrowings
Target Price of Rs201 as we had considered only the equity
rate. However, management has cautioned against interest rates
invested for the project, which contributes a mere 1% to our
hardening in ensuing quarters.
valuations. We maintain a Buy on NCC.
Numbers below par: NCC posted disappointing numbers for
Key Financials (Standalone)
1QFY2011 mainly on the top-line front, which grew by a mere
8.5% as against our expectation of 27.4%. However, Y/E March (Rs cr) FY2009 FY2010 FY2011E FY2012E
management has maintained its guidance of Rs5,800cr for the Net Sales (incl op. income) 4,151.4 4,777.8 5,738.2 6,587.5
year. % chg 19.5 15.1 20.1 14.8
On a consolidated basis, for 1QFY2011 the company posted Adj. Net Profit
Profit 153.9 200.3 221.7 252.4
16% yoy growth in top-line to Rs1,363cr. It's Dubai and Muscat % chg (5.0) 30.2 10.7 13.8
construction companies posted top-line of Rs179.6cr and
FDEPS (Rs) 6.0 7.8 8.6 9.8
Rs113.0cr, respectively. The Bangalore elevated road project
has started collecting toll from April 7, 2010 at the run rate of EBITDA Margin (%) 9.0 10.1 9.8 9.9
Rs15lakh/day, with the potential to go up to Rs25lakh/day. The P/E (x) 27.7 21.2 19.2 16.9
other three road BOT projects are expected to be operational RoAE (%) 9.4 10.2 9.6 10.0
in FY2011 (OB Infra - August 2010; Western UP - Sep 2010; RoACE (%) 11.8 12.8 12.2 12.3
Pondicherry Tindivanam - Dec 2010) and which would require
P/BV (x) 2.5 1.9 1.8 1.6
investments of only Rs45-50cr. Management has guided that
once all these projects are fully operational potential yearly EV/Sales (x) 1.3 1.2 1.1 1.0
revenue generation would be to the tune of Rs300-325cr out EV/EBITDA (x) 14.4 11.6 10.8 9.8
of which NCC's share would be in the range of Rs150-160cr. Source: Company, Angel Research; Price as on August 11, 2010
Research Analyst - Shailesh Kanani/Aniruddha Mate
For Private Circulation Only | Angel Broking Ltd: BSE Sebi Regn No : INB 010996539 / CDSL Regn No: IN - DP - CDSL - 234 - 2004 / PMS Regn Code: PM/INP00000154 6 Angel Securities Ltd:BSE: INB010994639/INF010994639 NSE: INB230994635/INF230994635 Membership numbers: BSE 028/NSE:09946 6
7. Fundamental Focus | August 14, 2010
Focus
Ranbaxy - Accumulate Price - Rs444
Target Price - Rs485
2QCY2010 Result Update
Performance Highlights in 2QCY2009). Excluding the FTF sales, we expect OPM to be
Y/E Dec 2QCY10 1QCY10 % chg 2QCY09 % chg in the range of 3-4% for the quarter, indicating marginal
(Rs cr) qoq yoy improvement in the base business on the back of the
Net Sales 2,099 2,487 (15.6) 1,792 17.1 restructuring exercise undertaken by the company over the last
Other Income 397 450 (11.8) 127 211.6
6-9 months.
Operating Profit 365 771 (52.7) (30) -
Forex loss/ (gain) 349 (319) - (1,069) - Net profit driven by other income and nil tax charges: Ranbaxy
Profit
Net Profit 326 961 (66.1) 693 (53.0) reported net profit of Rs326cr (Rs693cr) driven by other income
Source: Company, Angel Research
and nil tax charges. The company clocked income on sale of
Ranbaxy reported higher-than-expected 2QCY2010 results investment to the tune of Rs218cr. Further, there were no tax
driven by FTF Valacyclovir, profit on sale of investments and nil charges during the quarter as the company booked most of
tax charges for the quarter. We expect operating performance the tax expense pertaining to the sale of Valacyclovir in
of the base business to have improved marginally on the back 1QCY2010 and profit on sale of investments were tax-free.
of restructuring done by the company in various geographies. Outlook and Valuation
On the US FDA and DoJ issues, the company is expecting a
The company has maintained its revenue guidance of Rs7,800cr
comprehensive solution in the next few months albeit with some
with net profit of Rs460cr for CY2010. We have revised upwards
penalties.
our other income estimates for CY2010 to factor in income
Revenues up 17% driven by Valacyclovir: Ranbaxy reported
Valacyclovir: from the Flomax settlement and sale of investments. On the
net sales of Rs2,099cr (Rs1,792cr), up 17.1% yoy driven by FTF valuation front, in the last three months, the stock has
exclusivity on Valacyclovir. On the back of exclusivity, the North underperformed the BSE HC index by ~7% and is trading at
America region revenues almost doubled to Rs738cr yoy. We EV/Sales of 2.5x (ex- FTF) CY2011E. We recommend an
We
expect Valacyclovir to contribute US $80-90mn on the revenue Accumulate on the stock, with a target price of Rs485, valuing
front with OPM of 65-75% during the period. Excluding the the base business at Rs380 at 2.2x CY2011E EV/Sales and
FTF sales, North America is estimated to report flat growth yoy. Para
have attached Rs105/share for the Para IVs.
Ranbaxy launched Lipitor in Canada and expects 20% market
share going forward with seven players in the market. Europe Key Financials (Consolidated)
positively surprised with revenues of Rs320cr, up 15% yoy driven Y E Dec (Rs cr) CY2008 CY2009 CY2010E CY2011E
by the Romania region. The company indicated that Germany Net Sales 7,224 7,329 8,162 9,913
and UK have been profitable markets, while it is facing growth % chg 6.6 1.5 11.4 21.4
issues in France. The CIS region recorded sales of Rs93cr, a
Profit
Reported Profit (951) 296 1,611 1,210
growth of 33%.
% chg - - - (24.9)
India region (excluding tender business) grew by mere 11.0%
EPS (Rs) - 7.1 38.3 28.8
in spite of 31 new products launched during the quarter and
expansion of field force by 1,500 MRs in the last six months. EBITDA Margin (%) 5.3 6.1 16.0 19.0
However, the company expects the India region to post healthy P/E (x) - 62.4 11.5 15.3
growth in 2HCY2010; ground work for project Viraat has been RoE (%) 3.3 31.3 20.2
completed. RoW sales de-grew by 11.0% following divestment
RoCE (%) - 2.4 12.7 18.8
of business in Japan and China. Ranbaxy also launched Lipitor
P/BV (x) 4.3 4.3 3.3 2.9
in South Africa.
EV/Sales (x) 2.8 2.8 2.4 1.9
OPM of base business improves marginally: Ranbaxy reported
EV/EBITDA (x) 51.7 47.0 14.8 10.1
OPM of 17.4% (as against loss reported on the operating front
Source: Company, Angel Research, Price as on August 13, 2010
Research Analyst - Sarabjit Kour Nangra/Sushant Dalmia
For Private Circulation Only | Angel Broking Ltd: BSE Sebi Regn No : INB 010996539 / CDSL Regn No: IN - DP - CDSL - 234 - 2004 / PMS Regn Code: PM/INP00000154 6 Angel Securities Ltd:BSE: INB010994639/INF010994639 NSE: INB230994635/INF230994635 Membership numbers: BSE 028/NSE:09946 7
8. Fundamental Focus | August 14, 2010
Focus
State Bank of India - Accumulate Price - Rs2,784
Target Price - Rs3,185
1QFY2011 Result Update
Performance Highlights Rs1,774cr (10.6% of the restructured loan book). The bank's
Particulars 1QFY11 4QFY10 % chg 1QFY10 % chg restructured loans outside the RBI scheme stood at Rs12,900cr,
(Rs cr) yoy yoy indicating cumulative restructuring/net worth of 43.1%
NII 7,304 6,721 8.7 5,025 45.4 compared to sector average of 68.3%.
Pre-Prov Profit 6,134 5,194 18.1 3,674 67.0
PAT 2,914 1,867 56.1 2,330 25.1 Outlook and Valuation
Source: Company, Angel Research
Due to strong CASA and fee income, SBI's core RoEs have
For 1QFY2011, State Bank of India's (SBI) standalone net profit improved over the past few years and unlike virtually all other
grew 25.1% yoy and 56.1% qoq, which exceeded our estimates PSBs, actual FY2010 RoEs are below core levels due to low
on account of better-than-estimated NII and lower operating asset yields, providing scope for upside as the CD ratio improves
expenses. Robust operating performance with reasonable asset and yields normalise to sectoral averages. SBI is trading at
quality was the key highlight of the result. 2.1x FY2012E ABV while excluding value of insurance and
capital market subsidiaries, it is trading at 1.7x FY2012E ABV
Robust operating performance: The bank's net advances v/s its 5-year range of 1.3-2.0x and median of 1.7x. We believe
increased 20.4% yoy and 3.4% qoq to Rs6,53,220cr, while total this provides reasonable upside, especially in light of its
deposits grew 6.8% yoy and 1.4% qoq to Rs8,15,297cr during dominant position and reach, strong growth and superior
1QFY2011. Reported net interest margin (NIM) improved by earnings quality. We maintain an Accumulate on the stock,
22bp qoq and 88bp yoy to 3.18% during the quarter despite a Target Price
with a Target Price of Rs3,185.
hit of 12bp due to change in the method of calculation of SA
interest. The margin expansion was underpinned by
improvement in the CASA ratio to 47.5% as of 1QFY2011 from SOTP valuation summary
38.5% as of 1QFY2010 and from 46.7% as of 4QFY2010 Company (Rs) Value per share
coupled with shedding of high-cost bulk deposits. SBI & Associates 2,956
Life 190
Reasonable asset quality: SBI's asset quality suffered slightly
AMC 12
during the quarter as gross NPAs rose 6.6% qoq to Rs20,825cr,
Others (Cap Mkt, Cards, Factors) 28
while net NPAs increased 1.9% qoq to Rs11,074cr partly due
SOTP
SOTP value 3,185
to the net increase in gross NPAs from agricultural advances of
Rs683cr, which included Rs354cr towards the Agri Debt Waiver Key Financials
scheme. The gross and net NPA ratio remained steady Y/E March (Rs cr) FY2009 FY2010 FY2011E FY2012E
sequentially at 3.1% and 1.7%, respectively.
NII 20,873 23,671 30,834 37,558
The gross slippages during the quarter were Rs4,081cr, which % chg 22.6 13.4 30.3 21.8
came primarily from the agri, retail and SME portfolios. The
Profit
Net Profit 9,332 9,398 10,771 5,042
annualised slippage ratio stood at 2.6% compared to 2.2% in
FY2010. The bank's corporate and SME portfolio accounted % chg 38.7 0.7 14.6 39.6
for more than 56.0% of the total gross NPAs of Rs20,825cr. NIM (%) 2.6 2.5 2.8 2.9
The provision coverage ratio including technical write-offs EPS (Rs) 147.0 148.0 169.7 236.9
improved from 59.2% as of 4QFY2010 to 60.7% as of
P/E (x) 18.9 18.8 16.4 11.8
1QFY2011.
P/ABV (x) 3.4 2.9 2.4 2.1
Out of the cumulative standard restructured assets under the
RoA (%) 1.1 0.9 0.9 1.1
RBI Special Dispensation Scheme which stood at Rs16,796cr
as of 4QFY2010, Rs158cr turned into NPAs during the quarter RoE (%) 18.7 16.2 16.4 20.1
taking the cumulative slippages from restructured book to Source: Company, Angel Research, Price as on August 12, 2010
Research Analyst - Vaibhav Agrawal/Amit Rane/Shrinivas Bhutda
For Private Circulation Only | Angel Broking Ltd: BSE Sebi Regn No : INB 010996539 / CDSL Regn No: IN - DP - CDSL - 234 - 2004 / PMS Regn Code: PM/INP00000154 6 Angel Securities Ltd:BSE: INB010994639/INF010994639 NSE: INB230994635/INF230994635 Membership numbers: BSE 028/NSE:09946 8
9. Fundamental Focus | August 14, 2010
Focus
Tata Motors - Buy Price - Rs957
Target Price - Rs1,214
1QFY2011 Result Update
Performance Highlights reported a 61.2% yoy jump in operating profit to Rs1,156cr
(Rs717cr).
Consolidated 1QFY11 1QFY10 % chg Angel % Diff
(Rs cr) yoy Est. TML reported 23%yoy fall in net profit of Rs396cr (Rs514cr) for
Net Sales 27,056 16,397 65 27,450 (1.4)
the quarter due to lower other income of Rs69 (Rs319). Higher
Operating Profit 3,855 503 667 2,992 28.9
tax provision and interest rates arrested further gain in net profit
OPM (%) 14.2 3.1 1,118bp 10.9 335bp
PA
Reported PAT 1,979 (334) (692) 1,273 56 for the quarter. The commissioning of the Sanand facility resulted
Source: Company, Angel Research in reduction in the capitalisation of interest expense and higher
depreciation.
Consolidated performance substantially above expectations:
Tata Motors (TML) recorded an outstanding performance for Valuation
Outlook and Valuation
1QFY2011. Net profit for the quarter stood at Rs1,979cr as We estimate TML to record a CAGR of 171% in net profit over
against net loss of Rs334cr in 1QFY2010. This exceptional
FY2010-12E on a consolidated basis, owing to the better-than-
performance came on the back of improved operational expected recovery in JLR. At Rs957, on a consolidated basis,
performance at JLR and other key subsidiaries of the company. the stock is trading at 7.9x and 7.2x FY2011E and FY2012E
Further, favorable currency movement and restructuring efforts
earnings, respectively. We have valued the stock on the sum-of
at JLR boosted margins at consolidated levels. OPM increased the-parts (SOTP) methodology. We recommend a Buy on TML, TML,
by 1,118bp yoy and 343bp qoq to 14.2% for 1QFY2011. Top-
with a revised SOTP Target Price of Rs1,214. We have valued
SOTP Target Price
line at Rs27,056cr (up 65% yoy) was aided by higher growth in
the core business at Rs490, implying 6.5x FY2012E EV/EBITDA
the domestic and JLR volumes and a significant 27% yoy jump and P/E of 13x FY2012E EPS. Our embedded value of the
in JLR realisation. subsidiaries and investments in TML's books (including JLR) works
TML's total net debt, on a consolidated basis, increased out to Rs724/share. We value JLR at 7x PAT and 4.5x EV/EBITDA
marginally on a qoq basis to Rs19,983cr (Rs18,800cr in on FY2012E basis, in line with its peers.
4QFY2010). The consolidated net debt-to-equity ratio stood at
around 1.96x in 1QFY2011 (2.33x in 4QFY2010).
Key Financials (Consolidated)
Consolidated 1QFY11 1QFY10 % chg Angel % Diff Y/E March (Rs cr) FY2009 FY2010 FY2011E FY2012E
(Rs cr) yoy Est.
Net Sales 70,881 92,519 108,549 122,786
Net Sales 10,416 6,405 63 11,092 (6.1)
Operating Profit 1,156 717 61 1,065 8.5 % chg 100.1 30.5 17.3 13.1
OPM (%) 11.1 11.2 (10)bp 9.6 149bp
Profit
Adj. Net Profit (2,228) 1,034 6,927 7,566
PA
Reported PAT 396 514 (23) 422 (6)
Source: Company, Angel Research % chg (215.0) - 569.7 9.2
OPM (%) 2.1 7.2 13.3 13.0
Standalone performance marginally below expectation: For
Adj. EPS (Rs) (43.3) 18.1 121.4 132.6
1QFY2011, TML reported substantial 63% yoy growth in net
sales to Rs10,416cr (Rs6,405cr) on a low base, and was P/E (x) - 52.8 7.9 7.2
marginally lower than our expectation. Top-line was primarily P/BV (x) 8.4 6.8 4.1 2.8
driven by the 48% yoy growth in volumes. Net average RoE (%) - 12.9 52.2 39.0
realisation jumped almost 10.5% yoy largely owing to
RoCE (%) - 6.2 23.3 23.0
favourable product mix and the 1% hike in the product prices
taken by the company during the quarter. During 1QFY2011, EV/Sales (x) 1.2 0.8 0.7 0.5
EBITDA margins declined by a marginal 10bp yoy to 11.1% EV/EBITDA (x) 56.6 12.2 5.4 4.2
(11.2%) owing to improved operating leverage. Thus, TML Source: Company, Angel Research, Price as on August 10, 2010
Research Analyst - Vaishali Jajoo/Yaresh Kothari
For Private Circulation Only | Angel Broking Ltd: BSE Sebi Regn No : INB 010996539 / CDSL Regn No: IN - DP - CDSL - 234 - 2004 / PMS Regn Code: PM/INP00000154 6 Angel Securities Ltd:BSE: INB010994639/INF010994639 NSE: INB230994635/INF230994635 Membership numbers: BSE 028/NSE:09946 9