New dynamic economic model with a digital footprint | European Business Review
Weekly review 15-05-10
1. Weekly Review
May 15, 2010
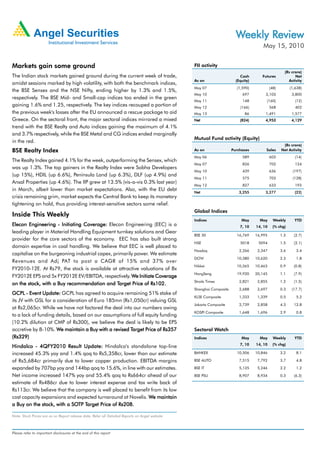
Markets gain some ground FII activity
(Rs crore)
The Indian stock markets gained ground during the current week of trade, Cash Futures Net
As on (Equity) Activity
amidst sessions marked by high volatility, with both the benchmark indices,
May 07 (1,590) (48) (1,638)
the BSE Sensex and the NSE Nifty, ending higher by 1.3% and 1.5%,
May 10 697 3,103 3,800
respectively. The BSE Mid- and Small-cap indices too ended in the green
May 11 148 (160) (12)
gaining 1.6% and 1.25, respectively. The key indices recouped a portion of May 12 (166) 568 402
the previous week's losses after the EU announced a rescue package to aid May 13 86 1,491 1,577
Greece. On the sectoral front, the major sectoral indices mirrored a mixed Net (824) 4,953 4,129
trend with the BSE Realty and Auto indices gaining the maximum of 4.1%
and 3.7% respectively, while the BSE Metal and CG indices ended marginally
Mutual Fund activity (Equity)
in the red.
(Rs crore)
BSE Realty Index As on Purchases Sales Net Activity
May 06 589 603 (14)
The Realty Index gained 4.1% for the week, outperforming the Sensex, which
May 07 826 702 124
was up 1.3%. The top gainers in the Realty Index were Sobha Developers
May 10 439 636 (197)
(up 15%), HDIL (up 6.6%), Peninsula Land (up 6.3%), DLF (up 4.9%) and
May 11 575 703 (128)
Ansal Properties (up 4.6%). The IIP grew at 13.5% (vis-a-vis 0.3% last year)
May 12 827 633 193
in March, albeit lower than market expectations. Also, with the EU debt
Net 3,255 3,277 (22)
crisis remaining grim, market expects the Central Bank to keep its monetary
tightening on hold, thus providing interest-sensitive sectors some relief.
Global Indices
Inside This Weekly
Indices May May Weekly YTD
Elecon Engineering - Initiating Coverage: Elecon Engineering (EEC) is a 7, 10 14, 10 (% chg)
leading player in Material Handling Equipment turnkey solutions and Gear
BSE 30 16,769 16,995 1.3 (2.7)
provider for the core sectors of the economy. EEC has also built strong
NSE 5018 5094 1.5 (2.1)
domain expertise in coal handling. We believe that EEC is well placed to
Nasdaq 2,266 2,347 3.6 3.4
capitalise on the burgeoning industrial capex, primarily power. We estimate
DOW 10,380 10,620 2.3 1.8
Revenues and Adj PAT to post a CAGR of 15% and 37% over
Nikkei 10,365 10,463 0.9 (0.8)
FY2010-12E. At Rs79, the stock is available at attractive valuations of 8x
HangSeng 19,920 20,145 1.1 (7.9)
FY2012E EPS and 5x FY2012E EV/EBITDA, respectively. We Initiate Coverage
Straits Times 2,821 2,855 1.2 (1.5)
Target Price
on the stock, with a Buy recommendation and Target Price of Rs102.
Shanghai Composite 2,688 2,697 0.3 (17.7)
GCPL - Event Update: GCPL has agreed to acquire remaining 51% stake of
KLSE Composite 1,333 1,339 0.5 5.2
its JV with GSL for a consideration of Euro 185mn (Rs1,050cr) valuing GSL
Jakarta Composite 2,739 2,858 4.3 12.8
at Rs2,065cr. While we have not factored the deal into our numbers owing
KOSPI Composite 1,648 1,696 2.9 0.8
to a lack of funding details, based on our assumptions of full equity funding
(10.2% dilution at CMP of Rs300), we believe the deal is likely to be EPS
Target Price
accretive by 8-10%. We maintain a Buy with a revised Target Price of Rs357 Sectoral Watch
(Rs329) Indices May May Weekly YTD
7, 10 14, 10 (% chg)
Hindalco - 4QFY2010 Result Update: Hindalco's standalone top-line
increased 45.3% yoy and 1.4% qoq to Rs5,358cr, lower than our estimate BANKEX 10,506 10,846 3.2 8.1
of Rs5,684cr primarily due to lower copper production. EBITDA margins BSE AUTO 7,515 7,792 3.7 4.8
expanded by 707bp yoy and 144bp qoq to 15.6%, in line with our estimates. BSE IT 5,135 5,246 2.2 1.2
Net income increased 147% yoy and 55.4% qoq to Rs664cr ahead of our BSE PSU 8,907 8,934 0.3 (6.3)
estimate of Rs486cr due to lower interest expense and tax write back of
Rs113cr. We believe that the company is well placed to benefit from its low
cost capacity expansions and expected turnaround at Novelis. We maintain
SOTP Target Price
a Buy on the stock, with a SOTP Target Price of Rs208.
Note: Stock Prices are as on Report release date; Refer all Detailed Reports on Angel website
Please refer to important disclosures at the end of this report
2. Fundamental Focus | May 15, 2010
Focus
Elecon Engineering - Buy Price - Rs79
Target Price - Rs102
Target Price - Rs356
Initiating Coverage
‘Material’ising Growth FY2003-04, EEC's MHE Division posted a Loss, but the Gear
Division continues to record Profits and helps maintain overall
Elecon Engineering (EEC) is a leading player in the Material
Profit of the company.
Handling Equipment (MHE) turnkey solutions and Gear provider
for the core sectors (Power, Steel, Infra, etc.) of the economy. Outlook and Valuation
EEC has also built strong domain expertise in coal handling. We estimate EEC's Revenues to post a CAGR of 15% over
We believe that EEC is well placed to capitalise on the FY2010-12E. EBITDA Margins are expected to remain stable
burgeoning industrial capex, primarily power. at current levels of 15%. We believe that due to strong correction
Recovery augurs well for the Sector: We expect industrial capex in the commodity prices and easing of working capital cycle,
to revert back to growth path with the economy reviving EEC’s net working capital would start aligning with the historical
(indicated by the improvement in IIP), continuous government average and stand reduced. Overall, this is likely to de-leverage
focus on infrastructure spend and pick up in private capex. The the company’s Balance Sheet and lower Interest outflow in turn
Domestic Rs5,700cr (FY2009) MHE Industry has strong improving overall Profitability. We expect Adj PAT to record a
correlation with industrial growth. Overall, emerging CAGR of 37% over FY2010-12E, as against the 13% decline
opportunities in the MHE Industry are estimated to be around witnessed during FY2008-10. We expect RoCE and RoE to
Rs32,500cr over FY2009-12E. This augurs well for MHE solution improve from 15% and 17% in FY2010 to 21% and 23% in
players like EEC. Near-term growth for the MHE companies is FY2012E, respectively.
expected to be driven by high capex likely to be incurred in the On the valuation front, during the last five years, EEC has traded
core sectors of Power and Steel (Rs25,500cr). in a one-year forward P/E band of 1-53x, and average 14x. At
Order inflow to gather pace in FY2011E: EEC's current Order
FY2011E: Rs79, the stock is available at attractive valuations of 8x FY2012E
Book is pegged at Rs1,243cr (end of 4QFY2010), translating Earnings and 5x FY2012E EV/EBITDA, respectively. We Initiate
into 1.2x FY2009 Revenues. The MHE Segment is the largest Coverage on the stock, with a Buy recommendation and Target Target
contributor to EEC’s Order Book at Rs997cr followed by Gears Price of Rs102, valuing the company at 10x FY2012E EPS .
at Rs246cr. We expect Order inflow to gather pace in FY2011E, Key Financials
which is evident from EEC’s Order inflow of around Rs400cr
Y/E March (Rs cr) FY2009 FY2010E FY2011E FY2012E
registered in the first two months of the current fiscal. We have
Net Sales 955 1,054 1,201 1,358
conservatively estimated EEC's MHE Segment Order inflow to
register CAGR of 60% over FY2010-12E considering that the % chg 15.6 10.4 13.9 13.1
industry’s total annual opportunity is estimated at Rs10,800cr Profit
Adj Profit 55.0 50.6 73.1 94.9
(Rs32,500cr over FY2009-12e). Given EEC ’s historic % chg (18.2) (8.0) 44.6 29.8
market share of 12-14%, it translates into cumulative Order
EPS (Rs) 5.9 5.4 7.9 10.2
flow of Rs2,800cr in FY2011-12E, exceeding our estimate of
Rs1,500cr. EBITDA Margin (%) 17.3 15.1 15.0 15.4
P/E (x) 13.4 14.5 10.0 7.7
Stronghold in Gear market helps maintain Profit: The total
Profit:
Gear market in India is estimated at Rs1,600cr, of which EEC RoE (%) 21.5 16.8 20.8 23.1
has 26% share followed by Shanthi Gears (17%). Gears are RoCE (%) 18.0 14.8 18.0 20.9
used across industries, have constant demand from P/BV (x) 2.7 2.3 2.0 1.7
Replacement market apart from new demand. EEC is Asia's
EV/Sales (x) 1.3 1.1 0.9 0.8
largest manufacturer of variety of gears and supplies to various
EV/EBITDA (x) 7.7 7.1 6.0 5.0
industries. EEC's leadership position in the Gear market has
Source: Company, Angel Research, Price as on May 14, 2010, Refer
primarily helped in generating constant Profits. Over
detailed Company Report to be release shortly.
Research Analyst - Sageraj Bariya
For Private Circulation Only | Angel Broking Ltd: BSE Sebi Regn No : INB 010996539 / CDSL Regn No: IN - DP - CDSL - 234 - 2004 / PMS Regn Code: PM/INP00000154 6 Angel Securities Ltd:BSE: INB010994639/INF010994639 NSE: INB230994635/INF230994635 Membership numbers: BSE 028/NSE:09946 2
3. Fundamental Focus | May 15, 2010
Focus
Godrej Consumer Products - Buy Price - Rs298
Target Price - Rs357
Event Update
Target Price - Rs356
GSL consolidation complete portfolio, stronger performance of its International business and
a potential upside trigger from further acquisitions (likely in
GCPL acquires remaining 51% stake in GSL for Rs1,050cr:
Latin America, in talks with Embelleze and Issue), we believe
Godrej Consumer (GCPL) has entered into an agreement to
that the stock still offers significant triggers for sustained
acquire remaining 51% stake in Godrej Sara Lee (GSL), owned
performance. Hence, we have revised our Target Price upwards
Target Price
by its JV partner Sara Lee Corp for a consideration of Euro
to Rs357 (Rs329), valuing GCPL at 23x FY2012E revised EPS
185mn (Rs1,050cr) valuing GSL at Rs2,065cr. This acquisition
of Rs15.5 (based on our assumptions, does not include
will help GCPL catapult in becoming one of the strongest
Tura
financials from the Tura and Megasari acquisitions).
performers in the home and personal care space in India. Along
with the Megasari acquisition in Indonesia, this transaction
would make GCPL the second largest household insecticide
player in Asia (outside Japan).
Acquisition priced attractively at 15x FY2010 Earnings and
2.1x P/Sales: During the year FY2010, GSL registered revenue
of Rs965cr (20% yoy growth) and PAT of Rs137cr (31% yoy
growth). Hence, GCPL has acquired the 51% stake in GSL for
15x FY2010 Earnings and 2.1x P/Sales which we believe is
extremely attractive. We recall, in May 2009, exactly a year
ago, GCPL had acquired 49% stake in GSL via a share swap
for Rs845cr valuing GSL at Rs1,725cr implying a P/E of 16.5x
FY2009 Earnings and 2.3x P/Sales.
Deal likely to be funded via equity: Post Megasari acquisition
(to be funded via low cost offshore debt), we believe GCPL's
debt: equity ratio is likely to rise to ~1.5x. Hence, we believe Key Financials (Consolidated)
the current transaction is likely to be funded via equity dilution.
Y/E March (Rs cr) FY2009 FY2010E FY2011E FY2012E
In this case, assuming a CMP of Rs300, GCPL will need to
Net Sales 1,393 2,041 2,412 2,720
issue an additional 3.5cr shares to fund Rs1,050cr transaction
leading to an equity dilution of 10.2%. % chg 26.3 46.5 18.2 12.7
Profit
Net Profit (Adj) 172.6 339.6 392.4 437.8
Deal to be EPS accretive by 8-10%: We have modeled in a
21% and 15% yoy growth in Top-line for GSL during FY2011E % chg 8.4 96.7 15.5 11.6
and FY2012E respectively. Assuming a 14% Net Margin for OPM (%) 14.6 20.0 20.2 20.3
GSL in respective years, we believe the additional 51% stake of EPS (Rs) 5.6 11.0 12.7 14.2
GSL is likely to add Rs83cr and Rs96cr Bottom-line to GCPL in
P/E (x) 53.2 27.0 23.4 21.0
FY2011E and FY2012E respectively. Based on our assumption
of full funding via equity dilution (10.2% at CMP of Rs300), we P/BV (x) 13.5 12.1 9.5 7.7
believe the deal is likely to be EPS accretive by 8-10%. RoE (%) 46.9 51.3 45.4 40.5
Target Price revised to Rs357, Recommend a Buy: While we
Price RoCE (%) 30.3 41.6 42.0 40.5
have not factored the deal into our numbers owing to a lack of EV/Sales (x) 6.5 4.4 3.7 3.2
funding details, based on our assumptions of full equity funding EV/EBITDA (x) 44.6 22.3 18.4 15.8
(10.2% dilution at CMP of Rs300), we believe the deal is likely Source: Company, Angel Research, Price as on May 12, 2010, Note: Not
to be EPS accretive by 8-10%. Moreover, with GCPL's wider including recent acquisitions of Megasari, Tura and GSL - 51%
Research Analyst - Anand Shah/Chitrangda Kapur
For Private Circulation Only | Angel Broking Ltd: BSE Sebi Regn No : INB 010996539 / CDSL Regn No: IN - DP - CDSL - 234 - 2004 / PMS Regn Code: PM/INP00000154 6 Angel Securities Ltd:BSE: INB010994639/INF010994639 NSE: INB230994635/INF230994635 Membership numbers: BSE 028/NSE:09946 3
4. Fundamental Focus | May 15, 2010
Focus
Dr. Reddy's Laboratories - Accumulate Price - Rs1,207
Target Price - Rs1,313
Target Price - Rs356
4QFY2010 Result Update
Performance Highlights ensure higher Revenue visibility for the next three years;
2) Alliance with GSK is expected to start bearing fruits from
Dr. Reddy's Laboratories' (DRL) 4QFY2010 results, as per the
FY2011E onwards by providing DRL access to newer markets;
Indian GAAP were below our expectation owing to the sluggish
,
3) Up-tick in the Domestic Formulation business through launch
Pharmaceutical Services and Active Ingredients (PSAI) Sales,
of Biosimilars and Chronic Segment products; and 4) Improving
one-off expenses pertaining to Betapharm and closure of facility
Return Ratios.
in the US. The company reported Net Sales of Rs1,569cr, up
1.8% yoy adjusted for Sumatriptan sales in 4QFY2009. The We expect DRL's Net Sales to post a CAGR of 19.6% to
company reported OPM of 13.8% marred by one-off expenses Rs9,797cr, while EPS is estimated to register a CAGR of 27.5%
of US $12mn with Net Profit coming at Rs105.8cr. However, to Rs78.1 over FY2010-12E. The stock is trading at 20.6x and
the company reiterated its FY2013 Revenue guidance of 15.5x FY2011E and FY2012E Earnings respectively, and 2.5x
US $3bn on the back of strong growth expected across US, FY2011E and 2.1x FY2012E EV/Sales. We maintain an
India and Russia. We maintain an Accumulate on the stock, Target Price
Accumulate on the stock, with a Target Price of Rs1,313 (valuing
with a Target Price of Rs1,313 on the back of DRL's strong the Core business at 20x FY2012E Earnings of Rs63.6 and
product portfolio in the US and traction on the Domestic front. NPV of Rs41).
Results below expectation: DRL reported Net Sales of Rs1,569cr
(Rs1,928cr) down 18.6% yoy on a high base (Sumatriptan sales
in 4QFY2009). Adjusted for the same, Revenues grew a mere
1.8% yoy and below our expectation on the back of sluggish
PSAI Segment sales. For FY2010, DRL reported Net Sales of
Rs6,852cr (Rs6,790cr), up a mere 0.9% yoy as against the
company's revised Revenue guidance of low single-digit growth.
DRL reported OPM of 13.8% (24.2%), which contracted by
10.3% and below our expectation of 17.5%. For FY2010, the Key Financials (Indian GAAP Consolidated)
,
company reported OPM of 18.1% (17.5%), expanding by 50bp Y/E March (Rs cr) FY2009 FY2010E FY2011E FY2012E
due to lower SG&A expenses. For 4QFY2010, the company
Net Sales 6,790 6,852 8,416 9,797
reported Net Profit of Rs105.8cr (Loss of Rs1,255.3cr). Adjusted
% chg 38.2 0.9 22.8 16.4
for the impairment of Betapharm Goodwill in 4QFY2009, Net
Profit fell 49.0%. For FY2010, the company reported Net Profit Profit
Net Profit (917) 351 995 1,315
of Rs351.4cr (Loss of Rs917.4cr). Adjusted for impairment, Profit % chg - - 183.1 32.2
for FY2010 grew 48.4% to Rs809.7cr (Rs545.4cr) driven by EPS (Rs) - 20.9 59.1 78.1
lower interest rate and higher Other Income.
Adj EPS (Rs) 32.4 48.1 59.1 78.1
Outlook and Valuation EBITDA Margin (%) 17.5 18.1 18.9 19.4
DRL is among the largest Indian Pharmaceutical companies P/E (x) - 58.2 20.6 15.5
with a strong product portfolio and vertical integration across RoE (%) - 22.3 23.8 25.2
its business segments, viz. Global Generic Business,
RoCE (%) - 14.9 20.7 24.7
Pharmaceutical Services and Active Ingredients and Proprietary
P/BV (x) 5.8 5.5 4.4 3.5
Products. We remain positive on the company on account of:
1) Robust growth likely in the US Generic business driven by EV/Sales (x) 3.2 3.2 2.5 2.1
strong Base business and limited competition product launches, EV/EBITDA (x) 18.4 17.7 13.3 10.6
viz. Omeprazole OTC, Arixtra, Allegra D 24 and Lotrel, which Source: Company, Angel Research, Price as on May 7, 2010
Research Analyst - Sarabjit Kour Nangra/Sushant Dalmia
For Private Circulation Only | Angel Broking Ltd: BSE Sebi Regn No : INB 010996539 / CDSL Regn No: IN - DP - CDSL - 234 - 2004 / PMS Regn Code: PM/INP00000154 6 Angel Securities Ltd:BSE: INB010994639/INF010994639 NSE: INB230994635/INF230994635 Membership numbers: BSE 028/NSE:09946 4
5. Fundamental Focus | May 15, 2010
Focus
Hindalco - Buy Price - Rs170
Target Price - Rs208
Target Price - Rs356
4QFY2010 Result Update
Performance Highlights Outlook and Valuation
For 4QFY2010, Hindalco's standalone top-line increased 45.3% At Rs170, the stock is trading at 6.1x FY2011E and 5.7x
yoy and 1.4% qoq to Rs5,358cr, lower than our estimate of FY2012E EV/EBITDA. We feel that the company is well placed
Rs5,684cr primarily due to lower copper production. EBITDA to benefit from: 1) its aluminium expansion plans by nearly
margins expanded by 707bp yoy and 144bp qoq to 15.6%, in two-three folds in next 2-4years, 2) low cost of production at its
line with our estimates. Net income increased 147% yoy and new capacities, and 3) expected turnaround at Novelis. We
55.4% qoq to Rs664cr ahead of our estimate of Rs486cr due SOTP Target Price
maintain a Buy on the stock, with a SOTP Target Price of Rs208.
to lower interest expense and tax write-back of Rs113cr. We Key risks to our call: 1) Adverse movements in metal prices, 2)
believe that the company is well placed to benefit from its low Adverse Rupee movement, and 3) Delay in completion of
cost capacity expansions and expected turnaround at Novelis. expansion projects.
Performance above expectation: Hindalco's standalone
top-line increased 45.3% yoy and 1.4% qoq to Rs5,358cr, which
was lower than our estimate on account of lower copper
production due to shutdown of its smelter. Copper cathode
production was lower by 14% yoy and 16.2% qoq to 74,734
tonnes. EBITDA increased 165.8% yoy to Rs835cr as margins
expanded by 707bp due to higher LME prices. Net income was
sharply ahead of our estimates by 36.5% on account of lower
interest expense and tax write-back of Rs113cr. While the
aluminium division's revenue grew by 31% yoy to Rs2045cr,
EBIT margins increased from 10.4% in 4QFY2009 and 23.2%
in 3QFY2010 to 30.0% in 4QFY2010. On the other hand,
copper division's revenue grew by 51.9% yoy to Rs3361cr, the
EBIT margins increased from 2.3% in 4QFY2009 to 3.8% in Key Financials (Consolidated)
4QFY2010 but declined from 4.6% in 3QFY2010.
Y/E March (Rs cr) FY2009 FY2010E FY2011E FY2012E
Project cost push: Total estimated project cost has increased by Net Sales 65,415 60,681 63,898 67,521
Rs4,498cr to Rs40,893cr from the earlier Rs 36,395cr. However,
% chg 9.6 (7.2) 5.3 5.7
the projects are on track for their timely completion.
Profit
Net Profit 485 3,072 3,761 4,027
Revised Project Costs % chg (79.7) 532.9 22.4 7.1
Timeline Cost (Rs cr)
EPS (Rs) 2.9 16.1 19.7 21.0
Earlier Revised
OPM (%) 4.6 12.9 13.0 13.8
Smelter Hirakud Phase I 2QFY11E 893 893
Phase II 4QFY12E P/E (x) 59.5 10.6 8.6 8.1
Mahan Aluminim 2QFY12E 8,214 9,200 P/BV (x) 1.8 1.5 1.3 1.1
Aditya Aluminium 3QFY12E 8,214 9,200 RoE (%) 2.9 16.5 16.2 15.0
Jharkhand Aluminium 1QFY14E 8,214 10,000
RoCE (%) - 10.5 10.6 10.3
Refinery Utkal Alumina 2QFY12E 5,560 5,600
Aditya Alumina 1QFY14E 5,300 6,000 EV/Sales (x) 0.8 0.8 0.8 0.8
Total Project costs
Project 36,395 40,893 EV/EBITDA (x) 17.0 6.4 6.1 5.7
Source: Company, Angel Research Source: Company, Angel Research, Price as on May 11, 2010
Research Analyst - Paresh Jain/Pooja Jain
For Private Circulation Only | Angel Broking Ltd: BSE Sebi Regn No : INB 010996539 / CDSL Regn No: IN - DP - CDSL - 234 - 2004 / PMS Regn Code: PM/INP00000154 6 Angel Securities Ltd:BSE: INB010994639/INF010994639 NSE: INB230994635/INF230994635 Membership numbers: BSE 028/NSE:09946 5
6. Fundamental Focus | May 15, 2010
Focus
HT Media - Buy Price - Rs151
Target Price - Rs182
Target Price - Rs356
4QFY2010 Result Update
Performance Highlights advertising rate hikes will help HTML post higher Margins during
FY2010-12E. Hence, we have revised our Earnings estimates
For 4QFY2010, HT Media (HTML) reported an advertising
by 6-7% to factor in the increased revenue traction from new
growth of 8% yoy, circulation growth of 5% yoy and overall
businesses, higher Margins and lower Interest Expenses (Net
revenue growth of 10.7% yoy to Rs374.3cr, on a consolidated
Debt reduced to Rs5cr as on March, 2010).
basis. However, Earnings registered a multi-fold growth to
Rs48cr, driven by strong operating performance and a low base. At Rs151, HTML is trading at 16.5x FY2012E revised
We have revised our Top-line estimates by 4-6% to factor in the consolidated EPS of Rs9.1. Owing to a significant improvement
revenue traction from Burda JV, and have revised our Earnings in the profitability of its growing businesses, potential value
estimates by 6-7% to factor in the increased revenue traction unlocking through the listing of its Hindi business (IPO likely in
from new businesses, higher Margins and lower Interest up-tick
~2-3 months) and an up-tick in advertising revenues, we
Expenses. Buy, Target Price
maintain a Buy, with a revised Target Price of Rs182 (Rs170)
based on 20x P/E multiple to FY2012E Earnings.
Stellar Earnings performance, aided by Hindi and New
businesses: For 4QFY2010, HTML posted strong Earnings of Downside risks to our estimates include: 1) sharp rise in
Rs48cr (Rs7.6cr) and Margin expansion of 1,578bp to 21.9% newsprint prices, 2) weak recovery in English Print markets,
(6.1%), on the back of a low base, significant cost efficiencies and 3) Higher-than-expected losses or re-investment in growing
and improved revenue traction in new businesses. The Top-line businesses (Radio, Mint and Internet).
grew by 10.7% yoy to Rs374.3cr (Rs338.1cr) on a consolidated
basis, largely aided by a 5% yoy rise in circulation revenue to
Rs42.9cr (Hindustan contributed to ~Rs30cr) and an 8% yoy
growth in advertising revenue to Rs301.7cr (Hindustan
contributed ~Rs112cr). The Radio business witnessed substantial
revenue traction and registered a growth of 77.3% yoy in
revenue to Rs13.5cr (Rs7.6cr), and the Burda JV contributed
Rs4.6cr in the Top-line this quarter. Key Financials (Consolidated)
Outlook and Valuation Y/E March (Rs cr) FY2009 FY2010E FY2011E FY2012E
Net Sales 1,347 1,413 1,668 1,906
We have revised our Top-line estimates by 4-6%, to factor in
% chg 11.9 4.9 18.0 14.3
the revenue traction from the Burda JV (commenced operations
this quarter, modeling in a Top-line of ~Rs65cr and ~Rs95cr Profit
Net Profit (Adj) 20.0 143.5 178.1 214.4
in FY2011E and FY2012E, respectively), and a steady revenue % chg (80.3) 617.4 24.1 20.4
growth from the Radio business. We believe that an up-tick in OPM (%) 6.5 18.1 19.0 19.4
activities from sectors like Real Estate, BFSI and Auto, coupled
EPS (Rs) 0.9 6.1 7.6 9.1
with a low base and ad-rate hikes, will boost advertising in
FY2011E. P/E (x) 176.4 24.7 19.9 16.5
P/BV (x) 4.2 3.6 3.1 2.6
In terms of operating performance, HTML has shown resilience
in its new businesses this quarter (Radio business and Burda JV RoE (%) 2.4 14.7 15.1 15.7
became EBITDA positive). Moreover, a benign newsprint RoCE (%) 1.5 13.9 16.5 17.8
environment (factoring in ~10% rise during FY2010-12E), EV/Sales (x) 2.8 2.6 2.2 1.8
reduction of losses in its subsidiaries (Radio already EBITDA
EV/EBITDA (x) 43.6 14.6 11.4 9.4
positive, Internet losses to be capped at ~Rs30cr) and
Source: Company, Angel Research, Price as on May 11, 2010
Research Analyst - Anand Shah/Chitrangda Kapur
For Private Circulation Only | Angel Broking Ltd: BSE Sebi Regn No : INB 010996539 / CDSL Regn No: IN - DP - CDSL - 234 - 2004 / PMS Regn Code: PM/INP00000154 6 Angel Securities Ltd:BSE: INB010994639/INF010994639 NSE: INB230994635/INF230994635 Membership numbers: BSE 028/NSE:09946 6
7. Fundamental Focus | May 15, 2010
Focus
Jain Irrigation Systems - Accumulate Price - Rs949
Target Price - Rs1,062
Target Price - Rs356
4QFY2010 Result Update
Performance Highlights EBITDA (against 9% last year).
Jain Irrigation Systems (JISL)'s 4QFY2010 sales growth of 37% The PVC division grew by 27% and increased its contribution
yoy and Adj. PAT growth of 40% yoy was ahead of our estimates. to the total EBITDA by 100bp to 8% in FY2010.
The EBITDA Margin came in a tad bit lower at 20.7%, as against
The Onion Division's performance was muted, due to higher
22.5% in 4QFY2009. Higher costs in the onion Segment resulted
raw material prices (supply crunch, on account of drought)
in the lower EBITDA Margin. The company's current order book
stands at Rs1,000cr. We have marginally revised our FY2012E Outlook and Valuation
estimates downwards on account of a minimal contribution from We believe that, going ahead, the MIS Segment will register
subsidiaries to the net profit during FY2010. healthy growth as the government's focus on agriculture
Profit growth led by robust performance in Micro Irrigation continues. We expect the Segment to continue to grow between
System segment: JISL's 4QFY2010 results were ahead of our 30-40% over the next two years. In the case of the PVC Pipes
expectations, on account of the better growth in the MIS division. Segment, a revival in demand is visible. The Agro Products
The key Revenue and EBITDA contributing MIS Segment showed Segment and the Onion and Fruit businesses will continue to
a robust growth of 46% during the quarter. The PVC Pipes witness growth, and register stable Margins. However, at Rs949,
Segment posted a strong growth of 25% in 4QFY2010, on the the stock is trading at 18x FY2012E FDEPS, which is near its
back of robust growth across various markets. The Agro Products fair value, we recommend Accumulate on the stock.
,
Division was impacted by higher Raw Material (Onion) prices;
however, this was buttressed by a volume growth of 52% in the
Onion and a 116% growth in the Fruits division. The reported
PAT increased eight-fold to Rs117cr. However, after adjusting
for forex gains, the adj. PAT for the quarter grew by 40% yoy to
Rs89cr (against Rs64cr during the same quarter last year), due
to slower growth in interest (3% yoy) and a 60% yoy growth in
the other income. Key Financials (Consolidated)
Key highlights of FY2010 (Standalone) Y/E March (Rs cr) FY2009 FY2010E FY2011E FY2012E
The total revenue increased by 25% on the back of strong Net Sales 2,858 3,536 4,478 5,641
growth registered in key divisions like MIS (37%), PVC pipes % chg 29.0 23.7 26.7 26.0
(27%) and Fruits (30%). Profit
Adj. Net Profit 146 204 286 404
The company was able to maintain its EBITDA margin, due % chg 6.5 40.1 39.9 41.3
to a high contribution from the rich margin MIS division and EBITDA Margin (%) 17.6 17.8 17.5 17.5
low volatility in key raw material prices.
FDEPS (Rs) 20.1 26.9 37.6 53.1
The Total Adj. PAT grew by 25.1%, to Rs216cr from Rs173cr P/E (x) 47.1 35.3 25.3 17.9
in FY2009.
P/BV (x) 8.1 6.3 5.2 4.1
The MIS division maintained its dominance and momentum
RoE (%) 16.5 20.0 22.5 25.8
by growing at 37% for the year. It also increased its contribution
RoACE (%) 17.1 17.7 19.3 22.4
to total EBITDA from 62% in FY2009 to 71% in FY2010, on the
back of higher margins, which came in at 31.5% (29.8%). EV/Sales (x) 3.0 2.5 2.0 1.6
EV/EBITDA (x) 17.0 14.2 11.5 9.1
The Fruits sub-division (of agro) was the second-best
Source: Company, Angel Research, Price as on May 12, 2010
performer, growing at 30% and contributing 10% to the total
Research Analyst - Sageraj Bariya
For Private Circulation Only | Angel Broking Ltd: BSE Sebi Regn No : INB 010996539 / CDSL Regn No: IN - DP - CDSL - 234 - 2004 / PMS Regn Code: PM/INP00000154 6 Angel Securities Ltd:BSE: INB010994639/INF010994639 NSE: INB230994635/INF230994635 Membership numbers: BSE 028/NSE:09946 7
8. Fundamental Focus | May 15, 2010
Focus
NIIT Limited - Buy Price - Rs67
Target Price - Rs83
4QFY2010 Result Update
Target Price - Rs356
Performance Highlights performance going ahead. In CLS the company aims to deliver
strong volume backed growth in FY2011 through improved
NIIT declared lower-than-expected results for 4QFY2010
products mix and focusing on high margin Learning Products
registering a 1.9% decline in consolidated Net Revenues to
businesses, which has subscription based modules. New
Rs295cr. Bottom-line however, witnessed a spurt of 40.2% yoy
Businesses are expected to recover going ahead on the back of
for the quarter on a consolidated basis marking strong
strong hiring plans by Banks and Insurance companies and
performance for the quarter. Excluding the share of profits from
executive management education, which is expected to gain
associates, Net Income grew 49% on account of the 400bp
momentum would drive Imperia business. Apart from new
jump in EBIDTA Margins. Profitability improved on better product
businesses the growth in ILS is expected to be driven by strong
mix and improved scale in the ILS and CLS Segments exhibiting
IMS enrollments, better product mix and leverage on the recent
strong recovery in job prospects and strong demand revival
tie-up with SAP and IBM. The company is targeting strong
across industries in Corporate Training.
volume backed growth both in Revenues and Profits for
Top-line pressure mitigated by excellent Margin expansion:
op-line FY2011E.
NIIT registered Top-line de-growth of 1.9% yoy in 4QFY2010
Going ahead, we expect NIIT to clock CAGR of 10.3% and 16.6%
as the School Learning Services (SLS) and the Corporate
in Top-line and Bottom-line respectively, over FY2010-12E. At
Learning Services (CLS) businesses remained laggards during
current levels, the stock is trading at 11.6x FY2012E EPS. Based
the quarter, witnessing 27.4% yoy and 5.9% yoy de-growth,
SOTP methodology,
on the SOTP methodology, we have valued NIIT excluding its
respectively. The only outperformer was the Individual Learning
Tech
stake in NIIT Tech at 12x FY2012E EPS of Rs5.8 fetching Rs69.6/
Solutions (ILS) Business, which grew 13.9% yoy backed by 10.5%
We
share. We have valued the company's stake in NIIT Tech atTech
and 84% yoy growth in ILS-IT and ILS-FMT, respectively. The
Rs13/share (on market capitalisation) after providing 25%
company added 101 Non-Government/Private Schools in the
holding company discount, effectively resulting in an SOTP SOTP
ICT Segment during the quarter taking the total schools serviced
Price
Target Price of Rs83. Hence, we recommend a Buy on the
to 15,000 as on 4QFY2010 v/s 12,622 in 3QFY2010. NIIT
stock.
recorded an impressive 400bp yoy expansion in EBITDA Margins
backed by the 500bp, 370bp and 360bp yoy expansion in Key Financials (Consolidated)
SLS, CLS and ILS business segments respectively, which boosted
Y/E March (Rs cr) FY2009 FY2010E FY2011E FY2012E
Bottom-line by 40% yoy during the quarter despite higher forex
Net Sales 1,149 1,199 1,318 1,459
losses and tax costs incurred.
% chg 14.1 4.4 9.9 10.7
Outlook and Valuation
Profit
Net Profit 70 70 83 95
NIIT aims to drive growth in the SLS Segment through its content-
% chg (7.8) 0.6 18.1 15.2
led strong initiatives in Private schools related offerings, viz. E-
Guru portfolio and Math Labs solutions. In this Segment, the FDEPS (Rs) 4.2 4.3 5.0 5.8
company is currently increasing spend on the marketing and EBITDA Margin (%) 10.3 13.1 13.7 14.1
sales fronts to tap future opportunities in Tier II and III cities. P/E (x) 16.0 15.8 13.4 11.6
The company incurred capex of around Rs95cr in FY2010 and
P/BV (x) 2.3 2.1 1.9 1.7
plans to incur around Rs 90cr for FY2011E mainly on school
RoE (%) 15.9 14.1 15.1 15.8
projects. The company also sees strong assured annuity
revenues from product roll outs for private schools. The IP-led RoCE (%) 9.1 11.1 11.5 12.1
revenues for FY2010 witnessed 12.3% yoy growth. Thus, EV/Sales (x) 1.1 1.1 1.0 0.9
non-linear revenues, viz. the strong annuity and IP-led revenues EV/EBITDA (x) 10.8 8.6 7.4 6.4
are expected to contribute to the company's operational Source: Company, Angel Research, Price as on May 13, 2010
Research Analyst - Rahul Jain/Vibha Salvi
For Private Circulation Only | Angel Broking Ltd: BSE Sebi Regn No : INB 010996539 / CDSL Regn No: IN - DP - CDSL - 234 - 2004 / PMS Regn Code: PM/INP00000154 6 Angel Securities Ltd:BSE: INB010994639/INF010994639 NSE: INB230994635/INF230994635 Membership numbers: BSE 028/NSE:09946 8
9. Fundamental Focus | May 15, 2010
Focus
Thermax - Buy Price - Rs674
Target Price - Rs747
4QFY2010 Result Update
Target Price - Rs356
Performance Highlights Outlook and Valuation
Thermax reported a decent 4QFY2010 performance, with a We had always expected FY2010 to be a trough year for the
6.7% yoy growth in its adjusted bottom-line to Rs99cr, which company, with a strong bounce-back happening in FY2011,
was slightly above our estimates. The company has a healthy on the back of the rebound in the domestic economy. During
order book of Rs5,966cr, which imparts strong revenue visibility FY2010-12E, we expect the company to post a top-line and
over the ensuing years. bottom-line CAGR of 30.3% and 31.1%, respectively. Besides,
the company's entry into the utility boilers space has imparted it
top-line
Strong top-line growth; Operating margin compression leads
with a greater revenue visibility, reducing the high cyclicality
to muted bottom-line: Thermax posted a strong 28.6% yoy
associated with its earnings.
growth in its top-line to Rs1,219cr (Rs948cr) for 4QFY2010,
driven by better-than-expected execution of the order book. At the current price, the stock is quoting at 22.7x and 18.0x
The environment segment put up an impressive show, registering FY2011E and FY2012E EPS, respectively. Against the backdrop
a 71.9% yoy growth in its revenues. For the full year FY2010, of a strong order book, entry into the utility boilers market, a
however, the top-line de-grew 2.4% yoy to Rs3,185cr healthy balance sheet and the strong management team, we
(Rs3,264cr). Target
maintain our Buy recommendation on the stock, with a Target
Price of Rs747.
On the operating front, the company reported a 203bp
compression in its EBITDA margin to 12.0% (14.1%) possibly
due to the higher contribution of large EPC projects. The raw
material cost increased 187bp to 66.6% (64.7%) of the net
sales. On a segmental basis, the energy segment witnessed a
slight margin expansion of 38bp, as against a 475bp margin
compression for the environment segment.
The lower margins, coupled with a higher tax rate (35.6% for
4QFY2010 v/s 30.3% for 4QFY2009), led to a muted 6.7%
Key Financials (Consolidated)
growth in the adjusted net profit to Rs99cr (Rs93cr). For FY2010,
Y/E March (Rs cr) FY2009 FY2010E FY2011E FY2012E
the adjusted bottom-line de-grew 10.4% yoy to Rs256cr
(Rs286cr). Net Sales 3,460 3,370 4,539 5,720
% chg (0.6) (2.6) 34.7 26.0
Order Book
Profit
Adj. Net Profit 288 259 354 445
Although the difficulties faced during the economic slowdown
% chg (0.4) (9.9) 36.5 25.9
affected the headline numbers for FY2010, order inflows
witnessed a strong momentum during the year. The consolidated EBITDA (%) 12.2 11.8 11.5 11.5
order inflow for 4QFY2010 was up 152.0% yoy to Rs1,464cr EPS (Rs) 24.1 21.8 29.7 37.4
(Energy: Rs1,100cr, Environment: Rs364cr). For the full year P/E (x) 27.9 31.0 22.7 18.0
FY2010 too, the consolidated order inflow grew around 70%.
P/BV (x) 8.1 7.5 6.1 4.8
The consolidated order backlog stood at Rs5,966cr (Energy:
Rs5,138cr, Environment: Rs827cr), up 93.8% yoy. RoE (%) 32.9 25.2 29.6 29.7
RoCE (%) 34.6 26.6 31.2 31.3
Notably, Thermax recently bagged a major order worth Rs580cr
from an Indian petrochemical major, for a gas-based combined EV/Sales (x) 2.2 2.2 1.6 1.2
cycle power plant. Besides, the management continues to witness EV/EBITDA (x) 17.9 18.6 13.7 10.5
better traction in orders across most industries including metals, Source: Company, Angel Research, Price as on May 13, 2010
cement, power, chemicals and food processing etc.
Research Analyst - Puneet Bambha
For Private Circulation Only | Angel Broking Ltd: BSE Sebi Regn No : INB 010996539 / CDSL Regn No: IN - DP - CDSL - 234 - 2004 / PMS Regn Code: PM/INP00000154 6 Angel Securities Ltd:BSE: INB010994639/INF010994639 NSE: INB230994635/INF230994635 Membership numbers: BSE 028/NSE:09946 9
10. Technical Picks | May 15, 2010
Markets range bound - Undertone still bearish
Sensex (16995) / Nifty (5094) Future Outlook
In our previous Weekly report, considering the 61.8% Broadly speaking the undertone remains bearish as the Daily
retracement of the preceding up move from 16153 to 18048 / chart is maintaining a lower-top lower-bottom formation. The
4675 to 5400 levels and prices close to the 200-day SMA, we Weekly chart suggests that the upward sloping trend-line,
had mentioned that in the initial part of the week we may witness combined with the Harami pattern, may provide near term
a bounce up to 17050 - 17200 / 5100 - 5150 levels. The support. Any close below 16684 / 4984 levels would breach
week opened on a positive note and indices made a high of the trend-line support and intensify the selling pressure. Indices
17389 / 5213 levels after which they gradually declined to could then test 16200 - 16150 / 4850 - 4800 levels. On the
close at 16995 / 5094. flip side any reversal of the downtrend could be seen only
above17389 / 5213 levels.
The Sensex ended with a net gain of 1.3% whereas the Nifty
gained 1.5% vis-à-vis the previous week. Exhibit 1: Sensex Weekly chart
Pattern Formation
On the Daily chart, the intermediate trend is down and is en d-li
ne
g tr
pin
maintaining a lower-top lower-bottom formation. This formation Up
w ard
slo
would be violated if the indices trade and close above 17389 /
5213 levels.
On the Weekly chart, we are witnessing a candlestick pattern
that resembles a Harami (Bullish), which indicates that the
weekly downtrend might be losing strength.
Source: Falcon
On the Weekly chart, the upward sloping trend-line,
(currently at 16760 / 5015) joining the two significant lows of Exhibit 2: Sensex Daily chart
13220 / 15652 and 3919 / 4675, remains crucial support for
the market.
200 day SMA
Source: Falcon
For Private Circulation Only | Angel Broking Ltd: BSE Sebi Regn No : INB 010996539 / CDSL Regn No: IN - DP - CDSL - 234 - 2004 / PMS Regn Code: PM/INP00000154 6 Angel Securities Ltd:BSE: INB010994639/INF010994639 NSE: INB230994635/INF230994635 Membership numbers: BSE 028/NSE:09946 10