Call Girls In Yusuf Sarai Women Seeking Men 9654467111
Graphite india ru2 qfy2011-291010
1. Please refer to important disclosures at the end of this report 1
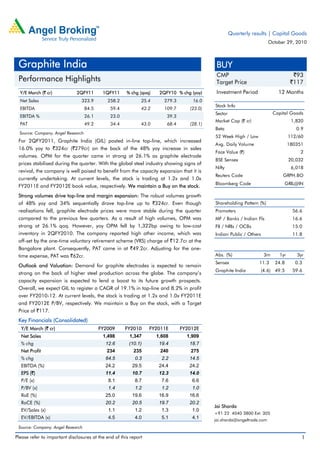
Y/E March (` cr) 2QFY11 1QFY11 % chg (qoq) 2QFY10 % chg (yoy)
Net Sales 323.9 258.2 25.4 279.3 16.0
EBITDA 84.5 59.4 42.2 109.7 (23.0)
EBITDA % 26.1 23.0 39.3
PAT 49.2 34.4 43.0 68.4 (28.1)
Source: Company, Angel Research
For 2QFY2011, Graphite India (GIL) posted in-line top-line, which increased
16.0% yoy to `324cr (`279cr) on the back of the 48% yoy increase in sales
volumes. OPM for the quarter came in strong at 26.1% as graphite electrode
prices stabilised during the quarter. With the global steel industry showing signs of
revival, the company is well poised to benefit from the capacity expansion that it is
currently undertaking. At current levels, the stock is trading at 1.2x and 1.0x
FY2011E and FY2012E book value, respectively. We maintain a Buy on the stock.
Strong volumes drive top-line and margin expansion: The robust volumes growth
of 48% yoy and 34% sequentially drove top-line up to `324cr. Even though
realisations fell, graphite electrode prices were more stable during the quarter
compared to the previous few quarters. As a result of high volumes, OPM was
strong at 26.1% qoq. However, yoy OPM fell by 1,322bp owing to low-cost
inventory in 2QFY2010. The company reported high other income, which was
off-set by the one-time voluntary retirement scheme (VRS) charge of `12.7cr at the
Bangalore plant. Consequently, PAT came in at `49.2cr. Adjusting for the one-
time expense, PAT was `62cr.
Outlook and Valuation: Demand for graphite electrodes is expected to remain
strong on the back of higher steel production across the globe. The company’s
capacity expansion is expected to lend a boost to its future growth prospects.
Overall, we expect GIL to register a CAGR of 19.1% in top-line and 8.2% in profit
over FY2010-12. At current levels, the stock is trading at 1.2x and 1.0x FY2011E
and FY2012E P/BV, respectively. We maintain a Buy on the stock, with a Target
Price of `117.
Key Financials (Consolidated)
Y/E March (` cr) FY2009 FY2010 FY2011E FY2012E
Net Sales 1,498 1,347 1,608 1,909
% chg 12.6 (10.1) 19.4 18.7
Net Profit 234 235 240 275
% chg 64.5 0.3 2.2 14.5
EBITDA (%) 24.2 29.5 24.4 24.2
EPS (`) 11.4 10.7 12.3 14.0
P/E (x) 8.1 8.7 7.6 6.6
P/BV (x) 1.4 1.2 1.2 1.0
RoE (%) 25.0 19.6 16.9 16.6
RoCE (%) 20.2 20.5 19.7 20.2
EV/Sales (x) 1.1 1.2 1.3 1.0
EV/EBITDA (x) 4.5 4.0 5.1 4.1
Source: Company, Angel Research
BUY
CMP `93
Target Price `117
Investment Period 12 Months
Stock Info
Sector
Bloomberg Code GRIL@IN
Shareholding Pattern (%)
Promoters 56.6
MF / Banks / Indian Fls 16.6
FII / NRIs / OCBs 15.0
Indian Public / Others 11.8
Abs. (%) 3m 1yr 3yr
Sensex 11.3 24.8 0.3
Graphite India (4.6) 49.5 59.6
Face Value (`)
BSE Sensex
Nifty
Reuters Code
Capital Goods
Avg. Daily Volume
Market Cap (` cr)
Beta
52 Week High / Low
2
20,032
6,018
GRPH.BO
1,820
0.9
112/60
180351
Jai Sharda
+91 22 4040 3800 Ext: 305
jai.sharda@angeltrade.com
Graphite India
Performance Highlights
Quarterly results | Capital Goods
October 29, 2010
2. Graphite India | 2QFY2011 Result Update
October 29, 2010 2
Exhibit 1: 2QFY2011 Performance
Y/E March (` cr) 2QFY2011 1QFY2010 % chg (qoq) 2QFY2010 % chg (yoy) FY2010 FY2009 % chg
Net Sales 324 258 25.4 279 16.0 1,131 1,126 0.5
Consumption of RM 160 127 25.8 109 45.9 417 381 9.6
(% of Sales) 49.3 49.1 39.2 36.9 33.8
Staff Costs 19 19 - 17 11.3 74 75 (0.9)
(% of Sales) 6.0 7.5 6.2 6.6 6.7
Other Expenses 61 53 14.8 43 41.5 261 438 (40.4)
(% of Sales) 18.7 20.4 15.3 23.1 38.9
Total Expenditure 239 199 20.4 170 41.2 752 894 (15.8)
Operating Profit 84 59 42.2 110 (23.0) 379 232 63.1
OPM 26.1 23.0 39.3 33.5 20.6
Interest 1 1 63.5 3 (72.2) 10 26 (59.6)
Depreciation 10 10 - 10 1.2 40 34 15.1
Other Income 14 3 374.0 7 104.0 31 29 5.8
PBT (excl. Extr. Items) 87 52 68.3 104 (15.7) 359 201 79.0
Extr. Income/(Expense) (13) - - - -
PBT (incl. Extr. Items) 75 52 43.8 104 (27.9) 359 201 79.0
(% of Sales) 23.1 20.1 37.1 31.8 17.8
Provision for Taxation 26 18 45.4 35 (27.7) 127 7 1,670.1
(% of PBT) 34.1 33.8 - 35.4 3.6
Reported PAT 49 34 43.0 68 (28.1) 232 194 19.9
PATM 15.2 13.3 24.5 20.5 17.2
Equity shares (cr) 19.5 17.4 17.1 19.5 15.1
EPS (`) 2.5 2.0 27.3 4.0 (37.1) 13.6 12.6 8.2
Adjusted PAT 62 34 80.1 68 - 232 194 19.9
Source: Company, Angel Research
Segment-wise performance
The graphite and carbon segment reported a 19.2% increase in top-line to `275cr,
mainly on higher graphite electrode volumes. EBIT margins came in at 19.6% for
the quarter, compared to 38.3% in 2QFY2010. Notably, the company had the
benefit of low inventory costs during 2QFY2010.
The power segment revenues jumped 64.1% yoy to `8.4cr, while EBIT came in at
`7.6cr, implying EBIT margins of 91.0%. The steel segment showed strong increase
in sales, registering a yoy growth of 54.2% to `23.0cr (`14.9cr). The division
posted EBIT of `0.2cr v/s a loss of `2.7cr in 2QFY2010.
Sales of Others division declined 21.8% yoy to `28.1cr (`36.0cr). The division
recorded EBIT of `8.0cr, implying EBIT margin of 28.6%.
3. Graphite India | 2QFY2011 Result Update
October 29, 2010 3
Exhibit 2: Segment wise performance
Y/E March (` cr) 2QFY11 1QFY11 2QFY10 % chg (qoq) % chg (yoy)
Total Revenue
A) Graphite & Carbon 275 212 230 29.7 19.2
B) Power 8 7 5 23.9 64.1
C) Steel 23 22 15 4.5 54.2
D) Others 28 25 36 10.4 (21.8)
Total 334 266 286 25.6 16.7
Less: Inter-Segmental Revenue 10 8 7 32.7 44.4
Net Sales 324 258 279 25.4 16.0
EBIT Margin (%)
A) Graphite & Carbon 19.6 22.3 38.3 (267bp) (1868bp)
B) Power 91.0 57.2 102.0 3,373bp (1,100bp)
C) Steel 0.7 13.2 (18.2) (1,254bp) 1,883bp
D) Others 28.6 22.7 44.8 593bp (1,625bp)
Source: Company, Angel Research
Sales growth in line with expectations
Sales for 2QFY2011 came in at `324cr (`279cr), a yoy growth of 16.0%. On a
qoq basis, sales surged 25.4%.
Exhibit 3: Sales trend
Source: Company, Angel Research
OPM increases sequentially, but falls yoy
The company reported a jump in OPM qoq, increasing from 23.0% in 1QFY2011
to 26.1% in 2QFY2011. However, it fell from 39.3% registered in 2QFY2010. This
sequential increase in margins has come after three continuous declines qoq.
(60.0)
(40.0)
(20.0)
0.0
20.0
40.0
60.0
80.0
0
50
100
150
200
250
300
350
400
3QFY09
4QFY09
1QFY10
2QFY10
3QFY10
4QFY10
1QFY11
2QFY11
%
`cr
Sales (LHS) yoy Growth (RHS)
4. Graphite India | 2QFY2011 Result Update
October 29, 2010 4
Exhibit 4: Margin trend
Source: Company, Angel Research
PAT increases qoq on higher margins
The company reported PAT of `49cr, which was 43.0% higher qoq, but 28.1%
lower yoy. The main reason for the sequential increase in PAT was higher sales
and OPM. Net profit had registered a consistent decline since 2QFY2010 till
1QFY2011. However, this trend was broken in 2QFY2011.
Exhibit 5: PAT trend
Source: Company, Angel Research
Management call – Key takeaways
Capacity expansion by 20,000MT at the Durgapur plant is on schedule and is
expected to get completed by 3QFY2012, while the 50MW power plant is
expected to be completed by 4QFY2012.
To optimise costs at the Bangalore plant the company is implementing the
voluntary retirement scheme. The scheme cost the company `12.7cr during
2QFY2011, but is expected to save approximately `6.0cr annually.
Average capacity utilisation at the company’s plants was 78.0% in 2QFY2011,
compared to 40.0% in 2QFY2010 and 60.0% in 1QFY2011.
0.0
5.0
10.0
15.0
20.0
25.0
30.0
35.0
40.0
45.0
0
20
40
60
80
100
120
3QFY09
4QFY09
1QFY10
2QFY10
3QFY10
4QFY10
1QFY11
2QFY11
%
`cr
EBITDA (LHS) OPM (RHS)
0
10
20
30
40
50
60
70
80
90
3QFY09
4QFY09
1QFY10
2QFY10
3QFY10
4QFY10
1QFY11
2QFY11
`cr
5. Graphite India | 2QFY2011 Result Update
October 29, 2010 5
The steel segment witnessed strong demand on both the domestic and export
front.
The company is fully covered for the needle coke requirements for FY2011.
Investment Arguments
GIL set to ride industry rebound: The graphite electrodes industry is expected to
grow faster, compared to EAF steel production over the next few years, as the de-
stocking of graphite electrodes inventory on steel manufacturers' end, is expected
to reverse. Consequently, we expect graphite electrodes volumes to register 17.2%
CAGR over CY2009-11. GIL, with capacity expansion from 78,000mt/year to
98,000mt/year, to be completed by FY2012E, is well poised to reap the benefits of
this growth. We expect GIL’s market share to increase to 9.0% by FY2012 and top-
line to post 19.1% CAGR over FY2010-12 on the back of this expansion.
Strong labour cost advantage: GIL has strong labour cost advantages compared to
its global peers, as the other companies have their plants in locations where
labour costs are significantly higher compared to India. The largest global player,
SGL Carbon SE, has plants located mainly across Europe and North America.
GrafTech Ltd, world’s second largest player, has plants located in France, Spain,
South Africa, Brazil and Mexico. In FY2009, GIL's dmployee cost was 9% of sales,
whereas it was almost 23% (CY2008) for SGL. Historically, GIL has passed on a
part of this advantage to gain market share. But, with market share addition
expected to slow down, we expect GIL to retain a large part of this cost advantage
and in turn improve its margins over historical average levels.
Strong entry barriers: The global graphite electrodes industry is characterised by
high level of consolidation, with the top-6 players accounting for over 70% of the
total installed capacity in the world. The balance capacity is owned by motley of
small players. The highly consolidated nature of the industry is owing to the
barriers for the new entrants. For instance, only the top global players have the
technology to manufacture high-quality ultra high power (UHP) graphite
electrodes. The industry is marked by a relationship and referral based model. A
new entrant has to prove the quality of its products by supplying to a steel
manufacturer and then get referral and word-of-mouth publicity for the products
from the manufacturer. Another barrier for the new as well as some of the existing
players is the high cost of setting up a green-field graphite electrodes
manufacturing facility.
Outlook and Valuation
We maintain our positive stance on GIL on account of revival in the global steel
production industry. Global steel production for 9MCY2010 increased 20.3% to
1,046 million MT from 869 million MT in CY2009. Accordingly, graphite
electrode volumes have also shown substantial improvement. GIL reported a
48.0% increase in volumes yoy in 2QFY2011. We expect sales to increase at a
CAGR of 19.1% yoy over FY2010-12. OPMs are expected to remain high at 24.4%
in FY2011 and 24.2% in FY2012. PAT is expected to register a CAGR of 8.1% over
FY2010-12. We expect the company to post an EPS of `12.3 in FY2011 and `14.0
in FY2012.
6. Graphite India | 2QFY2011 Result Update
October 29, 2010 6
At current levels, the stock is trading at 1.2x and 1.0x FY2011E and FY2012E book
value, respectively. We maintain a Buy on the stock, with a Target Price of `117.
Exhibit 6: 2QFY2011 performance: Actual v/s estimated
Actual Estimated Difference (%)
Sales (` cr) 323.9 333.6 (2.9)
EBITDA (` cr) 84.5 83.4 1.3
OPM (%) 26.1 25.0 110bp
PAT (` cr) 49.2 47.8 2.8
Source: Company, Angel Research
Exhibit 7: One-year forward P/BV
Source: Company, Bloomberg, Angel Research
Exhibit 8: Key assumptions
FY2011E FY2012E Remarks
World EAF steel production (mn MT) 393.2 417.4 Strengthening production due to global demand recovery
World graphite electrode production (MT) 695,637 723,709 Volume to improve on the back of improving steel volumes
GIL Volumes (MT) 57,329 65,471 Capacity expansino to result in improved market share
OPM (%) 24.4 24.2 OPM to remain high as realisations improve
Source: Angel Research
0
20
40
60
80
100
120
140
Apr-02
Sep-02
Feb-03
Jul-03
Dec-03
May-04
Oct-04
Mar-05
Aug-05
Jan-06
Jun-06
Nov-06
Apr-07
Sep-07
Feb-08
Jul-08
Dec-08
May-09
Oct-09
Mar-10
Aug-10
SharePrice(`)
Price 0.2x 0.5x 0.8x 1.1x 1.5x
11. Graphite India | 2QFY2011 Result Update
October 29, 2010 11
Research Team Tel: 022 - 4040 3800 E-mail: research@angeltrade.com Website: www.angeltrade.com
DISCLAIMER
This document is solely for the personal information of the recipient, and must not be singularly used as the basis of any investment
decision. Nothing in this document should be construed as investment or financial advice. Each recipient of this document should make
such investigations as they deem necessary to arrive at an independent evaluation of an investment in the securities of the companies
referred to in this document (including the merits and risks involved), and should consult their own advisors to determine the merits and
risks of such an investment.
Angel Broking Limited, its affiliates, directors, its proprietary trading and investment businesses may, from time to time, make
investment decisions that are inconsistent with or contradictory to the recommendations expressed herein. The views contained in this
document are those of the analyst, and the company may or may not subscribe to all the views expressed within.
Reports based on technical and derivative analysis center on studying charts of a stock's price movement, outstanding positions and
trading volume, as opposed to focusing on a company's fundamentals and, as such, may not match with a report on a company's
fundamentals.
The information in this document has been printed on the basis of publicly available information, internal data and other reliable
sources believed to be true, but we do not represent that it is accurate or complete and it should not be relied on as such, as this
document is for general guidance only. Angel Broking Limited or any of its affiliates/ group companies shall not be in any way
responsible for any loss or damage that may arise to any person from any inadvertent error in the information contained in this report.
Angel Broking Limited has not independently verified all the information contained within this document. Accordingly, we cannot testify,
nor make any representation or warranty, express or implied, to the accuracy, contents or data contained within this document. While
Angel Broking Limited endeavours to update on a reasonable basis the information discussed in this material, there may be regulatory,
compliance, or other reasons that prevent us from doing so.
This document is being supplied to you solely for your information, and its contents, information or data may not be reproduced,
redistributed or passed on, directly or indirectly.
Angel Broking Limited and its affiliates may seek to provide or have engaged in providing corporate finance, investment banking or
other advisory services in a merger or specific transaction to the companies referred to in this report, as on the date of this report or in
the past.
Neither Angel Broking Limited, nor its directors, employees or affiliates shall be liable for any loss or damage that may arise from or in
connection with the use of this information.
Note: Please refer to the important `Stock Holding Disclosure' report on the Angel website (Research Section). Also, please
refer to the latest update on respective stocks for the disclosure status in respect of those stocks. Angel Broking Limited and
its affiliates may have investment positions in the stocks recommended in this report.
Disclosure of Interest Statement Graphite India
1. Analyst ownership of the stock No
2. Angel and its Group companies ownership of the stock No
3. Angel and its Group companies' Directors ownership of the stock No
4. Broking relationship with company covered No
Ratings (Returns): Buy (> 15%) Accumulate (5% to 15%) Neutral (-5 to 5%)
Reduce (-5% to 15%) Sell (< -15%)
Note: We have not considered any Exposure below Rs 1 lakh for Angel, its Group companies and Directors