1. Weekly Review
April 24, 2010
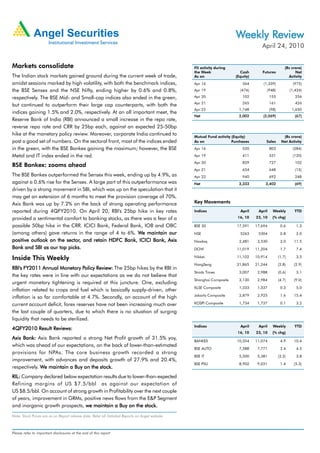
Markets consolidate FII activity during (Rs crore)
the Week Cash Futures Net
The Indian stock markets gained ground during the current week of trade, As on (Equity) Activity
amidst sessions marked by high volatility, with both the benchmark indices, Apr 16 364 (1,339) (975)
the BSE Sensex and the NSE Nifty, ending higher by 0.6% and 0.8%, Apr 19 (476) (948) (1,424)
respectively. The BSE Mid- and Small-cap indices also ended in the green, Apr 20 102 155 256
Apr 21 265 161 426
but continued to outperform their large cap counterparts, with both the
Apr 22 1,748 (98) 1,650
indices gaining 1.5% and 2.0%, respectively. At an all important meet, the
Net 2,002 (2,069) (67)
Reserve Bank of India (RBI) announced a small increase in the repo rate,
reverse repo rate and CRR by 25bp each, against an expected 25-50bp
hike at the monetary policy review. Moreover, corporate India continued to Mutual Fund activity (Equity) (Rs crore)
post a good set of numbers. On the sectoral front, most of the indices ended As on Purchases Sales Net Activity
in the green, with the BSE Bankex gaining the maximum; however, the BSE Apr 16 520 803 (284)
Metal and IT index ended in the red. Apr 19 411 531 (120)
Apr 20 829 727 102
BSE Bankex: zooms ahead
Apr 21 634 648 (15)
The BSE Bankex outperformed the Sensex this week, ending up by 4.9%, as Apr 22 940 692 248
against a 0.6% rise for the Sensex. A large part of this outperformance was Net 3,333 3,402 (69)
driven by a strong movement in SBI, which was up on the speculation that it
may get an extension of 6 months to meet the provision coverage of 70%.
Axis Bank was up by 7.2% on the back of strong operating performance Key Movements
reported during 4QFY2010. On April 20, RBI's 25bp hike in key rates Indices April April Weekly YTD
provided a sentimental comfort to banking stocks, as there was a fear of a 16, 10 23, 10 (% chg)
possible 50bp hike in the CRR. ICICI Bank, Federal Bank, IOB and OBC BSE 30 17,591 17,694 0.6 1.3
(among others) gave returns in the range of 4 to 6%. We maintain our NSE 5263 5304 0.8 2.0
sector,
positive outlook on the sector, and retain HDFC Bank, ICICI Bank, Axis Nasdaq 2,481 2,530 2.0 11.5
Bank and SBI as our top picks. DOW 11,019 11,204 1.7 7.4
Inside This Weekly Nikkei 11,102 10,914 (1.7) 3.5
HangSeng 21,865 21,244 (2.8) (2.9)
RBI's FY2011 Annual Monetary Policy Review: The 25bp hikes by the RBI in
Policy
Straits Times 3,007 2,988 (0.6) 3.1
the key rates were in line with our expectations as we do not believe that
Shanghai Composite 3,130 2,984 (4.7) (9.0)
urgent monetary tightening is required at this juncture. One, excluding
KLSE Composite 1,333 1,337 0.3 5.0
inflation related to crops and fuel which is basically supply-driven, other
Jakarta Composite 2,879 2,925 1.6 15.4
inflation is so far comfortable at 4.7%. Secondly, on account of the high
current account deficit, forex reserves have not been increasing much over KOSPI Composite 1,734 1,737 0.1 3.2
the last couple of quarters, due to which there is no situation of surging
liquidity that needs to be sterilized.
Indices April April Weekly YTD
4QFY2010 Result Reviews:
16, 10 23, 10 (% chg)
Axis Bank: Axis Bank reported a strong Net Profit growth of 31.5% yoy,
BANKEX 10,554 11,074 4.9 10.4
which was ahead of our expectations, on the back of lower-than-estimated
BSE AUTO 7,588 7,771 2.4 4.5
provisions for NPAs. The core business growth recorded a strong
BSE IT 5,500 5,381 (2.2) 3.8
improvement, with advances and deposits growth of 27.9% and 20.4%,
BSE PSU 8,902 9,031 1.4 (5.3)
respectively. We maintain a Buy on the stock.
RIL: Company declared below expectation results due to lower-than-expected
RIL:
Refining margins of US $7.5/bbl as against our expectation of
US $8.5/bbl. On account of strong growth in Profitability over the next couple
of years, improvement in GRMs, positive news flows from the E&P Segment
and inorganic growth prospects, we maintain a Buy on the stock.
Note: Stock Prices are as on Report release date; Refer all Detailed Reports on Angel website
Please refer to important disclosures at the end of this report
2. Fundamental Focus | April 24, 2010
Focus
RBI's FY2011 Annual Monetary Policy Review
Rate hikes in line with expectations
Key Highlights and CRR cumulatively for comparison purposes) as against just
a 75bp increase in the first twelve months of the previous cycle
Hikes Repo, Reverse Repo and CRR by 25 bp each to
from September 2004 to September 2005. We expect further
5.25%, 3.75% and 6.0%, respectively
hikes in each of the policy rates, which could be up to 150 bp
Announces indicative projections of 20% Credit Growth
on the Repo and Reverse Repo front and 100bp on the CRR
and 18% Deposit Growth during FY2011E
front by the next Annual policy. This would imply a 200bp of
Announces GDP Growth forecast of 8% for FY2011E
hikes in each of the policy rates within the first 14 months of
Places Baseline projection for WPI inflation at 5.5% for
this cycle. But this should be seen in the context of the above-
FY2011E
mentioned need for front-ending the tightening process as well
Allows banks to classify investments in infrastructure bonds
as the massive 400bp+ reduction in both the Repo rate and
under Held for Maturity (HTM) category
the CRR in the 15 months following the Lehman-crisis.
The 25bp hikes by the RBI in the Repo, Reverse Repo and CRR
Maintain positive outlook on the Banking sector, sector,
were in line with our expectations as we do not believe that
especially large banks: Given the pace of recovery in private
urgent monetary tightening is required at this juncture. One,
sector credit demand, liquidity has declined and the lending
excluding inflation related to crops and fuel which is basically
and deposit rates are likely to start rising going forward. For
supply-driven, other inflation is so far within comfortable levels
the Banking Sector as a whole, in our view, rising interest rates,
of about 4.7%. Secondly, on account of the high current account
consistent with the imminent revival in GDP growth, are not a
deficit, forex reserves have not been increasing much over the
negative and would be outweighed by an acceleration in Core
last couple of quarters, due to which there is no situation of
Earnings growth. That said, large banks with a strong CASA
surging liquidity that needs to be sterilized.
ratio and lower duration investment books will be relatively
Inflation becoming gradually more broad-based: Specifically, better placed in a rising interest rate environment.
on the inflation-front, although crop-related inflation remained
High CASA, Low Investment Key in rising rate scenario
the main cause of the high headline WPI number of 9.9% at (%) (Years)
the end of March 2010, contributing 65% of total inflation, this 60.0 7.0
50.0 6.0
was lower than the 70% contribution a month ago. Apart from 5.0
40.0
this, a 16.4% yoy increase in oil prices also contributed 11% to 30.0
4.0
total inflation. However, inflation is evidently becoming more
3.0
20.0
2.0
broad-based, with other product prices rising 4.7% yoy by March 10.0 1.0
2010 vs. 3.6% yoy by February 2010, increasing their - -
OBC
BOI
IOB
ICICIBK
BOB
INDBK
HDFCBK
UNBK
SBI
SIB
DENBK
AXSB
PNB
CRPBK
FEDBK
contribution to overall inflation from 18% to 24%.
Casa Ratio (LHS) Invt/Deposit ratio (LHS) Invt duration (RHS)
M3 Growth could accelerate further: Moreover, although growth Source: Company, Angel Research
in money supply is sedate at present, it is expected to increase
Accordingly, we maintain our preference for the large private
going forward, given that domestic credit demand is reviving
banks viz., HDFC Bank, ICICI Bank and Axis Bank as well as
and is expected to reach 20%+ yoy growth in FY2011E even
SBI in the PSU space, all of which we believe are very well-
as the large government borrowing for FY2011E is set to resume
positioned for the revival in GDP growth due to large capital
in the coming first half of FY2011E.
adequacy, substantial network expansion and superior customer
Hence, front - ended rate hikes to anchor inflationary
front- proposition that is expected to drive increase in Credit, CASA
expectations: RBI will therefore remain alert for any increase in and Fee marketshare, leading to superior earnings growth over
inflationary pressures so as to anchor inflationary expectations. FY2011-12E.
Already, policy rates are up 200bp in the first two months of
the current monetary tightening cycle (taking Repo, Reverse Repo
Research Analyst - Vaibhav Agrawal/Amit Rane
For Private Circulation Only | Angel Broking Ltd: BSE Sebi Regn No : INB 010996539 / CDSL Regn No: IN - DP - CDSL - 234 - 2004 / PMS Regn Code: PM/INP00000154 6 Angel Securities Ltd:BSE: INB010994639/INF010994639 NSE: INB230994635/INF230994635 Membership numbers: BSE 028/NSE:09946 2
3. Fundamental Focus | April 24, 2010
Focus
Cement Sector
Monthly Update - March 2010
Southern Surge Outlook
All-India cement despatches up 8.3% yoy in March 2010: The The Indian Cement companies have been reporting strong
Cement despatches were up by a healthy 8.3% yoy in March Volume sales since the past few months. The additional capacity
2010, with the southern region leading the way with a 10.1% that has come on stream has enabled most of the cement
yoy growth. The impressive performance in the southern region
manufacturers to increase the total cement production. We
was on account of a good pickup in demand, aided by the
expect the all-India demand to continue to remain robust, but
increased demand from the infrastructure segment. The
accelerated capacity additions and stablisation of new capacities
Northern and western regions also clocked robust growth rates
are expected to put pressure on prices after May 2010. The
of 8.8% and 8.9%, respectively.
cement prices rose across India in March 2010, except in the
All-India Capacity Utilisation at 96% in March 2010: The All- central region. Prices in Hyderabad witnessed significant upward
India capacity utilisation for March 2010 stood at a robust 96%, movements, due to power shortages and, subsequently, lower
as construction activities peaked all over the country prior to production. We expect prices to remain firm till May 2010 on
the arrival of the monsoon in June. However, the overall account of the demand arising from the Commonwealth
utilisation was down by 600bp yoy, on account of an increase Games, infrastructure spending and recovery in the Urban
in capacity. Housing Segment. However, we estimate a correction in prices
from June 2010, as new capacity addition over the last few
Prices increase at a higher clip in the southern region: Cement
months exerts pressure and with the conclusion of the peak
prices have gone up by Rs20-25 per bag in the southern region
construction period. We are Neutral on ACC, Ambuja,
ACC,
during the month of March 2010. Despite sluggishness in
demand, the region has witnessed price hikes, primarily due to Grasim,Ultratech and India Cements, as they are fairly priced.
production cuts in Andhra Pradesh as a result of power We continue to remain Positive on Madras Cements and JK
Positive
shortages. Prices remained stable in the northern region, as Lakshmi Cement, due to their attractive valuations (based on
the Commonwealth games-related construction activities are EV/Tonne EV/EBITDA
the EV/Tonne and EV/EBITDA multiples).
coming to a conclusion. Prices dropped by Rs10-15 per bag in
the central region, due to sluggish demand accompanied by All India Performance Highlights
an increase in supply. The prices have increased by Rs7-10 per Mar -10 Mar -09 YoY(%) FY10 FY09 YoY(%)
bag in the western region, on account of strong demand from Production
the housing segment. (mn tonnes) 19.59 18.11 8.2 201.07 181.41 10.8
Despatches
Top Performers: Jaiprakash Associates was the top performer
Performers: (mn tonnes) 19.64 18.13 8.3 200.22 181.01 10.6
among the major cement players. The company posted a 57.7% Source: CMA, Angel Research
yoy jump in sales volumes in March to 1.23mn tonnes (0.78mn
tonnes), on account of healthy demand and capacity addition.
Madras Cements delivered a robust 36.3% growth in
despatches, despite the sluggishness in demand from the
southern region, as the company's newly installed plant
stabilised during the month. India Cements also delivered a
robust 26.2% yoy growth in despatches for March 2010 to 1.04
mn tonnes, while Dalmia Cements registered a 15.2% yoy
growth in despatches to 0.41mn tonnes, aided by a 2.5mtpa
capacity addition during FY2010.
Research Analyst - Rupesh Sankhe/V. Srinivasan
For Private Circulation Only | Angel Broking Ltd: BSE Sebi Regn No : INB 010996539 / CDSL Regn No: IN - DP - CDSL - 234 - 2004 / PMS Regn Code: PM/INP00000154 6 Angel Securities Ltd:BSE: INB010994639/INF010994639 NSE: INB230994635/INF230994635 Membership numbers: BSE 028/NSE:09946 3
4. Fundamental Focus | April 24, 2010
Focus
GAIL India - Buy Price - Rs425
Target Price - Rs553
Event Update
Target Price - Rs356
Regulatory Boost transmission tariffs consequent to the announcement. The
blended transmission tariffs have been increased by 22% for
The Petroleum and Natural Gas Regulatory Board (PNGRB) has
announced provisional tariffs for GAIL's old (HBJ-GREP-DVPL the period. We have now factored in blended transmission tariffs
pipeline) and new pipelines (DVPL/GREP up-gradation) under of Rs917/tscm for FY2011E and Rs1,068/tscm for FY2012E
the PNGRB Regulation 2008 - determination of natural gas from Rs849/tscm. Consequent to the change in our estimates,
pipeline tariffs. Surprisingly, PNGRB's tariffs are different for our Revenue, EBITDA and Profitability estimates for FY2011E
the old pipelines and the newer expansion apart from being and FY2012E, stand increased.
much higher than our estimates. Hence, we are revising our The announcement reduces the overhang and uncertainty
tariff estimates from Rs849/scm to Rs917/scm for FY2011E regarding the transmission tariffs for GAIL, which should be a
and Rs1,068/scm for FY2012E respectively. Similarly, our
positive catalyst for the stock. We value GAIL on SOTP basis at
Earnings estimates also stand increased at Rs28.4/share and
Rs553/share (core business is valued at Rs420/share, E&P
Rs33.7/share for FY2011E and FY2012E, respectively.
valued at Rs20/share, Cash and Investment value of Rs113/
Consequently, we are revising our Target Price to Rs553 (Rs458)
Target Price
share). At Rs425, the stock is available at 12.6x FY2012E EPS
and upgrade the stock from Accumulate to Buy. Buy.
of Rs33.7 and 2.4x FY2012E P/BV. We upgrade the stock to a
PNGRB declares provisional tariffs for GAIL's key pipelines: Buy.
Buy.
PNGRB has determined tariffs of Rs25.46/mmbtu (US $0.57/
mmbtu assuming Rs45/US$)) for HBJ-GREP-DVPL as against
the current tariffs of Rs28.48/mmbtu (US $0.63/mmbtu), a
decline of 10.6%. The revision in tariffs is on retrospective basis
effective November 20, 2008. Similarly, the Board has also
fixed tariffs of Rs53.65/mmbtu (US $1.2/mmbtu) for DVPL/GREP
up-gradation, 88.4% higher over current HBJ tariffs. As PNGRB
has provided for tariffs on provisional basis, the same is likely
to be finalised after considering the actual costs and data at Key Financials
the end of the financial year on the basis of audited accounts.
Y/E March (Rs cr) FY2009 FY2010E FY2011E FY2012E
Key issues to track going ahead: We are positively surprised by Net Sales 23,776 25,250 36,858 41,305
the PNGRB's announcement. However, we believe that certain
% chg 32.0 6.2 46.0 12.1
issues needs to be watched going ahead. It would be worth
Profits
Net Profits 2,804 3,031 3,596 4,277
noticing how the Power and Fertiliser Ministries take the
announcement. Pertinently, total transportation cost of the % chg 7.8 8.1 18.7 18.9
KG-D6 gas is likely to be around US $2.35/mmbtu (equivalent OPM (%) 17.1 17.6 14.7 16.7
to 55% of the well head selling price of gas) which will increase EPS (Rs) 22.1 23.9 28.4 33.7
the delivered cost of the gas to around US $9/mmbtu.
P/E (x) 19.3 17.8 15.0 12.6
Outlook and Valuation P/BV (x) 3.7 3.2 2.8 2.4
The hike in tariffs for the DVPL/GREP expansion has come as a RoE (%) 20.2 19.1 19.8 20.3
surprise. We had factored in flat blended transmission tariffs RoCE (%) 21.3 20.7 20.0 21.3
for GAIL's tariffs over FY2010E-12E compared to street
EV/Sales (x) 2.2 2.1 1.6 1.4
expectations of decline in the same. However, GAIL's
EV/EBITDA (x) 12.7 12.0 10.7 8.2
management has guided for 10% increase in the blended
Source: Company, Angel Research, Price as on April 20, 2010
Research Analyst - Deepak Pareek/Amit Vora
For Private Circulation Only | Angel Broking Ltd: BSE Sebi Regn No : INB 010996539 / CDSL Regn No: IN - DP - CDSL - 234 - 2004 / PMS Regn Code: PM/INP00000154 6 Angel Securities Ltd:BSE: INB010994639/INF010994639 NSE: INB230994635/INF230994635 Membership numbers: BSE 028/NSE:09946 4
5. Fundamental Focus | April 24, 2010
Focus
Axis Bank - Buy Price - Rs1,239
Target Price - Rs1,459
Target Price - Rs356
4QFY2010 Result Update
Performance Highlights to the tune of Rs155.2cr and a slippage of Rs28.3cr to NPAs
during the quarter, taking cumulative slippages from restructured
Axis Bank reported a strong Net Profit growth of 31.5% yoy,
assets to Rs413cr, or 18% of the restructured loans.
which was ahead of our expectations, on the back of lower-
than-estimated provisions for NPAs. The core business growth Strong Capital Adequacy: The bank has a high CAR of 15.8%,
recorded a strong improvement, with advances and deposits on the back of the equity raised during 2QFY2010. The Tier-I
growth of 27.9% and 20.4%, respectively. The other key positive capital stood at 11.2% at the end of 4QFY2010. With the
from the result was a sequential CASA improvement, reasonable leverage (Assets/Networth) at 12.0x, the bank is adequately
non-interest income growth and continued retail network capitalised to grow its advances at 5-8% above industry growth
expansion. We maintain a Buy on the stock. over FY2010-12E.
Strong Advances Growth boosts NII: Advances increased by a High AFS exposure in Investment book: The Bank's AFS portfolio
robust 27.9% yoy and 23.1% sequentially to Rs1,04,343cr, while constituted 36.8% and its HFT portfolio 7.7% of the total
Deposits increased to Rs1,41,300cr, a growth of 20.4% yoy investment book. The non-SLR investment was 39% of the total
and 24.1% sequentially. The CASA ratio of the bank improved investment book. The bank reduced the modified duration of
to 46.7%, from 45.6% in 3QFY2010 and from 43.1% in its AFS portfolio during the quarter. The modified duration AFS
4QFY2009. During the quarter, the daily average balances of and HTM stood at 2.3 years (3.4 years in 3QFY2010) and 5.2
Savings deposits grew by 40% yoy and those of Current account years, respectively.
deposits grew by 42% yoy. This, coupled with the Rs3,800cr of
Outlook and Valuation
equity capital raised during October 2009, was reflected in an
uptick in the reported NIMs of the bank to the 4.1% level (against At Rs1,239, the stock is trading at 13.0x FY2012E EPS of Rs95.1
4.0% in 2QFY2010 and 3.4% in 4QFY2009). As a result, the and 2.4x FY2012E Adjusted Book Value (ABV) of Rs521. We
Net Interest Income of the bank recorded a growth of 41.4% remain positive on the Bank and believe that it deserves premium
yoy and 8.2% sequentially. valuations on account of its attractive CASA franchise, multiple
sources of sustainable fee income, strong growth outlook and
Reasonable Non-interest income growth: Fee income registered
A-list management. We maintain a Buy on the stock, with a
a growth of 17% yoy to Rs780cr during 4QFY2010, as
Price
Target Price of Rs1,459, implying an upside of 18%.
compared to Rs664cr in 4QFY2009, with contributions from
all the major businesses of the Bank. Fee income from Large
Key Financials
and Mid Corporate Credit grew 111% yoy (partly due to the
reclassification of the loan syndication business to the Large Y/E March (Rs cr) FY2009 FY2010 FY2011E FY2012E
and Mid Corporate Credit Segment), followed by a 20% yoy NII 3,686 5,006 6,154 7,739
growth in Treasury, a 2% yoy growth in Retail Business; however, % chg 42.6 35.8 22.9 25.7
fee income from SME and Agri-lending businesses declined by
Profit
Net Profit 1,815 2,515 2,870 3,852
6% yoy, that from Business Banking by 8% yoy and from Capital
% chg 69.5 38.6 14.1 34.2
Markets by 34% yoy.
NIM (%) 3.0 3.1 3.1 3.1
Asset-quality Stable: The Gross NPAs were up by 12.3% qoq to
Asset-
EPS (Rs) 50.6 62.1 70.8 95.1
Rs1,318cr, with a coverage ratio at 72.4% (including technical
write-offs). However, on the back of a strong advances growth, P/E (x) 24.5 20.0 17.5 13.0
the Gross and Net NPA ratios of the bank were stable at 1.1% P/ABV (x) 4.4 3.1 2.8 2.4
and 0.4%, respectively. The cumulative restructured portfolio RoA (%) 1.4 1.5 1.4 1.5
remained at the level of Rs 2,286cr, and stood at 2% of gross
RoE (%) 19.1 19.2 16.7 19.6
customer assets. There was a recovery from restructured assets
Source: Company, Angel Research, Price as on April 21, 2010
Research Analyst - Vaibhav Agrawal/Amit Rane
For Private Circulation Only | Angel Broking Ltd: BSE Sebi Regn No : INB 010996539 / CDSL Regn No: IN - DP - CDSL - 234 - 2004 / PMS Regn Code: PM/INP00000154 6 Angel Securities Ltd:BSE: INB010994639/INF010994639 NSE: INB230994635/INF230994635 Membership numbers: BSE 028/NSE:09946 5
6. Fundamental Focus | April 24, 2010
Focus
FAG Bearings - Buy Price - Rs591
Target Price - Rs712
Target Price - Rs356
1QCY2010 Result Update
Performance Highlights by higher contribution from new products. Thus, we estimate
the company to record EPS of Rs51.3 and Rs59.4 for CY2010E
Top
op-line,
Good growth in Top-line, Operating performance marginally
and CY2011E, respectively.
above expectation: For 1QCY2010, Net Sales grew 25.2% yoy
to Rs237.4cr (Rs189.7cr) in line with our expectation of Rs237cr. At Rs591, the stock is quoting at 11.5x CY2010E and 10.0x
The company reported de-growth on the Operating and Bottom- CY2011E Earnings. On account of higher IIP growth, there exists
line fronts and recorded 417bp dip in OPM and 396bp yoy an upside risk to our Earning Estimates. We maintain a Buy on
gain in NPM for 1QCY2010 respectively, which was marginally Target Price
the stock, with a Target Price of Rs712, at which level the stock
above our expectation. Profit growth jumped primarily due to up-
would trade at its historical up-cycle P/E of 12x on CY2011E
the one-time Exceptional item of Rs11.5cr in 1QCY2009. basis.
For 1QCY2010, Operating performance on a yoy basis was Company Background
largely impacted due to the 348bp increase in Raw Material
FAG India is a FAG Kugelfischer George Schaefer AG Group
costs on the back of higher steel prices.
company. The parent manufactures bearings for automotive
Margins decline by 417bp on higher Input costs: EBITDA and industrial applications. FAG India is a preferred supplier
Margins plummeted by a substantial 417bp yoy to 15.3% of bearing systems to some of the leading manufacturers of
(19.4%) basically due to the increase in Raw Material costs by cars and trucks, like Maruti, M&M, Tata Motors, GM, Ford and
348bp during the quarter. Nonetheless, the dip in OPM was Daimler Chrysler. Notably, with global players looking at
arrested to a certain extent due to lower Staff costs during the enhancing their capacities in India, FAG can enjoy an edge
quarter. Other Expenses increased by 145bp yoy. Overall, over its peers to supply to these OEMs in India.
Operating Profit fell marginally by 1.7% yoy to Rs36.2cr
(Rs36.8cr), which came in marginally above our expectation.
Bottom-line up 61.4%: For 1QCY2010, FAG registered 61.4%
yoy increase in Bottom-line to Rs22.5cr (Rs13.9cr) largely on
account of the one-time Exceptional item of Rs11.5cr in
Key Financials
1QCY2009.
Y/E December (Rs cr) CY2008 CY2009 CY2010E CY2011E
Outlook and Valuation
Net Sales 762 820 959 1,084
In a developing economy like India, with greater focus on
% chg 17.0 7.6 16.9 13.0
mechanisation of the manufacturing process, demand for
Profits
Net Profits 98.6 73.1 85.3 98.7
bearings has outperformed industrial growth. FAG's prospects
are derived from demand arising in the Capital Goods and % chg 24.3 (25.9) 16.7 15.6
Automobile industries. The Capital Goods and Manufacturing OPM (%) 21.3 13.6 15.0 15.4
Sectors present a strong opportunity for the Bearings industry. EPS (Rs) 57.6 39.4 51.3 59.4
Further, the Bearings Segment has a direct co-relation with the
P/E (x) 10.3 15.0 11.5 10.0
Auto Sector growth, which is expected to post around10%
growth per annum over the next 4-5 years. P/BV (x) 2.4 2.1 1.8 1.6
RoE (%) 26.5 15.1 17.1 17.0
During the last five years, the company posted a CAGR of 20%
in Revenue. Going ahead, over CY2009-11E, we have RoCE (%) 38.6 20.8 24.0 24.2
conservatively modeled Volumes to record CAGR of 11%, which EV/Sales (x) 1.1 1.0 0.8 0.7
would in turn drive 15% CAGR in Revenues in the mentioned EV/EBITDA (x) 5.7 7.3 5.6 4.6
period. We believe that Revenue growth will largely be driven Source: Company, Angel Research, Price as on April 22, 2010
Research Analyst - Vaishali Jajoo
For Private Circulation Only | Angel Broking Ltd: BSE Sebi Regn No : INB 010996539 / CDSL Regn No: IN - DP - CDSL - 234 - 2004 / PMS Regn Code: PM/INP00000154 6 Angel Securities Ltd:BSE: INB010994639/INF010994639 NSE: INB230994635/INF230994635 Membership numbers: BSE 028/NSE:09946 6
7. Fundamental Focus | April 24, 2010
Focus
Gujarat Gas - Accumulate Price - Rs282
Target Price - Rs306
Target Price - Rs356
1QCY2010 Result Update
Performance Highlights domestic volumes, RLNG volumes and gas flow from KG-D6
would be growth drivers for the company as well as soften the
OPM expands 672bp yoy to 25.0%, up 510bp qoq:
supply-side constraints.
Sequentially, the company's OPM expanded by 510bp to 25.0%
(19.9%) mainly on account of the increase in the Gross Gas The company's CNG Segment has been clocking healthy
spread (selling price minus the gas cost) touching an all-time growth, thereby increasing its share in the volume matrix. More
high of Rs4.3/scm as against Rs4.0/scm registered in than 115,000 Natural Gas vehicles are now plying in the
4QCY2009. This was on account of full impact of CNG price company's markets, which is higher by around 5.5% sequentially.
hike effected in the latter part of December 2009 and 1.6% Further, with incremental volumes likely to flow to the
Rupee appreciation on a sequential basis, which lowered gas high-Margin Industrial Retail Segment, the company would
cost. On a yoy basis, the company's OPM expanded by 672bp register Margin expansion going ahead. Also, potential
to 25.0% (18.3%) as the Gross Gas spread increased 27.7% appreciation of the Rupee would be the icing on the cake. In
yoy to Rs4.3/scm (Rs3.3/scm). Higher Gross Gas spread yoy the current quarter, we saw Gross Gas spread touching an
was on account of higher realisations and positive impact of all-time high of Rs4.3/scm as against Rs4.0/scm registered in
stronger Rupee on gas cost in 1QCY2010. OPM was also 4QCY2009. This signifies that the company is able to pass on
supported by the 3.0% yoy decline in Operating expenditure any increase in the gas cost and benefit from Rupee appreciation
during the quarter, wherein Staff costs increased 8.3% yoy to to maintain its Margins.
Rs10.7cr (Rs9.9cr) and Other operating expenditure fell 8.3%
At Rs282, the stock is trading at 16.6x CY2010E and 13.8x
yoy to Rs19.3cr. (Rs21.1cr). Robust expansion in OPM yoy
CY2011E Earnings. Further, potential trigger for the stock could
resulted in EBITDA increasing by 83.1% yoy to Rs103cr (Rs56cr),
be the GSPC IPO (has filed the DRHP), where Gujarat Gas
which was higher than our expectation of Rs83cr.
holds stake. We recommend an Accumulate on the stock, with
Depreciation, Interest costs in line: Depreciation was up 17.2% Target Price
a Target Price of Rs306, implying 15x CY2011E EPS of Rs20.4
yoy to Rs12.8cr (Rs11cr) due to investments in the pipeline and translating into 8.6% upside from current levels.
network, CNG and other infrastructure during the year. Since
the company uses internal cash accruals to meet its working
Key Financials
capital requirements and for expansions, the Interest costs were
Y/E December (Rs cr) CY2008 CY2009 CY2010E CY2011E
negligible.
Net Sales 1,301 1,420 1,665 2,042
Higher Top-line and OPM expansion boost PAT by 70.1%: Other
Top
op-line PA
% chg 4.5 9.1 17.3 22.7
Income declined 47.7% yoy to Rs4.0cr (Rs7.6cr), while the
effective Tax rate rose to 33.8% (30.3%). Bottom-line increased Profits
Net Profits 160.6 174.2 217.6 262.1
by 69.5% yoy to Rs62cr (Rs36cr), which was higher than our % chg 5.0 8.4 24.9 20.5
expectation of Rs50cr. Bottom-line growth could be attributed OPM (%) 18.1 19.7 21.2 20.6
to Volume growth and expansion in Gross Gas spread.
EPS (Rs) 12.5 13.6 17.0 20.4
Outlook and Valuation
P/E (x) 22.5 20.7 16.6 13.8
Gujarat Gas is keen on entering into a term contract for P/BV (x) 5.1 4.7 3.9 3.3
procurement of RLNG. It has received an allocation of RoE (%) 25.1 23.6 25.8 25.8
0.6mmscmd of KG-D6 gas from the Government of India on a
RoCE (%) 23.4 24.4 27.4 28.0
fallback basis, and is in discussion with the suppliers and
EV/Sales (x) 1.1 2.2 1.9 1.5
transporters to finalise agreements for flowing this gas into the
its system. The company is expecting the KG-D6 gas to flow EV/EBITDA (x) 6.1 11.4 9.0 7.2
from May end. Thus, going ahead, sustainable increase in Source: Company, Angel Research, Price as on April 23, 2010
Research Analyst - Deepak Pareek/Amit Vora
For Private Circulation Only | Angel Broking Ltd: BSE Sebi Regn No : INB 010996539 / CDSL Regn No: IN - DP - CDSL - 234 - 2004 / PMS Regn Code: PM/INP00000154 6 Angel Securities Ltd:BSE: INB010994639/INF010994639 NSE: INB230994635/INF230994635 Membership numbers: BSE 028/NSE:09946 7
8. Fundamental Focus | April 24, 2010
Focus
HCL Technologies - Accumulate Price - Rs381
Target Price - Rs420
Target Price - Rs356
3QFY2010 Result Update
Performance Highlights is likely to take a hit by 110bp, as the company would face
pressures in terms of higher wage costs (lateral hiring and wage
HCL Tech (HCL) delivered better-than-expected results by
inflation) and currency headwinds. However, the PAT margin
reporting a strong 6.9% qoq growth in the constant currency.
would remain stable at the current levels, on account of savings
The growth was supported by an 8.2% jump in the billed efforts,
on lower interest costs and Fx losses, as the low-cost hedged
compensating the pricing decline of 1.2%, sequentially. However,
positions would end in 1HFY2011E.
the growth in the reported currency was low at 1.4% qoq, on
account of the significant appreciation of the Rupee over the We expect the company to mark a top-line CAGR of 14.7%
USD (1.6%), Euro (6%) and the GBP (7%). The cross-currency during FY2009-12E, assuming a 20% growth in USD revenues
impact was higher vis-à-vis the peers, as HCL derives a higher and a realisation de-growth of 530bp over the next two years
share of Revenue from the Euro zone (28% on LTM basis) and (assuming INR/USD rate of 44.5). HCL has been operating at
has a lower Fx cover. The EBIT grew by just 1% qoq on account an 80%+ utilisation level (overall); thus, it does not have much
of a ramp-down in the BPO segment. The Net profit grew by room in terms of productivity gains. Hence, the EPS is likely to
15.9% at Rs344cr, sequentially, helped by lower Fx losses (down grow at a slower CAGR of 12.8% over FY2009-12E. The stock
to Rs62cr from Rs125cr in 3QFY2010). is currently trading at 17x on its FY2011E EPS of Rs22.5 and
14.2x on its FY2012E EPS of Rs27.2. We have valued the stock
Reaping the benefits of key, large deal wins: HCL Tech has
key,
at 15.5x of its FY2012E earnings, in line with its historical
been clocking a higher revenue growth than its peers in the last
average of 15x during FY2006-2010, and at a 30% discount
few quarters, backed by large multi-million-dollar deal wins in
to our Infosys target P/E multiple of 22x (historical discount of
the recent past. During 3QFY2010, it recorded a Top-line growth
32%). We maintain our Accumulate rating on the stock, with a
of 1.4% qoq (7.5% yoy), backed by a strong 8.2% qoq growth
Target price of Rs420.
in volumes. However, the positive impact on the volume growth
was largely curtailed by a pricing decline of 1.1% qoq and a
5.5% qoq impact of cross-currencies, resulting in lower
realisations. The company has recorded strong revenue growth,
backed by a 15% qoq growth in the Media vertical and a 9.8%
Key Financials
qoq growth in the Manufacturing segment. Infrastructure
Y/E June (Rs cr) FY2009 FY2010E FY2011E FY2012E
Services revenue grew by a strong 15% qoq; however, the BPO
vertical was subdued, with a 13% qoq fall in revenue, as the Net Sales 10,591 12,110 13,611 15,903
company has been witnessing a ramp-down in one major % chg 40.0 14.3 12.4 16.8
account. The company bagged 13 new deals across verticals Profit
Adj. Net Profit 1,275 1,459 1,634 1,933
(offshoring and transformational in nature), and added 39 new
% chg 12.1 12.1 12.0 12.2
clients during the quarter.
OPM (%) 21.8 21.6 21.0 20.5
Outlook and Valuation
EPS (Rs) 19.1 19.6 22.5 27.2
HCL Tech clocked a strong business growth of 6.9% (constant P/E (x) 20.3 19.7 17.1 14.2
currency) in the quarter; however, the growth in reported
P/BV (x) 4.6 4.1 3.6 3.1
currency was just 1.4%, on account of the low hedge cover and
RoE (%) 23.4 24.3 24.1 24.8
the sharp rupee appreciation against major currencies. We
believe that this trend will continue, as the company has not RoCE (%) 30.6 38.5 41.8 40.9
participated in booking hedges at high levels of 46-52 INR/ EV/Sales (x) 2.5 2.2 1.9 1.5
USD and would thus witness a wider gap between USD revenues EV/EBITDA (x) 11.5 10.0 8.9 7.4
and reported revenues vis-à-vis its peers. Operating profitability Source: Company, Angel Research, Price as on April 22, 2010
Research Analyst - Rahul Jain/Vibha Salvi
For Private Circulation Only | Angel Broking Ltd: BSE Sebi Regn No : INB 010996539 / CDSL Regn No: IN - DP - CDSL - 234 - 2004 / PMS Regn Code: PM/INP00000154 6 Angel Securities Ltd:BSE: INB010994639/INF010994639 NSE: INB230994635/INF230994635 Membership numbers: BSE 028/NSE:09946 8
9. Fundamental Focus | April 24, 2010
Focus
Hero Honda - Accumulate Price - Rs1,897
Target Price - Rs2,085
Target Price - Rs356
4QFY2010 Result Update
Performance Highlights positive developments on the macro-economic front. We believe
that although the substantial ownership base of Two-wheelers
Top-line in-line, riding on robust volumes: For 4QFY2010, Hero
op-line
has reduced the headroom for higher double-digit growth rates,
Honda (HH) clocked a 20% growth in Net Sales to Rs4,093cr
the increased Replacement demand is expected to sustain
(Rs3,412cr), which was in line with our estimates. Sales increased
Volumes. The rural markets are also expected to register better
primarily on the back of a strong 18.9% growth in Volumes
growth on account of the new demand arising from the relevant
and a marginal rise in the yoy average Realisations of around
rural population. Thus, we estimate the Two-wheeler Segment
Rs34,492 per bike (compared to Rs34,192 last year). Operating
to maintain its growth momentum and to register around a 9%
Margins improved by 89bp, on the back of a decline in Raw
CAGR in Volumes over the next few years.
Material costs, decent Top-line growth and optimal operating
leverage. As a result, the Bottom-line spurted by 49% to Rs599cr We expect HH to record around a 10% CAGR in Revenues over
(Rs402cr) during the quarter, surpassing our expectation of FY2010-12E, aided by around an 8% CAGR in Volumes during
Rs545cr. the period. We estimate the OPM to decline to around 16.3%
(16.9%) in FY2012E, due to the increasing Raw Material prices
Margins improve on better operating leverage: During
(aluminum and steel). We expect the Net Profit to register a
4QFY2010, HH's EBITDA Margins increased by 88bp yoy, owing
CAGR of 8% over FY2010-12E, on account of the Tax benefits
to lower Raw Material costs, which fell by 142bp yoy and
availed by HH at its new plant in Uttaranchal. We have revised
accounted for 67.6% of Sales (69.1% in 4QFY2009) and better
our EPS estimates marginally upwards to Rs120.3 (Rs113 earlier)
Operating leverage during the quarter. Other Expenditure
for FY2011E and to Rs130.3 (Rs123), following the better-than-
increased by 46bp yoy during the quarter, due to higher
expected 4QFY2010 performance by the company. We
Advertising expenditure. HH reported 26.7% yoy increase in
Target Price
recommend Accumulate the stock, with a Target Price of
Operating Profit to Rs682cr (Rs538cr) in 4QFY2010.
Rs2,085, owing to the recent decline in the stock price.
Net Profit exceeds expectations: HH reported a 49% surge in
Profit
Net Profit to Rs599cr (Rs402cr) during 4QFY2010, owing to
the improvement in the OPM and a lower Tax provision arising
from the commencement of its Haridwar plant. Other Income, Key Financials
which mainly comprised of treasury gains, increased by 80.6% Y/E March (Rs cr) FY2009 FY2010 FY2011E FY2012E
yoy to Rs99.2cr (Rs54.9cr) for 4QFY2010, and aided the
Net Sales 12,319 15,758 17,332 19,009
Bottom-line growth during the quarter.
% chg 19.2 27.9 10.0 9.7
Market share reduced in FY2010; future outlook cautious:
Profit
Net Profit 1,282 2,232 2,403 2,602
HH's domestic Motorcycle Segment market share of 53.9% at
% chg 32.4 74.1 7.7 8.3
the end of FY2010 has come down from about 63.1% at the
end of FY2009. The company has guided to clock five million OPM (%) 13.9 16.9 16.5 16.3
motorcycles Sales Volume in FY2011E. The Scooter Segment EPS (Rs) 64.2 111.8 120.3 130.3
recorded an overall Volume growth of 37.2% yoy during P/E (x) 29.6 17.0 15.8 14.6
FY2010, with its new launch, Pleasure, selling about 17,500
P/BV (x) 10.0 10.0 7.9 6.6
units per month.
RoE (%) 37.8 58.9 56.1 49.4
Outlook and Valuation
RoCE (%) 42.1 61.6 58.0 51.6
The Two-wheeler Segment registered an improvement in Sales EV/Sales (x) 2.5 2.0 1.7 1.5
in FY2010, on the back of the various measures adopted by EV/EBITDA (x) 20.1 12.5 11.4 10.2
the government to revive the Auto Sector, coupled with the
Source: Company, Angel Research, Price as on April 19, 2010
Research Analyst - Vaishali Jajoo
For Private Circulation Only | Angel Broking Ltd: BSE Sebi Regn No : INB 010996539 / CDSL Regn No: IN - DP - CDSL - 234 - 2004 / PMS Regn Code: PM/INP00000154 6 Angel Securities Ltd:BSE: INB010994639/INF010994639 NSE: INB230994635/INF230994635 Membership numbers: BSE 028/NSE:09946 9