1. Weekly Review
April 30, 2010
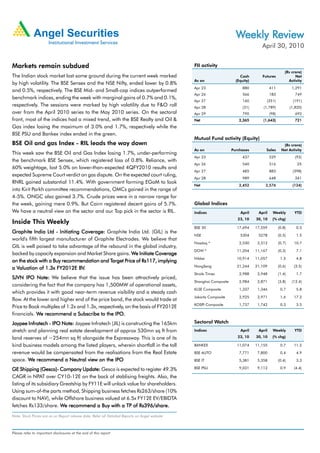
Markets remain subdued FII activity
(Rs crore)
The Indian stock market lost some ground during the current week marked Cash Futures Net
As on (Equity) Activity
by high volatility. The BSE Sensex and the NSE Nifty, ended lower by 0.8%
Apr 23 880 411 1,291
and 0.5%, respectively. The BSE Mid- and Small-cap indices outperformed
Apr 26 566 183 749
benchmark indices, ending the week with marginal gains of 0.7% and 0.1%,
Apr 27 160 (351) (191)
respectively. The sessions were marked by high volatility due to F&O roll Apr 28 (31) (1,789) (1,820)
over from the April 2010 series to the May 2010 series. On the sectoral Apr 29 790 (98) 692
front, most of the indices had a mixed trend, with the BSE Realty and Oil & Net 2,365 (1,643) 721
Gas index losing the maximum of 3.0% and 1.7%, respectively while the
BSE PSU and Bankex index ended in the green.
Mutual Fund activity (Equity)
BSE Oil and gas Index - RIL leads the way down (Rs crore)
As on Purchases Sales Net Activity
This week saw the BSE Oil and Gas Index losing 1.7%, under-performing
Apr 23 437 529 (92)
the benchmark BSE Sensex, which registered loss of 0.8%. Reliance, with
Apr 26 540 516 25
60% weightage, lost 5.0% on lower-than-expected 4QFY2010 results and
Apr 27 485 883 (398)
expected Supreme Court verdict on gas dispute. On the expected court ruling,
Apr 28 989 648 341
RNRL gained substantial 11.4%. With government forming EGoM to look
Net 2,452 2,576 (124)
into Kirit Parkh committee recommendations, OMCs gained in the range of
4-5%. ONGC also gained 3.7%. Crude prices were in a narrow range for
the week, gaining mere 0.9%. But Cairn registered decent gains of 5.7%. Global Indices
We have a neutral view on the sector and our Top pick in the sector is RIL. Indices April April Weekly YTD
23, 10 30, 10 (% chg)
Inside This Weekly
BSE 30 17,694 17,559 (0.8) 0.5
Graphite India Ltd - Initiating Coverage: Graphite India Ltd. (GIL) is the
NSE 5304 5278 (0.5) 1.5
world's fifth largest manufacturer of Graphite Electrodes. We believe that
Nasdaq * 2,530 2,512 (0.7) 10.7
GIL is well poised to take advantage of the rebound in the global industry,
DOW * 11,204 11,167 (0.3) 7.1
backed by capacity expansion and Market Share gains. We Initiate Coverage
Nikkei 10,914 11,057 1.3 4.8
Target Price
on the stock with a Buy recommendation and Target Price of Rs117, implying
HangSeng 21,244 21,109 (0.6) (3.5)
Valuation
a Valuation of 1.3x FY2012E BV.BV
Straits Times 2,988 2,948 (1.4) 1.7
SJVN IPO Note: We believe that the issue has been attractively priced,
Shanghai Composite 2,984 2,871 (3.8) (12.4)
considering the fact that the company has 1,500MW of operational assets,
KLSE Composite 1,337 1,346 0.7 5.8
which provides it with good near-term revenue visibility and a steady cash
Jakarta Composite 2,925 2,971 1.6 17.2
flow. At the lower and higher end of the price band, the stock would trade at
KOSPI Composite 1,737 1,742 0.3 3.5
Price to Book multiples of 1.2x and 1.3x, respectively, on the basis of FY2012E
financials. We recommend a Subscribe to the IPO.
We IPO.
Jaypee Infratech - IPO Note: Jaypee Infratech (JIL) is constructing the 165km Sectoral Watch
stretch and planning real estate development of approx 530mn sq ft from Indices April April Weekly YTD
land reserves of ~254mn sq ft) alongside the Expressway. This is one of its 23, 10 30, 10 (% chg)
kind business models among the listed players, wherein shortfall in the toll BANKEX 11,074 11,155 0.7 11.2
revenue would be compensated from the realisations from the Real Estate BSE AUTO 7,771 7,800 0.4 4.9
space. We recommend a Neutral view on the IPO BSE IT 5,381 5,358 (0.4) 3.3
GE Shipping (Gesco)- Company Update: Gesco is expected to register 49.3% BSE PSU 9,031 9,113 0.9 (4.4)
CAGR in NPAT over CY10-12E on the back of stablising freights. Also, the
listing of its subsidiary Greatship by FY11E will unlock value for shareholders.
Using sum-of-the parts method, Shipping business fetches Rs263/share (10%
discount to NAV), while Offshore business valued at 6.5x FY12E EV/EBIDTA
fetches Rs133/share. We recommend a Buy with a TP of Rs396/share.
Note: Stock Prices are as on Report release date; Refer all Detailed Reports on Angel website
Please refer to important disclosures at the end of this report
2. Fundamental Focus | April 30, 2010
Focus
Graphite India - Buy Price - Rs96
Target Price - Rs117
Target Price - Rs356
Initiating Coverage
Riding the Rebound Outlook and Valuation
Graphite India (GIL) is the world's fifth largest manufacturer of We expect GIL to register a CAGR of 16.1% in Top-line Top-line
Graphite Electrodes, which is a key input in steel production over FY2010E-12E, while Bottom-line is expected to increase
through the electric arc furnace (EAF) route. The Graphite at a CAGR of 6.5% over the period. The relatively low
Electrodes Industry is on a rebound, with EAF steel production Bottom-line growth is expected primarily due to the difference
expected to increase to 417.4 million metric tonne (mn mt) by in the OPM for the two years.
CY2011E, a CAGR of 10.8% over CY2009-11E.
On the bourses, the stock has historically traded in the range
GIL set to ride the Industry's rebound: The Graphite Electrodes of 0.5x to 1.5x its one year forward Book Value and a band of
industry is expected to grow faster, compared to EAF steel 4x to 8x one-year forward EPS. However, we believe that the
production over the next few years, as the de-stocking of market has historically valued GIL's core earnings, rather than
graphite electrodes inventory on steel manufacturers' end, is accounting for one time benefits like tax advantages and other
expected to reverse. Consequently, we expect Graphite income. Adjusting for these one-time impacts, the P/E range
Electrodes volumes to grow at 17.2% CAGR over CY2009-11E. would be much higher for the stock. As such, the P/BV is a
GIL, with a capacity expansion from 78,000mt/year to more appropriate method of valuing the stock. The stock is
88,500mt/year, to be completed by FY2012E, is well poised to currently trading at 1.1x its FY2012E Book Value and 6.8x its
reap the benefits of this growth. We expect GIL’s Market Share FY2012E EPS. We have assigned a Target Multiple of 1.3x to its
to increase to 9.0% by FY2012E and Top-line to grow at 16.1% one-year forward Book Value, based on the average sustainable
CAGR over FY2010E-12E on the back of this expansion. RoEs of 17.0% and a growth rate of 5.0%. We believe that the
RoEs of the company going forward would be higher than the
Strong Labour Cost Advantage: GIL has strong labour cost
Labour
past average and therefore, we have assigned a the multiple
advantages compared to its global peers, as the other
on the higher side of the band. We Initiate Coverage on the
companies have their plants in locations where labour costs
Target Price
stock, with a Buy recommendation and a Target Price of Rs117.
are significantly higher compared to India. In FY2009, GIL's
Employee cost was 9% of Sales, whereas it was almost 23%
(CY2008) for SGL Carbon SE, the world’s largest player.
Key Financials (Consolidated)
Historically, GIL has passed on a part of this advantage in order
Y/E March (Rs cr) FY2009 FY2010 FY2011E FY2012E
to gain Market Share. But, with the rate of Market Share addition
expected to slow down, we expect GIL to retain a larger part of Net Sales 1,498 1,418 1,603 1,913
this cost advantage and thereby improve its Margins over % chg 12.6 (5.4) 13.0 19.3
historical average levels. Profit
Net Profit 237 242 237 275
Strong Entry Barriers: There are a number of entry barriers that % chg 66.4 2.3 (2.3) 16.1
protect the existing players in the highly consolidated industry. EBITDA Margin (%) 24.4 29.0 24.4 24.2
The technology to manufacture high quality UHP electrodes
FDEPS (Rs) 11.6 11.0 12.1 14.0
rests with a few top players. The industry is marked by a
relationship and referral based model, wherein a new entrant P/E (x) 8.3 8.7 7.9 6.8
has to prove its credentials by supplying to a few steel P/BV (x) 1.5 1.3 1.2 1.1
manufacturers and then get referrals. The entire process often RoE (%) 25.3 20.1 16.5 16.5
takes several years, as the steel manufacturers are not inclined
RoACE (%) 20.4 21.7 20.1 20.9
to try out a new supplier. The other entry barriers are the scarcity
of Needle Coke, a key input for high grade UHP electrodes, EV/Sales (x) 1.1 1.2 1.3 1.0
and the high cost of setting up a green-field graphite electrodes EV/EBITDA (x) 4.7 4.1 5.2 4.2
manufacturing facility. Source: Company, Angel Research, Price as on April 28, 2010
Research Analyst - Jai Sharda
For Private Circulation Only | Angel Broking Ltd: BSE Sebi Regn No : INB 010996539 / CDSL Regn No: IN - DP - CDSL - 234 - 2004 / PMS Regn Code: PM/INP00000154 6 Angel Securities Ltd:BSE: INB010994639/INF010994639 NSE: INB230994635/INF230994635 Membership numbers: BSE 028/NSE:09946 2
3. Fundamental Focus | April 30, 2010
Focus
SJVN - Subscribe
IPO Note - Hydro Powered
SJVN is a joint venture between the Government of India and the stock would trade at Price to Book multiples of 1.2x and
the state government of Himachal Pradesh, formed to develop 1.3x, respectively, on the basis of FY2012E financials. The
and operate the 1,500MW Nathpa Jhakri Hydro Power Station company’s public sector peer NHPC, with operational capacity
(NJHPS). NJHPS is currently the largest operational hydroelectric of 5,175MW is trading at a P/BV multiple of 1.4. The Angel
power (HEP) generation facility in India based on installed ROIC for SJVN stood at 16% in FY2009 higher than 11% for
capacity. SJVN is also currently constructing a 412MW plant at NHPC, due to better operating performance and financial
a cost of Rs2,047cr at Rampur in Himachal Pradesh, and is leverage; hence, the SJVN stock deserves a premium to NHPC.
located downstream of the NJHPS. We have arrived at a fair At the issue price, the stock would trade at a substantial discount
value of Rs30 for the stock and recommend a Subscribe to to its private sector peers, such as Jaiprakash Power Ventures
IPO.
the IPO. (P/BV of 4.1)and KSK Energy Ventures (P/BV of 1.9), with
operational assets of 700MW and 279MW, respectively.
Rationale for our Subscribe recommendation
We have valued the NJHPS and Rampur Hydro projects of the
SJVN to enjoy a stable revenue stream from NJHPS: SJVN is
NJHPS:
company individually and have arrived at a DCF value of
expected to enjoy a stable revenue inflow from its currently
Rs28.9/share. However, we have excluded all other projects
operational NJHPS project. The steady cash flows from the
under implementation, totaling 3,588MW, since these
company's existing operations at the NJHPS are sufficient to
businesses are yet in nascent stages. By assigning an implied
fund its equity contribution portion for the existing pipeline of
P/BV multiple of 1.55x on the FY2012E Book Value, we get a
projects.
value per share of Rs31. Hence, we have arrived at an aggregate
Favourable Industry Dynamics: According to the Hydro Power Fair Value of Rs30 per share, by computing the average of the
Policy 2008, India has an enormous untapped potential for value arrived under the DCF and P/BV methodologies, thereby
hydroelectric generation, equivalent to 84,000MW at an giving an upside of 15.4% over the upper-end of the price band.
optimum 60% load factor, which translates to 148,700MW in We recommend a Subscribe to the IPO.IPO.
terms of installed capacity. We believe that SJVN, with its
expertise in operating India’s largest HEP generation facility is Fair Value Calculation
well placed to make use of this opportunity. Projects Project cost NPV Debt/ Per Share
(Rs cr) (Rs cr) Equity Value (Rs)
Strategic Location of Power Plants: Most of the SJVN's upcoming
Location Power
NJHPS 8,000 10,734 50:50 26.1
projects are strategically located in India's Northern region,
Rampur Hydro 2,472* 956 70:30 2.3
which are bestowed with perennial rivers with a continuous water
Equity invt. 111 111 - 0.5
supply. The strategic location of the plants is expected to enable
in Other proj.
the company to maintain a high operational efficiency.
Per Share 28.9
Outlook and Valuation Value - DCF
Per Share 1.55 * FY12E 31.0
The steady cash flows from NJHPS are sufficient to fund SJVN’s
Value - P/BV
equity contribution portion for the existing pipeline of projects,
and also support its working capital requirements and debt Fair Value
Value 30.0
Source:Company RHP, Angel Research; Note: *Estimated project cost
servicing, while maintaining a healthy level of cash in the
balance sheet.
We believe that the issue has been attractively priced, considering
the fact that the company has 1,500MW of operational assets,
which provides it with good near-term revenue visibility and a
steady cash flow. At the lower and higher end of the price band,
Research Analyst - Rupesh Sankhe/V Srinivasan
For Private Circulation Only | Angel Broking Ltd: BSE Sebi Regn No : INB 010996539 / CDSL Regn No: IN - DP - CDSL - 234 - 2004 / PMS Regn Code: PM/INP00000154 6 Angel Securities Ltd:BSE: INB010994639/INF010994639 NSE: INB230994635/INF230994635 Membership numbers: BSE 028/NSE:09946 3
4. Fundamental Focus | April 30, 2010
Focus
Jaypee Infratech - Neutral
IPO Note - Building on Periphery
Objects of the Issue and toll operations would be the prime Revenue driver in the
Particulars Amount (Rs cr) foreseeable future. We have assumed a ten-year development
A) Partially finance the Yamuna Expressway Project [•] period for the company's existing land bank (530mn sq ft) and
B) General Corporate Expenses [•] average realisation of Rs4,000/sq ft and Rs8,000/sq ft on JIL's
saleable interest in Residential (50%) and Commercial (33%)
Total 1,650
property based on its geographical presence. However, our
Source: RHP
Earnings estimate for the expressway over the Concession period
Jaypee Infratech (JIL) is constructing the 165km stretch (Yamuna yields a negative NPV of Rs2,200cr on FCFE basis. Accordingly,
Expressway Project - 69% completed) and planning real estate we have arrived at a Fair Value of Rs95/share. Thus, the IPO is
development at five locations (approx 530mn sq ft from land available at a premium to our NAV along with being fairly
reserves of around 254mn sq ft) alongside the Expressway over valued on P/BV basis of 3.8x and 4.2x on FY2010E estimates
the next few years. This is one of its kind business models among at the lower and upper price band. Hence, we are Neutral on
the listed players, wherein shortfall in the toll revenue would be the IPO.
compensated from the realisations from the Real Estate space.
IPO Details
We have assumed a ten-year development period for the
company's existing land bank (530mn sq ft) and have assumed JIL plans to raise up to Rs1,650cr via its Initial Public offer (IPO)
average realisation of Rs4,000/sq ft and Rs8,000/sq ft on JIL's priced in Rs102-117 band implying fresh equity issuance of
saleable interest in Residential (50%) and Commercial (33%) 14.1cr/16.2cr at the upper and lower price band, respectively.
property, translating into a Fair Value of Rs95/share. Thus, the The issue offers a discount of 5% for the retail investors. Besides
IPO is available at a premium to our NAV. Hence, we are Neutral the fresh issue, promoter Jaiprakash Associates (JAL) would
IPO.
on the IPO. offload six crore shares to raise around Rs700cr. Part of the
Funding in place + Strong Parentage àExecution: JIL stands to
Parentage IPO proceeds would be utilized for financing the Yamuna
benefit from JAL's strong technical capabilities as well as Expressway Project.
capitalise on its strong parentage. Moreover, the total project
cost of Rs9,739cr for the 165km stretch is fully funded, which Break up of the Total Project Cost
Financing
Means of Financing Amount Amount deployed
instills confidence on the execution front. On the Real Estate Feb,2010
to be deployed as of 28th Feb,2010
front too, the company has met with good response for all its (Rs cr) (Rs cr)
projects and sold 21.3mn sq.ft till March 31, 2010, which further Proceeds
A . Net IPO Proceeds 1,500 -
aids its capex plans. B. Other means of financing
Geographically concentrated bet: JIL's entire land reserves are i) Debt 6,000 4,044
located in UP between Noida and Agra unlike established ii) Equity Contribution by Promoter 1,250 1,250
players like DLF and Unitech, who have a diversified presence. iii) Contribution from Real Estate Dev. 989 956
We like players with diversified presence owing to the cyclical Total
Sub Total (B) 8,239 6,250
nature of the Real Estate industry. Thus, JIL's future prospects Total Project Cost
Project 9,739 6,250
are closely dependent on the general economic conditions and
Source: RHP
activities in this region, besides the government policies relating
to infrastructure development.
Fairly valued: The land required for Yamuna Expressway has
been acquired to the extent of 96%, whereas that required for
Real estate development to the extent of around 61%. The Toll
policy relating to the Yamuna Expressway is yet to be finalized
Research Analyst - Shailesh Kanani/Aniruddha Mate
For Private Circulation Only | Angel Broking Ltd: BSE Sebi Regn No : INB 010996539 / CDSL Regn No: IN - DP - CDSL - 234 - 2004 / PMS Regn Code: PM/INP00000154 6 Angel Securities Ltd:BSE: INB010994639/INF010994639 NSE: INB230994635/INF230994635 Membership numbers: BSE 028/NSE:09946 4
5. Fundamental Focus | April 30, 2010
Focus
GE Shipping - Buy Price - Rs331
Target Price - Rs396
Target Price - Rs356
Comapny Update
GE Shipping (Gesco) has emerged almost unscathed from the Attractively valued: Due to cyclical nature, it is difficult to predict
downturn of the shipping cycle on account of timely purchase the earnings for Shipping business given volatility in the freight
and sale of assets and sound mix of time spot ratio. With the rates. Hence, we have employed the sum-of-the parts
bottoming out of the freight rates and asset prices, we expect methodology to value the Shipping business on NAV basis taking
Gesco to register 49.3% CAGR in Net Profit over into account three parameters, viz, size, age and type (Single
CY2010-12E. Further, the company plans to list its wholly-owned or Double hull). On NAV basis, the Shipping business fetches
offshore subsidiary, Greatship Limited (GIL) by end FY2011E, Rs263/share (@ 10% discount to NAV), and the Offshore
which we believe will unlock value for the shareholders. business which is valed at 6.5x FY2012E EV/EBIDTA in line with
its global peers fetches Rs133/share. Based on our Target Price
Tanker freight rates bottoming out: The International Energy
of Rs396 the implied EV/ EBITDA, P/BV, P/E multiple works out
Agency estimates global oil demand to register 1.5% CAGR
to 5.7x, 0.9x, and 5.7x respectively, on FY2012E basis. We
over CY2009-11E. As per Clarksons, 13% and 14% of the
recommend a Buy on stock.
existing fleet of crude and product tankers will be added in
CY2010. However, accelerated phase out of single hull tankers, Valuation
which account for 12% of the world fleet, will relieve supply- Particulars Amount (Rs cr)
side pressures and keep the freight rates at current sustainable Tanker Segment - A 3,108
levels over the near to medium term. Gesco will be a key Dry Bulk Segment - B 649
beneficiary of higher tanker freight rates as it derives around NAV
NAV (@ 10% Discount) (A + B) 3,757
46% of its Consolidated Revenues from the Tanker Segment. EV/EBITDA)
Offshore Division EV (@ 6.5x EV/EBITDA) 3,856
Less: Total Debt 5586
Relatively younger fleet: The average age of GE Shipping's fleet
Add: Total Cash 3478
is around 10.9 years, which is relatively young given that most
Add: Advances 525
vessels have a life of 25 years. The company has applied
Target Price/Share
Price/Share 396
depreciation on an accelerated basis for the vessels that will
Source: Angel Research
need to be phased out by FY2010 as per the MARPOL
regulations. In the Offshore Segment, offshore assets such as Key Financials (Consolidated)
platform supply vessels and anchor handling tugs are relatively Y/E March (Rs cr) FY2009 FY2010E FY2011E FY2012E
young and hence, the company could earn better rates on such
Net Sales 3,801 2,840 3,013 3,873
assets.
% chg 21.4 (25.3) 6.1 28.5
Offshore business gaining momentum: Offshore Revenues
Profit
Net Profit 1,418 475 687 1,059
are expected to increase from 6.6% in FY2009 to 38.3% in
FY2012E driven by addition of eight new Offshore Supply % chg (2.4) (66.5) 44.5 54.2
Vessels (OSV). Enhanced capex by the oil & gas companies, FDEPS (Rs) 93.1 31.2 45.1 69.5
which is expected to increase by 10% CAGR over the next two EBITDA Margin (%) 41.6 23.6 32.7 37.2
years, will strengthen the offshore freight rates. Further, with P/E (x) 3.6 10.6 7.3 4.8
the Offshore Division stabilising, we expect Gesco's Offshore
RoE (%) 29.7 8.8 11.9 16.5
EBIT Margins to improve from current levels of 21% to 30% in
FY2012E. RoCE (%) 14.5 2.5 5.0 8.7
P/BV (x) 1.0 0.9 0.8 0.7
GIL IPO to unlock value: The company intends to list its 100%
subsidiary, GIL by end FY2011E through fresh equity issuance. EV/Sales (x) 1.9 2.4 2.2 1.8
This will unlock potential value of the Offshore business, which EV/EBITDA (x) 4.5 10.3 6.9 5.0
globally trades at higher multiples than the Shipping business. Source: Company, Angel Research, Price as on April 28, 2010
Research Analyst - Param Desai/Mihir Salot
For Private Circulation Only | Angel Broking Ltd: BSE Sebi Regn No : INB 010996539 / CDSL Regn No: IN - DP - CDSL - 234 - 2004 / PMS Regn Code: PM/INP00000154 6 Angel Securities Ltd:BSE: INB010994639/INF010994639 NSE: INB230994635/INF230994635 Membership numbers: BSE 028/NSE:09946 5
6. Fundamental Focus | April 30, 2010
Focus
Bharti Airtel - Buy Price - Rs298
Target Price - Rs360
Target Price - Rs356
4QFY2010 Result Update
Performance Highlights Outlook and Valuation
Bharti Airtel registered better-than-expected performance for We believe that competitive intensity will ease as the smaller
4QFY2010 reporting 2.4% yoy (2.9% qoq) growth in Top-line players (price destroyers) are virtually not earning any revenues
on the back of strong growth in minutes of usage (MoU). The despite the strong subscriber additions. The revenue per minute
company incurred one-time expenses towards the acquisition is likely to bottom out at around Rs0.40 and would gradually
of Warid Telecom and Zain Africa as well as registered higher start up-move once the new players burn out all their planned
SG&A expenses, which resulted in EBIDTA Margins declining investments (estimated to be US $10bn by FY2012). We believe
by 272bp yoy (200bp qoq) in turn dragging Bottom-line by that the future business growth would be driven by strong traction
8.2% yoy (7% qoq). We believe that the strong growth in MoU in the total MoU propelled by low tariffs and sustained subscriber
led by robust subscriber growth and improving minutes per additions. Also, the Zain acquisition post integration would take
subscriber will support the company's Mobile Services Revenue the total business to an all together new scale and spread. We
growth going ahead despite the decline in the Revenue per expect Bharti Airtel to record 9.3% CAGR in Top-line over
minutes. FY2010-12E, with consistent addition in its Subscriber base
Higher MoUs led Top-line growth, while SG&A expenses erode
Top
op-line (likely to reach 183mn by FY2012E) and Revenue per minute
Margins: Bharti Airtel recorded 2.4% yoy growth (2.9% qoq) in decline of 25% from the current Rs0.53 to Rs0.4 by FY2012E.
its overall Net Revenue in 4QFY2010 mainly on account of Thus, Bottom-line is expected to clock lower CAGR of 1.8%
improved Mobile business revenues, with its Mobile subscriber over FY2010-12E. We have valued the company at 14.5x
base growing 35.9% yoy (7.4% qoq) to 127.6mn. Revenue FY2012E EPS of Rs 24.9 and 15% discount to our Sensex Target
per minute fell 8.7% qoq, however the total minutes of usage multiple of 17x in view of the recent underperformance in the
grew by a robust 12.8% restricting the fall in ARPU to 4.3% qoq company's Sales growth and RoE (historical five-year premium
at Rs220. of 12%). We recommend a Buy on the stock, with a revised
Price
Target Price of Rs360 (Rs406), implying an upside of 21%.
Among the other segments, Telemedia Services de-grew by 0.9%
yoy (0.5% qoq) mainly on account of the drag in voice revenues.
Data and Broadband Services witnessed strong ramp up with Key Financials (Consolidated US GAAP)
the subscriber base in the latter witnessing 21.1% yoy (4.6% YY/E March (Rs cr) FY2009 FY2010E FY2011E FY2012E
qoq) growth in 4QFY2010 to 1.3mn and revenue climbing up Net Sales 36,962 39,615 42,773 47,328
by 121% yoy (48% qoq). Enterprise Services witnessed de-growth % chg 36.8 7.2 8.0 10.7
of 4.1% yoy (0.9% qoq growth). However, Passive Infrastructure
Profits
Net Profits 8,470 9,103 8,350 9,449
Services led the growth during the quarter by clocking 31.9%
yoy (3.1% qoq) growth led by the increase in the number of % chg 26.1 7.5 -8.3 13.2
towers (8% yoy) and higher tenancy ratio. EBITDA Margin (%) 41.0 38.2 35.3 35.6
The company reported 272bp yoy drop (down 201 qoq) in EPS (Rs) 22.3 24.0 22.0 24.9
EBIDTA Margins during 4QFY2010 mainly due to the 380bp P/E (x) 13.4 12.4 13.6 12.0
yoy (210bp qoq) increase in SG&A expenses with the Rs98cr EV/EBITDA (x) 7.9 7.4 7.2 6.3
one-time expense incurred towards advisory and professional
RoE (%) 32.2 25.4 18.6 17.9
fees for the acquisition of Warid Telecom and Zain Africa. Thus,
RoCE (%) 27.6 24.2 18.9 18.6
depressed Margins along with higher Depreciation, which
increased 19.9% yoy (3.4% qoq) and the effective Tax rate, Sales/GFA (x) 0.7 0.6 0.6 0.5
which was up by 591bp yoy (162bp qoq) dragged down the Mobile ARPUs 325 244 205 186
Bottom-line by 8.2% yoy (7% qoq). Source: Company, Angel Research, Price as on April 30, 2010
Research Analyst - Rahul Jain/Vibha Salvi
For Private Circulation Only | Angel Broking Ltd: BSE Sebi Regn No : INB 010996539 / CDSL Regn No: IN - DP - CDSL - 234 - 2004 / PMS Regn Code: PM/INP00000154 6 Angel Securities Ltd:BSE: INB010994639/INF010994639 NSE: INB230994635/INF230994635 Membership numbers: BSE 028/NSE:09946 6
7. Fundamental Focus | April 30, 2010
Focus
GCPL - Accumulate Price - Rs298
Target Price - Rs329
Target Price - Rs356
4QFY2010 Result Update
Performance Highlights and Kinky, posted a robust growth of 42% yoy and 41% yoy,
respectively, in INR terms. However, the Profitability of the
Lee Top
op-line
Godrej Sara Lee drives Top-line growth; adjusted growth at
international operations came under pressure during the quarter
5.3% yoy disappointing: Godrej Consumer (GCPL) reported
(due to currency volatility), and registered a decline of 18% to
strong Top-line growth at 48.1% yoy to Rs509cr (Rs344cr).
Rs2.5cr (Rs3.1cr).
Godrej-Sara Lee (GSL) contributed Rs147cr to the Top-line for
the quarter. However, adjusted for GSL's revenue, GCPL posted Outlook and Valuation
a growth of 5.3% yoy to Rs362cr. Moreover, international
Going ahead, we expect the growth momentum to decelerate
operations (particularly Africa) registered strong growth during
and expect GCPL to post a 15% CAGR in the Top-line and a
the quarter (we estimate it at ~19% yoy) which indicates that
14% CAGR in Earnings during FY2010-12E, as the benefits of
domestic operations (without GSL) grew just 1.9% yoy.
price hikes fade out, GSL's consolidation effect forms a base
Margin expansion boosts Earnings, which grow 54.6% yoy: and Gross Margin expansion peaks out. At Rs298, GCPL is
GCPL's consolidated Earnings for the quarter registered a growth trading at 21x FY2012E EPS of Rs14.2. While, we have not
of 54.6% yoy to Rs92cr (Rs59cr). In terms of Earnings, GSL's factored the Tura and Megasari deals into our numbers, owing
consolidation contributed Rs23cr during the quarter, adjusted to a lack of details, our preliminary analysis indicates that both
for which the growth in Bottom-line stood at 16% yoy to Rs69cr. the deals are likely to be EPS accretive. With GCPL's wider
The robust growth in the Top-line and Margin expansion boosted portfolio, a stronger performance of its International business,
Earnings. However, in terms of EPS (adjusted for dilution of the likely acquisition of the remaining 51% stake in GSL from
share swap to acquire GSL), GCPL registered a growth of 28.9% Sara Lee and a potential upside trigger from further acquisitions
yoy to Rs3 (Rs2.3). (likely in Latin America), we believe that the stock still offers
significant triggers for sustained performance. Hence, we
OPM expands 154bp, aided by 614bp Gross Margin
Target Price
maintain an Accumulate on the stock, with a Target Price of
expansion: At the operating front, GCPL delivered a Margin
Rs329, valuing GCPL at 23x FY2012E EPS. EPS.
expansion of 154bp yoy to 21.1% (19.6%), driving a 59.7%
yoy growth in EBITDA to Rs108cr (Rs67cr), partially aided by a Key Financials (Consolidated)
low base and GSL's consolidation. A 614bp yoy jump in Gross
Y/E March (Rs cr) FY2009 FY2010E FY2011E FY2012E
Margins (owing to a low base effect) and a decrease of 62bp
Net Sales 1,393 2,041 2,412 2,720
yoy in Staff costs were the key drivers behind the Margin
expansion. However, higher Other expenditure (up 290bp yoy) % chg 26.3 46.5 18.2 12.7
and a jump in Advertising spends (up 232bp yoy) kept Margins Profit
Net Profit (Adj) 172.6 339.6 392.4 437.8
under check. Going ahead, we expect input costs for GCPL to % chg 8.4 96.7 15.5 11.6
rise, as palm oil prices have hardened during the quarter and
OPM (%) 14.6 20.0 20.2 20.3
as the benefits of inventory/price covers fade away. We have
EPS (Rs) 5.6 11.0 12.7 14.2
modeled in a 200bp contraction in Gross Margins during
FY2010-12E. P/E (x) 53.2 27.0 23.4 21.0
Keyline
International Business on a strong footing; Keyline witnesses a P/BV (x) 13.5 12.1 9.5 7.7
slow- down The performance of the International business
slow-down: RoE (%) 46.9 51.3 45.4 40.5
registered yet another quarter of steady gains, registering an RoCE (%) 30.3 41.6 42.0 40.5
overall growth of ~19% yoy, largely aided by significant revenue EV/Sales (x) 6.5 4.4 3.7 3.2
traction in the Rapidol and Kinky businesses. For the full year
EV/EBITDA (x) 44.5 22.3 18.3 15.8
FY2010, Keyline Brands (UK), registered a muted growth of
Source: Company, Angel Research, Price as on April 26, 2010; Note: Not
9% yoy, while, African operations, namely Rapidol (South Africa) factored Tura/Megasari Numbers
Research Analyst - Anand Shah/Chitrangda Kapur
For Private Circulation Only | Angel Broking Ltd: BSE Sebi Regn No : INB 010996539 / CDSL Regn No: IN - DP - CDSL - 234 - 2004 / PMS Regn Code: PM/INP00000154 6 Angel Securities Ltd:BSE: INB010994639/INF010994639 NSE: INB230994635/INF230994635 Membership numbers: BSE 028/NSE:09946 7
8. Fundamental Focus | April 30, 2010
Focus
HDFC Bank - Buy Price - Rs1,944
Target Price - Rs2,220
4QFY2010 Result Update
Target Price - Rs356
Performance Highlights and net NPAs at 0.3% (0.4% in 3QFY2010). The total
restructured assets were 0.3% of the advances, which is among
HDFC Bank reported a Net Profit growth of 32.6% yoy to
the lowest in the sector. The bank has witnessed a reduction in
Rs837cr, in line with our estimates. Strong Business growth,
slippages from the retail segment in the last couple of quarters.
improvement in Profitability and asset quality, coupled with a
strong traction in CASA deposits, were the key positives from Non-interest Income declines: During 4QFY2010, the
the results. We maintain a Buy on the stock. non-interest income stood at Rs904cr, down 18.9% yoy, due to
a treasury loss of Rs47cr in 4QFY2010 (treasury gains of
Strong Business Growth with Profitability: Advances registered
Profitability:
Rs243cr in 4QFY2009) and a muted fee income growth of
a robust growth of 28.7% yoy and 6.4% qoq to reach
7.1% yoy. The Management attributed the muted growth in fee
Rs1,27,262cr. Deposits reached Rs1,67,404cr in 4QFY2010,
income to the presence of one-offs in 4QFY2009 and lower
up by 17.2% from Rs1,42,812cr in 4QFY2009. The CASA ratio
commission rates on third party products. Going forward, the
increased to 52% of total deposits during 4QFY2010, as against
management expects higher volumes to compensate for low
44.4% as at 4QFY2009 and 51.7% as at 3QFY2010. On
commission rates. Income from forex and derivatives increased
account of the higher growth in advances, the credit-deposit
by a healthy 17.9% yoy to Rs180cr.
ratio of the bank improved to 76.0%, increasing by 680bp yoy.
Consequently, NIMs improved to 4.4% in 4QFY2010, as against Outlook and Valuation
4.2% in 3QFY2010. The NIMs are expected to be impacted by
At the CMP the stock is trading at 16.3x FY2012E EPS of Rs119.4
,
20bp in 1QFY2011E as the bank starts paying interest on
and 3.1x FY2012E ABV of Rs632. We believe that HDFC Bank
savings balances on a daily basis.
is once again positioned for a high qualitative growth trajectory,
Strong Capital adequacy and branch expansion to drive CASA with both the CASA and Cost-to-Income ratios returning to about
and Credit market share gains, respectively: The key positive pre-CBoP levels. In our view, with its strong capital adequacy
from the results was the CASA deposit growth of 37.5% yoy and substantial branch expansion, the Bank is set to further
and 8.9% sequentially, driven by a 30.9% yoy growth in Current gain CASA market share and achieve a strong growth in fee
deposits and a 42.9% yoy growth in Savings deposits. income, as the economic environment continues to improve.
Target Price
We maintain a Buy on the stock, with a Target Price of Rs2,220.
The strong traction in CASA growth is attributable to the bank's
aggressive branch expansion during the year and to the
increasing productivity of the branch network of CBOP The bank
. Key Financials
opened a substantial 313 branches and 937 ATMs during Y/E March (Rs cr) FY2009 FY2010E FY2011E FY2012E
FY2010, to take its branch network to 1,725 branches and
NII 7,421 8,387 10,526 13,470
4,232 ATMs at the end of FY2010 (incidentally, the
% chg 42.0 13.0 25.5 28.0
cost-to-income ratio of the bank remained healthy during
FY2010 at 48%). The bank plans to open another 150 branches Profit
Net Profit 2,245 2,949 3,933 5,390
during FY2011E. Against this backdrop, we expect the bank to % chg 41.2 31.3 33.4 37.0
sustain a CASA ratio in the range of 49-52%, going forward. NIM (%) 4.9 4.3 4.4 4.5
The Bank's total Capital Adequacy (as per Basel-2 guidelines) EPS (Rs) 52.8 65.3 87.1 119.4
remained strong at 17.4%, with Tier-I forming 75% of the total P/E (x) 36.8 29.8 22.3 16.3
CAR. The bank has sufficient CAR to grow its advances 5-8%
P/ABV (x) 5.5 4.1 3.6 3.1
above the industry growth over FY2010-12E.
RoA (%) 1.4 1.5 1.6 1.7
Robust Asset Quality: The asset quality of the bank improved
RoE (%) 16.9 16.2 17.2 20.4
sequentially, with Gross NPAs at 1.4% (1.6% in 3QFY2010)
Source: Company, Angel Research, Price as on April 23, 2010
Research Analyst - Vaibhav Agrawal/Amit Rane
For Private Circulation Only | Angel Broking Ltd: BSE Sebi Regn No : INB 010996539 / CDSL Regn No: IN - DP - CDSL - 234 - 2004 / PMS Regn Code: PM/INP00000154 6 Angel Securities Ltd:BSE: INB010994639/INF010994639 NSE: INB230994635/INF230994635 Membership numbers: BSE 028/NSE:09946 8
9. Fundamental Focus | April 30, 2010
Focus
ICICI Bank - Buy Price - Rs976
Target Price - Rs1,169
Target Price - Rs356
4QFY2010 Result Update
Performance Highlights over all four quarters (the bank had not paid any bonus in
FY2009).
ICICI Bank's net profit increased by 35.2% yoy, which was in
line with our estimates. The key positives from the results are a Asset- Lower Provisioning
Asset- quality stabilising; Lower Provisioning Cost, going
further improvement in CASA to 41.7% and a declining trend forward: The asset quality of the bank showed signs of
in slippages from retail loans for four consecutive quarters, stabilising, with gross slippages at Rs700cr, driven by a sharp
though we would have liked to see a higher balance sheet and declining trend in slippages in retail loans. The slippages from
network growth from this quarter. With a capital adequacy of retail loans declined from Rs1,300cr in 1QFY2010 to Rs650cr
19.4%, the Bank is well-positioned for balance sheet growth, in 3QFY2010 and further to Rs500cr in 4QFY2010. The Gross
though branch expansion plans seem a tad slower than NPA ratio of the bank was up at 5.1% (as against 4.8% in
expected. Nonetheless, at the current levels, we believe that the 3QFY2010 and 4.3% in 4QFY2009), mainly on account of the
stock is trading at attractive valuations. Hence, we maintain a ongoing contraction in the loan book. The Provision coverage
Buy on the stock. ratio of the bank improved to 59.5% in 4QFY2010. The RBI
has extended the deadline to meet the coverage ratio
Advances de-grow more-than-expected: The total deposits of
de-grow more-than-
-than-expected:
requirement of 70% from September 30, 2010 to March 31,
the bank increased by 2.2% qoq (declined by 7.5% yoy) to
2011. The Bank has restructured loans of Rs5,300cr on a
Rs2,02,017cr during 4QFY2010, while the advances increased
cumulative basis (3.0% of total loans, 10.2% of the networth).
by 1.1% qoq (declined by 17.0% yoy) to Rs1,81,206cr. The
Going forward, we have factored in a decline in NPA provisions
de-growth in advances was sharper-than-expected, especially
to decline by 15.5% in FY2011E and 19.1% in FY2012E.
considering the strong uptick in systemic credit demand during
4QFY2010. The sharp drop in the advances book was Valuation
Outlook and Valuation
attributable to the repayments from retail, and short-term
At the CMP the Bank's Core Banking business (after adjusting
,
corporate loans.
Rs307 per share towards the value of the subsidiaries) is trading
Strong CASA Growth: The key positive from the results was the at 1.9x FY2012E ABV of Rs518. We value the Bank's subsidiaries
improvement in the Bank's CASA ratio to 41.7% (from 39.6% at Rs307 per share of ICICI Bank and the core Bank at Rs862
in 3QFY2010 and 28.7% in 4QFY2009). The Current deposits (2.25x FY2012E ABV). We maintain a Buy on the stock, with a
We
grew by 43.3% yoy and 14% qoq, and constituted 15.3% of the Price
Target Price of Rs1,169, implying an upside of 20%.
total deposits. Savings deposits grew by 29.7% yoy and 4.3%
Key Financials
qoq, and formed 26.4% of the total deposits.
Y/E March (Rs cr) FY2009 FY2010 FY2011E FY2012E
Branch Expansion while keeping costs in check: The
NII 9,092 8,114 9,378 11,538
management has indicated that the branch network target for
FY2010 of 2,000 would be achieved by May-June 2010. During % chg 10.9 (10.8) 15.6 23.0
FY2010, the bank opened 303 branches. At the same time, Profit
Net Profit 3,423 4,025 5,000 6,765
operating expenses have remained firmly in check, with the % chg (17.7) 17.6 24.2 35.3
management consistently delivering on its articulated objective
NIM (%) 2.6 2.4 2.5 2.5
of cost savings without compromising on branch expansion.
EPS (Rs) 30.7 36.1 44.8 60.7
During 4QFY2010, operating costs declined by 7.9% yoy to
P/E (x) 31.7 27.0 21.8 16.1
Rs1,527cr, driven by a 21.3% yoy reduction in other operating
P/ABV (x) 2.2 2.2 2.0 1.9
expenses to Rs944cr. Employee costs were up by 27.4% yoy
and 36.5% sequentially in 4QFY2010, mainly on account of RoA (%) 0.9 1.0 1.1 1.3
bonus payments for the entire year being decided and RoE (%) 9.2 9.6 11.5 15.0
accounted for during 4QFY010, instead of being apportioned Source: Company, Angel Research, Price as on April 23, 2010
Research Analyst - Vaibhav Agrawal/Amit Rane
For Private Circulation Only | Angel Broking Ltd: BSE Sebi Regn No : INB 010996539 / CDSL Regn No: IN - DP - CDSL - 234 - 2004 / PMS Regn Code: PM/INP00000154 6 Angel Securities Ltd:BSE: INB010994639/INF010994639 NSE: INB230994635/INF230994635 Membership numbers: BSE 028/NSE:09946 9