Solution Manual For Financial Statement Analysis, 13th Edition By Charles H. ...
Weekly Review - 24 July, 2010
1. Weekly Review
July 24, 2010
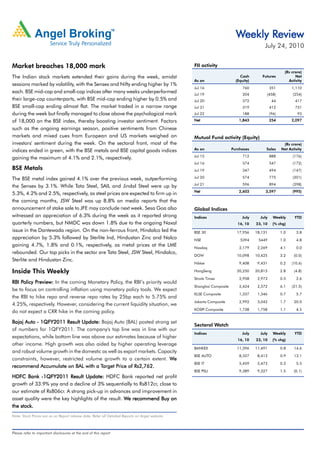
Market breaches 18,000 mark FII activity
(Rs crore)
The Indian stock markets extended their gains during the week, amidst Cash Futures Net
As on (Equity) Activity
sessions marked by volatility, with the Sensex and Nifty ending higher by 1%
Jul 16 760 351 1,110
each. BSE mid-cap and small-cap indices after many weeks underperformed Jul 19 204 (458) (254)
their large-cap counterparts, with BSE mid-cap ending higher by 0.5% and Jul 20 372 44 417
BSE small-cap ending almost flat. The market traded in a narrow range Jul 21 319 412 731
during the week but finally managed to close above the psychological mark Jul 22 188 (96) 93
of 18,000 on the BSE index, thereby boosting investor sentiment. Factors Net 1,843 254 2,097
such as the ongoing earnings season, positive sentiments from Chinese
markets and mixed cues from European and US markets weighed on Mutual Fund activity (Equity)
investors' sentiment during the week. On the sectoral front, most of the (Rs crore)
indices ended in green, with the BSE metals and BSE capital goods indices As on Purchases Sales Net Activity
Jul 15 712 888 (176)
gaining the maximum of 4.1% and 2.1%, respectively.
Jul 16 374 547 (172)
BSE Metals Jul 19 347 494 (147)
The BSE metal index gained 4.1% over the previous week, outperforming Jul 20 574 775 (201)
Jul 21 596 894 (298)
the Sensex by 3.1%. While Tata Steel, SAIL and Jindal Steel were up by
Net 2,603 3,597 (995)
5.3%, 4.2% and 2.5%, respectively, as steel prices are expected to firm up in
the coming months, JSW Steel was up 8.8% on media reports that the
announcement of stake sale to JFE may conclude next week. Sesa Goa also Global Indices
witnessed an appreciation of 6.3% during the week as it reported strong Indices July July Weekly YTD
quarterly numbers, but NMDC was down 1.8% due to the ongoing Naxal 16, 10 23, 10 (% chg)
issue in the Dantewada region. On the non-ferrous front, Hindalco led the BSE 30 17,956 18,131 1.0 3.8
appreciation by 5.3% followed by Sterlite Ind, Hindustan Zinc and Nalco NSE 5394 5449 1.0 4.8
gaining 4.7%, 1.8% and 0.1%, respectively, as metal prices at the LME Nasdaq 2,179 2,269 4.1 0.0
rebounded. Our top picks in the sector are Tata Steel, JSW Steel, Hindalco,
DOW 10,098 10,425 3.2 (0.0)
Sterlite and Hindustan Zinc.
Nikkei 9,408 9,431 0.2 (10.6)
Inside This Weekly HangSeng 20,250 20,815 2.8 (4.8)
Straits Times 2,958 2,973 0.5 2.6
RBI Policy Preview: In the coming Monetary Policy, the RBI’s priority would
Policy Preview:
Shanghai Composite 2,424 2,572 6.1 (21.5)
be to focus on controlling inflation using monetary policy tools. We expect
KLSE Composite 1,337 1,346 0.7 5.7
the RBI to hike repo and reverse repo rates by 25bp each to 5.75% and
Jakarta Composite 2,992 3,042 1.7 20.0
4.25%, respectively. However, considering the current liquidity situation, we
KOSPI Composite 1,738 1,758 1.1 4.5
do not expect a CRR hike in the coming policy.
Bajaj Auto - 1QFY2011 Result Update: Bajaj Auto (BAL) posted strong set
Sectoral Watch
of numbers for 1QFY2011. The company's top line was in line with our
Indices July July Weekly YTD
expectations, while bottom line was above our estimates because of higher
16, 10 23, 10 (% chg)
other income. High growth was also aided by higher operating leverage
BANKEX 11,396 11,491 0.8 14.6
and robust volume growth in the domestic as well as export markets. Capacity
BSE AUTO 8,337 8,413 0.9 13.1
constraints, however, restricted volume growth to a certain extent. We
BSE IT 5,459 5,473 0.3 5.5
Target Price
recommend Accumulate on BAL with a Target Price of Rs2,762.
BSE PSU 9,389 9,527 1.5 (0.1)
HDFC Bank -1QFY2011 Result Update: HDFC Bank reported net profit
growth of 33.9% yoy and a decline of 3% sequentially to Rs812cr, close to
our estimate of Rs806cr. A strong pick-up in advances and improvement in
asset quality were the key highlights of the result. We recommend Buy on
the stock.
Note: Stock Prices are as on Report release date; Refer all Detailed Reports on Angel website.
Please refer to important disclosures at the end of this report
2. Fundamental Focus | July 24, 2010
Focus
RBI Policy Preview
RBI to continue its calibrated tightening
Signs of a revival in growth momentum are increasing, with IIP products, among others-indicating that inflation is becoming
growth at 11.5% in May 2010. At the same time, food inflation more broad-based. Therefore, monetary tightening to anchor
(12.6% yoy) has taken the overall WPI in double digits at 10.6%. inflation expectations is appropriate at this juncture.
We believe the engines of growth are clearly shifting from Over the next few months, we expect inflation to moderate from
government-driven consumption to risk capital-driven private the peak levels seen in the recent months. However, the RBI has
consumption and investments. Hence, the RBI's priority would noted certain upside risks to inflation such as International
be to focus on controlling inflation using monetary policy tools. commodity prices, revival in private consumption demand.
Accordingly,
Accordingly, we expect the RBI to hike repo and reverse repo
However, it should be noted that interest rates are well below
respectively. However,
rates by 25bp each to 5.75% and 4.25%, respectively. However,
peak levels, leaving ample scope for gradual monetary
considering the current liquidity situation, we do not expect a
tightening, without adversely affecting the growth outlook.
policy.
CRR hike in the coming policy.
Credit growth back; interest rates to rise but unlikely to hurt
To this end, looking at the level of headline inflation, which is
growth momentum: As on July 2, 2010, the yoy growth rate in
clearly above the RBI's target of 5.5%, as well as strong uptick
credit increased to 21.7% compared to 10% in October 2009.
in credit growth in the last few months, we believe the RBI may
Banks have incrementally lent Rs1,61,000cr YTD in FY2011
find it prudent to continue the process of gradual domestic
(compared to a meager Rs20,000cr during the corresponding
monetary tightening, with an increase in repo and reverse repo
period last year). At the same time, deposit growth has declined
rates. It should be kept in mind that the withdrawal of monetary
to 14.9% yoy compared to 22.0% yoy during the corresponding
accommodation (including repo/reverse repo rates) will be
period last year. Though some banks increased their retail fixed
gradual, likely over a couple of years and unlikely to stifle credit
deposit rates (in most cases by 25bp) in 1QFY2011, they
demand until monetary accommodation reaches an advanced
continue to be unattractive for depositors, leading to a gap
state (at least 150-200bp above the current levels). Thus, we
between savings and investments, which is being plugged by
expect repo and reverse repo rates to reach 7.0% and 6.5%,
the high current account deficit at present.
respectively,
respectively, by end-FY2011.
Banking sector outlook: The expected increase in interest rates
Focus on anchoring inflationary expectations: Until February
will not affect the sector negatively, as it will be outweighed by
2010, food and textiles contributed as much as 70% of the
acceleration in core earnings growth on the back of
overall 9.9% WPI inflation, on account of the drought-driven
improvement in credit growth and fee income coupled with a
increase in prices of food grains, sugar and cotton, among
sharp reduction in NPA losses. However, on a relative basis, we
others. By June 2010, their contribution to the 10.6% WPI,
continue to prefer banks with a high CASA ratio and a lower-
though on a downward trend, was still high at 51%. Oil
duration investment book, given the rising interest rate scenario.
continued to contribute 11% to overall inflation, though this is
likely to increase in the coming weeks due to the hike in petrol Among large banks, our top picks include HDFC Bank, ICICI
and diesel prices. Contribution of other items (having 50% Bank, Axis Bank and SBI on account of their stronger core
weightage in the WPI index) had increased to 39% in June 2010 competitiveness and likelihood of credit market share gains
due to increased prices of coal, metals, electricity and wood because of strong capital adequacy as well as CASA market
share gains due to strong branch expansion. Among mid-cap
WPI (food v/s non-food) PSUs, we like Dena Bank because of its structurally strong CASA
Inflation (yoy) Weightage % contribution
ratio relative to its peers. We are also positive on Uco Bank,
in WPI Index to current WPI
which is trading at 30% discount to its peers. We expect a
Food & Textiles 12.4 43 50
directional improvement in core operating income to lead to
Oil 16.2 7 11
re-rating of the stock.
Others 8.2 50 39
Current WPI 10.6
Source: Bloomberg, Angel Research; Note: As on June 2010
Research Analyst - Vaibhav Agrawal/Amit Rane/Shrinivas Bhutda
For Private Circulation Only | Angel Broking Ltd: BSE Sebi Regn No : INB 010996539 / CDSL Regn No: IN - DP - CDSL - 234 - 2004 / PMS Regn Code: PM/INP00000154 6 Angel Securities Ltd:BSE: INB010994639/INF010994639 NSE: INB230994635/INF230994635 Membership numbers: BSE 028/NSE:09946 2
3. Fundamental Focus | July 24, 2010
Focus
Automotive Axles - Buy Price - Rs491
Target Price - Rs578
3QSY2010 Results Update
Performance Highlights (Rs4.6cr) and 123bp rise in the tax rate, largely driven by
significant operating margin expansion. Lower interest cost of
Y/E Sept 3QSY10 3QSY09 % chg Angel % chg
Rs0.7cr (Rs1.3cr) also aided bottom-line growth to a certain
(Rs cr) (qoq) Est. (yoy)
Net Sales 196.2 65.9 197.7 175.5 11.8 extent. The company continued its robust performance due to
Operating Profit 27.5 7.6 262.9 24.4 12.8 the ongoing recovery in the CV cycle and improved utilisation
OPM (%) 14.0 11.5 252bp 13.9 12bp levels.
PA
Reported PAT 14.6 2.7 442.3 12.8 13.2 Outlook and Valuation
Source: Company, Angel Research
We have revised our estimates: 1) ~7% upward revision in
Robust performance, Operating leverage aids high
revenue to account of robust top-line growth in 3QSY2010, 2)
bottom-line growth: For 3QSY2010, AAL registered 198% yoy
marginal increase in OPM on better operating leverage, and
growth in net sales to Rs196cr (Rs65.9cr), which was above
3) ~10% revision in earnings.
our expectation of Rs176cr. The company's top-line has been
recovering following the uptick in CV volumes. During the During SY2009-11E, we expect AAL to report 74% CAGR in
quarter, MHCV volumes recorded almost 80% yoy growth (AAL top-line (largely on volume growth) and have modeled in margin
derives almost 95% revenue from this segment), which helped expansion of about 160bp despite higher input costs aided by
the company to clock robust top-line growth. EBITDA margins higher operating leverage. Thus, in terms of earnings, we expect
came in almost in line with expectations at 14% for 3QSY2010, the company to register robust 145% CAGR over the same
up 252bp yoy. Better operating leverage helped the company period. Hence, we retain our Buy rating on the stock, with a
clock higher EBITDA margins. Net profit spiked to Rs14.6cr, up target price of Rs578 (based on 15x FY2012E EPS in line with
442% yoy on a low base and higher operating leverage. its historical valuation).
Sales up 198% yoy, above expectations: AAL posted robust
yoy,
top-line growth of 198% yoy to Rs196cr (Rs66cr), above our
estimate of Rs176cr. The company's top-line has been recovering
following the uptick in CV volumes. During the quarter, MHCV Key Financials
volumes recorded almost 80% yoy growth (AAL derives almost
Y/E Sept (Rs cr) SY2008 SY2009 SY2010E SY2011E
95% revenue from this segment), which helped the company to
Net Sales 746.0 266.3 686.4 805.0
clock robust top-line growth during 3QSY2010.
% chg 22.9 (64.3) 157.8 17.3
OPM at 14.0%, up by 252bp yoy on improved operating
Profit
Net Profit 55.8 9.7 49.4 58.2
leverage: In 3QSY2010, the company's performance on the
operating front exceeded our expectation largely owing to % chg 4.0 (82.7) 411.8 17.8
improved operating leverage. During 3QSY2010, AAL OPM (%) 14.3 12.0 13.7 13.6
witnessed a 252bp yoy increase in EBITDA margins on account EPS (Rs) 36.9 6.4 32.7 38.5
of improved operating leverage, primarily due to the 327bp
P/E (x) 13.3 76.8 15.0 12.7
yoy fall in staff costs. Raw material costs and other expenditure,
P/BV (x) 4.4 4.2 3.6 3.1
however, increased by 45bp and 30bp yoy, respectively. Raw
material accounted for about 70% (69.6%) of sales. Overall, RoE (%) 37.8 5.6 25.9 25.9
AAL clocked 263% yoy growth in operating profit for 3QSY2010. RoCE (%) 34.6 5.5 30.4 32.4
Net profit at Rs14.6cr beats estimates: Net profit stood at EV/Sales (x) 0.9 2.7 0.9 0.8
Rs14.6cr in 3QSY2010, up 442% yoy and beat our estimates EV/EBITDA (x) 7.4 24.4 7.4 6.2
by 13% despite the 16.2% jump in depreciation to Rs5.4cr Source: Company, Angel Research; Price as on July 20, 2010
Research Analyst - Vaishali Jajoo/Yaresh Kothari
For Private Circulation Only | Angel Broking Ltd: BSE Sebi Regn No : INB 010996539 / CDSL Regn No: IN - DP - CDSL - 234 - 2004 / PMS Regn Code: PM/INP00000154 6 Angel Securities Ltd:BSE: INB010994639/INF010994639 NSE: INB230994635/INF230994635 Membership numbers: BSE 028/NSE:09946 3
4. Fundamental Focus | July 24, 2010
Focus
Bajaj Auto - Accumulate Price - Rs2,469
Target Price - Rs2,762
1QFY2011 Result Update
Performance Highlights better than the industry at the operating front. Thus, overall,
the operating profit for the quarter increased by 70.6% yoy to
Y/E March 1QFY11 1QFY10 (qoq) Angel %
Rs777cr (Rs455cr), which largely came in line with our estimates.
(Rs cr) % chg Est. Diff.
Diff.
Net sales 3,890 2,338 66.4 3,870 0.5 Bottom line at Rs590cr, beats estimates: BAL recorded net profit
Rs590cr,
Operating profit 777 455 70.6 780 (0.4) growth of 101% yoy to Rs590cr (Rs294cr), which was higher
EBITDA (%) 20 19 50bp 20 (18)bp
than our expectation by 12%, primarily owing to higher other
Reported PAT
eported PA 590 294 101.1 527 12.0
Source: Company, Angel Research
income of Rs81.7cr (Rs23.1cr). Other income comprised
treasury income earned on liquid assets of ~Rs3,700cr. Further,
Top line marginally above expectations, volumes up by 70%: improved operating leverage, lower depreciation, reduced tax
BAL reported 66.4% yoy jump in top line to Rs3,890cr rate and a dip in exceptional items (VRS expenditure), on a yoy
(Rs2,338cr), mainly driven by the substantial 70% yoy increase basis, aided bottom-line growth.
in total volumes. Discover 100 and Pulsar have been the primary
game-changer brands for BAL. Average realisation recorded a
Outlook and Valuation
decline of about 2.4% yoy during the quarter, primarily due to We maintain our positive stance on BAL. We revise our estimates
higher contribution of low-end bikes (Discover) in the sales mix. upward to account 1) higher other operating income (higher
export incentives) 2) higher operating margin and 3) higher
The company's domestic motorcycle sales grew 71% (as against
other income on increased liquid investments. At the CMP of
the industry growth of 24%) in 1QFY2011. Higher sales in the
Rs2,469, the stock is trading at 14.3x FY2012E earnings, in.
three-wheeler segment at 99,918 units (63,242) also supported
Target Price
We recommend Accumulate on BAL with a Target Price of
healthy revenue growth. BAL exported 323,899 (178,295)
Rs2,762.
vehicles, an increase of 81.7% yoy in 1QFY2011. During the
quarter, production constraints limited sales to a certain extent.
The company expects motorcycle capacity of 300,000units/
month to go on stream from 2QFY2011.
In terms of volume market share, the company improved its Key Financials
position in the two-wheeler category by 524bp yoy to 20.8% Y/E March (Rs cr) FY2009 FY2010 FY2011E FY2012E
(15.5%) in 1QFY2011, largely owing to a 745bp yoy increase
Net sales 8,810 11,921 15,926 17,859
in the motorcycle segment's market share to 27% (19.5%).
% chg (2.3) 35.3 33.6 12.1
However, the three-wheeler segment's market share declined
to 36.4% (41.2%) in 1QFY2011. Adj. net profit 769 1,784 2,251 2,497
% chg (4.9) 132.0 26.1 11.0
EBITDA expands marginally by 50bp: During 1QFY2011, BAL's
EBITDA
operating margin expanded marginally by 50bp yoy to 20%, OPM (%) 11.1 20.2 19.5 19.0
largely in line with our estimates. However, the company Adj. EPS (Rs) 53.2 117.7 155.6 172.6
reported a 289bp qoq decline in EBITDA margin, largely on P/E (x) 46.4 21.0 15.9 14.3
account of the 275bp qoq increase in raw-material costs, which
P/BV (x) 19.1 12.2 8.1 5.9
accounted for 67.9% of net sales.
RoE (%) 44.5 74.4 61.3 47.9
The increase in margin on a yoy basis was on account of a
RoCE (%) 26.7 58.8 59.1 49.4
decline in other expenditure and staff costs by 158bp and
392bp, respectively, during the quarter. Higher volumes of EV/Sales (x) 3.9 2.7 1.9 1.6
sportier motorcycles, effective cost management and focused EV/EBITDA (x) 36.0 13.7 10.2 8.8
sales promotional activities helped the company to perform Source: Company, Angel Research; Price as on July 23, 2010
Research Analyst - Vaishali Jajoo/Yaresh Kothari
For Private Circulation Only | Angel Broking Ltd: BSE Sebi Regn No : INB 010996539 / CDSL Regn No: IN - DP - CDSL - 234 - 2004 / PMS Regn Code: PM/INP00000154 6 Angel Securities Ltd:BSE: INB010994639/INF010994639 NSE: INB230994635/INF230994635 Membership numbers: BSE 028/NSE:09946 4
5. Fundamental Focus | July 24, 2010
Focus
Crompton Greaves - Accumulate Price - Rs283
Target Price - Rs307
1QFY2011 Result Update
Performance Highlights Ongoing weakness in power segment: The power systems
segment continued to stagnate and extended its lacklustre
Y/E March 1QFY11 1QFY10 (qoq) 4QFY10 % chg
performance from the previous quarter owing to muted outlook
(Rs cr) % chg (yoy)
from the overseas markets. On a standalone basis, the segment
Net Sales 2,302 2,198 4.7 2,508 (8.2)
posted flattish yoy growth at Rs510cr (Rs508.4cr) mainly due
EBITDA 297 248 19.8 403 (26.3)
to the delayed off-take of power transformers and switchgears
EBITDA (%) 12.9 11.3 16.1
by both the public as well as private sector customers.
PAT 190.8 160.3 19.5 307 (37.7)
Management expects the backlog to be cleared over the next
Source: Company, Angel Research
two quarters. On a consolidated basis, the segment de-grew
Crompton Greaves (CG) posted 4.7% yoy growth in by 1.9% to Rs1,456.4cr (Rs1,483.7cr) on account of the
consolidated top-line to Rs2,302cr (Rs2,192cr) for 1QFY2011, depressed performance by its overseas business, mainly the
which was slightly below our expectations. While the consumer international power systems segment. Nonetheless, on a
products and industrial systems segments continued to register consolidated basis, the segment margin improved by 120bp
robust growth, the power systems segment remained depressed, yoy to 10.6% (9.4%) on the back of better margins registered
witnessing a drop in the quarterly revenues. by both the standalone as well as overseas entities.
Better margins lead to increased profitability: On the operating Outlook and Valuation
front, consolidated EBITDA increased by 19.8% yoy to Rs297.3cr
(Rs247.6cr), which was in line with our estimates. EBITDA margin CG is one of the leading players in the power transmission
witnessed an expansion of 160bp yoy to 12.9% (11.3%) during and distribution (T&D) space in India. During FY2010-12E,
the quarter mainly due to lower other expenses that fell to 12.5% we expect the company to register top-line and bottom-line
(13.9%) of net sales. Raw material cost, as a percentage of net CAGR of 11.4% and 7%, respectively. At the current price, the
sales, fell by 20bp yoy to 61.6% (61.8%). Interest cost remained stock is quoting at 20.6x and 18.3x FY2011E and FY2012E
nearly flat on a yoy basis, while other income dipped by 25% EPS, respectively. We recommend an Accumulate on the stock,
yoy to Rs18cr (Rs24cr). Improved operational efficiencies with a Target Price of Rs307.
Target Price
coupled with lower interest costs aided bottom-line growth. For Key Financials (Consolidated)
1QFY2011, net profit grew 19.5% yoy to Rs190.8cr (Rs160.3cr), Y/E March (Rs cr) FY2009 FY2010 FY2011E FY2012E
which was in line in our estimates. Net Sales 8,737 9,141 10,068 11,354
Domestic business aiding growth: While CG's consolidated % chg 27.9 4.6 10.1 12.8
revenues posted a moderate growth of 4.7% on a yoy basis, it Profit
Net Profit 560 860 882 986
clocked 14.5% yoy growth in standalone top-line to Rs1,343cr
% chg 37.7 53.6 2.5 11.8
(Rs1,173cr). This was mainly attributable to the healthy
performance recorded by its consumer products and industrial EBITDA (%) 11.4 14.0 13.7 13.3
systems segments. On a standalone basis, the consumer EPS (Rs) 8.7 13.4 13.7 15.4
products segment grew by 29% yoy to Rs532cr (Rs413cr) with P/E (x) 27.8 18.1 20.6 18.3
operating margins expanding by 90bp to 15.0% (14.1%). The
P/BV (x) 8.6 6.3 4.8 3.8
growth came mainly on account of the strong performance
RoE (%) 36.1 39.9 30.9 27.3
witnessed in the domestic market. The industrial segment, on a
standalone basis, also reported revenue growth of 22% yoy to RoCE (%) 27.5 31.5 29.0 27.1
Rs311cr (Rs254cr) owing to healthy demand for motors and EV/Sales (x) 1.8 1.7 1.5 1.3
rail transport equipment. Operating margin of this segment EV/EBITDA (x) 15.7 12.0 10.8 9.5
gained by 60bp yoy to 20.6%. The revival in the domestic sector Source: Company, Angel Research; Price as on July 21, 2010
augured well for the segment.
Research Analyst - Hemang Thaker
For Private Circulation Only | Angel Broking Ltd: BSE Sebi Regn No : INB 010996539 / CDSL Regn No: IN - DP - CDSL - 234 - 2004 / PMS Regn Code: PM/INP00000154 6 Angel Securities Ltd:BSE: INB010994639/INF010994639 NSE: INB230994635/INF230994635 Membership numbers: BSE 028/NSE:09946 5
6. Fundamental Focus | July 24, 2010
Focus
FAG Bearing - Buy Price - Rs760
Target Price - Rs931
2QCY2010 Result Update
Performance Highlights aided the robust growth in net profit to a certain extent and
helped the company to register NPM of 12.4% (9.2%).
Y/E Dec 2QCY10 2QCY09 % chg Angel %
(Rs cr) (qoq) Est. Diff Outlook and Valuation
Net Sales 273 202 34.7 244 11.9
We have revised our estimates upward: 1) ~9% upward revision
Operating Profit 52 31 66.3 37 42.1
OPM (%) 19 15 364bp 16 363bp in revenue to account of robust top-line growth in 2QCY2010,
PA
Reported PAT 34 19 81.6 22 53.3 2) higher OPM on better operating leverage, and 3) ~30%
Company, Angel Research revision in earnings. We believe that the recovery in auto
demand will aid the company in registering a CAGR of around
Quarterly performance beats estimates: For 2QCY2010, net
20% in net sales and 33% in net profit over CY2009-11E.
sales grew 34.7% yoy to Rs273cr (Rs202cr) exceeding our
expectation of Rs244cr. This was largely driven by the substantial The stock is currently trading at 10.7x CY2010E and 9.8x
jump in overall auto volumes and sharp recovery in the industrial CY2011E EPS. At our Target multiple of 12x, we have arrived
bearings segment. EBITDA margin expanded by a significant at a Target Price of Rs931. Further, FAG scores well over its
364bp yoy to 19.1% (15.5%) basically due to decrease in raw peers and we believe that it is a good long-term investment
material costs by 558bp during the quarter and better operating pick, in view of its strong fundamentals. We maintain a Buy
leverage. Bottom-line spiked 81.6% yoy to Rs33.8cr (Rs18.6cr) rating on the stock.
on robust top-line growth and improvement in operating
performance. Higher other income and lower tax rate also aided
net profit growth, which helped FAG register NPM of 12.4%
(9.2%).
Top-line surges on robust auto growth and increase in industrial
op-line
segment: For 2QCY2010, the company's net sales grew 34.7%
yoy to Rs273cr (Rs202cr) above our expectation of Rs244cr.
This was largely driven by a substantial jump in overall auto
Key Financials
volumes and sharp recovery in the industrial bearing segment.
Y/E Dec (Rs cr) CY2008 CY2009 CY2010E CY2011E
Overall pickup in economic activities helped the company to
clock robust top-line growth. The company is operating at almost Net Sales 762 820 1,049 1,185
100% utilisation levels, which poses a risk of capacity constraints % chg 17.0 7.6 27.9 12.9
going forward if demand continues to be strong. Profit
Net Profit 98.6 73.1 117.8 129.0
Margins up by 364bp on lower input cost: EBITDA margin % chg 24.3 (25.9) 61.2 9.4
expanded by a substantial 364bp yoy to 19.1% (15.5%) basically OPM (%) 21.3 13.6 18.3 18.0
due to decrease in raw material costs by 558bp during the
EPS (Rs) 57.6 39.4 70.9 77.6
quarter. Further, better operating leverage helped 29bp yoy
P/E (x) 13.2 19.3 10.7 9.8
reduction in staff costs during the quarter. Other expenses,
however, increased marginally by 18b yoy to 13.5%. Overall, P/BV (x) 3.1 2.7 2.2 1.9
operating profit increased substantially by 66.3% to Rs52cr RoE (%) 26.5 15.1 22.9 20.6
(Rs31cr), beating our expectation by 42%. Bottom-line up 81.6%, RoCE (%) 38.6 20.8 32.6 29.7
beats estimates: For 2QCY2010, FAG registered 81.6% yoy
EV/Sales (x) 1.5 1.3 0.9 0.8
increase in bottom-line to Rs33.8cr (Rs18.6cr) largely on account
of robust top-line growth and substantial jump in operating EV/EBITDA (x) 7.4 9.8 5.4 4.6
performance. Further, higher other income and lower tax rate Source: Company, Angel Research; Price as on July 23, 2010
Research Analyst - Vaishali Jajoo/Yaresh Kothari
For Private Circulation Only | Angel Broking Ltd: BSE Sebi Regn No : INB 010996539 / CDSL Regn No: IN - DP - CDSL - 234 - 2004 / PMS Regn Code: PM/INP00000154 6 Angel Securities Ltd:BSE: INB010994639/INF010994639 NSE: INB230994635/INF230994635 Membership numbers: BSE 028/NSE:09946 6
7. Fundamental Focus | July 24, 2010
Focus
HDFC Bank - Buy Price - Rs2,050
Target Price - Rs2,514
1QFY2011 Result Update
Performance Highlights forward. During 1QFY2011, the bank also provided for certain
non-recurring provisions such as contingency provision for
Particulars 1QFY11 4QFY10 % chg 1QFY10 % chg indirect Forex exposures of Rs76cr and provisions worth Rs67cr
(Rs cr) (qoq) (yoy)
related to premises.
Net Interest Income 2,401 2,351 2.1 1,856 29.4
Pre-Prov. Profit 1,749 1,694 3.2 1,519 15.1 Outlook and Valuation
PAT 812 837 (3.0) 606 33.9
We believe HDFC Bank is among the most competitive banks
Source: Company, Angel Research
in the sector, with an A-list management team that has one of
Strong business growth with profitability: Advances registered the best track records in the sector. At Rs2,050, the stock is
robust growth of 40.2% yoy. The quarter also witnessed an trading at 17.1x FY2012E EPS of Rs120 and 3.3x FY2012E
increase in short-term wholesale loans, which accounted for ABV of Rs629. We believe HDFC Bank is once again positioned
around 10% of the overall loan growth. The retail loan book for a high qualitative growth trajectory, with the CASA and
grew by 24.4% yoy during 1QFY2011. cost-to-income ratios returning to pre-CBoP levels. In our view,
Deposits reached Rs1,83,033cr in 1QFY2011, up 25.6% yoy. with its strong capital adequacy and substantial branch
The CASA ratio stood at 49.2% of total deposits during expansion, the bank is set to further gain CASA market share
1QFY2011 (45.0% in 1QFY2010 & 52.0% in 4QFY2010). and achieve strong growth in fee income, as the economic
Reported NIMs declined to 4.3% in 1QFY2011, as against 4.4% environment continues to improve. HDFC Bank has commanded
in 4QFY2010, mainly on account of payment of interest on a 32.8 premium to the Sensex in terms of its one-year forward
savings balances on a daily basis. P/E multiple over the last five years. We expect the premium to
be around its historical average on account of the bank's robust
Strong capital adequacy and branch expansion to drive CASA
growth and RoE prospects over the next two years. On the basis
and credit market share gains, respectively: CASA deposits
of the increase in Sensex valuations and our 17x target FY2012E
grew 37.4% yoy and 3.4% sequentially, driven by 33.8% yoy
P/E multiple for the Sensex, we are also increasing our target
growth in current deposits and 40% yoy growth in savings
multiple for HDFC Bank. We now value the stock at 4.0x
deposits. The cost-to-income ratio of the bank improved 28bp
FY2012E ABV of Rs629 to arrive at a target price of Rs2,514,
sequentially at 47.7% in 1QFY2011 as compared to 48% in
implying an upside of 23%. Hence, we recommend a Buy on
4QFY2010. The bank plans to open 150 branches during
the stock.
FY2011. Against this backdrop, we expect the bank to sustain
a CASA ratio in the 49-52% range, going forward. Key Financials
The bank's total capital adequacy remained strong at 16.3%, Y/E March (Rs cr) FY2009 FY2010 FY2011E FY2012E
with Tier-1 constituting 76.1% of the total CAR. The bank has NII (Rs cr) 7,421 8,387 10,523 13,552
sufficient CAR to grow its advances by 5-8% above the industry's % chg 42.0 13.0 25.5 28.8
average growth over FY2011-12E.
Profit
Net Profit (Rs cr) 2,245 2,949 3,915 5,490
Robust asset quality: The bank's asset quality improved % chg 41.2 31.3 32.8 40.2
sequentially, with gross NPAs at 1.2% (1.4% in 4QFY2010) and
NIM (%) 4.9 4.3 4.3 4.4
net NPAs at 0.3% (0.3% in 4QFY2010). The NPA coverage
ratio atood at 77% in 1QFY2011 (78.4% in 4QFY2010 and EPS (Rs) 52.8 64.4 85.5 119.9
70% in 1QFY2010). Total restructured assets were 0.3% of gross P/E (x) 39.0 32.0 24.0 17.1
advances, which is among the lowest in the sector. P/ABV (x) 5.9 4.4 3.8 3.3
Total provisions during 1QFY2011 stood at Rs555cr, of which RoA (%) 1.4 1.5 1.6 1.7
Rs365cr was towards NPAs. We expect the bank to expand its
RoE (%) 16.9 16.1 17.0 20.6
provision coverage by increasing its floating provisions, going
Source: Company, Angel Research; Price as on July 19, 2010
Research Analyst - Vaibhav Agrawal/Amit Rane/Shrinivas Bhutda
For Private Circulation Only | Angel Broking Ltd: BSE Sebi Regn No : INB 010996539 / CDSL Regn No: IN - DP - CDSL - 234 - 2004 / PMS Regn Code: PM/INP00000154 6 Angel Securities Ltd:BSE: INB010994639/INF010994639 NSE: INB230994635/INF230994635 Membership numbers: BSE 028/NSE:09946 7
8. Fundamental Focus | July 24, 2010
Focus
Infotech Enterprises - Accumulate Price - Rs173
Target Price - Rs192
1QFY2011 Result Update
Performance Highlights nuclear energy related network) projects are expected to see
strong ramp up over the next few years. Through Seawell, the
Y/E March 1QFY11 4QFY10 (qoq) 1QFY10 % chg
company is looking at business engagements in the size of
(Rs cr) % chg (yoy)
Net Revenues 253 244 3.6 233 8.7 US $150-200mn to be executed over the next 18 months.
EBIDTA Margins (%) 16.0 21.6 (5.6) 22.5 (6.5) Outlook and Valuation
PAT 33 51 (35.9) 46 (28.9)
Source: Company, Angel Research The company expects volume backed growth in the EMI and
UTG segments, which would be mostly back-ended in FY2011E
spoilt-
Strong volume led growth with adverse currency playing spoilt-
with pricing remaining stable. The company targets to maintain
sport: For 1QFY2011, Infotech Enterprises (IEL) reported 3.6%
its EBIDTA margins at ~18% in FY2011E. The UTG vertical,
qoq growth in top-line to Rs253cr, in rupee terms, backed by
which is currently seeing some downtick, is expected to witness
qoq volume growth of 2% and 10.6% in utility, telecom and
some improvement as the company plans to provide new service
government (UTG) and the engineering and mechanical (EMI)
offerings through acquisition of strategic fits.
segments, respectively. IEL added 12 new customers, 6 each in
the UTG and EMI segments with the top-10 clients witnessing We expect Infotech to record 15.2% CAGR in top-line over
1.6% qoq (14.2% yoy) growth. Geography-wise, the growth FY2010-12E, while bottom-line is estimated to clock subdued
was backed by the 12.4% and 6.2% qoq growth logged by CAGR of 2% mainly on account of the expected adverse currency
North America and Asia-Australia regions. Europe however, impact and increase in personnel costs. We recommend an
witnessed de-growth of 6.8% qoq. The company made net Target Price
Accumulate on the stock, with a Target Price of Rs192, valuing
employee addition of 32 taking the total headcount to 7,669 the stock at 12x FY2012E EPS of Rs16 similar to its historical
as on 1QFY2011. During the quarter, the company commenced average PE of 12x during FY2005-10, implying an upside of
operations at the new 500 seat facility in Visakhapatnam, which 11% from current levels.
is IEL's first development centre in the SEZ. On the operating
margin front, the adverse currency impact and salary hikes given Key Financials (Consolidated)
during the quarter negatively impacted EBIDTA margins by Y/E March (Rs cr) FY2009 FY2010 FY2011E FY2012E
558bp qoq. Thus, primarily on account of lower operational Net Sales 890 953 1,095 1,264
profitability and other income as well as the increase in tax rate
% chg 32.0 7.1 14.9 15.4
from 17.5% in 4QFY2010 to 20.2% in 1QFY2011, net profit
Profit
Net Profit 92 171 154 178
fell by 35.9% qoq to Rs33cr.
% chg 8.4 84.7 (10.1) 15.6
Strong prospects expected in EMI segment: IEL is witnessing
EBIT Margin (%) 20.1 21.9 18.2 18.0
strong deal pipeline from the Asia-Pacific and North America
geographies. In the EMI segment, IEL is expected to witness FDEPS (Rs)* 8.7 15.5 13.9 16.1
good ramp up with a strong demand pipeline being witnessed P/E (x) 19.9 11.2 12.4 10.8
by all clients in the aerospace vertical. Further, in this segment P/BV (x) 1.2 1.0 1.7 1.5
the company is also working on few anchor deals to be ramped
RoE (%) 12.8 20.1 14.9 14.7
up in the automotive vertical, while the hi-tech vertical though
currently suffering from negative macro-economic indicators is RoCE (%) 17.7 19.2 14.8 14.5
expected to witness healthy growth. Some of the new long- EV/Sales (x) 0.6 0.5 1.1 0.8
term projects in the EMI segment, viz. the Hamilton Sunstrand, EV/EBITDA (x) 3.0 2.3 6.0 4.7
Seawell (engineering support services for its drilling operations) Source: Company, Angel Research; Price as on July 21, 2010; Note: *FDEPS
and the recently signed US-based Westinghouse (for providing for FY2009 and FY2010 is based on post-bonus issue (1:1bonus effective
from June'10)
Research Analyst - Vibha Salvi
For Private Circulation Only | Angel Broking Ltd: BSE Sebi Regn No : INB 010996539 / CDSL Regn No: IN - DP - CDSL - 234 - 2004 / PMS Regn Code: PM/INP00000154 6 Angel Securities Ltd:BSE: INB010994639/INF010994639 NSE: INB230994635/INF230994635 Membership numbers: BSE 028/NSE:09946 8
9. Fundamental Focus | July 24, 2010
Focus
PTC India - Buy Price - Rs113
Target Price - Rs136
1QFY2011 Result Update
Performance Highlights line over FY2010-12E, following the commissioning of new
power projects. We estimate the company's bottom line to
Y/E March 1QFY11 4QFY10 (qoq) 1QFY10 % chg
register a 43.1% CAGR over FY2010-12E.
(Rs cr) % chg (yoy)
Net revenue 2,758 1,243 121.8 2,373 16.3 At the CMP of Rs113, PTC is trading at 22.2x FY2011E and
Operating profit 28 9 194.2 15 85.3 17.2x FY2012E earnings. We have arrived at an SOTP fair value
Net profit 28 14 100.5 33 (16.7) of Rs136 for PTC, wherein we have assigned P/E of 10x FY2012E
Source: Company, Angel Research earnings from the core trading business (Rs65.2/share), while
investments in PTC-FS, Teesta Urja, Krishna Godawari and
PTC India (PTC) reported impressive results on the operating
Athena Energy Ventures have been valued at a P/BV of 1x
front in 1QFY2011, registering 85.3% yoy growth in operating
FY2012E (Rs49.4/share). The cash and liquid investments in
profit to Rs27.8cr. Growth was primarily driven by robust 36.7%
the company's books are valued at a P/BV of 1x FY2012E
yoy growth in sales volume to 5,747MU. The improvement in
(Rs21.1/share). Accordingly, we maintain our Buy
Accordingly,
sales was aided by a substantial increase in power traded under
recommendation on the stock.
the long-term route and from captive power plants. Going
ahead, we expect the company's trading volume to be boosted
by additional volumes from the long-term route, with 4,500MW
of projects for which PPAs have been signed getting operational
during FY2011-12. The company's operating margin is also
expected to expand going ahead, as old contracts on which
trading margins were charged at lower 4 paise/unit would be
renegotiated at higher trading margins of 7 paise/unit.
Increased trading volume boosts top line: PTC's 1QFY2011
top line grew by 16.3% yoy to Rs2,758cr due to a substantial
36.7% yoy increase in trading volume to 5,747MU. The
company's OPM improved by 40bp yoy to 1%, aided by Key Financials
increased cap on short-term trading margins to 7 paise/unit. Y/E March (Rs cr) FY2009 FY2010 FY2011E FY2012E
However, on the bottom-line front, the company's net profit Net Sales 6,529 7,770 10,906 13,698
declined by 16.6% yoy to Rs27.8cr (Rs33.3cr) on account of
% chg 67.1 19.0 40.4 25.6
lower other income (down by 50% yoy to Rs13.8cr) and higher
Profit
Net Profit 90.8 93.9 148.9 192.2
tax expense. During 1QFY2010, the company booked the profit
out of the maturity of certain investments based on tax-free % chg 86.5 3.4 58.6 29.1
fixed maturity plans. OPM (%) 0.4 0.8 1.3 1.3
Outlook and Valuation EPS (Rs) 4.0 3.2 5.1 6.5
We believe PTC's emphasis on the LTT segment will help it in P/E (x) 28.2 35.2 22.2 17.2
sustaining higher growth, going ahead. During FY2010, STT P/BV (x) 1.7 1.6 1.5 1.4
constituted 50% of the total power traded by the company. PTC RoE (%) 6.0 5.2 7.0 8.6
proposes to increase its power trading mix to 70:30 in favour
RoCE (%) 1.3 3.2 6.0 7.3
of LTT. The company's increased focus on LTT is expected to
EV/Sales (x) 0.3 0.3 0.2 0.2
provide consistent cash flows compared to STT, as the number
of units generated is expected to be uniform, resulting in reduced EV/EBITDA (x) 74.1 32.0 17.1 15.3
volatility. We expect PTC to register a 32.7% CAGR in its top Source: Company, Angel Research; Price as on July 21, 2010
Research Analyst - Rupesh Sankhe/V Srinivasan
For Private Circulation Only | Angel Broking Ltd: BSE Sebi Regn No : INB 010996539 / CDSL Regn No: IN - DP - CDSL - 234 - 2004 / PMS Regn Code: PM/INP00000154 6 Angel Securities Ltd:BSE: INB010994639/INF010994639 NSE: INB230994635/INF230994635 Membership numbers: BSE 028/NSE:09946 9
10. Technical Picks | July 24, 2010
Bulls on a firm ground
Sensex (18131) / Nifty (5449)
In our previous Weekly report, we had mentioned that indices Exhibit 1: Sensex Daily chart
are likely to test 18500 - 18700 / 5500 - 5570 levels based on HT
the "Flag pattern" breakout on the Daily chart. The initial part HT
HB
of the week witnessed a sideways movement after which it made
HB
a new 52-week high of 18237 / 5476, which were close to the HT
HT
first target mentioned.
HB
The Sensex ended with net gains of 0.98%, whereas the Nifty HB
gained 1.02% vis-à-vis the previous week.
Pattern Formation
On the Daily chart we are witnessing continuation of
chart, Source: Falcon; Note: #HT: Higher Top, HB : Higher Bottom
higher- top higher-bottom formation. The recent higher bottom
at 17848 / 5354 is a crucial support level. As long as 17848 / Exhibit 2: Sensex Weekly chart
5354 holds, there is a possibility that indices could test the Channel
higher levels of 18500 - 18700 / 5500 - 5570. Any breakdown
below 17848 / 5354 would negate the formation and we could
see loss of momentum on the upside (refer Exhibit 1).
On the Weekly chart, the prices are very close to the upper
trendline of the channel where some résistance is likely to
emerge. Further, we are observing that the indices are close to
the 78.6% retracement levels of the preceding down-move that
started from 21000 to 7697 / 6357 to 2252 levels. These levels Source: Falcon
of 18315 / 5480 may act as a temporary resistance. Any closing
above 18315 / 5480 levels would warrant further up-move
(refer Exhibit 2).
Future Outlook
In view of continuation of higher-top higher-bottom formation
on the Daily chart, we expect the market to trade with a positive
bias in the coming week. The immediate short-term resistance
is at 18315 / 5480 levels, which is a 78.6% retracement level
of the entire down-move from 21000 to 7697 / 6357 to 2252
levels. Any close above these resistance levels would lead the
indices to test the “Flag pattern” targets of 18500 - 18700 /
5500 - 5570, which we have been mentioning since past three
weeks. Any break-down below the recent higher-bottom of
17848 / 5354 levels would negate the higher-top higher-bottom
formation and we could see loss of momentum on the upside.
Traders holding long positions should trail the stop loss to 5340
levels and trade with a positive bias as long as the markets
hold 5354 levels.
For Private Circulation Only | Angel Broking Ltd: BSE Sebi Regn No : INB 010996539 / CDSL Regn No: IN - DP - CDSL - 234 - 2004 / PMS Regn Code: PM/INP00000154 6 Angel Securities Ltd:BSE: INB010994639/INF010994639 NSE: INB230994635/INF230994635 Membership numbers: BSE 028/NSE:09946 10