SlideShare a Scribd company logo
1 of 12
Download to read offline
1QFY2011 Result Update | Banking
                                                                                                                        July 29, 2010


 Corporation Bank                                                                          NEUTRAL
 Performance Highlights                                                                    CMP                                    Rs569
                                                                                           Target Price                               -


 Y/E March (Rs cr)        1QFY11 4QFY10          % chg (qoq) 1QFY10         % chg (yoy)    Investment Period                           -
 NII                          698        640              9.0      468            49.2
 Pre-prov. profit             620        545             13.8      571             8.6     Stock Info
 PAT                          334        312              6.9      261            27.8     Sector                             Banking
 Source: Company, Angel Research                                                           Market Cap (Rs cr)                      8,163
                                                                                           Beta                                      0.7
 Corporation Bank announced its 1QFY2011 results, wherein the bank registered
 net profit growth of 27.8% on a yoy basis to Rs334cr, which is above our                  52 Week High / Low                590/336
 estimate of Rs264cr mainly because of better-than-estimated net interest income           Avg. Daily Volume                      14,689
 (NII) coupled with lower effective tax rate. Steady operating performance with
                                                                                           Face Value (Rs)                           10
 deterioration in asset quality was the key highlight of the result. We have a
 Neutral rating on the stock.                                                              BSE Sensex                             17,992
                                                                                           Nifty                                   5,409
 Better-than-expected NII growth: Advances and deposits grew 36.8% yoy and
 26.2% yoy, respectively. The CASA ratio dropped to 24.0% (from 28.5% in                   Reuters Code                      CPBK.BO
 4QFY2010, which included year-end floats). On the back of strong lending in               Bloomberg Code                   CRPBK@IN
 1QFY2011, the bank’s NII increased by 49.2% yoy and 9.0% qoq to Rs698cr
 from Rs640cr in 1QFY2010, driven by a 303bp sequential improvement in the
 CD ratio to 71.2%. Total non-interest income was down 25.9% yoy to Rs266cr               Shareholding Pattern (%)
 due to lower treasury gains. On the positive side, the bank continued its robust
 performance in non-interest income excluding treasury, which grew 45.3% yoy to            Promoters                                57.2
 Rs252.6cr. The asset quality was under pressure during the quarter with gross             MF / Banks / Indian Fls                  33.2
 NPAs increasing by 11.6% sequentially to Rs727cr. As a result of lower provision          FII / NRIs / OCBs                         4.1
 coverage, net NPAs increased by 39.8% sequentially to Rs276cr.
                                                                                           Indian Public / Others                    5.5
 Outlook and valuation: Within mid-cap PSU banks, we like Corporation Bank
 due to its efficient operations, reflected in low operating expenses as a
 percentage of average assets, healthy asset quality and proactive investments in
                                                                                           Abs. (%)              3m         1yr      3yr
 modern distribution and payment systems (relative to its peers). However, it will
 be difficult for the bank to maintain its growth trajectory due to a high-growth          Sensex                2.8    18.6        18.1
 base in NII and non-interest income during FY2010, especially in a rising interest        Corporation Bk        3.0    66.3        60.0
 rate environment. The bank’s relatively small, regional and urban-centric also
 operations temper its growth outlook, on the key competitive parameters of
 CASA and fee income. At the CMP, the stock is trading at 5.7x FY2012E EPS of
 Rs99.9 and 1.05x FY2012E ABV of Rs544, close to our target multiple of 1.10x
 FY2012E ABV. Hence, we have a Neutral view on the stock.

 Key Financials
 Y/E March (Rs cr)                   FY2009         FY2010        FY2011E      FY2012E
 NII                                   1,691          2,210         2,806         3,138
                                                                                          Vaibhav Agrawal
 % chg                                  17.2            30.7         27.0          11.8
                                                                                          022 – 4040 3800 Ext: 333
 Net Profit                              893           1170         1259          1433
                                                                                          vaibhav.agrawal@angeltrade.com
 % chg                                  21.5            31.1          7.6          13.8
 NIM (%)                                  2.3            2.3          2.4           2.2   Amit Rane
 EPS (Rs)                               62.2            81.6         87.8          99.9   022 – 4040 3800 Ext: 326
 P/E (x)                                  9.1            7.0          6.5           5.7   amitn.rane@angeltrade.com

 P/ABV (x)                                1.7            1.4          1.2           1.0
                                                                                          Shrinivas Bhutda
 RoA (%)                                  1.2            1.2          1.0           1.0
                                                                                          022 – 4040 3800 Ext: 316
 RoE (%)                                19.6            21.9         20.1          19.7
                                                                                          shrinivas.bhutda@angeltrade.com
 Source: Company, Angel Research


Please refer to important disclosures at the end of this report                                                                        1
Corporation Bank | 1QFY2011 Result Update


                Exhibit 1: 1QFY2011 performance
                Particulars (Rs cr)        1QFY11        4QFY10 % chg (qoq)    1QFY10 % chg (yoy)
                Interest earned               2,028        1,922        5.5      1742        16.4
                Interest expenses             1,330        1,282        3.7      1275         4.4
                NII                               698       640         9.0       468        49.2
                Non-interest income               266       273        (2.4)      359       (25.9)
                Total income                      964       912         5.6       827        16.5
                Operating expenses                343       367        (6.6)      256        34.3
                Pre-prov. profit                  620       545        13.8       571         8.6
                Provisions & cont.                127       165       (23.3)      155       (18.3)
                PBT                               494       380        30.0       416        18.6
                Prov. for taxes                   160        68       136.9       155         3.2
                PAT                               334       312         6.9       261        27.8
                EPS (Rs)                          23.3      21.8        6.9       18.2       27.8
                Cost-to-income ratio (%)          35.6      40.3                  30.9
                Effective tax rate (%)            32.4      17.8                  37.2
                Net NPA (%)                        0.4       0.3                   0.3
                Source: Company, Angel Research


                Exhibit 2: 1QFY2011 actual v/s Angel estimates
                Particulars (Rs cr)                          Actual        Estimates      Var. (%)
                NII                                            698              622          12.2
                Non-interest income                            266              259           2.8
                Total income                                   964              880           9.4
                Operating expenses                             343              310          10.7
                Pre-prov. profit                               620              570           8.8
                Provisions & cont.                             127              116           8.8
                PBT                                            494              454           8.8
                Prov. for taxes                                160              190         (15.8)
                PAT                                            334              264          26.5
                Source: Company, Angel Research

                Strong advances growth continues

                In line with the industry’s trend, Corporation Bank witnessed healthy business
                growth of 30.4% yoy to Rs1,55,840cr. Total deposits increased to Rs91,035cr,
                from Rs72,127cr as of 1QFY2010, recording 26.2% yoy growth. Advances growth
                shot up to 36.8% yoy in 1QFY2010, taking total advances to Rs64,805cr. The
                bank’s CASA ratio dropped to 24.0% (from 28.5% in 4QFY2010, which includes
                year-end floats). However, the bank aims to improve its CASA ratio to 26% by
                FY2011E.


July 29, 2010                                                                                    2
Corporation Bank | 1QFY2011 Result Update


                Exhibit 3: Trend in advances and deposits
                               Advances (LHS)                          Deposits (LHS)                              Credt-Deposit ratio (RHS)
                    (Rs cr)                                                                                                                                 (%)
                  100,000                                                                                                                                  76.0

                    80,000
                                                                                                                                                           72.0
                    60,000
                                                                                                                                                           68.0
                    40,000
                                                                                                                                                           64.0
                    20,000

                           -                                                                                                                               60.0


                                 3QFY08

                                          4QFY08

                                                     1QFY09

                                                              2QFY09

                                                                           3QFY09

                                                                                    4QFY09

                                                                                                      1QFY10

                                                                                                               2QFY10

                                                                                                                            3QFY10

                                                                                                                                     4QFY10

                                                                                                                                                1QFY11
                Source: Company, Angel Research


                Exhibit 4: Trend in deposits mix
                                                              CA            SA        Term Deposits
                   100%

                    80%
                                75                 69                  77                    78                    77                  71                76
                    60%

                    40%

                    20%                            14                                                                                  14
                                15                                     15                    14                    14                                    15
                                10                 18                  9                                           9                   15                9
                      0%                                                                     8
                                3QFY09


                                                   4QFY09


                                                                       1QFY10


                                                                                             2QFY10


                                                                                                                   3QFY10


                                                                                                                                       4QFY10


                                                                                                                                                         1QFY11
                Source: Company, Angel Research


                Exhibit 5: Advances mix - 1QFY2011
                                                                                                           Agri
                                           Others                                                          10%
                                            22%
                                                                                                                            SME
                                                                                                                            10%


                                          Retail
                                           21%                                                                            Large
                                                                                                                        Corporates
                                                                                                                           37%

                Source: Company, Angel Research


July 29, 2010                                                                                                                                                     3
Corporation Bank | 1QFY2011 Result Update


                Improvement in CD ratio drives NII growth

                On the back of strong lending in 1QFY2011, the bank’s NII increased by 49.2%
                yoy and 9.0% qoq to Rs698cr (from Rs640cr in 1QFY2010), driven by a 303bp
                sequential improvement in the CD ratio to 71.2%. The bank is expected to face
                NIM pressure in a rising interest rate environment, going forward, on account of its
                relatively low CASA. We expect the bank’s NIM to be at 2.2% in FY2011E (from
                2.3% in FY2010).

                Exhibit 6: Trend in reported NIM

                    (%)                                  Reported NIM
                   2.80
                                                                                        2.62
                                                               2.54       2.50

                   2.40        2.26               2.30


                   2.00


                   1.60
                             1QFY10          2QFY10          3QFY10     4QFY10        1QFY11

                Source: Company, Angel Research

                Non-interest income declines due to a high base effect

                Total non-interest income was down 25.9% yoy to Rs266cr during 1QFY2011, due
                to lower treasury gains. On the positive side, the bank continued its robust
                performance in non-interest income excluding treasury, which grew 45.3% yoy to
                Rs252.6cr. Income from recoveries was impressive at Rs59.2cr (up 117.7% yoy
                and 184% qoq). As expected, the bank recorded a lower treasury gain of Rs13.5cr
                during 1QFY2011 (Rs185cr in 1QFY2010).

                Pressure on asset quality

                The asset quality was under pressure during the quarter with gross NPAs increasing
                by 11.6% sequentially to Rs727cr. As a result of lower provision coverage, net
                NPAs increased by 39.8% sequentially to Rs276cr.

                The gross NPA ratio deteriorated to 1.1% (compared to 1.0% in 4QFY2010), while
                net NPA ratio stood at 0.4% (from 0.3% in 4QFY2010). The bank’s coverage ratio,
                including technical write-offs, stood at 76.7% (compared to 80.8% in 4QFY2010
                and 75.4% in 1QFY2010).

                The bank has restructured cumulatively advances worth Rs2,811cr, forming 4.3%
                of total advances and 46.0% of the net worth. About Rs173cr of restructured
                accounts slipped into NPAs during the quarter, out of which Rs82cr was from the
                commercial real estate sector.


July 29, 2010                                                                                     4
Corporation Bank | 1QFY2011 Result Update


                Exhibit 7: Trend in asset quality
                  (Rs cr)              Gross NPAs                          Net NPAs                                 Coverage (RHS)                        (%)
                  800                                                                                                                                     90

                                                                                                                                                          80
                  600
                                                                                                                                                          70
                  400
                                                                                                                                                          60
                  200
                                                                                                                                                          50

                    -                                                                                                                                     40


                            3QFY08

                                      4QFY08

                                               1QFY09

                                                        2QFY09

                                                                  3QFY09

                                                                            4QFY09

                                                                                       1QFY10

                                                                                                  2QFY10

                                                                                                              3QFY10

                                                                                                                           4QFY10

                                                                                                                                        1QFY11
                Source: Company, Angel Research; Note: Coverage ratio excluding technical write-offs till 3QFY2010


                Operating cost

                Operating costs increased 34.3% yoy but were down by 6.6% qoq to Rs343cr. The
                cost-to-income ratio stood at 35.6%, in-line with its eight quarter average of
                35.9%. The bank opened four Branches during the quarter taking the total branch
                network to 1,159. Number of ATMs remained unchanged at 1,145 compared to
                4QFY2010.

                Exhibit 8: Trend in productivity


                   (%)                                           Cost-to-Income ratio
                  50.0
                            43.9 45.2 44.6
                                                                 40.1 39.5 40.9                                                                  40.3
                  40.0
                                                        34.3                                                                        35.2                   35.6
                                                                                                                       33.6
                                                                                                           30.9
                  30.0                                                                          26.8


                  20.0
                             1QFY08

                                      2QFY08

                                               3QFY08

                                                        4QFY08

                                                                 1QFY09

                                                                           2QFY09

                                                                                     3QFY09

                                                                                                4QFY09

                                                                                                           1QFY10

                                                                                                                       2QFY10

                                                                                                                                    3QFY10

                                                                                                                                                 4QFY10

                                                                                                                                                            1QFY11


                Source: Company, Angel Research


                Capital adequacy – One of the best in PSU banks

                As per Basel-II norms, the bank’s capital adequacy ratio (CAR) stood comfortable
                at 15.1%, with a Tier-I ratio of 8.6%. The bank is one of the
                well-capitalised banks among PSU banks.


July 29, 2010                                                                                                                                                        5
Corporation Bank | 1QFY2011 Result Update


                Exhibit 9: Comfortable capital adequacy

                   (%)                            Tier-I CAR   Tier-II CAR
                  20.0
                  16.0
                  12.0
                   8.0
                   4.0
                     -


                              3QFY09


                                         4QFY09


                                                     1QFY10


                                                               2QFY10


                                                                         3QFY10


                                                                                  4QFY10


                                                                                           1QFY11
                Source: Company, Angel Research


July 29, 2010                                                                                       6
Corporation Bank | 1QFY2011 Result Update


                Investment Arguments

                Modern, cost-efficient network to support moderate CASA growth

                Growth in average CASA deposits was robust relative to peers at 22.4%, as
                compared to peers during FY2007-10. We believe the bank’s efficient and
                expanding network, supported by a consistent track record in early adoption of
                emerging technologies, creates a positive traction in its deposit franchise, which is
                tempered mainly by substantial competition from larger banks.

                Maintaining strong growth in core non-interest income

                Corporation Bank’s core non-interest income grew by 36.0% in FY2010, taking the
                contribution of core non-interest income/average assets to 0.8% from 0.7% in
                FY2009. The bank has been able to maintain its growth (45.3% yoy) momentum
                during 1QFY2011.

                Low operating cost, superior asset quality owing to corporate,
                urban-centric business

                Large corporates comprise 38% of the bank’s credit book, contributing to relatively
                low yield on advances but, at the same time, is reflected in superior asset quality.
                The bank is also amongst the most cost-efficient banks, both in terms of
                opex/average assets as well as branch and employee productivity.

                Outlook and valuation

                Within mid-cap PSU banks, we like Corporation Bank due to its efficient
                operations, reflected in low operating expenses as a percentage of average assets,
                healthy asset quality and proactive investments in modern distribution and
                payment systems (relative to its peers). However, it will be difficult for the bank to
                maintain its growth trajectory due to a high-growth base in NII and non-interest
                income for the bank during FY2010, especially in a rising interest rate
                environment. Further, the bank’s relatively small, regional and urban-centric
                operations temper its growth outlook, on the key competitive parameters of CASA
                and fee income.

                At the CMP, the stock is trading at 5.7x FY2012E EPS of Rs99.9 and 1.05x
                FY2012E ABV of Rs544. We value the bank at 1.10x FY2012E ABV. We believe
                that the stock sufficiently reflects the medium-term positives at these valuations;
                hence, we have a Neutral view on the stock.


July 29, 2010                                                                                       7
Corporation Bank | 1QFY2011 Result Update


                Exhibit 10: Key assumptions
                                                                                                                Earlier estimates                                       Revised estimates
                Particulars (%)
                                                                                                               FY2011E                FY2012E                  FY2011E                     FY2012E
                Credit growth                                                                                            17.0                   17.0                     18.0                        18.0
                Deposit growth                                                                                           16.0                   16.0                     16.0                        16.0
                CASA ratio                                                                                               35.1                   34.5                     35.1                        34.5
                NIMs                                                                                                      2.4                        2.3                    2.4                       2.3
                Other income growth                                                                                      (9.1)                       5.8                 (9.1)                        5.8
                Growth in staff expenses                                                                                 10.0                   14.0                     10.0                        14.0
                Growth in other expenses                                                                                 10.0                   14.0                     10.0                        14.0
                Slippages                                                                                                 2.2                        2.0                    2.2                       2.0
                Coverage ratio                                                                                           85.2                   86.0                     85.2                        86.0
                Treasury gain/(loss) (% of investments)                                                                   0.3                        0.3                    0.3                       0.3
                Source: Company, Angel Research


                Exhibit 11: Change in estimates
                                                                                        FY2011E                                                                         FY2012E
                Particulars (Rs cr)                                 Earlier                 Revised                                              Earlier                   Revised
                                                                                                                           % chg                                                   % chg
                                                                 estimates                estimates                                           estimates                  estimates
                NII                                                  1,295                    1,312                                1.3            1,481                      1,502   1.4
                Non-interest income                                         535                        535                            -                    567                       567                       -
                Total income                                              1,830                      1,847                         0.9                2,048                       2,068                1.0
                Operating expenses                                          933                        933                            -               1,063                       1,063                        -
                Pre-prov. profit                                            897                        914                         1.9                     984                    1,005                2.1
                Provisions & cont.                                          155                        154                    (0.6)                        145                       148               1.8
                PBT                                                         742                        760                         2.4                     839                       857               2.1
                Prov. for taxes                                             185                        190                         2.4                     210                       214               2.1
                PAT                                                         556                        570                         2.4                     629                       643               2.1
                Source: Company, Angel Research


                Exhibit 12: P/ABV band

                                       Price                     0.50x                      0.90x                         1.30x                       1.70x                       2.10x
                      (Rs)
                  1200

                  1000

                   800

                   600

                   400

                   200

                        0
                                      Sep-02


                                                        Sep-03


                                                                          Sep-04


                                                                                            Sep-05


                                                                                                                Sep-06


                                                                                                                                   Sep-07


                                                                                                                                                      Sep-08


                                                                                                                                                                         Sep-09


                                                                                                                                                                                            Sep-10
                             Jan-00


                                               Mar-03


                                                                 Mar-04


                                                                                   Mar-05


                                                                                                      Mar-06


                                                                                                                          Mar-07


                                                                                                                                            Mar-08


                                                                                                                                                               Mar-09


                                                                                                                                                                                  Mar-10


                                                                                                                                                                                                      Mar-11


                Source: Company, Bloomberg, Angel Research


July 29, 2010                                                                                                                                                                                             8
Corporation Bank | 1QFY2011 Result Update


Exhibit 13: Recommendation summary
                             CMP       Tgt. price   Upside   FY2012E        FY2012E     FY2012E          FY10-12E     FY2012E FY2012E
Company     Reco.
                              (Rs)           (Rs)      (%)   P/ABV (x) Tgt. P/ABV (x)     P/E (x)   CAGR in EPS (%)    RoA (%) RoE (%)
AXISBK      Buy             1,362         1,688      23.9         2.6            3.2       13.5               27.4        1.6    20.5
HDFCBK      Buy             2,102         2,514      19.6         3.3            4.0        17.5              36.5        1.7     20.6
ICICIBK     Buy               927         1,145      23.6         1.8            2.2        15.4              29.2        1.4     15.1
YesBk       Neutral           292               -        -        2.3               -       14.8              18.7        1.3     17.1
SIB         Neutral           190               -        -        1.1               -        6.7              17.1        1.0     17.8
FedBk       Neutral           353               -        -        1.0               -        7.5              31.4        1.4     14.6
SBI         Accumulate      2,473         2,596        5.0        1.4            1.6        10.8              25.7        1.0     19.5
BOI         Neutral           411               -        -        1.3               -        8.0              24.3        0.8     17.3
CorpBk      Neutral           569               -        -        1.0               -        5.7              10.7        1.0     19.7
IndBk       Neutral           225               -        -        1.1               -        5.5               7.6        1.3     21.0
DenaBk      Buy                   99        114      15.7         0.8            1.0         4.4              12.1        0.9     18.9
IOB         Accumulate        115           125        9.1        0.8            0.9         5.8              23.8        0.6     14.6
OBC         Neutral           379               -        -        1.0               -        6.3              15.0        0.9     16.6
PNB         Reduce          1,054           948     (10.1)        1.4            1.3         7.1               9.5        1.2     22.0
UnionBk     Neutral           315               -        -        1.2               -        5.6              17.1        1.1     24.1
UcoBk       Buy                   92        112      21.5         0.8            1.0         4.0              12.0        0.8     23.8
Source: Company, Angel Research


July 29, 2010                                                                                                                        9
Corporation Bank | 1QFY2011 Result Update


                Income statement
                Y/E March (Rs cr)            FY06       FY07       FY08       FY09       FY10      FY11E     FY12E
                Net Interest Income         1,227      1,378      1,443       1,691      2,210      2,806     3,138
                - YoY Growth (%)              8.6       12.3        4.8        17.2       30.7       27.0      11.8
                Other Income                  571        640        700       1,016      1,089      1,103     1,300
                - YoY Growth (%)              1.2       12.0        9.4        45.2        7.2        1.3      17.9
                Operating Income            1,798      2,018      2,143       2,707      3,299      3,909     4,438
                - YoY Growth (%)              6.2       12.2        6.2        26.3       21.9       18.5      13.5
                Operating Expenses            747        804        892       1,002      1,260      1,386     1,594
                - YoY Growth (%)             12.0        7.6       11.0        12.3       25.8       10.0      15.0
                Pre - Provision Profit      1,052      1,214      1,251       1,705      2,039      2,523     2,844
                - YoY Growth (%)              2.4       15.5        3.1        36.3       19.6       23.7      12.7
                Prov. & Cont.                 377        397        186        319        377        615       673
                - YoY Growth (%)            (10.7)       5.4      (53.3)       71.8       18.1       63.1       9.5
                Profit Before Tax             675        817      1,065       1,386      1,662      1,908     2,171
                - YoY Growth (%)             11.6       21.1       30.5        30.1       19.9       14.8      13.8
                Prov. for Taxation            230        280        330        493        492        649       738
                - as a % of PBT              34.1       34.3       31.0        35.6       29.6       34.0      34.0
                PAT                           444        536        735        893       1,170      1,259     1,433
                - YoY Growth (%)             10.5       20.6       37.1        21.5       31.1        7.6      13.8


                Balance sheet
                Y/E March (Rs cr)         FY06       FY07       FY08        FY09       FY10E      FY11E      FY12E

                Share Capital              143        143        143         143         143        143        143
                Reserve & Surplus         3,231      3,622      4,085       4,753       5,631      6,597      7,694
                Deposits                 32,877   42,357     55,424        73,984      92,734    111,280    130,198
                - Growth (%)               20.7       28.8       30.9        33.5        25.3       20.0       17.0
                Borrowings                1,660      3,021      2,138       2,072       5,028      6,033      7,059
                Tier 2 Capital             300        300        800        2,500       4,050      4,901      5,832
                Other Liab. & Prov.       2,295      3,277      3,867       3,348       3,803      4,712      5,464

                Total Liabilities        40,507   52,721     66,458        86,800     111,389    133,667    156,390

                Cash balances             1,640      2,984      7,104       5,591       8,835      7,790      9,765
                Bank balances             2,449      3,735      1,812       4,949       1,957      2,348      2,747
                Investments              10,652   14,417     16,512        24,938      34,523     43,618     48,864
                Advances                 23,962   29,950       39,186      48,512      63,203     76,475     91,005
                - Growth (%)               29.2       25.0       30.8        23.8        30.3       21.0       19.0
                Fixed Assets               256        281        272         299         289        337        382
                Other Assets              1,548      1,354      1,572       2,512       2,582      3,099      3,626

                Total Assets             40,507   52,721     66,458        86,800     111,389    133,667    156,390

                - Growth (%)               19.4       30.2       26.1        30.6        28.3       20.0       17.0


July 29, 2010                                                                                                   10
Corporation Bank | 1QFY2011 Result Update


                Ratio Analysis
                 Y/E March                     FY06    FY07    FY08    FY09    FY10    FY11E   FY12E
                 Profitability ratios (%)
                 NIMs                            3.5     3.1     2.5     2.3     2.3     2.4     2.2
                 Cost to Income Ratio           41.5    39.8    41.6    37.0    38.2    35.5    35.9
                 RoA                             1.2     1.0     1.2     1.2     1.2     1.0     1.0
                 RoE                            13.8    13.6    18.4    19.6    21.9    20.1    19.7
                 B/S ratios (%)
                 CASA Ratio                     34.3    34.1    35.0    31.4    28.6    27.1    26.2
                 Credit/Deposit Ratio           72.9    70.7    70.7    65.6    68.2    68.7    69.9
                 CAR                            13.9    12.8    12.1    12.7    14.3    13.1    13.2
                 - Tier I                       12.4    11.3     9.6     8.3     8.6     7.7     7.7
                 Asset Quality (%)
                 Gross NPAs                      2.6     2.1     1.5     1.1     1.0     0.9     0.7
                 Net NPAs                        0.6     0.5     0.3     0.3     0.3     0.3     0.2
                 Slippages                       1.1     1.1     0.6     0.6     1.0     0.8     0.7
                 Loan Loss Prov./Avg. Assets    17.8    15.3     9.8    10.0    16.9    20.5    19.6
                 Provision Coverage              0.5     0.4     0.2     0.2     0.3     0.4     0.4
                 Per Share Data (Rs)
                 EPS                            31.0    37.4    51.2    62.2    81.6    87.8    99.9
                 ABVPS                         235.3   262.5   294.8   341.1   398.3   467.6   544.1
                 DPS                             7.0     9.0    10.5    12.5    16.5    17.5    20.0
                 Valuation Ratios
                 PER (x)                        18.4    15.2    11.1     9.1     7.0     6.5     5.7
                 P/ABVPS (x)                     2.4     2.2     1.9     1.7     1.4     1.2     1.0
                 Dividend Yield                  1.2     1.6     1.8     2.2     2.9     3.1     3.5
                 DuPont Analysis (%)
                 NII                             3.3     3.0     2.4     2.2     2.2     2.3     2.2
                 (-) Prov. Exp.                  1.0     0.9     0.3     0.4     0.4     0.5     0.5
                 Adj. NII                        2.3     2.1     2.1     1.8     1.9     1.8     1.7
                 Treasury                        0.4     0.3     0.2     0.6     0.3     0.0     0.0
                 Int. Sens. Inc.                 2.6     2.4     2.3     2.4     2.2     1.8     1.7
                 Other Inc.                      1.2     1.1     0.9     0.7     0.8     0.9     0.9
                 Op. Inc.                        3.8     3.5     3.3     3.1     2.9     2.7     2.6
                 Opex                            2.0     1.7     1.5     1.3     1.3     1.1     1.1
                 PBT                             1.8     1.8     1.8     1.8     1.7     1.6     1.5
                 Taxes                           0.6     0.6     0.6     0.6     0.5     0.5     0.5
                 RoA                             1.2     1.2     1.2     1.2     1.2     1.0     1.0
                 Leverage (x)                   11.6    13.1    14.9    16.8    18.6    19.6    19.9
                 RoE                            13.8    15.0    18.4    19.6    21.9    20.1    19.7


July 29, 2010                                                                                   11
Corporation Bank | 1QFY2011 Result Update


  Research Team Tel: 022 - 4040 3800                    E-mail: research@angeltrade.com                    Website: www.angeltrade.com

  DISCLAIMER
  This document is solely for the personal information of the recipient, and must not be singularly used as the basis of any investment
  decision. Nothing in this document should be construed as investment or financial advice. Each recipient of this document should make
  such investigations as they deem necessary to arrive at an independent evaluation of an investment in the securities of the companies
  referred to in this document (including the merits and risks involved), and should consult their own advisors to determine the merits and
  risks of such an investment.

  Angel Broking Limited, its affiliates, directors, its proprietary trading and investment businesses may, from time to time, make
  investment decisions that are inconsistent with or contradictory to the recommendations expressed herein. The views contained in this
  document are those of the analyst, and the company may or may not subscribe to all the views expressed within.

  Reports based on technical and derivative analysis center on studying charts of a stock's price movement, outstanding positions and
  trading volume, as opposed to focusing on a company's fundamentals and, as such, may not match with a report on a company's
  fundamentals.

  The information in this document has been printed on the basis of publicly available information, internal data and other reliable
  sources believed to be true, but we do not represent that it is accurate or complete and it should not be relied on as such, as this
  document is for general guidance only. Angel Broking Limited or any of its affiliates/ group companies shall not be in any way
  responsible for any loss or damage that may arise to any person from any inadvertent error in the information contained in this report.
  Angel Broking Limited has not independently verified all the information contained within this document. Accordingly, we cannot testify,
  nor make any representation or warranty, express or implied, to the accuracy, contents or data contained within this document. While
  Angel Broking Limited endeavours to update on a reasonable basis the information discussed in this material, there may be regulatory,
  compliance, or other reasons that prevent us from doing so.
  This document is being supplied to you solely for your information, and its contents, information or data may not be reproduced,
  redistributed or passed on, directly or indirectly.

  Angel Broking Limited and its affiliates may seek to provide or have engaged in providing corporate finance, investment banking or
  other advisory services in a merger or specific transaction to the companies referred to in this report, as on the date of this report or in
  the past.

  Neither Angel Broking Limited, nor its directors, employees or affiliates shall be liable for any loss or damage that may arise from or in
  connection with the use of this information.

  Note: Please refer to the important `Stock Holding Disclosure' report on the Angel website (Research Section). Also, please
  refer to the latest update on respective stocks for the disclosure status in respect of those stocks. Angel Broking Limited and
  its affiliates may have investment positions in the stocks recommended in this report.


  Disclosure of Interest Statement                                           Corporation Bank
  1. Analyst ownership of the stock                                                No
  2. Angel and its Group companies ownership of the stock                          No
  3. Angel and its Group companies' Directors ownership of the stock               No
  4. Broking relationship with company covered                                     No

  Note: We have not considered any Exposure below Rs 1 lakh for Angel, its Group companies and Directors.


  Ratings (Returns):              Buy (> 15%)                      Accumulate (5% to 15%)                 Neutral (-5 to 5%)
                                  Reduce (-5% to 15%)              Sell (< -15%)


July 29, 2010                                                                                                                             12

More Related Content

What's hot (18)

SBI
SBISBI
SBI
 
ICICI Bank
ICICI BankICICI Bank
ICICI Bank
 
Corporation Bank Result Update
Corporation Bank Result UpdateCorporation Bank Result Update
Corporation Bank Result Update
 
Icici bank ru4 qfy2010-230410
Icici bank ru4 qfy2010-230410Icici bank ru4 qfy2010-230410
Icici bank ru4 qfy2010-230410
 
HDFC Bank - Result Update
HDFC Bank - Result UpdateHDFC Bank - Result Update
HDFC Bank - Result Update
 
Jsw Steel
Jsw Steel   Jsw Steel
Jsw Steel
 
Bank of India
Bank of India Bank of India
Bank of India
 
Yes Bank - Result Update
Yes Bank - Result UpdateYes Bank - Result Update
Yes Bank - Result Update
 
Indian Overseas Bank
Indian Overseas BankIndian Overseas Bank
Indian Overseas Bank
 
SAIL
SAILSAIL
SAIL
 
JK Lakshmi
JK LakshmiJK Lakshmi
JK Lakshmi
 
Bajaj Electricals
Bajaj ElectricalsBajaj Electricals
Bajaj Electricals
 
Mcnally Bharat
Mcnally BharatMcnally Bharat
Mcnally Bharat
 
Subros
Subros Subros
Subros
 
Cesc
Cesc Cesc
Cesc
 
Hotel Leela
Hotel LeelaHotel Leela
Hotel Leela
 
JISL
JISLJISL
JISL
 
TAJGVK
TAJGVKTAJGVK
TAJGVK
 

Viewers also liked

HZL Q4 2010 Result Update
HZL Q4 2010 Result UpdateHZL Q4 2010 Result Update
HZL Q4 2010 Result UpdateAngel Broking
 
Electrosteel Castings Ic 17 03 10
Electrosteel Castings   Ic 17 03 10Electrosteel Castings   Ic 17 03 10
Electrosteel Castings Ic 17 03 10Angel Broking
 
Technical Report - July 1, 2010
Technical Report - July 1, 2010Technical Report - July 1, 2010
Technical Report - July 1, 2010Angel Broking
 
Market Outlook -July 29, 2010
Market Outlook -July 29, 2010Market Outlook -July 29, 2010
Market Outlook -July 29, 2010Angel Broking
 
Derivatives Report - July 1, 2010
Derivatives Report - July 1, 2010Derivatives Report - July 1, 2010
Derivatives Report - July 1, 2010Angel Broking
 
Sintex Result Update 4qfy2010-030510
Sintex Result Update 4qfy2010-030510Sintex Result Update 4qfy2010-030510
Sintex Result Update 4qfy2010-030510Angel Broking
 
Market outlook 24 05-10
Market outlook 24 05-10Market outlook 24 05-10
Market outlook 24 05-10Angel Broking
 
Metal Sector Review
Metal Sector Review Metal Sector Review
Metal Sector Review Angel Broking
 
Market Outlook- June 23, 2010
Market Outlook- June 23, 2010Market Outlook- June 23, 2010
Market Outlook- June 23, 2010Angel Broking
 
Market Outlook -August 25, 2010
Market Outlook -August 25, 2010Market Outlook -August 25, 2010
Market Outlook -August 25, 2010Angel Broking
 
Market outlook 22.10.10
Market outlook 22.10.10Market outlook 22.10.10
Market outlook 22.10.10Angel Broking
 
Jagran Prakashan- Company Update
Jagran Prakashan- Company UpdateJagran Prakashan- Company Update
Jagran Prakashan- Company UpdateAngel Broking
 
Techical Report June 16, 2010
Techical Report June 16, 2010Techical Report June 16, 2010
Techical Report June 16, 2010Angel Broking
 

Viewers also liked (20)

HZL Q4 2010 Result Update
HZL Q4 2010 Result UpdateHZL Q4 2010 Result Update
HZL Q4 2010 Result Update
 
Bharti Airtel
Bharti AirtelBharti Airtel
Bharti Airtel
 
HDIL
HDILHDIL
HDIL
 
Rallis
RallisRallis
Rallis
 
Electrosteel Castings Ic 17 03 10
Electrosteel Castings   Ic 17 03 10Electrosteel Castings   Ic 17 03 10
Electrosteel Castings Ic 17 03 10
 
Dr. Reddy's Lab
Dr. Reddy's LabDr. Reddy's Lab
Dr. Reddy's Lab
 
RBI Policy Preview
RBI Policy PreviewRBI Policy Preview
RBI Policy Preview
 
MPL
MPLMPL
MPL
 
Technical Report - July 1, 2010
Technical Report - July 1, 2010Technical Report - July 1, 2010
Technical Report - July 1, 2010
 
Market Outlook -July 29, 2010
Market Outlook -July 29, 2010Market Outlook -July 29, 2010
Market Outlook -July 29, 2010
 
Derivatives Report - July 1, 2010
Derivatives Report - July 1, 2010Derivatives Report - July 1, 2010
Derivatives Report - July 1, 2010
 
Sintex Result Update 4qfy2010-030510
Sintex Result Update 4qfy2010-030510Sintex Result Update 4qfy2010-030510
Sintex Result Update 4qfy2010-030510
 
Market outlook 24 05-10
Market outlook 24 05-10Market outlook 24 05-10
Market outlook 24 05-10
 
Metal Sector Review
Metal Sector Review Metal Sector Review
Metal Sector Review
 
Market Outlook- June 23, 2010
Market Outlook- June 23, 2010Market Outlook- June 23, 2010
Market Outlook- June 23, 2010
 
Market Outlook -August 25, 2010
Market Outlook -August 25, 2010Market Outlook -August 25, 2010
Market Outlook -August 25, 2010
 
Market outlook 22.10.10
Market outlook 22.10.10Market outlook 22.10.10
Market outlook 22.10.10
 
Gujarat Gas
Gujarat GasGujarat Gas
Gujarat Gas
 
Jagran Prakashan- Company Update
Jagran Prakashan- Company UpdateJagran Prakashan- Company Update
Jagran Prakashan- Company Update
 
Techical Report June 16, 2010
Techical Report June 16, 2010Techical Report June 16, 2010
Techical Report June 16, 2010
 

Similar to Corporation Bank

Similar to Corporation Bank (20)

Indian Bank
Indian BankIndian Bank
Indian Bank
 
Bank of India
Bank of IndiaBank of India
Bank of India
 
ICICI Bank
ICICI BankICICI Bank
ICICI Bank
 
Indian Bank Result Update
Indian Bank Result UpdateIndian Bank Result Update
Indian Bank Result Update
 
ICICI Bank Result Update
ICICI Bank Result UpdateICICI Bank Result Update
ICICI Bank Result Update
 
Union bank result update 4 qfy2010 100510
Union bank result update 4 qfy2010 100510Union bank result update 4 qfy2010 100510
Union bank result update 4 qfy2010 100510
 
Union bank result update 4 qfy2010 100510
Union bank result update 4 qfy2010 100510Union bank result update 4 qfy2010 100510
Union bank result update 4 qfy2010 100510
 
Axis Bank - Q4 2010 Result Update
Axis Bank - Q4 2010 Result UpdateAxis Bank - Q4 2010 Result Update
Axis Bank - Q4 2010 Result Update
 
NCC
NCCNCC
NCC
 
Larsen & Tourbo
Larsen & TourboLarsen & Tourbo
Larsen & Tourbo
 
South Indian Bank
 South Indian Bank South Indian Bank
South Indian Bank
 
Ashok leyland ru4 qfy2010-300410
Ashok leyland ru4 qfy2010-300410Ashok leyland ru4 qfy2010-300410
Ashok leyland ru4 qfy2010-300410
 
Jagran Prakashan
Jagran PrakashanJagran Prakashan
Jagran Prakashan
 
Hindalco Novelis
Hindalco Novelis Hindalco Novelis
Hindalco Novelis
 
Lupin
LupinLupin
Lupin
 
Hdfc bank ru2 qfy2011-191010
Hdfc bank ru2 qfy2011-191010Hdfc bank ru2 qfy2011-191010
Hdfc bank ru2 qfy2011-191010
 
Hindalco
Hindalco Hindalco
Hindalco
 
3i Infotech
3i Infotech3i Infotech
3i Infotech
 
Wipro
Wipro  Wipro
Wipro
 
JP Associates
JP AssociatesJP Associates
JP Associates
 

More from Angel Broking

Market outlook 110612
Market outlook 110612Market outlook 110612
Market outlook 110612Angel Broking
 
Axis%20 bank ru1qfy2012-220711
Axis%20 bank ru1qfy2012-220711Axis%20 bank ru1qfy2012-220711
Axis%20 bank ru1qfy2012-220711Angel Broking
 
Electrosteel castings
Electrosteel castingsElectrosteel castings
Electrosteel castingsAngel Broking
 
Derivative report 19th July 2011
Derivative report 19th July 2011Derivative report 19th July 2011
Derivative report 19th July 2011Angel Broking
 
Market outlook 19th July 2011
Market outlook 19th July 2011Market outlook 19th July 2011
Market outlook 19th July 2011Angel Broking
 
Weekly Report 18th July 2011
Weekly Report 18th July 2011Weekly Report 18th July 2011
Weekly Report 18th July 2011Angel Broking
 
Derivative Report 18th July 2011
Derivative Report 18th July 2011Derivative Report 18th July 2011
Derivative Report 18th July 2011Angel Broking
 
Technical Report 18th July 2011
Technical Report 18th July 2011Technical Report 18th July 2011
Technical Report 18th July 2011Angel Broking
 
Market Outlook 18th July 2011
Market Outlook 18th July 2011Market Outlook 18th July 2011
Market Outlook 18th July 2011Angel Broking
 
Bajaj auto Result Updated
Bajaj auto Result UpdatedBajaj auto Result Updated
Bajaj auto Result UpdatedAngel Broking
 
Tata consultancy services
Tata consultancy services Tata consultancy services
Tata consultancy services Angel Broking
 
Derivatives Report 15th July 2011
Derivatives Report 15th July 2011Derivatives Report 15th July 2011
Derivatives Report 15th July 2011Angel Broking
 
Technical Report 15th July 2011
Technical Report 15th July 2011Technical Report 15th July 2011
Technical Report 15th July 2011Angel Broking
 
Infosys Result Updated
Infosys Result UpdatedInfosys Result Updated
Infosys Result UpdatedAngel Broking
 
Derivative Report 13th July 2011
Derivative Report 13th July 2011Derivative Report 13th July 2011
Derivative Report 13th July 2011Angel Broking
 
Technical Report 13th July 2011
Technical Report 13th July 2011Technical Report 13th July 2011
Technical Report 13th July 2011Angel Broking
 

More from Angel Broking (20)

Market outlook 110612
Market outlook 110612Market outlook 110612
Market outlook 110612
 
Axis%20 bank ru1qfy2012-220711
Axis%20 bank ru1qfy2012-220711Axis%20 bank ru1qfy2012-220711
Axis%20 bank ru1qfy2012-220711
 
Electrosteel castings
Electrosteel castingsElectrosteel castings
Electrosteel castings
 
Persistent systems
Persistent systemsPersistent systems
Persistent systems
 
Ht media
Ht mediaHt media
Ht media
 
Derivative report 19th July 2011
Derivative report 19th July 2011Derivative report 19th July 2011
Derivative report 19th July 2011
 
Market outlook 19th July 2011
Market outlook 19th July 2011Market outlook 19th July 2011
Market outlook 19th July 2011
 
Telecom sector
Telecom sectorTelecom sector
Telecom sector
 
Weekly Report 18th July 2011
Weekly Report 18th July 2011Weekly Report 18th July 2011
Weekly Report 18th July 2011
 
Derivative Report 18th July 2011
Derivative Report 18th July 2011Derivative Report 18th July 2011
Derivative Report 18th July 2011
 
Technical Report 18th July 2011
Technical Report 18th July 2011Technical Report 18th July 2011
Technical Report 18th July 2011
 
Market Outlook 18th July 2011
Market Outlook 18th July 2011Market Outlook 18th July 2011
Market Outlook 18th July 2011
 
Bajaj auto Result Updated
Bajaj auto Result UpdatedBajaj auto Result Updated
Bajaj auto Result Updated
 
Tata consultancy services
Tata consultancy services Tata consultancy services
Tata consultancy services
 
Fc4 e63c4d01
Fc4 e63c4d01Fc4 e63c4d01
Fc4 e63c4d01
 
Derivatives Report 15th July 2011
Derivatives Report 15th July 2011Derivatives Report 15th July 2011
Derivatives Report 15th July 2011
 
Technical Report 15th July 2011
Technical Report 15th July 2011Technical Report 15th July 2011
Technical Report 15th July 2011
 
Infosys Result Updated
Infosys Result UpdatedInfosys Result Updated
Infosys Result Updated
 
Derivative Report 13th July 2011
Derivative Report 13th July 2011Derivative Report 13th July 2011
Derivative Report 13th July 2011
 
Technical Report 13th July 2011
Technical Report 13th July 2011Technical Report 13th July 2011
Technical Report 13th July 2011
 

Recently uploaded

(ANIKA) Budhwar Peth Call Girls Just Call 7001035870 [ Cash on Delivery ] Pun...
(ANIKA) Budhwar Peth Call Girls Just Call 7001035870 [ Cash on Delivery ] Pun...(ANIKA) Budhwar Peth Call Girls Just Call 7001035870 [ Cash on Delivery ] Pun...
(ANIKA) Budhwar Peth Call Girls Just Call 7001035870 [ Cash on Delivery ] Pun...ranjana rawat
 
Dharavi Russian callg Girls, { 09892124323 } || Call Girl In Mumbai ...
Dharavi Russian callg Girls, { 09892124323 } || Call Girl In Mumbai ...Dharavi Russian callg Girls, { 09892124323 } || Call Girl In Mumbai ...
Dharavi Russian callg Girls, { 09892124323 } || Call Girl In Mumbai ...Pooja Nehwal
 
Call Girls In Yusuf Sarai Women Seeking Men 9654467111
Call Girls In Yusuf Sarai Women Seeking Men 9654467111Call Girls In Yusuf Sarai Women Seeking Men 9654467111
Call Girls In Yusuf Sarai Women Seeking Men 9654467111Sapana Sha
 
Instant Issue Debit Cards - High School Spirit
Instant Issue Debit Cards - High School SpiritInstant Issue Debit Cards - High School Spirit
Instant Issue Debit Cards - High School Spiritegoetzinger
 
Best VIP Call Girls Noida Sector 18 Call Me: 8448380779
Best VIP Call Girls Noida Sector 18 Call Me: 8448380779Best VIP Call Girls Noida Sector 18 Call Me: 8448380779
Best VIP Call Girls Noida Sector 18 Call Me: 8448380779Delhi Call girls
 
VIP Call Girls LB Nagar ( Hyderabad ) Phone 8250192130 | ₹5k To 25k With Room...
VIP Call Girls LB Nagar ( Hyderabad ) Phone 8250192130 | ₹5k To 25k With Room...VIP Call Girls LB Nagar ( Hyderabad ) Phone 8250192130 | ₹5k To 25k With Room...
VIP Call Girls LB Nagar ( Hyderabad ) Phone 8250192130 | ₹5k To 25k With Room...Suhani Kapoor
 
The Economic History of the U.S. Lecture 19.pdf
The Economic History of the U.S. Lecture 19.pdfThe Economic History of the U.S. Lecture 19.pdf
The Economic History of the U.S. Lecture 19.pdfGale Pooley
 
Independent Lucknow Call Girls 8923113531WhatsApp Lucknow Call Girls make you...
Independent Lucknow Call Girls 8923113531WhatsApp Lucknow Call Girls make you...Independent Lucknow Call Girls 8923113531WhatsApp Lucknow Call Girls make you...
Independent Lucknow Call Girls 8923113531WhatsApp Lucknow Call Girls make you...makika9823
 
VIP Call Girls Service Dilsukhnagar Hyderabad Call +91-8250192130
VIP Call Girls Service Dilsukhnagar Hyderabad Call +91-8250192130VIP Call Girls Service Dilsukhnagar Hyderabad Call +91-8250192130
VIP Call Girls Service Dilsukhnagar Hyderabad Call +91-8250192130Suhani Kapoor
 
Q3 2024 Earnings Conference Call and Webcast Slides
Q3 2024 Earnings Conference Call and Webcast SlidesQ3 2024 Earnings Conference Call and Webcast Slides
Q3 2024 Earnings Conference Call and Webcast SlidesMarketing847413
 
VIP Kolkata Call Girl Serampore 👉 8250192130 Available With Room
VIP Kolkata Call Girl Serampore 👉 8250192130  Available With RoomVIP Kolkata Call Girl Serampore 👉 8250192130  Available With Room
VIP Kolkata Call Girl Serampore 👉 8250192130 Available With Roomdivyansh0kumar0
 
Vip B Aizawl Call Girls #9907093804 Contact Number Escorts Service Aizawl
Vip B Aizawl Call Girls #9907093804 Contact Number Escorts Service AizawlVip B Aizawl Call Girls #9907093804 Contact Number Escorts Service Aizawl
Vip B Aizawl Call Girls #9907093804 Contact Number Escorts Service Aizawlmakika9823
 
Monthly Market Risk Update: April 2024 [SlideShare]
Monthly Market Risk Update: April 2024 [SlideShare]Monthly Market Risk Update: April 2024 [SlideShare]
Monthly Market Risk Update: April 2024 [SlideShare]Commonwealth
 
High Class Call Girls Nashik Maya 7001305949 Independent Escort Service Nashik
High Class Call Girls Nashik Maya 7001305949 Independent Escort Service NashikHigh Class Call Girls Nashik Maya 7001305949 Independent Escort Service Nashik
High Class Call Girls Nashik Maya 7001305949 Independent Escort Service NashikCall Girls in Nagpur High Profile
 
OAT_RI_Ep19 WeighingTheRisks_Apr24_TheYellowMetal.pptx
OAT_RI_Ep19 WeighingTheRisks_Apr24_TheYellowMetal.pptxOAT_RI_Ep19 WeighingTheRisks_Apr24_TheYellowMetal.pptx
OAT_RI_Ep19 WeighingTheRisks_Apr24_TheYellowMetal.pptxhiddenlevers
 
letter-from-the-chair-to-the-fca-relating-to-british-steel-pensions-scheme-15...
letter-from-the-chair-to-the-fca-relating-to-british-steel-pensions-scheme-15...letter-from-the-chair-to-the-fca-relating-to-british-steel-pensions-scheme-15...
letter-from-the-chair-to-the-fca-relating-to-british-steel-pensions-scheme-15...Henry Tapper
 
20240429 Calibre April 2024 Investor Presentation.pdf
20240429 Calibre April 2024 Investor Presentation.pdf20240429 Calibre April 2024 Investor Presentation.pdf
20240429 Calibre April 2024 Investor Presentation.pdfAdnet Communications
 
Independent Call Girl Number in Kurla Mumbai📲 Pooja Nehwal 9892124323 💞 Full ...
Independent Call Girl Number in Kurla Mumbai📲 Pooja Nehwal 9892124323 💞 Full ...Independent Call Girl Number in Kurla Mumbai📲 Pooja Nehwal 9892124323 💞 Full ...
Independent Call Girl Number in Kurla Mumbai📲 Pooja Nehwal 9892124323 💞 Full ...Pooja Nehwal
 
Quarter 4- Module 3 Principles of Marketing
Quarter 4- Module 3 Principles of MarketingQuarter 4- Module 3 Principles of Marketing
Quarter 4- Module 3 Principles of MarketingMaristelaRamos12
 
How Automation is Driving Efficiency Through the Last Mile of Reporting
How Automation is Driving Efficiency Through the Last Mile of ReportingHow Automation is Driving Efficiency Through the Last Mile of Reporting
How Automation is Driving Efficiency Through the Last Mile of ReportingAggregage
 

Recently uploaded (20)

(ANIKA) Budhwar Peth Call Girls Just Call 7001035870 [ Cash on Delivery ] Pun...
(ANIKA) Budhwar Peth Call Girls Just Call 7001035870 [ Cash on Delivery ] Pun...(ANIKA) Budhwar Peth Call Girls Just Call 7001035870 [ Cash on Delivery ] Pun...
(ANIKA) Budhwar Peth Call Girls Just Call 7001035870 [ Cash on Delivery ] Pun...
 
Dharavi Russian callg Girls, { 09892124323 } || Call Girl In Mumbai ...
Dharavi Russian callg Girls, { 09892124323 } || Call Girl In Mumbai ...Dharavi Russian callg Girls, { 09892124323 } || Call Girl In Mumbai ...
Dharavi Russian callg Girls, { 09892124323 } || Call Girl In Mumbai ...
 
Call Girls In Yusuf Sarai Women Seeking Men 9654467111
Call Girls In Yusuf Sarai Women Seeking Men 9654467111Call Girls In Yusuf Sarai Women Seeking Men 9654467111
Call Girls In Yusuf Sarai Women Seeking Men 9654467111
 
Instant Issue Debit Cards - High School Spirit
Instant Issue Debit Cards - High School SpiritInstant Issue Debit Cards - High School Spirit
Instant Issue Debit Cards - High School Spirit
 
Best VIP Call Girls Noida Sector 18 Call Me: 8448380779
Best VIP Call Girls Noida Sector 18 Call Me: 8448380779Best VIP Call Girls Noida Sector 18 Call Me: 8448380779
Best VIP Call Girls Noida Sector 18 Call Me: 8448380779
 
VIP Call Girls LB Nagar ( Hyderabad ) Phone 8250192130 | ₹5k To 25k With Room...
VIP Call Girls LB Nagar ( Hyderabad ) Phone 8250192130 | ₹5k To 25k With Room...VIP Call Girls LB Nagar ( Hyderabad ) Phone 8250192130 | ₹5k To 25k With Room...
VIP Call Girls LB Nagar ( Hyderabad ) Phone 8250192130 | ₹5k To 25k With Room...
 
The Economic History of the U.S. Lecture 19.pdf
The Economic History of the U.S. Lecture 19.pdfThe Economic History of the U.S. Lecture 19.pdf
The Economic History of the U.S. Lecture 19.pdf
 
Independent Lucknow Call Girls 8923113531WhatsApp Lucknow Call Girls make you...
Independent Lucknow Call Girls 8923113531WhatsApp Lucknow Call Girls make you...Independent Lucknow Call Girls 8923113531WhatsApp Lucknow Call Girls make you...
Independent Lucknow Call Girls 8923113531WhatsApp Lucknow Call Girls make you...
 
VIP Call Girls Service Dilsukhnagar Hyderabad Call +91-8250192130
VIP Call Girls Service Dilsukhnagar Hyderabad Call +91-8250192130VIP Call Girls Service Dilsukhnagar Hyderabad Call +91-8250192130
VIP Call Girls Service Dilsukhnagar Hyderabad Call +91-8250192130
 
Q3 2024 Earnings Conference Call and Webcast Slides
Q3 2024 Earnings Conference Call and Webcast SlidesQ3 2024 Earnings Conference Call and Webcast Slides
Q3 2024 Earnings Conference Call and Webcast Slides
 
VIP Kolkata Call Girl Serampore 👉 8250192130 Available With Room
VIP Kolkata Call Girl Serampore 👉 8250192130  Available With RoomVIP Kolkata Call Girl Serampore 👉 8250192130  Available With Room
VIP Kolkata Call Girl Serampore 👉 8250192130 Available With Room
 
Vip B Aizawl Call Girls #9907093804 Contact Number Escorts Service Aizawl
Vip B Aizawl Call Girls #9907093804 Contact Number Escorts Service AizawlVip B Aizawl Call Girls #9907093804 Contact Number Escorts Service Aizawl
Vip B Aizawl Call Girls #9907093804 Contact Number Escorts Service Aizawl
 
Monthly Market Risk Update: April 2024 [SlideShare]
Monthly Market Risk Update: April 2024 [SlideShare]Monthly Market Risk Update: April 2024 [SlideShare]
Monthly Market Risk Update: April 2024 [SlideShare]
 
High Class Call Girls Nashik Maya 7001305949 Independent Escort Service Nashik
High Class Call Girls Nashik Maya 7001305949 Independent Escort Service NashikHigh Class Call Girls Nashik Maya 7001305949 Independent Escort Service Nashik
High Class Call Girls Nashik Maya 7001305949 Independent Escort Service Nashik
 
OAT_RI_Ep19 WeighingTheRisks_Apr24_TheYellowMetal.pptx
OAT_RI_Ep19 WeighingTheRisks_Apr24_TheYellowMetal.pptxOAT_RI_Ep19 WeighingTheRisks_Apr24_TheYellowMetal.pptx
OAT_RI_Ep19 WeighingTheRisks_Apr24_TheYellowMetal.pptx
 
letter-from-the-chair-to-the-fca-relating-to-british-steel-pensions-scheme-15...
letter-from-the-chair-to-the-fca-relating-to-british-steel-pensions-scheme-15...letter-from-the-chair-to-the-fca-relating-to-british-steel-pensions-scheme-15...
letter-from-the-chair-to-the-fca-relating-to-british-steel-pensions-scheme-15...
 
20240429 Calibre April 2024 Investor Presentation.pdf
20240429 Calibre April 2024 Investor Presentation.pdf20240429 Calibre April 2024 Investor Presentation.pdf
20240429 Calibre April 2024 Investor Presentation.pdf
 
Independent Call Girl Number in Kurla Mumbai📲 Pooja Nehwal 9892124323 💞 Full ...
Independent Call Girl Number in Kurla Mumbai📲 Pooja Nehwal 9892124323 💞 Full ...Independent Call Girl Number in Kurla Mumbai📲 Pooja Nehwal 9892124323 💞 Full ...
Independent Call Girl Number in Kurla Mumbai📲 Pooja Nehwal 9892124323 💞 Full ...
 
Quarter 4- Module 3 Principles of Marketing
Quarter 4- Module 3 Principles of MarketingQuarter 4- Module 3 Principles of Marketing
Quarter 4- Module 3 Principles of Marketing
 
How Automation is Driving Efficiency Through the Last Mile of Reporting
How Automation is Driving Efficiency Through the Last Mile of ReportingHow Automation is Driving Efficiency Through the Last Mile of Reporting
How Automation is Driving Efficiency Through the Last Mile of Reporting
 

Corporation Bank

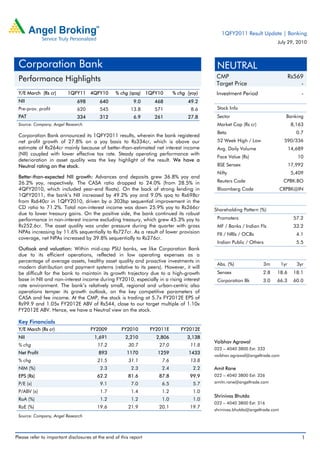
  • 1. 1QFY2011 Result Update | Banking July 29, 2010 Corporation Bank NEUTRAL Performance Highlights CMP Rs569 Target Price -   Y/E March (Rs cr) 1QFY11 4QFY10 % chg (qoq) 1QFY10 % chg (yoy) Investment Period - NII 698 640 9.0 468 49.2 Pre-prov. profit 620 545 13.8 571 8.6 Stock Info PAT 334 312 6.9 261 27.8 Sector Banking Source: Company, Angel Research Market Cap (Rs cr) 8,163 Beta 0.7 Corporation Bank announced its 1QFY2011 results, wherein the bank registered net profit growth of 27.8% on a yoy basis to Rs334cr, which is above our 52 Week High / Low 590/336 estimate of Rs264cr mainly because of better-than-estimated net interest income Avg. Daily Volume 14,689 (NII) coupled with lower effective tax rate. Steady operating performance with Face Value (Rs) 10 deterioration in asset quality was the key highlight of the result. We have a Neutral rating on the stock. BSE Sensex 17,992 Nifty 5,409 Better-than-expected NII growth: Advances and deposits grew 36.8% yoy and 26.2% yoy, respectively. The CASA ratio dropped to 24.0% (from 28.5% in Reuters Code CPBK.BO 4QFY2010, which included year-end floats). On the back of strong lending in Bloomberg Code CRPBK@IN 1QFY2011, the bank’s NII increased by 49.2% yoy and 9.0% qoq to Rs698cr from Rs640cr in 1QFY2010, driven by a 303bp sequential improvement in the CD ratio to 71.2%. Total non-interest income was down 25.9% yoy to Rs266cr Shareholding Pattern (%) due to lower treasury gains. On the positive side, the bank continued its robust performance in non-interest income excluding treasury, which grew 45.3% yoy to Promoters 57.2 Rs252.6cr. The asset quality was under pressure during the quarter with gross MF / Banks / Indian Fls 33.2 NPAs increasing by 11.6% sequentially to Rs727cr. As a result of lower provision FII / NRIs / OCBs 4.1 coverage, net NPAs increased by 39.8% sequentially to Rs276cr. Indian Public / Others 5.5 Outlook and valuation: Within mid-cap PSU banks, we like Corporation Bank due to its efficient operations, reflected in low operating expenses as a percentage of average assets, healthy asset quality and proactive investments in Abs. (%) 3m 1yr 3yr modern distribution and payment systems (relative to its peers). However, it will be difficult for the bank to maintain its growth trajectory due to a high-growth Sensex 2.8 18.6 18.1 base in NII and non-interest income during FY2010, especially in a rising interest Corporation Bk 3.0 66.3 60.0 rate environment. The bank’s relatively small, regional and urban-centric also operations temper its growth outlook, on the key competitive parameters of CASA and fee income. At the CMP, the stock is trading at 5.7x FY2012E EPS of Rs99.9 and 1.05x FY2012E ABV of Rs544, close to our target multiple of 1.10x FY2012E ABV. Hence, we have a Neutral view on the stock. Key Financials Y/E March (Rs cr) FY2009 FY2010 FY2011E FY2012E NII 1,691 2,210 2,806 3,138 Vaibhav Agrawal % chg 17.2 30.7 27.0 11.8 022 – 4040 3800 Ext: 333 Net Profit 893 1170 1259 1433 vaibhav.agrawal@angeltrade.com % chg 21.5 31.1 7.6 13.8 NIM (%) 2.3 2.3 2.4 2.2 Amit Rane EPS (Rs) 62.2 81.6 87.8 99.9 022 – 4040 3800 Ext: 326 P/E (x) 9.1 7.0 6.5 5.7 amitn.rane@angeltrade.com P/ABV (x) 1.7 1.4 1.2 1.0 Shrinivas Bhutda RoA (%) 1.2 1.2 1.0 1.0 022 – 4040 3800 Ext: 316 RoE (%) 19.6 21.9 20.1 19.7 shrinivas.bhutda@angeltrade.com Source: Company, Angel Research Please refer to important disclosures at the end of this report 1
  • 2. Corporation Bank | 1QFY2011 Result Update Exhibit 1: 1QFY2011 performance Particulars (Rs cr) 1QFY11 4QFY10 % chg (qoq) 1QFY10 % chg (yoy) Interest earned 2,028 1,922 5.5 1742 16.4 Interest expenses 1,330 1,282 3.7 1275 4.4 NII 698 640 9.0 468 49.2 Non-interest income 266 273 (2.4) 359 (25.9) Total income 964 912 5.6 827 16.5 Operating expenses 343 367 (6.6) 256 34.3 Pre-prov. profit 620 545 13.8 571 8.6 Provisions & cont. 127 165 (23.3) 155 (18.3) PBT 494 380 30.0 416 18.6 Prov. for taxes 160 68 136.9 155 3.2 PAT 334 312 6.9 261 27.8 EPS (Rs) 23.3 21.8 6.9 18.2 27.8 Cost-to-income ratio (%) 35.6 40.3 30.9 Effective tax rate (%) 32.4 17.8 37.2 Net NPA (%) 0.4 0.3 0.3 Source: Company, Angel Research Exhibit 2: 1QFY2011 actual v/s Angel estimates Particulars (Rs cr) Actual Estimates Var. (%) NII 698 622 12.2 Non-interest income 266 259 2.8 Total income 964 880 9.4 Operating expenses 343 310 10.7 Pre-prov. profit 620 570 8.8 Provisions & cont. 127 116 8.8 PBT 494 454 8.8 Prov. for taxes 160 190 (15.8) PAT 334 264 26.5 Source: Company, Angel Research Strong advances growth continues In line with the industry’s trend, Corporation Bank witnessed healthy business growth of 30.4% yoy to Rs1,55,840cr. Total deposits increased to Rs91,035cr, from Rs72,127cr as of 1QFY2010, recording 26.2% yoy growth. Advances growth shot up to 36.8% yoy in 1QFY2010, taking total advances to Rs64,805cr. The bank’s CASA ratio dropped to 24.0% (from 28.5% in 4QFY2010, which includes year-end floats). However, the bank aims to improve its CASA ratio to 26% by FY2011E. July 29, 2010 2
  • 3. Corporation Bank | 1QFY2011 Result Update Exhibit 3: Trend in advances and deposits Advances (LHS) Deposits (LHS) Credt-Deposit ratio (RHS) (Rs cr) (%) 100,000 76.0 80,000 72.0 60,000 68.0 40,000 64.0 20,000 - 60.0 3QFY08 4QFY08 1QFY09 2QFY09 3QFY09 4QFY09 1QFY10 2QFY10 3QFY10 4QFY10 1QFY11 Source: Company, Angel Research Exhibit 4: Trend in deposits mix CA SA Term Deposits 100% 80% 75 69 77 78 77 71 76 60% 40% 20% 14 14 15 15 14 14 15 10 18 9 9 15 9 0% 8 3QFY09 4QFY09 1QFY10 2QFY10 3QFY10 4QFY10 1QFY11 Source: Company, Angel Research Exhibit 5: Advances mix - 1QFY2011 Agri Others 10% 22% SME 10% Retail 21% Large Corporates 37% Source: Company, Angel Research July 29, 2010 3
  • 4. Corporation Bank | 1QFY2011 Result Update Improvement in CD ratio drives NII growth On the back of strong lending in 1QFY2011, the bank’s NII increased by 49.2% yoy and 9.0% qoq to Rs698cr (from Rs640cr in 1QFY2010), driven by a 303bp sequential improvement in the CD ratio to 71.2%. The bank is expected to face NIM pressure in a rising interest rate environment, going forward, on account of its relatively low CASA. We expect the bank’s NIM to be at 2.2% in FY2011E (from 2.3% in FY2010). Exhibit 6: Trend in reported NIM (%) Reported NIM 2.80 2.62 2.54 2.50 2.40 2.26 2.30 2.00 1.60 1QFY10 2QFY10 3QFY10 4QFY10 1QFY11 Source: Company, Angel Research Non-interest income declines due to a high base effect Total non-interest income was down 25.9% yoy to Rs266cr during 1QFY2011, due to lower treasury gains. On the positive side, the bank continued its robust performance in non-interest income excluding treasury, which grew 45.3% yoy to Rs252.6cr. Income from recoveries was impressive at Rs59.2cr (up 117.7% yoy and 184% qoq). As expected, the bank recorded a lower treasury gain of Rs13.5cr during 1QFY2011 (Rs185cr in 1QFY2010). Pressure on asset quality The asset quality was under pressure during the quarter with gross NPAs increasing by 11.6% sequentially to Rs727cr. As a result of lower provision coverage, net NPAs increased by 39.8% sequentially to Rs276cr. The gross NPA ratio deteriorated to 1.1% (compared to 1.0% in 4QFY2010), while net NPA ratio stood at 0.4% (from 0.3% in 4QFY2010). The bank’s coverage ratio, including technical write-offs, stood at 76.7% (compared to 80.8% in 4QFY2010 and 75.4% in 1QFY2010). The bank has restructured cumulatively advances worth Rs2,811cr, forming 4.3% of total advances and 46.0% of the net worth. About Rs173cr of restructured accounts slipped into NPAs during the quarter, out of which Rs82cr was from the commercial real estate sector. July 29, 2010 4
  • 5. Corporation Bank | 1QFY2011 Result Update Exhibit 7: Trend in asset quality (Rs cr) Gross NPAs Net NPAs Coverage (RHS) (%) 800 90 80 600 70 400 60 200 50 - 40 3QFY08 4QFY08 1QFY09 2QFY09 3QFY09 4QFY09 1QFY10 2QFY10 3QFY10 4QFY10 1QFY11 Source: Company, Angel Research; Note: Coverage ratio excluding technical write-offs till 3QFY2010 Operating cost Operating costs increased 34.3% yoy but were down by 6.6% qoq to Rs343cr. The cost-to-income ratio stood at 35.6%, in-line with its eight quarter average of 35.9%. The bank opened four Branches during the quarter taking the total branch network to 1,159. Number of ATMs remained unchanged at 1,145 compared to 4QFY2010. Exhibit 8: Trend in productivity (%) Cost-to-Income ratio 50.0 43.9 45.2 44.6 40.1 39.5 40.9 40.3 40.0 34.3 35.2 35.6 33.6 30.9 30.0 26.8 20.0 1QFY08 2QFY08 3QFY08 4QFY08 1QFY09 2QFY09 3QFY09 4QFY09 1QFY10 2QFY10 3QFY10 4QFY10 1QFY11 Source: Company, Angel Research Capital adequacy – One of the best in PSU banks As per Basel-II norms, the bank’s capital adequacy ratio (CAR) stood comfortable at 15.1%, with a Tier-I ratio of 8.6%. The bank is one of the well-capitalised banks among PSU banks. July 29, 2010 5
  • 6. Corporation Bank | 1QFY2011 Result Update Exhibit 9: Comfortable capital adequacy (%) Tier-I CAR Tier-II CAR 20.0 16.0 12.0 8.0 4.0 - 3QFY09 4QFY09 1QFY10 2QFY10 3QFY10 4QFY10 1QFY11 Source: Company, Angel Research July 29, 2010 6
  • 7. Corporation Bank | 1QFY2011 Result Update Investment Arguments Modern, cost-efficient network to support moderate CASA growth Growth in average CASA deposits was robust relative to peers at 22.4%, as compared to peers during FY2007-10. We believe the bank’s efficient and expanding network, supported by a consistent track record in early adoption of emerging technologies, creates a positive traction in its deposit franchise, which is tempered mainly by substantial competition from larger banks. Maintaining strong growth in core non-interest income Corporation Bank’s core non-interest income grew by 36.0% in FY2010, taking the contribution of core non-interest income/average assets to 0.8% from 0.7% in FY2009. The bank has been able to maintain its growth (45.3% yoy) momentum during 1QFY2011. Low operating cost, superior asset quality owing to corporate, urban-centric business Large corporates comprise 38% of the bank’s credit book, contributing to relatively low yield on advances but, at the same time, is reflected in superior asset quality. The bank is also amongst the most cost-efficient banks, both in terms of opex/average assets as well as branch and employee productivity. Outlook and valuation Within mid-cap PSU banks, we like Corporation Bank due to its efficient operations, reflected in low operating expenses as a percentage of average assets, healthy asset quality and proactive investments in modern distribution and payment systems (relative to its peers). However, it will be difficult for the bank to maintain its growth trajectory due to a high-growth base in NII and non-interest income for the bank during FY2010, especially in a rising interest rate environment. Further, the bank’s relatively small, regional and urban-centric operations temper its growth outlook, on the key competitive parameters of CASA and fee income. At the CMP, the stock is trading at 5.7x FY2012E EPS of Rs99.9 and 1.05x FY2012E ABV of Rs544. We value the bank at 1.10x FY2012E ABV. We believe that the stock sufficiently reflects the medium-term positives at these valuations; hence, we have a Neutral view on the stock. July 29, 2010 7
  • 8. Corporation Bank | 1QFY2011 Result Update Exhibit 10: Key assumptions Earlier estimates Revised estimates Particulars (%) FY2011E FY2012E FY2011E FY2012E Credit growth 17.0 17.0 18.0 18.0 Deposit growth 16.0 16.0 16.0 16.0 CASA ratio 35.1 34.5 35.1 34.5 NIMs 2.4 2.3 2.4 2.3 Other income growth (9.1) 5.8 (9.1) 5.8 Growth in staff expenses 10.0 14.0 10.0 14.0 Growth in other expenses 10.0 14.0 10.0 14.0 Slippages 2.2 2.0 2.2 2.0 Coverage ratio 85.2 86.0 85.2 86.0 Treasury gain/(loss) (% of investments) 0.3 0.3 0.3 0.3 Source: Company, Angel Research Exhibit 11: Change in estimates FY2011E FY2012E Particulars (Rs cr) Earlier Revised Earlier Revised % chg % chg estimates estimates estimates estimates NII 1,295 1,312 1.3 1,481 1,502 1.4 Non-interest income 535 535 - 567 567 - Total income 1,830 1,847 0.9 2,048 2,068 1.0 Operating expenses 933 933 - 1,063 1,063 - Pre-prov. profit 897 914 1.9 984 1,005 2.1 Provisions & cont. 155 154 (0.6) 145 148 1.8 PBT 742 760 2.4 839 857 2.1 Prov. for taxes 185 190 2.4 210 214 2.1 PAT 556 570 2.4 629 643 2.1 Source: Company, Angel Research Exhibit 12: P/ABV band Price 0.50x 0.90x 1.30x 1.70x 2.10x (Rs) 1200 1000 800 600 400 200 0 Sep-02 Sep-03 Sep-04 Sep-05 Sep-06 Sep-07 Sep-08 Sep-09 Sep-10 Jan-00 Mar-03 Mar-04 Mar-05 Mar-06 Mar-07 Mar-08 Mar-09 Mar-10 Mar-11 Source: Company, Bloomberg, Angel Research July 29, 2010 8
  • 9. Corporation Bank | 1QFY2011 Result Update Exhibit 13: Recommendation summary CMP Tgt. price Upside FY2012E FY2012E FY2012E FY10-12E FY2012E FY2012E Company Reco. (Rs) (Rs) (%) P/ABV (x) Tgt. P/ABV (x) P/E (x) CAGR in EPS (%) RoA (%) RoE (%) AXISBK Buy 1,362 1,688 23.9 2.6 3.2 13.5 27.4 1.6 20.5 HDFCBK Buy 2,102 2,514 19.6 3.3 4.0 17.5 36.5 1.7 20.6 ICICIBK Buy 927 1,145 23.6 1.8 2.2 15.4 29.2 1.4 15.1 YesBk Neutral 292 - - 2.3 - 14.8 18.7 1.3 17.1 SIB Neutral 190 - - 1.1 - 6.7 17.1 1.0 17.8 FedBk Neutral 353 - - 1.0 - 7.5 31.4 1.4 14.6 SBI Accumulate 2,473 2,596 5.0 1.4 1.6 10.8 25.7 1.0 19.5 BOI Neutral 411 - - 1.3 - 8.0 24.3 0.8 17.3 CorpBk Neutral 569 - - 1.0 - 5.7 10.7 1.0 19.7 IndBk Neutral 225 - - 1.1 - 5.5 7.6 1.3 21.0 DenaBk Buy 99 114 15.7 0.8 1.0 4.4 12.1 0.9 18.9 IOB Accumulate 115 125 9.1 0.8 0.9 5.8 23.8 0.6 14.6 OBC Neutral 379 - - 1.0 - 6.3 15.0 0.9 16.6 PNB Reduce 1,054 948 (10.1) 1.4 1.3 7.1 9.5 1.2 22.0 UnionBk Neutral 315 - - 1.2 - 5.6 17.1 1.1 24.1 UcoBk Buy 92 112 21.5 0.8 1.0 4.0 12.0 0.8 23.8 Source: Company, Angel Research July 29, 2010 9
  • 10. Corporation Bank | 1QFY2011 Result Update Income statement Y/E March (Rs cr) FY06 FY07 FY08 FY09 FY10 FY11E FY12E Net Interest Income 1,227 1,378 1,443 1,691 2,210 2,806 3,138 - YoY Growth (%) 8.6 12.3 4.8 17.2 30.7 27.0 11.8 Other Income 571 640 700 1,016 1,089 1,103 1,300 - YoY Growth (%) 1.2 12.0 9.4 45.2 7.2 1.3 17.9 Operating Income 1,798 2,018 2,143 2,707 3,299 3,909 4,438 - YoY Growth (%) 6.2 12.2 6.2 26.3 21.9 18.5 13.5 Operating Expenses 747 804 892 1,002 1,260 1,386 1,594 - YoY Growth (%) 12.0 7.6 11.0 12.3 25.8 10.0 15.0 Pre - Provision Profit 1,052 1,214 1,251 1,705 2,039 2,523 2,844 - YoY Growth (%) 2.4 15.5 3.1 36.3 19.6 23.7 12.7 Prov. & Cont. 377 397 186 319 377 615 673 - YoY Growth (%) (10.7) 5.4 (53.3) 71.8 18.1 63.1 9.5 Profit Before Tax 675 817 1,065 1,386 1,662 1,908 2,171 - YoY Growth (%) 11.6 21.1 30.5 30.1 19.9 14.8 13.8 Prov. for Taxation 230 280 330 493 492 649 738 - as a % of PBT 34.1 34.3 31.0 35.6 29.6 34.0 34.0 PAT 444 536 735 893 1,170 1,259 1,433 - YoY Growth (%) 10.5 20.6 37.1 21.5 31.1 7.6 13.8 Balance sheet Y/E March (Rs cr) FY06 FY07 FY08 FY09 FY10E FY11E FY12E Share Capital 143 143 143 143 143 143 143 Reserve & Surplus 3,231 3,622 4,085 4,753 5,631 6,597 7,694 Deposits 32,877 42,357 55,424 73,984 92,734 111,280 130,198 - Growth (%) 20.7 28.8 30.9 33.5 25.3 20.0 17.0 Borrowings 1,660 3,021 2,138 2,072 5,028 6,033 7,059 Tier 2 Capital 300 300 800 2,500 4,050 4,901 5,832 Other Liab. & Prov. 2,295 3,277 3,867 3,348 3,803 4,712 5,464 Total Liabilities 40,507 52,721 66,458 86,800 111,389 133,667 156,390 Cash balances 1,640 2,984 7,104 5,591 8,835 7,790 9,765 Bank balances 2,449 3,735 1,812 4,949 1,957 2,348 2,747 Investments 10,652 14,417 16,512 24,938 34,523 43,618 48,864 Advances 23,962 29,950 39,186 48,512 63,203 76,475 91,005 - Growth (%) 29.2 25.0 30.8 23.8 30.3 21.0 19.0 Fixed Assets 256 281 272 299 289 337 382 Other Assets 1,548 1,354 1,572 2,512 2,582 3,099 3,626 Total Assets 40,507 52,721 66,458 86,800 111,389 133,667 156,390 - Growth (%) 19.4 30.2 26.1 30.6 28.3 20.0 17.0 July 29, 2010 10
  • 11. Corporation Bank | 1QFY2011 Result Update Ratio Analysis Y/E March FY06 FY07 FY08 FY09 FY10 FY11E FY12E Profitability ratios (%) NIMs 3.5 3.1 2.5 2.3 2.3 2.4 2.2 Cost to Income Ratio 41.5 39.8 41.6 37.0 38.2 35.5 35.9 RoA 1.2 1.0 1.2 1.2 1.2 1.0 1.0 RoE 13.8 13.6 18.4 19.6 21.9 20.1 19.7 B/S ratios (%) CASA Ratio 34.3 34.1 35.0 31.4 28.6 27.1 26.2 Credit/Deposit Ratio 72.9 70.7 70.7 65.6 68.2 68.7 69.9 CAR 13.9 12.8 12.1 12.7 14.3 13.1 13.2 - Tier I 12.4 11.3 9.6 8.3 8.6 7.7 7.7 Asset Quality (%) Gross NPAs 2.6 2.1 1.5 1.1 1.0 0.9 0.7 Net NPAs 0.6 0.5 0.3 0.3 0.3 0.3 0.2 Slippages 1.1 1.1 0.6 0.6 1.0 0.8 0.7 Loan Loss Prov./Avg. Assets 17.8 15.3 9.8 10.0 16.9 20.5 19.6 Provision Coverage 0.5 0.4 0.2 0.2 0.3 0.4 0.4 Per Share Data (Rs) EPS 31.0 37.4 51.2 62.2 81.6 87.8 99.9 ABVPS 235.3 262.5 294.8 341.1 398.3 467.6 544.1 DPS 7.0 9.0 10.5 12.5 16.5 17.5 20.0 Valuation Ratios PER (x) 18.4 15.2 11.1 9.1 7.0 6.5 5.7 P/ABVPS (x) 2.4 2.2 1.9 1.7 1.4 1.2 1.0 Dividend Yield 1.2 1.6 1.8 2.2 2.9 3.1 3.5 DuPont Analysis (%) NII 3.3 3.0 2.4 2.2 2.2 2.3 2.2 (-) Prov. Exp. 1.0 0.9 0.3 0.4 0.4 0.5 0.5 Adj. NII 2.3 2.1 2.1 1.8 1.9 1.8 1.7 Treasury 0.4 0.3 0.2 0.6 0.3 0.0 0.0 Int. Sens. Inc. 2.6 2.4 2.3 2.4 2.2 1.8 1.7 Other Inc. 1.2 1.1 0.9 0.7 0.8 0.9 0.9 Op. Inc. 3.8 3.5 3.3 3.1 2.9 2.7 2.6 Opex 2.0 1.7 1.5 1.3 1.3 1.1 1.1 PBT 1.8 1.8 1.8 1.8 1.7 1.6 1.5 Taxes 0.6 0.6 0.6 0.6 0.5 0.5 0.5 RoA 1.2 1.2 1.2 1.2 1.2 1.0 1.0 Leverage (x) 11.6 13.1 14.9 16.8 18.6 19.6 19.9 RoE 13.8 15.0 18.4 19.6 21.9 20.1 19.7 July 29, 2010 11
  • 12. Corporation Bank | 1QFY2011 Result Update Research Team Tel: 022 - 4040 3800 E-mail: research@angeltrade.com Website: www.angeltrade.com DISCLAIMER This document is solely for the personal information of the recipient, and must not be singularly used as the basis of any investment decision. Nothing in this document should be construed as investment or financial advice. Each recipient of this document should make such investigations as they deem necessary to arrive at an independent evaluation of an investment in the securities of the companies referred to in this document (including the merits and risks involved), and should consult their own advisors to determine the merits and risks of such an investment. Angel Broking Limited, its affiliates, directors, its proprietary trading and investment businesses may, from time to time, make investment decisions that are inconsistent with or contradictory to the recommendations expressed herein. The views contained in this document are those of the analyst, and the company may or may not subscribe to all the views expressed within. Reports based on technical and derivative analysis center on studying charts of a stock's price movement, outstanding positions and trading volume, as opposed to focusing on a company's fundamentals and, as such, may not match with a report on a company's fundamentals. The information in this document has been printed on the basis of publicly available information, internal data and other reliable sources believed to be true, but we do not represent that it is accurate or complete and it should not be relied on as such, as this document is for general guidance only. Angel Broking Limited or any of its affiliates/ group companies shall not be in any way responsible for any loss or damage that may arise to any person from any inadvertent error in the information contained in this report. Angel Broking Limited has not independently verified all the information contained within this document. Accordingly, we cannot testify, nor make any representation or warranty, express or implied, to the accuracy, contents or data contained within this document. While Angel Broking Limited endeavours to update on a reasonable basis the information discussed in this material, there may be regulatory, compliance, or other reasons that prevent us from doing so. This document is being supplied to you solely for your information, and its contents, information or data may not be reproduced, redistributed or passed on, directly or indirectly. Angel Broking Limited and its affiliates may seek to provide or have engaged in providing corporate finance, investment banking or other advisory services in a merger or specific transaction to the companies referred to in this report, as on the date of this report or in the past. Neither Angel Broking Limited, nor its directors, employees or affiliates shall be liable for any loss or damage that may arise from or in connection with the use of this information. Note: Please refer to the important `Stock Holding Disclosure' report on the Angel website (Research Section). Also, please refer to the latest update on respective stocks for the disclosure status in respect of those stocks. Angel Broking Limited and its affiliates may have investment positions in the stocks recommended in this report. Disclosure of Interest Statement Corporation Bank 1. Analyst ownership of the stock No 2. Angel and its Group companies ownership of the stock No 3. Angel and its Group companies' Directors ownership of the stock No 4. Broking relationship with company covered No Note: We have not considered any Exposure below Rs 1 lakh for Angel, its Group companies and Directors. Ratings (Returns): Buy (> 15%) Accumulate (5% to 15%) Neutral (-5 to 5%) Reduce (-5% to 15%) Sell (< -15%) July 29, 2010 12