Market Outlook -July 29, 2010
•
0 likes•46 views

The document provides an analysis of market performance and individual company results for the period. Key points include: - Indian indices ended the session down 0.7% and 0.6% as index heavyweights declined. - HDFC Bank raised fixed deposit rates in response to an interest rate hike by the RBI. - Company results were mixed with some like Corporation Bank and Lupin beating estimates while others like DLF and Jyoti Structures missed slightly. - Analysis is provided for several companies' quarterly earnings including commentary on sales, margins, profits and outlook.

Recommended
More Related Content
What's hot
What's hot (19)
Viewers also liked
Viewers also liked (18)
Similar to Market Outlook -July 29, 2010
Similar to Market Outlook -July 29, 2010 (17)
More from Angel Broking
More from Angel Broking (20)
Recently uploaded
Recently uploaded (20)
Market Outlook -July 29, 2010
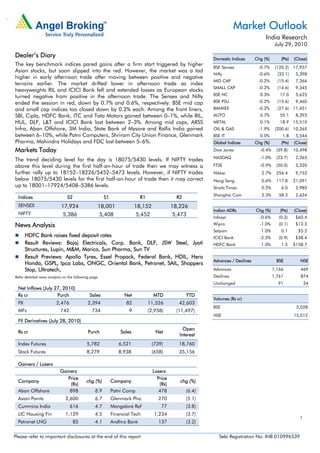
- 1. . Market Outlook India Research July 29, 2010 Dealer’s Diary Domestic Indices Chg (%) (Pts) (Close) The key benchmark indices pared gains after a firm start triggered by higher BSE Sensex -0.7% (120.2) 17,957 Asian stocks, but soon slipped into the red. However, the market was a tad Nifty -0.6% (33.1) 5,398 higher in early afternoon trade after moving between positive and negative MID CAP -0.2% (15.4) 7,366 terrains earlier. The market drifted lower in afternoon trade as index SMALL CAP -0.2% (14.6) 9,345 heavyweights RIL and ICICI Bank fell and extended losses as European stocks turned negative from positive in the afternoon trade. The Sensex and Nifty BSE HC 0.3% 17.0 5,625 ended the session in red, down by 0.7% and 0.6%, respectively. BSE mid cap BSE PSU -0.2% (15.6) 9,460 and small cap indices too closed down by 0.2% each. Among the front liners, BANKEX -0.2% (27.6) 11,451 SBI, Cipla, HDFC Bank, ITC and Tata Motors gained between 0–1%, while RIL, AUTO 0.7% 55.1 8,393 HUL, DLF, L&T and ICICI Bank lost between 2–3%. Among mid caps, ARSS METAL 0.1% 18.9 15,510 Infra, Aban Offshore, 3M India, State Bank of Mysore and Rallis India gained OIL & GAS -1.9% (200.6) 10,265 between 6–10%, while Patni Computers, Shriram City Union Finance, Glenmark BSE IT 0.0% 1.8 5,544 Pharma, Mahindra Holidays and FDC lost between 5–6%. Global Indices Chg (%) (Pts) (Close) Markets Today Dow Jones -0.4% (39.8) 10,498 NASDAQ -1.0% (23.7) 2,265 The trend deciding level for the day is 18075/5430 levels. If NIFTY trades above this level during the first half-an-hour of trade then we may witness a FTSE -0.9% (50.0) 5,320 further rally up to 18152–18226/5452–5473 levels. However, if NIFTY trades Nikkei 2.7% 256.4 9,753 below 18075/5430 levels for the first half-an-hour of trade then it may correct Hang Seng 0.6% 117.8 21,091 up to 18001–17924/5408–5386 levels. Straits Times 0.2% 6.0 2,985 Shanghai Com 2.3% 58.3 2,634 Indices S2 S1 R1 R2 SENSEX 17,924 18,001 18,152 18,226 Indian ADRs Chg (%) (Pts) (Close) NIFTY 5,386 5,408 5,452 5,473 Infosys -0.6% (0.3) $60.4 News Analysis Wipro -1.0% (0.1) $13.3 Satyam 1.0% 0.1 $5.2 HDFC Bank raises fixed deposit rates ICICI Bank -2.3% (0.9) $38.4 Result Reviews: Bajaj Electricals, Corp. Bank, DLF, JSW Steel, Jyoti HDFC Bank 1.0% 1.5 $158.7 Structures, Lupin, M&M, Marico, Sun Pharma, Sun TV Result Previews: Apollo Tyres, Essel Propack, Federal Bank, HDIL, Hero Advances / Declines BSE NSE Honda, GSPL, Ipca Labs, ONGC, Oriental Bank, Petronet, SAIL, Shoppers Stop, Ultratech, Advances 1,166 469 Refer detailed news analysis on the following page. Declines 1,761 874 Unchanged 91 34 Net Inflows (July 27, 2010) Rs cr Purch Sales Net MTD YTD Volumes (Rs cr) FII 2,476 2,394 82 11,526 42,603 BSE 5,028 MFs 742 734 9 (2,958) (11,497) NSE 15,012 FII Derivatives (July 28, 2010) Open Rs cr Purch Sales Net Interest Index Futures 5,782 6,521 (739) 18,760 Stock Futures 8,279 8,938 (658) 35,156 Gainers / Losers Gainers Losers Price Price Company chg (%) Company chg (%) (Rs) (Rs) Aban Offshore 898 8.9 Patni Comp 478 (6.4) Asian Paints 2,600 6.7 Glenmark Pha. 270 (5.1) Cummins India 616 4.7 Mangalore Ref 77 (3.8) LIC Housing Fin 1,129 4.5 Financial Tech 1,234 (3.7) 1 Petronet LNG 85 4.1 Andhra Bank 137 (3.2) Please refer to important disclosures at the end of this report Sebi Registration No: INB 010996539
- 2. Market Outlook | India Research HDFC Bank raises fixed deposit rates A day after the RBI increased its key policy rates to tame inflation, HDFC Bank has decided to increase its fixed deposit rates by 25–75bp for different maturities. Term deposit rate with maturity between 91 days–6 months was raised by 75bp to 5.25% from the existing 4.5%. For fixed deposit in between 9 months–1 year, the rate was increased by 50bp to 6.25%; while for the 1 year 16 days category, it was raised to 7%, 25bp more than the existing rate of 6.75%. The revised fixed deposit rates would be effective from July 30, 2010. Also, small private-sector lender Lakshmi Vilas Bank has decided to increase rates on some deposits by 25–50bp with effect from August 2, 2010. The increase in deposit rates was in line with expectations as credit growth has significantly outpaced deposits growth in the recent past. Result Reviews-1QFY2011 Bajaj Electricals Bajaj Electricals reported top-Line growth of 32.4% yoy in 1QFY2011 to Rs483.9cr (Rs365.4cr), which was slightly above our expectations. The company’s sales growth was driven by sales growth of 52.5% yoy in the lighting segment and 43.9% in the consumer durables segment. However, operating profit margin declined 134bp yoy to 8.4% (9.8%) on the back of higher raw-material prices. Given strong top-line growth, EPS increased to Rs2.27 (Rs1.88). Overall, the results were in line with our estimates. Currently, the stock is under review and we will be revising our numbers post the conference call. Corporation Bank Corporation Bank registered net profit growth of 27.8% on a yoy basis in 1QFY2011 to Rs334cr, which is better than our estimate of Rs264cr mainly on account of better-than- estimated NII coupled with lower effective tax rate. Steady operating performance with a minor deterioration in asset quality was the key highlight of the result. NII increased by robust 49.2% yoy and 9.0% qoq to Rs698cr. Non-interest income stood at Rs266cr, down 25.9% yoy and 2.4% on a sequential basis. Operating costs increased 34.3% yoy but were down by 6.6% qoq to Rs343cr. The cost-to-income ratio stood at 35.6%, in line with its eight-quarter average of 35.9%. Gross NPAs increased by 11.7% sequentially to Rs727cr, while net NPAs stood at Rs276cr compared to Rs197cr (a rise of 39.8%) in 4QFY2010. The bank’s gross and net NPA ratio stood at 1.1% (1.0% in 4QFY2010) and 0.4% (0.3% in 4QFY2010), respectively. The provision coverage ratio excluding technical write-offs declined to 62.1% compared to 69.7% in 4QFY2010. The bank’s CAR was healthy at 15.1%, with Tier-I CAR of 8.6%, as compared to 15.4% in 4QFY2010. We would revisit our earnings estimates and target price post our interaction with the bank’s management. We believe it will be difficult for the bank to maintain its growth trajectory on the back of a high growth base in NII and non-interest income during FY2010, especially in a rising interest rate environment. Further, the bank’s relatively small, regional and urban-centric operations temper its growth outlook on the key competitive parameters of CASA and fee income. At the CMP, the stock is trading at valuations of 1.1x FY2012E ABV. We have a Neutral rating on the stock. July 29, 2010 2
- 3. Market Outlook | India Research DLF DLF’s 1QFY2011 results were marginally below our expectations on account of higher interest expenses. The company reported strong revenue growth of 23.0% to Rs2,029cr (in line with our expectations), driven by an improvement in volumes and pricing in the residential segment, albeit on a low base. Operating margins came in at 48.3%, higher by 320bp yoy on account of revenue recognition from the Shivaji Road project in Delhi, where margins were between 40–50%. Consequently, operating profit grew by 31.7% yoy to Rs980cr. Interest costs grew by 35.0% yoy and 23.3% qoq to Rs388cr because of increased leverage due to the DLF-DAL integration. The tax rate stood at 29.3% in 1QFY2011 (against 20.7% in 1QFY2010 and 31.8% in 4QFY2010). Consequently, the reported PAT came in at Rs411cr, up by 3.8% yoy but down by 3.6% qoq, marginally below our estimates (Rs445cr). DLF has underperformed the Sensex over the last six months, on concerns of a weak operating cash flow and increasing gearing levels. The stock is trading at a 7% premium to our one-year forward NAV of Rs298. Hence, we maintain our Neutral rating on the stock. JSW Steel JSW Steel’s consolidated net revenue grew by 19.8% yoy to Rs4,779cr; however, it declined by 12.2% qoq primarily on account of lower sales volume. Sales volume declined by 9.8% yoy and 21.6% qoq to 1.2mn tonnes because of cheaper imports mainly from China. However, the company gained from favorable steel prices, which increased by 31.2% yoy and 13.8% qoq to Rs38,692/tonne. Despite staff cost and other expenses (adjusted for Forex loss of Rs55cr) increasing by 46.8% yoy and 33.9% yoy, respectively, EBITDA margins expanded by 646bp yoy to 23.7% because of higher realisations. This was reflected in EBITDA increasing by 64.7% yoy to Rs1,134cr. Net profit increased by 26.2% yoy to Rs295cr, below our estimates, largely due to deviation in the top line. Deal with JFE Steel: Following extensive deliberations after a partnership agreement signed on November 19, 2009, the strategic alliance between JFE Steel and JSW Steel has concluded and JFE Steel will make an initial investment of Rs4,800cr. The deal has been innovatively structured with options available to JFE Steel to maintain or increase its stake in the event of future equity (warrants and FCCBs) dilution. Currently, the stock is trading at 7.1x FY2011E and 5.6x FY2012E EV/EBITDA. We believe JSW is well placed to capitalise on a) strong domestic demand, b) improving product mix, c) commissioning of beneficiation plant to lower iron ore cost and d) improvement in raw- material sufficiency. We maintain our Buy recommendation on the stock with a revised Target Price of Rs1,344 (earlier Rs1,360), valuing the stock at 6.5x FY2012E EV/EBITDA. Jyoti Structures Jyoti Structures posted moderate top-line growth of 16.5% yoy to Rs564.2cr (Rs484.3cr) for 1QFY2011, which was slightly below our estimates. On the operating front, EBITDA margin remained nearly flat at ~11.3% yoy. Net profit grew by modest 18% yoy to Rs26.3cr (Rs22.3cr) for the quarter. We will revisit our estimates post the conference call. July 29, 2010 3
- 4. Market Outlook | India Research Lupin Lupin’s 1QFY2011 results were marginally above our estimates. Net sales came in at Rs1,312cr (Rs1,086cr), up 20.9% yoy, driven by US and domestic formulation markets. In the US, the branded generic market grew by 51% yoy and generic business grew by 45% yoy. Further, the domestic formulation business grew by 23% yoy to Rs424cr (Rs344.4cr). However, Japan reported flat yoy growth at Rs129.9cr. The company reported OPM of 20.0% (17.9%) (excluding other income) on the back of a 470bp expansion in gross margin to 61.6% (56.9%). However, the increase in gross margin was partially negated as employee expenses, which increased by 35.4% to Rs178.1cr (Rs131.5cr). Lupin reported net profit of Rs196.3cr (Rs140.1cr) driven by top-line growth and OPM expansion. On the filings front, the company filed three ANDAs during the quarter, taking its cumulative filing to 130, of which 85 are pending for approval. The stock is trading at 20.6x FY2011E and 16.5x FY2012E earnings. We maintain Accumulate on the stock with a target price of Rs2,099. Mahindra and Mahindra Mahindra and Mahindra (M&M) reported 22% yoy growth in net sales during 1QFY2011 to Rs5,160cr (Rs4,243cr), which was in line with our expectations. Growth was largely aided by a 24% yoy jump in volumes and marginal decline in realisations (owing to change in the product mix). Top-line jump was primarily aided by a 27.6% yoy increase in the auto segment and a 15.1% yoy increase in farm equipment business. On the operating front, the company reported 27% yoy jump in EBITDA, where operating margins for the quarter improved marginally by 68bp yoy on better operating leverage. Overall, operating performance also came in line with our expectations. Net profit for the quarter, however, came in above our expectations at Rs562cr, largely on account of higher net interest income and lower tax rate during 1QFY2011. The consolidated performance was marginally below our expectations, with top-line growth of 9.4% yoy to Rs8,576cr (Rs7,841cr). However, consolidated group revenue is not exactly comparable with the previous year’s due to AT&T exercising its stock option and as Tech Mahindra ceased to be a group subsidiary and became a JV of the company (application of AS-27). Bottom line stood at Rs621cr (Rs432cr) for the quarter. We maintain our positive outlook on the company. We currently have an Accumulate rating on the stock with an SOTP target price of Rs706, wherein its core business fetches Rs475 and the value of its investments works out to Rs231. July 29, 2010 4
- 5. Market Outlook | India Research Marico Marico posted steady top-line growth of 13.4% yoy to Rs790cr (Rs697cr), above our estimates, led by strong 16% volume growth. However, price cuts taken in core brands in 2HFY2010 (to pass on deflation in key inputs) led to negative value growth curtailing overall top-line growth. The company’s core brands Parachute and Saffola posted volume growth of 14% and 17.5%, respectively, for the quarter. Marico witnessed contraction in gross margin by 80bp yoy/711bp qoq as copra, rice bran oil and HDPE prices were higher by 4%, 1% and 22%, respectively. However, prices of safflower oil trended lower by 12% yoy during the quarter. Moreover, price cuts undertaken in recruiter packs of Parachute and promotional offers on core brands undertaken during the quarter put further pressure on gross margins. Hence, OPM contracted by 50bp yoy to 13.3% despite a 16bp yoy and 32bp yoy reduction in staff costs and advertising spends, resulting into muted 9.3% yoy growth in EBITDA to Rs106cr. Adjusted for provisioning of Rs8.8cr (Rs4.8cr) for excise duty on CNO packs of up to 200ml during the quarter, OPM was flat at ~14.5%. In terms of earnings, Marico posted growth of 32% yoy to Rs73.7cr (Rs60) on a reported basis, below our estimates, boosted largely by a 951bp decline in tax rate due to production from manufacturing facilities in tax-free zones and higher contribution from international business. However, on a recurring basis, adjusted for Rs4.1cr loss in 1QFY2010 due to sale of Sundari and excise duty provisioning, earnings grew ~27% yoy to Rs82.5cr, ~5% above our estimates. We have upgraded our estimates by ~2–3% to model in 1) revenue accretion from the recent acquisition of Derma Rx, 2) higher volume growth in core brands of Parachute/Saffola and 3) promising new prototypes–Saffola Arise, Saffola Oats and cooling oil variants. We upgrade the stock from Reduce to Neutral. At the CMP of Rs126, the stock is trading at 22.3x FY2012E earnings (in line with its historical valuations), leaving little room for an upside. Hence, we upgrade the stock from Reduce to Neutral (modeling in our upgrade in estimates by ~2–3%) with a fair value of Rs124 (Rs115) based on a P/E multiple of 22x FY2012E earnings. Sun Pharma Sun Pharma’s 1QFY2011 results were much ahead of our estimates, driven by one-time sales of generic version of Eloxatin. Net sales grew by 26.2% qoq to Rs1,400cr (Rs1,109cr) on the back of strong growth on the domestic formulation (16.4% qoq) and export (73.4% qoq) fronts. Excluding sales of the generic version of Eloxatin (~US$70mn), recurring sales were flat qoq at Rs1,078cr (Rs1,063cr). The company has stopped selling the generic version of Eloxatin from June 30. During the quarter, the company reported OPM of 44% (37.7%), which expanded by 630bp qoq on the back of one-time sales. Excluding the one-time impact, OPM came in flat at 36.3% qoq for 1QFY2011. Sun Pharma reported recurring profit of Rs340cr (Rs362cr), down 6% qoq because of higher tax charges and lower other income. The company filed four ANDAs during the quarter, with 120 ANDAs now awaiting approval. Sun Pharma received seven ANDA approvals during the quarter. We recommend Neutral on the stock. July 29, 2010 5
- 6. Market Outlook | India Research Sun TV Network Sun TV reported robust 53% yoy top-line growth, led by 1) ~50% yoy growth in advertising revenue, 2) ~84% yoy/10% qoq growth in DTH revenue (6.3mn subscriber base, Rs35–36 ARPU) and 3) ~42% yoy/9% qoq jump in analogue revenue. Ad revenue grew largely on account of ad-rate hike absorption (blended ad-rate hike of 5–33% taken across channels effective January 2010), better inventory utilisation and increased traction from niche channels (kids/comedy) launched in 1QFY2010. While analogue subscription revenue registered robust growth on account of renewed focus of the management in terms of distribution and incremental revenue traction from Malyalam channels (turned pay effective April 2010), DTH revenue registered strong yoy growth due to higher subscriber base and increased ARPUs (revised bouquet rates due to addition of new channels). In terms of earnings, Sun TV posted robust growth of 43% yoy to Rs171cr (Rs120cr) on a recurring basis, despite spike in depreciation/amortisation expense (up 109% yoy) and a 21% yoy decline in other income to Rs11cr (Rs14cr), aided by strong top-line growth and significant operating margin expansion of 397bp yoy, driving a whopping 61% yoy growth in operating profit. The stock is currently under review. Result Previews-1QFY2011 Apollo Tyres Apollo Tyres is slated to announce its 1QFY2011 results. The company is expected to deliver marginal 4% yoy growth in revenue to Rs1,228cr for the quarter. Sales growth is expected to be muted due to lock-out at the company’s Perambra (Kerala) facility, which accounts for ~30% of its production capacity. On the operating front, the company is expected to post 505bp yoy decline in margins to 11.4% because of the increase in natural rubber prices. Net profit is expected to decline by 31.9% yoy to Rs64.4cr. The stock rating is under review. Essel Propack Essel Propack is slated to announce its 1QFY2011 results. The company is expected to post top-line decline of 2.9% to Rs324cr for the quarter. The company's OPM is estimated to expand by 110bp to 19%. Net profit is expected to come at Rs10cr. We maintain our Buy rating on the stock with target price of Rs58. Federal Bank Federal Bank is scheduled to announce its 1QFY2011 results. We expect the bank to report strong NII growth of 39% on a yoy basis to Rs402cr. NIM is also expected to decline sequentially by 15bp to 3.8% on account of interest payment on savings accounts on a daily basis. The cost-to-income ratio is expected to be flat at 35%. Operating profit is expected to show a decent gain of 24% to Rs345cr on a yoy basis. Net profit is expected to go up by a steady 11.5% on a yoy basis to Rs152cr. At the CMP, the stock is trading at relatively cheaper valuations of 1.0x FY2012E ABV. We have an Accumulate rating on the stock, valuing it at 1.1x FY2012E ABV of Rs337.6 to arrive at a 12-month target price of Rs371. July 29, 2010 6
- 7. Market Outlook | India Research HDIL HDIL is scheduled to announce its 1QFY2011 results. We expect HDIL to report 42.4% yoy growth in revenue to Rs421cr on account on higher TDR prices. However, we expect flat to 10% qoq decline in TDR volumes, with average realisations to be higher by 5–6% qoq. We expect a 1,069bp yoy increase in OPM at 50.0%, as TDR prices have increased by 100% since the last one year as compared to a 15–20% increase in construction cost. Consequently, the company’s net profit is estimated to grow by 58.8% yoy to Rs170.7cr. At the CMP, the stock is trading at 36% discount to our one-year forward NAV of Rs402. We recommend Buy on the stock with a target price of Rs302. Hero Honda Hero Honda is slated to announce its 1QFY2011 results. We expect the company’s top line to grow by 12.5% yoy to Rs4,287cr on account of 10.3% yoy growth in volumes and improved realisations. On the operating front, EBITDA margin is expected to decline by 76bp yoy to 16.3%. However, the bottom line is expected to grow by 19.2% yoy to Rs596.1cr. The stock rating is under review. GSPL GSPL is likely to announce its 1QFY2011 results. The numbers are likely to be strong on a yoy basis as GSPL is likely to report 36.4% yoy bottom-line growth, largely on account of increased volumes in the last one year (a 50.1% yoy increase). However, the same is likely to be muted on a qoq basis, with growth of 4.3% on the volumes front. Top line is likely to register growth of 26.3% on account of increased volumes during the quarter. Average realisation is likely to decline by 15.8% yoy to Rs770/tscm as against Rs910/tscm in 1QFY2010. Operating profit during the quarter is likely to increase by 25.6% yoy on account of increased volume transmission. Bottom line during the quarter is likely to increase by 36.4% yoy, driven by higher volumes transmitted. We maintain a Buy on GSPL with a target price of Rs120. Ipca Labs Ipca Labs (Ipca) is slated to announce its 1QFY2011 results. The company is expected to post top-line growth of 16.4% to Rs417cr for the quarter. Ipca is expected to post strong growth on the export and domestic formulation fronts. The company's OPM is estimated to expand by 63bp to 20.4%. Net profit is expected to come at Rs53cr. We maintain Neutral on the stock. ONGC Oil and Natural Gas Corporation (ONGC) is likely to report its 1QFY2011 results. ONGC's performance for the quarter is likely to be weak because of the decline in the net realisations during the quarter. During FY2010, upstream companies paid subsidy only on auto fuels. However, there was no announcement of the subsidy-sharing formula for 1QFY2011; we had built in ONGC to bear subsidy burden on auto fuels, resulting in ONGC’s share of subsidy burden at Rs6,554cr during the quarter. However, the government has asked upstream companies to share 33% of the overall under-recoveries during the quarter, on account of the same ONGC’s subsidy burden during the quarter is likely to be around Rs5,516cr. Thus, in light of the new subsidy-burden mechanism, we believe ONGC is likely to report net realisations of US$52.1/bbl (US$58.3/bbl in 1QFY2010). Consequently, bottom line is expected register a decline of 6.8% yoy in PAT to Rs4,325cr (Rs4,638cr). We maintain Accumulate on ONGC with a target price of Rs1,356. July 29, 2010 7
- 8. Market Outlook | India Research Oriental Bank of Commerce Oriental Bank of Commerce is scheduled to announce its 1QFY2011 results. We expect the bank to post a robust increase of 101% in NII on a yoy basis to Rs972cr and a marginal dip of 1.8% on a sequential basis. However, the bank’s NIM is expected to decline sequentially by 20bp because of interest payment on savings accounts on a daily basis. Operating profit is expected to go up by a healthy 37% on a yoy basis. Net profit is expected to increase by a healthy 26% on a yoy basis to Rs325cr. At the CMP, the stock is trading at valuations of 0.9x FY2012E ABV. We have a Neutral rating on the stock. Petronet LNG Petronet LNG is likely to announce subdued results for 1QFY2011 results. Despite the expansion of the Dahej terminal, volumes are likely to remain subdued on a yoy basis. We expect volumes during the quarter to be at 92TBTUs (96TBTUs). The key rationale for subdued volumes was the absence of spot volumes during the quarter, which dried down on account of increased availability of domestic gas coupled with pipeline capacity constraints. Top line during the quarter is likely to decline by 4.8% yoy to Rs2,486cr (Rs2,612cr), largely on account of lower volumes processed. However, operating profit during the quarter is likely to increase to Rs249cr (Rs182cr) due to marketing losses in 1QFY2010. On account of the increase in depreciation and interest expenditure during the quarter along with lower other income, bottom line is likely to grow at a lower pace of 10.4% yoy to Rs114cr (Rs103cr). We have a Neutral rating on the stock. SAIL SAIL is slated to announce its 1QFY2011 results. The company is expected to deliver 4.9% yoy growth in its top line to Rs9,391cr. On the operating front, SAIL is expected to report a 381bp expansion in its operating margin to 24.8%. Thus, we expect net profit to increase by 10.2% yoy to Rs1,462cr. We maintain a Neutral view on the stock Shoppers Stop Shoppers Stop Ltd. (SSL) is scheduled to announce its 1QFY2010 results. The company is expected to post top-line growth of 31.8% yoy to Rs421cr. On the operating front, we expect SSL to post a 247bp margin expansion to 7.3%. Consequently, net profit is expected to be at Rs14cr against a loss of Rs1cr in 1QFY2010. We maintain our Neutral recommendation on the stock. Ultratech Ultratech is expected to announce its 1QFY2011 results. We expect the company to post a 4.5% yoy increase in net sales to Rs2,041cr. The OPM is expected to decline by 1,331bp yoy to 23.4% on account of higher raw material and freight costs. We expect the company to register net profit of Rs276cr, down by 33.7% on a yoy basis. We maintain a Buy view on the stock with a target price of Rs1,084. July 29, 2010 8
- 9. Market Outlook | India Research Economic and Political News Government to sign US $775mn jet deal with BAE Systems Karnataka may ban iron ore transport permits, reports Press Trust of India PNGRB invites bids for retailing gas in four states Corporate News ICICI Bank picks up 1.33% stake in United Stock Exchange DLF in talks to cut stake in insurance JV with Prudential Piramal Glass plans to sell land for Rs30cr–40cr Source: Economic Times, Business Standard, Business Line, Financial Express, Mint Events for the day Aban Offshore Results Alok Industries Results Amara Raja Results Apollo Tyres Results Bank of Maharashtra Results Bata India Results Berger Paints Results BOB Results Central Bank Results Federal Bank Results GHCL Results Great Eastern Shipping Results GSPC Results HCL Tech Results HDIL Results Hero Honda Results Hexaware Tech Results IPCA Lab Results J B Chemicals Results Kalpataru Power Results MPS Ltd Results Nagarjuna Fertilizers Results National Fertilizers Results NHPC Results Novartis India Results ONGC Results Oriental Bank of Commerce Results Petronet LNG Results SAIL Results Siemens Results Tata Teleservices Results TATAGLOBAL Results Tube Investments Results Ultratech Cement Results July 29, 2010 9
- 10. Market Outlook | India Research Research Team Tel: 022-4040 3800 E-mail: research@angeltrade.com Website: www.angeltrade.com DISCLAIMER This document is solely for the personal information of the recipient, and must not be singularly used as the basis of any investment decision. Nothing in this document should be construed as investment or financial advice. Each recipient of this document should make such investigations as they deem necessary to arrive at an independent evaluation of an investment in the securities of the companies referred to in this document (including the merits and risks involved), and should consult their own advisors to determine the merits and risks of such an investment. Angel Broking Limited, its affiliates, directors, its proprietary trading and investment businesses may, from time to time, make investment decisions that are inconsistent with or contradictory to the recommendations expressed herein. The views contained in this document are those of the analyst, and the company may or may not subscribe to all the views expressed within. Reports based on technical and derivative analysis center on studying charts of a stock's price movement, outstanding positions and trading volume, as opposed to focusing on a company's fundamentals and, as such, may not match with a report on a company's fundamentals. The information in this document has been printed on the basis of publicly available information, internal data and other reliable sources believed to be true, but we do not represent that it is accurate or complete and it should not be relied on as such, as this document is for general guidance only. Angel Broking or any of its affiliates/ group companies shall not be in any way responsible for any loss or damage that may arise to any person from any inadvertent error in the information contained in this report. Angel Broking Limited has not independently verified all the information contained within this document. Accordingly, we cannot testify, nor make any representation or warranty, express or implied, to the accuracy, contents or data contained within this document. While Angel Broking Limited endeavours to update on a reasonable basis the information discussed in this material, there may be regulatory, compliance, or other reasons that prevent us from doing so. This document is being supplied to you solely for your information, and its contents, information or data may not be reproduced, redistributed or passed on, directly or indirectly. Angel Broking Limited and its affiliates may seek to provide or have engaged in providing corporate finance, investment banking or other advisory services in a merger or specific transaction to the companies referred to in this report, as on the date of this report or in the past. Neither Angel Broking Limited, nor its directors, employees or affiliates shall be liable for any loss or damage that may arise from or in connection with the use of this information. Note: Please refer to the important `Stock Holding Disclosure' report on the Angel website (Research Section). Address: Acme Plaza, ‘A’ Wing, 3rd Floor, M.V. Road, Opp. Sangam Cinema, Andheri (E), Mumbai - 400 059. Tel : (022) 3952 4568 / 4040 3800 Angel Broking Ltd: BSE Sebi Regn No : INB 010996539 / CDSL Regn No: IN - DP - CDSL - 234 - 2004 / PMS Regn Code: PM/INP000001546 Angel Capital & Debt Market Ltd: INB 231279838 / NSE FNO: INF 231279838 / NSE Member code -12798 Angel Commodities Broking (P) Ltd: MCX Member ID: 12685 / FMC Regn No: MCX / TCM / CORP / 0037 NCDEX : Member ID 00220 / FMC Regn No: NCDEX / TCM / CORP / 0302 July 29, 2010 10