1. Derivative Report
India Research
May 20, 2010
Comments
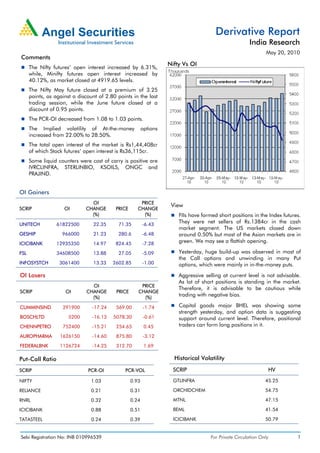
Nifty Vs OI
The Nifty futures’ open interest increased by 6.31%,
while, Minifty futures open interest increased by
40.12%, as market closed at 4919.65 levels.
The Nifty May future closed at a premium of 3.25
points, as against a discount of 2.80 points in the last
trading session, while the June future closed at a
discount of 0.95 points.
The PCR-OI decreased from 1.08 to 1.03 points.
The Implied volatility of At-the-money options
increased from 22.00% to 28.50%.
The total open interest of the market is Rs1,44,408cr
of which Stock futures’ open interest is Rs36,115cr.
Some liquid counters were cost of carry is positive are
IVRCLINFRA, STERLINBIO, KSOILS, ONGC and
PRAJIND.
OI Gainers
OI PRICE
View
SCRIP OI CHANGE PRICE CHANGE
(%) (%) FIIs have formed short positions in the Index futures.
UNITECH 61822500 22.35 71.35 -6.43
They were net sellers of Rs.1384cr in the cash
market segment. The US markets closed down
GESHIP 966000 21.23 280.6 -6.48 around 0.50% but most of the Asian markets are in
ICICIBANK 12935350 14.97 824.45 -7.28 green. We may see a flattish opening.
FSL 34608500 13.88 27.05 -5.09 Yesterday, huge build-up was observed in most of
the Call options and unwinding in many Put
INFOSYSTCH 3061400 13.33 2602.85 -1.00 options, which were mainly in in-the-money puts.
OI Losers Aggressive selling at current level is not advisable.
As lot of short positions is standing in the market.
OI PRICE
Therefore, it is advisable to be cautious while
SCRIP OI CHANGE PRICE CHANGE
(%) (%)
trading with negative bias.
CUMMINSIND 291900 -17.24 569.00 -1.74 Capital goods major BHEL was showing some
strength yesterday, and option data is suggesting
BOSCHLTD 5200 -16.13 5078.30 -0.61 support around current level. Therefore, positional
CHENNPETRO 752400 -15.21 254.65 0.45 traders can form long positions in it.
AUROPHARMA 1626150 -14.60 875.80 -3.12
FEDERALBNK 1126724 -14.25 312.70 1.69
Put-Call Ratio Historical Volatility
SCRIP PCR-OI PCR-VOL SCRIP HV
NIFTY 1.03 0.93 GTLINFRA 45.25
RELIANCE 0.21 0.31 ORCHIDCHEM 54.75
RNRL 0.32 0.24 MTNL 47.15
ICICIBANK 0.88 0.51 BEML 41.54
TATASTEEL 0.24 0.39 ICICIBANK 50.79
Sebi Registration No: INB 010996539 For Private Circulation Only 1
2. Derivative Report | India Research
FII Statistics for 19-May-2010 Turnover on 19-May-2010
Open Interest
No. of Turnover Change
Detail Buy Sell Net Instrument
Contracts (Rs. in cr.) (%)
Contracts Value Change
(Rs. in cr.) (%)
INDEX Index Futures 1106995 25723.45 51.08
3674.13 5229.28 (1,555.15) 572432 14052.28 2.94
FUTURES
INDEX Stock Futures 699898 21875.56 28.52
9474.98 6806.50 2,668.49 1944497 47801.33 0.32
OPTIONS
STOCK Index Options 3332606 84515.47 48.38
3131.42 3108.92 22.50 1051930 29286.42 1.34
FUTURES
STOCK Stock Options 129060 4460.61 24.95
342.93 356.39 (13.46) 46794 1378.91 2.98
OPTIONS
TOTAL 16623.47 15501.10 1,122.37 3615653 92518.93 1.06 Total 5268559 136575.09 44.41
Nifty Spot = 4919.65 Lot Size = 50
Bull-Call Spreads Bear-Put Spreads
Action Strike Price Risk Reward BEP Action Strike Price Risk Reward BEP
Buy 5000 46.70 Buy 4900 76.10
27.55 72.45 5027.55 33.85 66.15 4866.15
Sell 5100 19.15 Sell 4800 42.25
Buy 5000 46.70 Buy 4900 76.10
39.85 160.15 5039.85 53.75 146.25 4846.25
Sell 5200 6.85 Sell 4700 22.35
Buy 5100 19.15 Buy 4800 42.25
12.30 87.70 5112.30 19.90 80.10 4780.10
Sell 5200 6.85 Sell 4700 22.35
Note: Above mentioned Bullish or Bearish Spreads in Nifty (May Series) are given as an information and not as a recommendation
Nifty Put-Call Analysis
For Private Circulation Only Sebi Registration No: INB 010996539 2
3. Derivative Report | India Research
Strategy Date Scrip Strategy Status
30-04-2010 RELCAPITAL Long Call Ladder Continue
30-04-2010 NAGARFERT Long Call Continue
08-05-2010 HINDUNILVR Short Strangle Continue
17-May-2010 CAIRN Long Put Continue
DISCLAIMER:
This document is not for public distribution and has been furnished to you solely for your information and must not be reproduced or redistributed to any other person.
Persons into whose possession this document may come are required to observe these restrictions.
Opinion expressed is our current opinion as of the date appearing on this material only. While we endeavor to update on a reasonable basis the information discussed in
this material, there may be regulatory, compliance, or other reasons that prevent us from doing so. Prospective investors and others are cautioned that any forward-
looking statements are not predictions and may be subject to change without notice. Our proprietary trading and investment businesses may make investment decisions
that are inconsistent with the recommendations expressed herein.
The information in this document has been printed on the basis of publicly available information, internal data and other reliable sources believed to be true and are for
general guidance only. While every effort is made to ensure the accuracy and completeness of information contained, the company takes no guarantee and assumes no
liability for any errors or omissions of the information. No one can use the information as the basis for any claim, demand or cause of action.
Recipients of this material should rely on their own investigations and take their own professional advice. Each recipient of this document should make such investigations
as it deems necessary to arrive at an independent evaluation of an investment in the securities of companies referred to in this document (including the merits and risks
involved), and should consult their own advisors to determine the merits and risks of such an investment. Price and value of the investments referred to in this material may
go up or down. Past performance is not a guide for future performance.
Certain transactions - futures, options and other derivatives as well as non-investment grade securities - involve substantial risks and are not suitable for all investors.
Reports based on technical analysis centers on studying charts of a stock's price movement and trading volume, as opposed to focusing on a company's fundamentals and
as such, may not match with a report on a company's fundamentals.
We do not undertake to advise you as to any change of our views expressed in this document. While we would endeavor to update the information herein on a reasonable
basis, Angel Broking, its subsidiaries and associated companies, their directors and employees are under no obligation to update or keep the information current. Also
there may be regulatory, compliance, or other reasons that may prevent Angel Broking and affiliates from doing so. Prospective investors and others are cautioned that
any forward-looking statements are not predictions and may be subject to change without notice.
Angel Broking Limited and affiliates, including the analyst who has issued this report, may, on the date of this report, and from time to time, have long or short positions
in, and buy or sell the securities of the companies mentioned herein or engage in any other transaction involving such securities and earn brokerage or compensation or
act as advisor or have other potential conflict of interest with respect to company/ies mentioned herein or inconsistent with any recommendation and related information
and opinions.
Angel Broking Limited and affiliates may seek to provide or have engaged in providing corporate finance, investment banking or other advisory services in a merger or
specific transaction to the companies referred to in this report, as on the date of this report or in the past.
Sebi Registration No.: INB 010996539
Derivative Research Team derivatives.desk@angeltrade.com
For Private Circulation Only Sebi Registration No: INB 010996539 3