TataKelola dan KamSiber Kecerdasan Buatan v022.pdf
Derivatives Report- July 12, 2010
1. Derivative Report
India Research
July 12, 2010
Comments
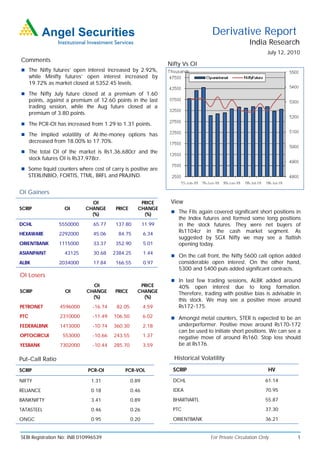
Nifty Vs OI
The Nifty futures’ open interest increased by 2.92%,
while Minifty futures’ open interest increased by
19.72% as market closed at 5352.45 levels.
The Nifty July future closed at a premium of 1.60
points, against a premium of 12.60 points in the last
trading session, while the Aug future closed at a
premium of 3.80 points.
The PCR-OI has increased from 1.29 to 1.31 points.
The Implied volatility of At-the-money options has
decreased from 18.00% to 17.70%.
The total OI of the market is Rs1,36,680cr and the
stock futures OI is Rs37,978cr.
Some liquid counters where cost of carry is positive are
STERLINBIO, FORTIS, TTML, BRFL and PRAJIND.
OI Gainers
OI PRICE View
SCRIP OI CHANGE PRICE CHANGE
The FIIs again covered significant short positions in
(%) (%)
the Index futures and formed some long positions
DCHL 5550000 65.77 137.80 11.99 in the stock futures. They were net buyers of
HEXAWARE 2292000 45.06 84.75 6.34
Rs1104cr in the cash market segment. As
suggested by SGX Nifty we may see a flattish
ORIENTBANK 1115000 33.37 352.90 5.01 opening today.
ASIANPAINT 43125 30.68 2384.25 1.44
On the call front, the Nifty 5600 call option added
ALBK 2034000 17.84 166.55 0.97 considerable open interest. On the other hand,
5300 and 5400 puts added significant contracts.
OI Losers
In last few trading sessions, ALBK added around
OI PRICE 40% open interest due to long formation.
SCRIP OI CHANGE PRICE CHANGE Therefore, trading with positive bias is advisable in
(%) (%)
this stock. We may see a positive move around
PETRONET 4596000 -16.74 82.05 4.59 Rs172-175.
PTC 2310000 -11.49 106.50 6.02 Amongst metal counters, STER is expected to be an
FEDERALBNK 1413000 -10.74 360.30 2.18 underperformer. Positive move around Rs170-172
can be used to initiate short positions. We can see a
OPTOCIRCUI 553000 -10.66 243.55 1.37 negative move of around Rs160. Stop loss should
YESBANK 7302000 -10.44 285.70 3.59 be at Rs176.
Put-Call Ratio Historical Volatility
SCRIP PCR-OI PCR-VOL SCRIP HV
NIFTY 1.31 0.89 DCHL 61.14
RELIANCE 0.18 0.46 IDEA 70.95
BANKNIFTY 3.41 0.89 BHARTIARTL 55.87
TATASTEEL 0.46 0.26 PTC 37.30
ONGC 0.95 0.20 ORIENTBANK 36.21
SEBI Registration No: INB 010996539 For Private Circulation Only 1
2. Derivative Report | India Research
FII Statistics for 09-July-2010 Turnover on 09-July-2010
Open Interest
No. of Turnover Change
Detail Buy Sell Net Instrument
Contracts (Rs. in cr.) (%)
Contracts Value Change
(Rs. in cr.) (%)
INDEX Index Futures 427908 10545.81 -13.50
1836.08 776.54 1,059.53 619030 16482.90 -2.26
FUTURES
INDEX Stock Futures 564250 16122.47 22.81
3187.44 3134.37 53.07 1870441 50020.05 -0.08
OPTIONS
STOCK Index Options 1356249 36137.43 -17.36
1476.95 945.93 531.01 1135259 30324.40 0.87
FUTURES
STOCK Stock Options 118347 3543.77 38.43
94.95 104.88 (9.94) 48492 1357.79 2.76
OPTIONS
TOTAL 6595.41 4961.73 1,633.68 3673222 98185.14 -0.13 Total 2466754 66349.49 -7.34
Nifty Spot = 5352.45 Lot Size = 50
Bear-Put Spreads
Bull-Call Spreads
Action Strike Price Risk Reward BEP Action Strike Price Risk Reward BEP
Buy 5400 58.35 Buy 5300 63.30
35.25 64.75 5435.25 24.90 75.10 5275.10
Sell 5500 23.10 Sell 5200 38.40
Buy 5400 58.35 Buy 5300 63.30
51.20 148.80 5451.20 39.90 160.10 5260.10
Sell 5600 7.15 Sell 5100 23.40
Buy 5500 23.10 Buy 5200 38.40
15.95 84.05 5515.95 15.00 85.00 5185.00
Sell 5600 7.15 Sell 5100 23.40
Note: Above mentioned Bullish or Bearish Spreads in Nifty (July Series) are given as an information and not as a recommendation
Nifty Put-Call Analysis
For Private Circulation Only SEBI Registration No: INB 010996539 2
3. Derivative Report | India Research
Strategy Date Scrip Strategy Status
28-June-2010 Reliance Long Put Continue
05-July 2010 Nifty Put Hedge Continue
DISCLAIMER:
This document is not for public distribution and has been furnished to you solely for your information and must not be reproduced or redistributed to any other person.
Persons into whose possession this document may come are required to observe these restrictions.
Opinion expressed is our current opinion as of the date appearing on this material only. While we endeavor to update on a reasonable basis the information discussed in
this material, there may be regulatory, compliance, or other reasons that prevent us from doing so. Prospective investors and others are cautioned that any forward-
looking statements are not predictions and may be subject to change without notice. Our proprietary trading and investment businesses may make investment decisions
that are inconsistent with the recommendations expressed herein.
The information in this document has been printed on the basis of publicly available information, internal data and other reliable sources believed to be true and are for
general guidance only. While every effort is made to ensure the accuracy and completeness of information contained, the company takes no guarantee and assumes no
liability for any errors or omissions of the information. No one can use the information as the basis for any claim, demand or cause of action.
Recipients of this material should rely on their own investigations and take their own professional advice. Each recipient of this document should make such investigations
as it deems necessary to arrive at an independent evaluation of an investment in the securities of companies referred to in this document (including the merits and risks
involved), and should consult their own advisors to determine the merits and risks of such an investment. Price and value of the investments referred to in this material may
go up or down. Past performance is not a guide for future performance.
Certain transactions - futures, options and other derivatives as well as non-investment grade securities - involve substantial risks and are not suitable for all investors.
Reports based on technical analysis centers on studying charts of a stock's price movement and trading volume, as opposed to focusing on a company's fundamentals and
as such, may not match with a report on a company's fundamentals.
We do not undertake to advise you as to any change of our views expressed in this document. While we would endeavor to update the information herein on a reasonable
basis, Angel Broking, its subsidiaries and associated companies, their directors and employees are under no obligation to update or keep the information current. Also
there may be regulatory, compliance, or other reasons that may prevent Angel Broking and affiliates from doing so. Prospective investors and others are cautioned that
any forward-looking statements are not predictions and may be subject to change without notice.
Angel Broking Limited and affiliates, including the analyst who has issued this report, may, on the date of this report, and from time to time, have long or short positions
in, and buy or sell the securities of the companies mentioned herein or engage in any other transaction involving such securities and earn brokerage or compensation or
act as advisor or have other potential conflict of interest with respect to company/ies mentioned herein or inconsistent with any recommendation and related information
and opinions.
Angel Broking Limited and affiliates may seek to provide or have engaged in providing corporate finance, investment banking or other advisory services in a merger or
specific transaction to the companies referred to in this report, as on the date of this report or in the past.
Sebi Registration No.: INB 010996539
Derivative Research Team derivatives.desk@angeltrade.com
For Private Circulation Only SEBI Registration No: INB 010996539 3