1. Derivative Report
India Research
April 21, 2010
Comments
Nifty Vs OI
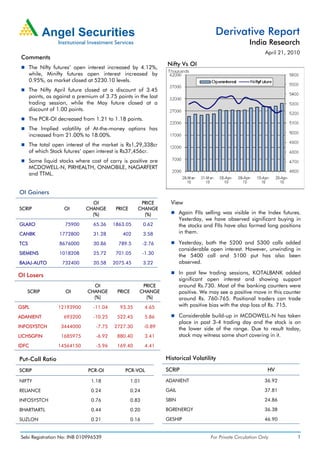
The Nifty futures’ open interest increased by 4.12%,
while, Minifty futures open interest increased by
0.95%, as market closed at 5230.10 levels.
The Nifty April future closed at a discount of 3.45
points, as against a premium of 3.75 points in the last
trading session, while the May future closed at a
discount of 1.00 points.
The PCR-OI decreased from 1.21 to 1.18 points.
The Implied volatility of At-the-money options has
increased from 21.00% to 18.00%.
The total open interest of the market is Rs1,29,338cr
of which Stock futures’ open interest is Rs37,456cr.
Some liquid stocks where cost of carry is positive are
MCDOWELL-N, PIRHEALTH, ONMOBILE, NAGARFERT
and TTML.
OI Gainers
OI PRICE View
SCRIP OI CHANGE PRICE CHANGE
(%) (%) Again FIIs selling was visible in the Index futures.
Yesterday, we have observed significant buying in
GLAXO 75900 65.36 1863.05 0.62 the stocks and FIIs have also formed long positions
CANBK 1772800 31.28 402 3.58 in them.
TCS 8676000 30.86 789.5 -2.76 Yesterday, both the 5200 and 5300 calls added
considerable open interest. However, unwinding in
SIEMENS 1018208 25.72 701.05 -1.30
the 5400 call and 5100 put has also been
BAJAJ-AUTO 732400 20.58 2075.45 3.22 observed.
OI Losers In past few trading sessions, KOTALBANK added
significant open interest and showing support
OI PRICE around Rs.730. Most of the banking counters were
SCRIP OI CHANGE PRICE CHANGE positive. We may see a positive move in this counter
(%) (%) around Rs. 760-765. Positional traders can trade
GSPL 12193900 -11.04 93.35 4.65 with positive bias with the stop loss of Rs. 715.
ADANIENT 693200 -10.25 522.45 5.86 Considerable build-up in MCDOWELL-N has taken
place in past 3-4 trading day and the stock is on
INFOSYSTCH 3444000 -7.75 2727.30 -0.89 the lower side of the range. Due to result today,
LICHSGFIN 1685975 -6.92 880.40 3.41 stock may witness some short covering in it.
IDFC 14564150 -5.96 169.40 4.41
Put-Call Ratio Historical Volatility
SCRIP PCR-OI PCR-VOL SCRIP HV
NIFTY 1.18 1.01 ADANIENT 36.92
RELIANCE 0.24 0.24 GAIL 37.81
INFOSYSTCH 0.76 0.83 SBIN 24.86
BHARTIARTL 0.44 0.20 BGRENERGY 36.38
SUZLON 0.21 0.16 GESHIP 46.90
Sebi Registration No: INB 010996539 For Private Circulation Only 1
2. Derivative Report | India Research
FII Statistics for 20-April-2010 Turnover on 20-April-2010
Open Interest
No. of Turnover Change
Detail Buy Sell Net Instrument
Contracts (Rs. in cr.) (%)
Contracts Value Change
(Rs. in cr.) (%)
INDEX Index Futures 586094 15321.63 -17.64
1515.17 1945.36 (430.20) 544196 14447.98 -0.40
FUTURES
INDEX Stock Futures 557760 20649.28 13.06
2708.26 2790.78 (82.52) 1571123 41119.27 1.15
OPTIONS
STOCK Index Options 1869506 49294.61 -26.62
2776.22 2191.45 584.77 935188 30702.96 1.04
FUTURES
STOCK Stock Options 105801 4365.97 4.38
147.98 163.95 (15.98) 28499 893.90 0.23
OPTIONS
TOTAL 7147.62 7091.55 56.08 3079006 87164.12 0.83 Total 3119161 89631.50 -17.18
Nifty Spot = 5230.10 Lot Size = 50
Bull-Call Spreads Bear-Put Spreads
Action Strike Price Risk Reward BEP Action Strike Price Risk Reward BEP
Buy 5300 26.40 Buy 5200 50.00
19.80 80.20 5319.80 27.00 73.00 5173.00
Sell 5400 6.60 Sell 5100 23.00
Buy 5300 26.40 Buy 5200 50.00
24.50 175.50 5324.50 39.50 160.50 5160.50
Sell 5500 1.90 Sell 5000 10.50
Buy 5400 6.60 Buy 5100 23.00
4.70 95.30 5404.70 12.50 87.50 5087.50
Sell 5500 1.90 Sell 5000 10.50
Note: Above mentioned Bullish or Bearish Spreads in Nifty (April Series) are given as an information and not as a recommendation
Nifty Put-Call Analysis
For Private Circulation Only Sebi Registration No: INB 010996539 2
3. Derivative Report | India Research
Strategy Date Scrip Strategy Status
29-March-2010 SUZLON Long Call Continue
29-March-2010 IDBI Long Call Profit Booked on 06-Apr-2010
05-April-2010 RNRL Long Call Continue
05-April-2010 HUL Long Put Profit Booked on 08-Apr-2010
12-April-2010 JPASSOCIAT Ratio Call Spread Continue
19-April-2010 BHARTIARTL Long Call Did not trigger
DISCLAIMER:
This document is not for public distribution and has been furnished to you solely for your information and must not be reproduced or redistributed to any other person.
Persons into whose possession this document may come are required to observe these restrictions.
Opinion expressed is our current opinion as of the date appearing on this material only. While we endeavor to update on a reasonable basis the information discussed in
this material, there may be regulatory, compliance, or other reasons that prevent us from doing so. Prospective investors and others are cautioned that any forward-
looking statements are not predictions and may be subject to change without notice. Our proprietary trading and investment businesses may make investment decisions
that are inconsistent with the recommendations expressed herein.
The information in this document has been printed on the basis of publicly available information, internal data and other reliable sources believed to be true and are for
general guidance only. While every effort is made to ensure the accuracy and completeness of information contained, the company takes no guarantee and assumes no
liability for any errors or omissions of the information. No one can use the information as the basis for any claim, demand or cause of action.
Recipients of this material should rely on their own investigations and take their own professional advice. Each recipient of this document should make such investigations
as it deems necessary to arrive at an independent evaluation of an investment in the securities of companies referred to in this document (including the merits and risks
involved), and should consult their own advisors to determine the merits and risks of such an investment. Price and value of the investments referred to in this material may
go up or down. Past performance is not a guide for future performance.
Certain transactions - futures, options and other derivatives as well as non-investment grade securities - involve substantial risks and are not suitable for all investors.
Reports based on technical analysis centers on studying charts of a stock's price movement and trading volume, as opposed to focusing on a company's fundamentals and
as such, may not match with a report on a company's fundamentals.
We do not undertake to advise you as to any change of our views expressed in this document. While we would endeavor to update the information herein on a reasonable
basis, Angel Broking, its subsidiaries and associated companies, their directors and employees are under no obligation to update or keep the information current. Also
there may be regulatory, compliance, or other reasons that may prevent Angel Broking and affiliates from doing so. Prospective investors and others are cautioned that
any forward-looking statements are not predictions and may be subject to change without notice.
Angel Broking Limited and affiliates, including the analyst who has issued this report, may, on the date of this report, and from time to time, have long or short positions
in, and buy or sell the securities of the companies mentioned herein or engage in any other transaction involving such securities and earn brokerage or compensation or
act as advisor or have other potential conflict of interest with respect to company/ies mentioned herein or inconsistent with any recommendation and related information
and opinions.
Angel Broking Limited and affiliates may seek to provide or have engaged in providing corporate finance, investment banking or other advisory services in a merger or
specific transaction to the companies referred to in this report, as on the date of this report or in the past.
Sebi Registration No.: INB 010996539
Derivative Research Team derivatives.desk@angeltrade.com
For Private Circulation Only Sebi Registration No: INB 010996539 3