Keppel Ltd. 1Q 2024 Business Update Presentation Slides
Derivatives report 03 june-2010
1. Derivative Report
India Research
June 03, 2010
Comments
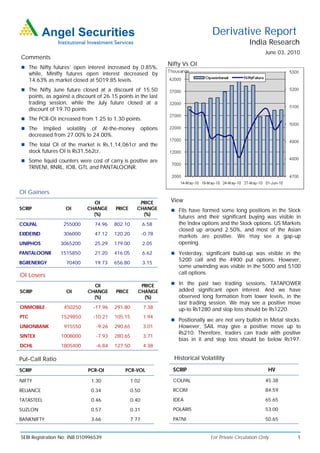
Nifty Vs OI
The Nifty futures’ open interest increased by 0.85%,
while, Minifty futures open interest decreased by
14.63% as market closed at 5019.85 levels.
The Nifty June future closed at a discount of 15.50
points, as against a discount of 26.15 points in the last
trading session, while the July future closed at a
discount of 19.70 points.
The PCR-OI increased from 1.25 to 1.30 points.
The Implied volatility of At-the-money options
decreased from 27.00% to 24.00%.
The total OI of the market is Rs.1,14,061cr and the
stock futures OI is Rs31,562cr.
Some liquid counters were cost of carry is positive are
TRIVENI, RNRL, IOB, GTL and PANTALOONR.
OI Gainers
OI PRICE View
SCRIP OI CHANGE PRICE CHANGE FIIs have formed some long positions in the Stock
(%) (%)
futures and their significant buying was visible in
COLPAL 255000 74.96 802.10 6.58 the Index options and the Stock options. US Markets
closed up around 2.50%, and most of the Asian
EXIDEIND 306000 47.12 120.20 -0.78
markets are positive. We may see a gap-up
UNIPHOS 3065200 25.29 179.00 2.05 opening.
PANTALOONR 1515850 21.20 416.05 6.62 Yesterday, significant build-up was visible in the
5200 call and the 4900 put options. However,
BGRENERGY 70400 19.73 656.80 3.15
some unwinding was visible in the 5000 and 5100
OI Losers call options.
OI PRICE In the past two trading sessions, TATAPOWER
SCRIP OI CHANGE PRICE CHANGE added significant open interest. And we have
(%) (%) observed long formation from lower levels, in the
last trading session. We may see a positive move
ONMOBILE 450250 -17.96 291.80 7.38 up-to Rs1280 and stop loss should be Rs1220.
PTC 1529850 -10.21 105.15 1.94
Positionally we are not very bullish in Metal stocks.
UNIONBANK 915550 -9.26 290.65 3.01 However, SAIL may give a positive move up to
Rs210. Therefore, traders can trade with positive
SINTEX 1008000 -7.93 280.65 3.71
bias in it and stop loss should be below Rs197.
DCHL 1805400 -6.84 127.50 4.38
Put-Call Ratio Historical Volatility
SCRIP PCR-OI PCR-VOL SCRIP HV
NIFTY 1.30 1.02 COLPAL 45.38
RELIANCE 0.34 0.50 RCOM 84.59
TATASTEEL 0.46 0.40 IDEA 65.65
SUZLON 0.57 0.31 POLARIS 53.00
BANKNIFTY 3.66 7.77 PATNI 50.65
SEBI Registration No: INB 010996539 For Private Circulation Only 1
2. Derivative Report | India Research
FII Statistics for 02-June-2010 Turnover on 02-June-2010
Open Interest
No. of Turnover Change
Detail Buy Sell Net Instrument
Contracts (Rs. in cr.) (%)
Contracts Value Change
(Rs. in cr.) (%)
INDEX Index Futures 746553 17251.32 0.21
1803.18 1977.97 (174.80) 527315 13113.65 2.46
FUTURES
INDEX Stock Futures 524775 15233.97 -7.26
4244.15 3360.83 883.33 1682459 42214.69 4.26
OPTIONS
STOCK Index Options 1518643 38183.41 -15.83
1291.92 901.90 390.01 910322 25602.87 1.89
FUTURES
STOCK Stock Options 96670 2841.29 -3.86
357.36 222.71 134.66 26774 815.35 49.03
OPTIONS
TOTAL 7696.61 6463.41 1,233.20 3146870 81746.56 3.52 Total 2886641 73509.99 -10.31
Nifty Spot = 5019.85 Lot Size = 50
Bull-Call Spreads Bear-Put Spreads
Action Strike Price Risk Reward BEP Action Strike Price Risk Reward BEP
Buy 5100 74.75 Buy 5000 123.75
36.30 63.70 5136.30 34.40 65.60 4965.60
Sell 5200 38.45 Sell 4900 89.35
Buy 5100 74.75 Buy 5000 123.75
57.95 142.05 5157.95 59.30 140.70 4940.70
Sell 5300 16.80 Sell 4800 64.45
Buy 5200 38.45 Buy 4900 89.35
21.65 78.35 5221.65 24.90 75.10 4875.10
Sell 5300 16.80 Sell 4800 64.45
Note: Above mentioned Bullish or Bearish Spreads in Nifty (June Series) are given as an information and not as a recommendation
Nifty Put-Call Analysis
For Private Circulation Only SEBI Registration No: INB 010996539 2
3. Derivative Report | India Research
Strategy Date Scrip Strategy Status
31-May-2010 Nifty Long Put Ladder Continue
DISCLAIMER:
This document is not for public distribution and has been furnished to you solely for your information and must not be reproduced or redistributed to any other person.
Persons into whose possession this document may come are required to observe these restrictions.
Opinion expressed is our current opinion as of the date appearing on this material only. While we endeavor to update on a reasonable basis the information discussed in
this material, there may be regulatory, compliance, or other reasons that prevent us from doing so. Prospective investors and others are cautioned that any forward-
looking statements are not predictions and may be subject to change without notice. Our proprietary trading and investment businesses may make investment decisions
that are inconsistent with the recommendations expressed herein.
The information in this document has been printed on the basis of publicly available information, internal data and other reliable sources believed to be true and are for
general guidance only. While every effort is made to ensure the accuracy and completeness of information contained, the company takes no guarantee and assumes no
liability for any errors or omissions of the information. No one can use the information as the basis for any claim, demand or cause of action.
Recipients of this material should rely on their own investigations and take their own professional advice. Each recipient of this document should make such investigations
as it deems necessary to arrive at an independent evaluation of an investment in the securities of companies referred to in this document (including the merits and risks
involved), and should consult their own advisors to determine the merits and risks of such an investment. Price and value of the investments referred to in this material may
go up or down. Past performance is not a guide for future performance.
Certain transactions - futures, options and other derivatives as well as non-investment grade securities - involve substantial risks and are not suitable for all investors.
Reports based on technical analysis centers on studying charts of a stock's price movement and trading volume, as opposed to focusing on a company's fundamentals and
as such, may not match with a report on a company's fundamentals.
We do not undertake to advise you as to any change of our views expressed in this document. While we would endeavor to update the information herein on a reasonable
basis, Angel Broking, its subsidiaries and associated companies, their directors and employees are under no obligation to update or keep the information current. Also
there may be regulatory, compliance, or other reasons that may prevent Angel Broking and affiliates from doing so. Prospective investors and others are cautioned that
any forward-looking statements are not predictions and may be subject to change without notice.
Angel Broking Limited and affiliates, including the analyst who has issued this report, may, on the date of this report, and from time to time, have long or short positions
in, and buy or sell the securities of the companies mentioned herein or engage in any other transaction involving such securities and earn brokerage or compensation or
act as advisor or have other potential conflict of interest with respect to company/ies mentioned herein or inconsistent with any recommendation and related information
and opinions.
Angel Broking Limited and affiliates may seek to provide or have engaged in providing corporate finance, investment banking or other advisory services in a merger or
specific transaction to the companies referred to in this report, as on the date of this report or in the past.
Sebi Registration No.: INB 010996539
Derivative Research Team derivatives.desk@angeltrade.com
For Private Circulation Only SEBI Registration No: INB 010996539 3