SlideShare a Scribd company logo
1 of 9
Download to read offline
4QFY2010 Result Update I Base Metals
                                                                                                                         April 21, 2010


  Hindustan Zinc                                                                         ACCUMULATE
                                                                                         CMP                                    Rs1,232
  Performance Highlights                                                                 Target Price                           Rs1,399

  Hindustan Zinc (HZL) continues to register strong operational performance in           Investment Period                    12 Months
  4QFY2010 and reported net revenues of Rs2,545cr, which was ahead of our
  estimate of Rs2,334cr. However, net profit at Rs1,239cr, registering a growth          Stock Info
  of 124.7% yoy, was in line with our estimate of Rs1,235cr. We believe that             Sector                           Base Metals
  HZL is well poised to benefit from:1) the scale-up of zinc-lead smelting
  capacity to 1.1mn tonnes, and 2) a significant increase in silver production           Market Cap (Rs cr)                     52,049
  along with 100% backward linkages. We maintain an Accumulate on the                    Beta                                       1.0
  stock, with a Target Price of Rs1,399.
                                                                                         52 WK High / Low                     1,325/458
  Strong performance continues: HZL’s net revenue was ahead of our estimate
                                                                                         Avg. Daily Volume                       60928
  primarily due to the higher concentrate and by-product sale of silver metal.
  Silver sales volume increased by 26.6% yoy to 42,399kg, while zinc and lead            Face Value (Rs)                            10
  concentrate sales during the quarter stood at 49,073 tonnes. Although zinc
                                                                                         BSE Sensex                             17,473
  volumes fell marginally by 1.0% yoy to 151,294 tonnes, lead volumes
  increased 17.9% yoy to 18,450 tonnes. Zinc and lead realisations increased             Nifty                                    5,245
  by 105.9% yoy and 85.3% yoy to US $2,462/tonne and US $2,473/tonne,
  respectively. Consequently, operating margins increased by 1,574bp to                  Reuters Code                         HZNC.BO
  60.8%. Although interest expenses increased by 470% yoy to Rs28cr and                  Bloomberg Code                         HZ @IN
  other income fell by 30.8% yoy to Rs134cr, net profit spiked 124.7% yoy to
  Rs1,239cr, in line with our estimate of Rs1,235cr.                                     Shareholding Pattern (%)

                                                                                         Promoters                                 64.9
  Outlook and Valuation: At the CMP of Rs1,232, the stock is trading at 6.1x
  FY2011E and 3.7x FY2012E EV/EBITDA. We believe that HZL is well poised to              MF/Banks/Indian FIs                       31.7
  benefit from: 1) the scale-up of zinc-lead smelting capacity to 1.1mn tonnes,
                                                                                         FII/NRIs/OCBs                              2.3
  and 2) a significant increase in silver production along with 100% backward
  linkages. Plans of the Sterlite group to buy out the remainder of the                  Indian Public                              1.1
  government’s holding could provide further upside. In addition, with HZL
                                                                                         Abs. (%)            3m         1yr         3yr
  being one of the lowest cost producers in the world and having a huge cash
  balance of Rs11,900cr at the end of the quarter (Rs282 per share), we                  Sensex              2.5       60.3        25.7
  maintain an Accumulate on the stock, with a Target Price of Rs1,399, valuing
  the stock at 5.5x FY2012E EV/EBITDA.                                                   HZL                 4.1       152.3       86.6

  Key risks to our call: 1) Weaker zinc and lead prices, and 2) Adverse
  exchange rate movements.

    Key Financials
    Y/E March (Rs cr)              FY2009         FY2010E         FY2011E   FY2012E
   Net Sales                          5,680           8,139         9,764    12,884
   % chg                              (27.9)           43.3          20.0      31.9
   Net Profit                         2,728           4,041         5,063     6,864
   % chg                              (38.0)           48.2          25.3      35.6
   OPM (%)                             48.1            58.9          60.0      60.2
   EPS (Rs)                            64.6            95.6         119.8     162.4
   P/E (x)                             19.1            12.9          10.3       7.6    Paresh Jain
   P/BV (x)                             3.6              2.9          2.3       1.8    Tel: 022 – 4040 3800 Ext: 348
   RoE (%)                             20.8            24.9          24.7      26.1    E-mail: pareshn.jain@angeltrade.com
   RoCE (%)                            18.0            26.5          25.9      27.3
                                                                                       Pooja Jain
   EV/Sales (x)                         7.5              4.9          3.6       2.2
                                                                                       Tel: 022 – 4040 3800 Ext: 311
   EV/EBITDA (x)                       15.5              8.3          6.1       3.7    E-mail: pooja.j@angeltrade.com
    Source: Company, Angel Research

                                                                                                                                          1
Please refer to important disclosures at the end of this report                           Sebi Registration No: INB 010996539
Hindustan Zinc I 4QFY2010 Result Update


                 Exhibit 1: 4QFY2010 Performance
                  Y/E March (Rs cr)       4QFY10       4QFY09   yoy (%)   FY10      FY09   yoy (%)
                  Net Sales                  2,545      1,289     97.4    8,139    5,680     43.3
                  Mining and
                  Manufacturing                566        466     21.4    1,961    1,906      2.9
                  expenses
                  % of Net sales              22.3       36.2              24.1     33.5
                  Mining Royalty               191         84    128.0     613       364     68.2
                  % of Net sales               7.5        6.5               7.5      6.4
                  Staff Cost                   135         87     55.1     457       365     25.3
                  % of Net sales               5.3        6.8               5.6      6.4
                  Admin and selling            105         71     48.3     316       311      1.4
                  % of Net sales               4.1        5.5               3.9      5.5
                  Total Expenditure            997        708     40.9    3,347    2,946     13.6
                  % of Net sales              39.2       54.9              41.1     51.9
                  EBIDTA                     1,548       581     166.3    4,792    2,734     75.3
                  % of Net sales              60.8       45.1              58.9     48.1
                  Interest                      28          5    469.5       44       22    100.7
                  Depreciation                 101        75       34.1     334      285      17.2
                  Other Income                 134       194     (30.8)     600      931    (35.5)
                  Exceptional Items                -        -                 -        -
                  Profit before Tax          1,554        696    123.4    5,014    3,358     49.3
                  % of Net sales              61.1       54.0              61.6     59.1
                  Provision for tax            315        144    118.7     973       631     54.2
                  % of PBT                    20.3       20.7              19.4     18.8
                  Profit After tax           1,239       551     124.7    4,041    2,728     48.2
                  % of Net sales              48.7       42.8              49.7     48.0
                  EPS (Rs)                    29.3       13.1    124.8     95.6     64.6     48.2
                 Source: Company, Angel Research


                 Higher by-product sales led to strong top-line performance

                 HZL’s saleable zinc production was flat at 150,309 tonnes (150,544 tonnes), while
                 saleable lead production increased by 16.9% yoy to 18,345 tonnes (15,691 tonnes).
                 Consequently, zinc volumes declined by 1.0% yoy to 151,294 tonnes (152,796
                 tonnes), while lead volumes increased by 17.9% yoy to 18,450 tonnes (15,651
                 tonnes). However, zinc and lead realisations increased by 105.9% yoy to US
                 $2,462/tonne and 85.3% yoy to US $2,473/tonne, respectively.

                 Sales were also supported by higher zinc and lead concentrate sales during the
                 quarter at 49,073 tonnes. Silver production increased by 22.4% yoy to 43,066
                 tonnes (35,176 tonnes), while sales grew 26.6% yoy to 42,399kg (33,496kg).
                 Average silver realisation surged 41.0% yoy to Rs25,970/kg (Rs 19,978/kg). Thus,
                 net revenues increased by 97.4% to Rs2,545cr, ahead of our estimate of Rs2,334cr.


April 21, 2010                                                                                       2
Hindustan Zinc I 4QFY2010 Result Update


                 Exhibit 2: Zinc Metal Volumes down 1.0%; Realisations up 105.9%
                            180,000                                                                 4,000
                            160,000                                                                 3,500
                            140,000                                                                 3,000
                            120,000
                                                                                                    2,500


                                                                                                            (US $/tonne)
                 (tonnes)
                            100,000
                                                                                                    2,000
                             80,000
                                                                                                    1,500
                             60,000
                             40,000                                                                 1,000
                             20,000                                                                 500
                                  0                                                                 0
                                      Q2 2008   Q4 2008 2QFY09      4QFY09     2QFY10      4QFY10
                                                  Volume (LHS)        Realisation (RHS)
                 Source: Company, Angel Research


                 Exhibit 3: Lead Metal Volumes up 17.9%; Realisation up 85.3%

                            25,000                                                                  4,000
                                                                                                    3,500
                            20,000
                                                                                                    3,000


                                                                                                            (US $/tonne)
                            15,000                                                                  2,500
                 (tonnes)


                                                                                                    2,000
                            10,000                                                                  1,500
                                                                                                    1,000
                             5,000
                                                                                                    500
                                0                                                                   0
                                      Q2 2008   Q4 2008   2QFY09   4QFY09      2QFY10      4QFY10
                                                   Volume (LHS)        Realisation (RHS)
                 Source: Company, Angel Research


                 EBITDA margins expand by 1,574bp to 60.8%

                 During the quarter, royalty costs increased by 128.0% yoy to Rs191cr and salary
                 costs were up by 55.1% yoy to Rs135cr. However, higher by-product sales resulted in
                 operating margins expanding by 1,574bp to 60.8%, marginally lower than our
                 estimate.

                 Net profit up 124.7% in line with our estimate

                 In 4QFY2010, though interest expenses increased by 470% yoy to Rs28cr and other
                 income fell by 30.8% yoy to Rs134cr, net profit moved up 124.7% yoy to Rs1,239cr
                 on the back of strong operating performance.

                 Status on Expansion projects

                 •          At the end of the quarter, the 210,000 tonne zinc smelter at Dariba and 1mtpa
                            zinc concentrator at Rampura Agucha was successfully commissioned around
                            three months ahead of schedule.
                 •          The 100,000 tonne lead smelter is expected to be commissioned in
                            2QFY2011E.
                 •          Mining projects at Sindesar Khurd is also on schedule for commissioning by
                            1QFY2011E.


April 21, 2010                                                                                                      3
Hindustan Zinc I 4QFY2010 Result Update


                 Outlook

                 Zinc Metal surplus to decline by 40.3% in CY2010E

                 As per ILZSG, in CY2010E, global zinc usage is expected to grow by 11.9% to
                 12.04mn tones, whereas refined zinc production is expected to increase by 10.1% to
                 12.26mn tonnes. Hence, global zinc metal supply is likely to remain in surplus by
                 227,000 tonnes in CY2010E, a decline of 40.3% from a surplus of 380,000 tonnes
                 in CY2009E.

                 Lead Metal surplus to increase by 25% in CY2010E

                 As per ILZSG, lead metal is expected to remain in surplus by 100,000 tonnes
                 (80,000 tonnes) in CY2010E. Global lead usage is expected to grow by 7.5% yoy to
                 9.6mn tonnes. ILZSG expects demand to recover in Europe and US by 8.8% and
                 2.9% respectively, while China’s lead demand is expected to grow by 7.8% in
                 CY2010E. Lead metal production is likely to increase by 7.4% to 9.7mn tonnes,
                 primarily driven by the commissioning of new plants in Brazil and India.

                 Valuation

                 At the CMP of Rs1,232, the stock is trading at 6.1x FY2011E and 3.7x FY2012E
                 EV/EBITDA. We believe that HZL is well poised to benefit from: 1) the scale-up of
                 zinc-lead smelting capacity to 1.1mn tonnes, and 2) a significant increase in silver
                 production along with 100% backward linkages. Plans of the Sterlite group to buy
                 out the remainder of the government’s holding could provide further upside.
                 Moreover, with HZL being one of the lowest cost producers in the world and having
                 a substantial cash balance of Rs11,900cr at the end of the quarter (Rs282 per
                 share), we maintain an Accumulate on the stock, with a Target Price of Rs1,399,
                 valuing the stock at 5.5x FY2012E EV/EBITDA.

                 Key risks to our call: 1) Weaker zinc and lead prices, and 2) Adverse exchange rate
                 movements.

                 Exhibit 4: 1-year forward EV/EBITDA
                    (Rs mn)
                   700,000
                   600,000
                                                                                                     9x
                   500,000
                   400,000                                                                           7x

                   300,000                                                                           5x

                   200,000                                                                           3x
                   100,000
                                                                                                     1x
                          0
                  (100,000)
                          Apr-03      Apr-04         Apr-05   Apr-06   Apr-07   Apr-08   Apr-09   Apr-10

                 Source: Bloomberg, Angel Research


April 21, 2010                                                                                             4
Hindustan Zinc I 4QFY2010 Result Update


                 Exhibit 5: 1-year forward P/E
                    (Rs)
                 1,800
                                                                                                 14x
                 1,600
                 1,400
                 1,200                                                                           10x

                 1,000
                    800                                                                           6x
                    600
                    400
                                                                                                  2x
                    200
                       0
                       Apr-03       Apr-04     Apr-05    Apr-06   Apr-07   Apr-08   Apr-09   Apr-10

                 Source: Bloomberg, Angel Research

                 Exhibit 6: 1-year forward P/BV
                    (Rs)
                   3,000
                                                                                                      5x
                   2,500

                   2,000                                                                         3.5x

                   1,500

                   1,000                                                                              2x

                     500
                                                                                                 0.5x
                           0
                           Apr-03   Apr-04      Apr-05   Apr-06   Apr-07   Apr-08   Apr-09   Apr-10
                 Source: Bloomberg, Angel Research


April 21, 2010                                                                                        5
Hindustan Zinc I 4QFY2010 Result Update


                 Profit & Loss Statement                                                        Rs crore
                 Y/E March                      FY2007   FY2008    FY2009    FY2010   FY2011E   FY2012E
                 Gross sales                     9,220    8,737     6,141     8,847    10,278    13,562
                 Less: Excise duty                660       859       461      708       514        678
                 Net Sales                       8,560    7,878     5,680     8,139     9,764    12,884
                 Other operating income              -         -         -        -         -          -
                 Total operating income          8,560    7,878     5,680     8,139     9,764    12,884
                 % chg                           120.8     (8.0)    (27.9)     43.3      20.0      31.9
                 Total Expenditure               2,153    2,499     2,946     3,347     3,903     5,129
                 Net Raw Materials                984     1,352     1,906     1,961     2,465     3,317
                 Other Mfg costs                  644       511       364      613       683        902
                 Personnel                        260       308       365      457       419        516
                 Other                            266       328       311      316       335        395
                 EBITDA                          6,407    5,378     2,734     4,792     5,861     7,754
                  % chg                          178.6    (16.1)    (49.2)     75.3      22.3      32.3
                  (% of Net Sales)                74.8     68.3      48.1      58.9      60.0      60.2
                 Depreciation                     156       221       285      334       382        423
                 EBIT                            6,251    5,158     2,449     4,458     5,479     7,331
                  % chg                          189.2    (17.5)    (52.5)     82.0      22.9      33.8
                 (% of Net Sales)                 73.0     65.5      43.1      54.8      56.1      56.9
                 Interest & other Charges          28        24        22       44        24         26
                 Other Income                     231       852       931      600       874      1,275
                  (% of PBT)                       3.6     14.2      27.7      12.0      13.8      14.9
                 Share in profit of Asso.            -         -         -        -         -          -
                 Recurring PBT                   6,454    5,985     3,358     5,014     6,329     8,580
                 % chg                           189.5     (7.3)    (43.9)     49.3      26.2      35.6
                 Extraordinary Inc/(Exp.)            -         -         -        -         -          -
                 PBT (reported)                  6,454    5,985     3,358     5,014     6,329     8,580
                 Tax                             2,012    1,589       631      973      1,266     1,716
                 (% of PBT)                       31.2     26.6      18.8      19.4      20.0      20.0
                 PAT (reported)                  4,442    4,396     2,728     4,041     5,063     6,864
                 Add: Share of associates            -         -         -        -         -          -
                 Less: Minority interest (MI)        -         -         -        -         -          -
                 Extraordinary Exp./(Inc.)           -         -         -        -         -          -
                 PAT after MI (reported)         4,442    4,396     2,728     4,041     5,063     6,864
                 ADJ. PAT                        4,442    4,396     2,728     4,041     5,063     6,864
                 % chg                           201.7     (1.0)    (38.0)     48.2      25.3      35.6
                 (% of Net Sales)                 51.9     55.8      48.0      49.7      51.9      53.3
                 Basic EPS (Rs)                  105.1    104.0      64.6      95.6     119.8     162.4
                 Fully Diluted EPS (Rs)          105.1    104.0      64.6      95.6     119.8     162.4
                 % chg                           201.7     (1.0)    (38.0)     48.2      25.3      35.6


April 21, 2010                                                                                        6
Hindustan Zinc I 4QFY2010 Result Update


                 Balance Sheet                                                                                           Rs crore
                 Y/E March                            FY2007        FY2008       FY2009       FY2010E FY2011E            FY2012E
                 SOURCES OF FUNDS
                 Equity Share Capital                   423           423          423           423          423           423
                 Reserves& Surplus                     7,205        11,426       13,935        17,680       22,545        29,211
                 Shareholders Funds                    7,627        11,848       14,358        18,102       22,968        29,634
                 Share Warrants                            -             -            -             -            -             -
                 Minority Interest                         -             -            -             -            -             -
                 Total Loans                             0.4           0.4            9            9            9             9
                 Deferred Tax Liability                 301           460          559           559          585           597
                 Total Liabilities                     7,928        12,308       14,925        18,670       23,562        30,239
                 APPLICATION OF FUNDS
                 Gross Block                           3,500         5,182        5,856         6,983        8,110         9,037
                 Less: Acc. Depreciation               1,264         1,485        1,751         2,085        2,467         2,890
                 Net Block                             2,236         3,697        4,105         4,898        5,643         6,147
                 Capital Work-in-Progress               635           465         1,108         1,308        1,108          408
                 Goodwill                                  -             -            -             -            -             -
                 Investments                           4,403         6,332        6,929         6,929        6,929         6,929
                 Current Assets                        1,481         2,712        3,784         6,800       11,115        18,186
                    Cash                                120          1,363        2,719         5,580        9,526        16,217
                    Loans & Advances                    305           384          313           313          345           345
                    Other                              1,057          965          751           906         1,244         1,624
                 Current liabilities                    827           898         1,001         1,265        1,233         1,431
                 Net Current Assets                     654          1,813        2,783         5,535        9,881        16,755
                 Mis. Exp. not written off                 -             -            -             -            -             -
                 Total Assets                          7,928        12,308       14,925        18,670       23,562        30,239

                 Cash Flow Statement                                                                                     Rs crore
                 Y/E March                              FY2007       FY2008       FY2009 FY2010E FY2011E FY2012E
                 Profit before tax                       6,454         5,985        3,358       5,014        6,329         8,580
                 Depreciation                              157          222           286         334          382          423
                 Change in Working Capital                 238          376           296         (87)        (297)        (229)
                 Less: Other income                       (144)        (767)        (777)               -            -         -
                 Direct taxes paid                       1,958         1,529          521         876        1,213         1,658
                 Cash Flow from Operations               4,747         4,288        2,642       4,386        5,201         7,116
                 Inc./ (Dec.) in Fixed Assets            1,110         1,513        1,374       1,327          927          227
                 Inc./ (Dec.) in Investments             2,798         1,407          443               -            -         -
                 Inc./ (Dec.) in loans and advances        142           80           (71)              -     31.3             -
                 Other income                              178          226        (1,602)              -            -         -
                 Cash Flow from Investing                3,872         2,774        3,348       1,327          958          227
                 Issue of Equity                                -            -            -             -            -         -
                 Inc./(Dec.) in loans                     (558)              -            8             -            -         -
                 Dividend Paid (Incl. Tax)                 240          247           124         198          297          198
                 Others                                        31        24            22               -            -         -
                 Cash Flow from Financing                 (829)        (271)        (137)        (198)        (297)        (198)
                 Inc./(Dec.) in Cash                           46      1,243        (844)       2,861        3,946         6,691
                 Opening Cash balances                         74       120         3,563       2,719        5,580         9,526
                 Closing Cash balances                     120         1,363        2,719       5,580        9,526        16,217


April 21, 2010                                                                                                                 7
Hindustan Zinc I 4QFY2010 Result Update


                 Key Ratios
                 Y/E March                      FY2007    FY2008    FY2009    FY2010E    FY2011E FY2012E
                  Valuation Ratio (x)
                  P/E (on FDEPS)                  11.7      11.8      19.1       12.9       10.3      7.6
                  P/CEPS                          11.3      11.3      17.3       11.9        9.6      7.1
                  P/BV                             6.8       4.4       3.6        2.9        2.3      1.8
                  Dividend yield (%)               0.4       0.4       0.3        0.5        0.3      0.3
                  EV/Sales                         5.6       5.6       7.5        4.9        3.6      2.2
                  EV/EBITDA                        7.4       8.2      15.5        8.3        6.1      3.7
                  EV / Total Assets                6.0       3.6       2.8        2.1        1.5      1.0
                  Per Share Data (Rs)
                  EPS (Basic)                    105.1     104.0      64.6       95.6      119.8    162.4
                  EPS (fully diluted)            105.1     104.0      64.6       95.6      119.8    162.4
                  Cash EPS                       108.8     109.3      71.3      103.6       28.9    172.5
                  DPS                              5.0       5.0       4.0        6.0        4.0      4.0
                  Book Value                     180.5     280.4     339.8      428.4      543.6    701.3
                  Dupont Analysis
                  EBIT margin                     73.0      65.5      43.1       54.8       56.1     56.9
                  Tax retention ratio (%)         68.8      73.4      81.2       80.6       80.0     80.0
                  Asset turnover (x)               2.5       1.7       1.1        1.3        1.4      1.8
                  ROIC (Post-tax)                126.3      82.1      37.7       58.3       61.7     82.7
                  Cost of Debt (Post Tax)             -         -         -          -          -        -
                  Leverage (x)                    (0.6)     (0.6)     (0.7)      (0.7)      (0.7)    (0.8)
                  Operating ROE                   51.4      28.8      12.4       18.0       17.5     18.1
                  Returns (%)
                  ROCE (Pre-tax)                 102.8      51.0      18.0       26.5       25.9     27.3
                  Angel ROIC (Pre-tax)           209.9     128.6      49.5       77.9       82.6    103.2
                  ROE                             80.3      45.1      20.8       24.9       24.7     26.1
                  Turnover ratios (x)
                 Asset Turnover (Gross Block)      2.6       1.8       1.0        1.3        1.3      1.5
                  Inventory / Sales (days)        84.6      75.7      67.6       67.6       75.0     75.0
                  Receivables (days)              23.7      20.6      10.6       11.0       15.0     15.0
                  Payables (days)                 35.0      51.8      46.1       48.0       45.0     45.0
                 WC cycle (ex-cash) (days)        37.1      33.7      30.4       17.1       21.4     23.7
                  Solvency ratios (x)
                  Net debt to equity              (0.6)     (0.6)     (0.7)      (0.7)      (0.7)    (0.8)
                  Net debt to EBITDA              (0.7)     (1.4)     (3.5)      (2.6)      (2.8)    (3.0)
                  Interest Coverage              219.8     213.4     111.9      101.5      225.6    278.8


April 21, 2010                                                                                           8
Hindustan Zinc I 4QFY2010 Result Update


Research Team Tel: 4040 3800                                       E-mail: research@angeltrade.com                                       Website: www.angeltrade.com


DISCLAIMER

This document is solely for the personal information of the recipient, and must not be singularly used as the basis of any investment decision. Nothing in this
document should be construed as investment or financial advice. Each recipient of this document should make such investigations as they deem necessary to
arrive at an independent evaluation of an investment in the securities of the companies referred to in this document (including the merits and risks involved),
and should consult their own advisors to determine the merits and risks of such an investment.

Angel Securities Limited, its affiliates, directors, its proprietary trading and investment businesses may, from time to time, make investment decisions that are
inconsistent with or contradictory to the recommendations expressed herein. The views contained in this document are those of the analyst, and the company
may or may not subscribe to all the views expressed within.

Reports based on technical and derivative analysis center on studying charts of a stock's price movement, outstanding positions and trading volume, as
opposed to focusing on a company's fundamentals and, as such, may not match with a report on a company's fundamentals.

The information in this document has been printed on the basis of publicly available information, internal data and other reliable sources believed to be true,
and is for general guidance only. Angel Securities Limited has not independently verified all the information contained within this document. Accordingly, we
cannot testify, nor make any representation or warranty, express or implied, to the accuracy, contents or data contained within this document. While Angel
Securities Limited endeavours to update on a reasonable basis the information discussed in this material, there may be regulatory, compliance, or other
reasons that prevent us from doing so.

This document is being supplied to you solely for your information, and its contents, information or data may not be reproduced, redistributed or passed on,
directly or indirectly.

Angel Securities Limited and its affiliates may seek to provide or have engaged in providing corporate finance, investment banking or other advisory services
in a merger or specific transaction to the companies referred to in this report, as on the date of this report or in the past.

Neither Angel Securities Limited, nor its directors, employees or affiliates shall be liable for any loss or damage that may arise from or in connection with the
use of this information.
Note: Please refer to the important `Stock Holding Disclosure' report on the Angel website (Research Section).


 Disclosure of Interest Statement                                                       Hindustan Zinc
 1.    Analyst ownership of the stock                                                           No
 2.    Angel and its Group companies ownership of the stock                                     No
 3.    Angel and its Group companies’ Directors ownership of the stock                          No
 4.    Broking relationship with company covered                                                No
 Note: We have not considered any Exposure below Rs 1 lakh for Angel and its Group companies.


                                Address: Acme Plaza, ‘A’ Wing, 3rd Floor, M.V. Road, Opp. Sangam Cinema, Andheri (E), Mumbai - 400 059.
                                                                    Tel: (022) 3952 4568 / 4040 3800


    Angel Broking Ltd: BSE Sebi Regn No : INB 010996539 / CDSL Regn No: IN - DP - CDSL - 234 - 2004 / PMS Regn Code: PM/INP000001546 Angel Securities Ltd:BSE: INB010994639/INF010994639 NSE:
    INB230994635/INF230994635 Membership numbers: BSE 028/NSE:09946
    Angel Capital & Debt Market Ltd: INB 231279838 / NSE FNO: INF 231279838 / NSE Member code -12798 Angel Commodities Broking (P) Ltd: MCX Member ID: 12685 / FMC Regn No: MCX / TCM /
    CORP / 0037 NCDEX : Member ID 00220 / FMC Regn No: NCDEX / TCM / CORP / 0302


April 21, 2010                                                                                                                                                                              9

More Related Content

What's hot

Icici bank ru4 qfy2010-230410
Icici bank ru4 qfy2010-230410Icici bank ru4 qfy2010-230410
Icici bank ru4 qfy2010-230410Angel Broking
 
HDFC Bank - Result Update
HDFC Bank - Result UpdateHDFC Bank - Result Update
HDFC Bank - Result UpdateAngel Broking
 
Sterlite Industries
Sterlite Industries  Sterlite Industries
Sterlite Industries Angel Broking
 
Sesa Goa - Result Update
Sesa Goa  - Result Update Sesa Goa  - Result Update
Sesa Goa - Result Update Angel Broking
 
Sesa goa ru4 qfy2010-200410
Sesa goa ru4 qfy2010-200410Sesa goa ru4 qfy2010-200410
Sesa goa ru4 qfy2010-200410Angel Broking
 
Corporation Bank Result Update
Corporation Bank Result UpdateCorporation Bank Result Update
Corporation Bank Result UpdateAngel Broking
 
Brcm result update 2 qsy2010 040510
Brcm result update 2 qsy2010 040510Brcm result update 2 qsy2010 040510
Brcm result update 2 qsy2010 040510Angel Broking
 
Sintex Result Update 4qfy2010-030510
Sintex Result Update 4qfy2010-030510Sintex Result Update 4qfy2010-030510
Sintex Result Update 4qfy2010-030510Angel Broking
 
Yes bank ru4 qfy2010-290410
Yes bank ru4 qfy2010-290410Yes bank ru4 qfy2010-290410
Yes bank ru4 qfy2010-290410Angel Broking
 
Nalco ru4 qfy2010-140510
Nalco ru4 qfy2010-140510Nalco ru4 qfy2010-140510
Nalco ru4 qfy2010-140510Angel Broking
 
Yes Bank - Result Update
Yes Bank - Result UpdateYes Bank - Result Update
Yes Bank - Result UpdateAngel Broking
 
Ntpc ru4 qfy2010-190510
Ntpc ru4 qfy2010-190510Ntpc ru4 qfy2010-190510
Ntpc ru4 qfy2010-190510Angel Broking
 
Madras cements ru4 qfy2010-250510
Madras cements ru4 qfy2010-250510Madras cements ru4 qfy2010-250510
Madras cements ru4 qfy2010-250510Angel Broking
 
Bgr energy ru4 qfy2010-010610
Bgr energy ru4 qfy2010-010610Bgr energy ru4 qfy2010-010610
Bgr energy ru4 qfy2010-010610Angel Broking
 

What's hot (19)

Icici bank ru4 qfy2010-230410
Icici bank ru4 qfy2010-230410Icici bank ru4 qfy2010-230410
Icici bank ru4 qfy2010-230410
 
HDFC Bank - Result Update
HDFC Bank - Result UpdateHDFC Bank - Result Update
HDFC Bank - Result Update
 
Sterlite Industries
Sterlite Industries  Sterlite Industries
Sterlite Industries
 
Sesa Goa - Result Update
Sesa Goa  - Result Update Sesa Goa  - Result Update
Sesa Goa - Result Update
 
Sarda Energy
Sarda EnergySarda Energy
Sarda Energy
 
Hindalco Novelis
Hindalco Novelis Hindalco Novelis
Hindalco Novelis
 
Prakash Indutries
Prakash Indutries Prakash Indutries
Prakash Indutries
 
Sesa goa ru4 qfy2010-200410
Sesa goa ru4 qfy2010-200410Sesa goa ru4 qfy2010-200410
Sesa goa ru4 qfy2010-200410
 
Corporation Bank Result Update
Corporation Bank Result UpdateCorporation Bank Result Update
Corporation Bank Result Update
 
Brcm result update 2 qsy2010 040510
Brcm result update 2 qsy2010 040510Brcm result update 2 qsy2010 040510
Brcm result update 2 qsy2010 040510
 
Sintex Result Update 4qfy2010-030510
Sintex Result Update 4qfy2010-030510Sintex Result Update 4qfy2010-030510
Sintex Result Update 4qfy2010-030510
 
Yes bank ru4 qfy2010-290410
Yes bank ru4 qfy2010-290410Yes bank ru4 qfy2010-290410
Yes bank ru4 qfy2010-290410
 
Nalco ru4 qfy2010-140510
Nalco ru4 qfy2010-140510Nalco ru4 qfy2010-140510
Nalco ru4 qfy2010-140510
 
Gujarat Gas
Gujarat GasGujarat Gas
Gujarat Gas
 
Yes Bank - Result Update
Yes Bank - Result UpdateYes Bank - Result Update
Yes Bank - Result Update
 
Ntpc ru4 qfy2010-190510
Ntpc ru4 qfy2010-190510Ntpc ru4 qfy2010-190510
Ntpc ru4 qfy2010-190510
 
Madras cements ru4 qfy2010-250510
Madras cements ru4 qfy2010-250510Madras cements ru4 qfy2010-250510
Madras cements ru4 qfy2010-250510
 
Bgr energy ru4 qfy2010-010610
Bgr energy ru4 qfy2010-010610Bgr energy ru4 qfy2010-010610
Bgr energy ru4 qfy2010-010610
 
Tata Steel
Tata SteelTata Steel
Tata Steel
 

Similar to HZL Q4 2010 Result Update

Hindalco Result Update 4 qfy2010-110510
Hindalco Result Update 4 qfy2010-110510Hindalco Result Update 4 qfy2010-110510
Hindalco Result Update 4 qfy2010-110510Angel Broking
 
Hindalco novelis ru4 qfy2010-280510
Hindalco novelis ru4 qfy2010-280510Hindalco novelis ru4 qfy2010-280510
Hindalco novelis ru4 qfy2010-280510Angel Broking
 
Graphite india ru4 qfy2010-140510
Graphite india ru4 qfy2010-140510Graphite india ru4 qfy2010-140510
Graphite india ru4 qfy2010-140510Angel Broking
 
Inox ru4 qfy2010-240510
Inox ru4 qfy2010-240510Inox ru4 qfy2010-240510
Inox ru4 qfy2010-240510Angel Broking
 
Hzl 2 qfy2011 result update - 201010
Hzl   2 qfy2011 result update - 201010Hzl   2 qfy2011 result update - 201010
Hzl 2 qfy2011 result update - 201010Angel Broking
 
Jk lakshmi ru4 qfy2010-190510
Jk lakshmi ru4 qfy2010-190510Jk lakshmi ru4 qfy2010-190510
Jk lakshmi ru4 qfy2010-190510Angel Broking
 
Jk lakshmi ru4 qfy2010-190510
Jk lakshmi ru4 qfy2010-190510Jk lakshmi ru4 qfy2010-190510
Jk lakshmi ru4 qfy2010-190510Angel Broking
 
Titan result update 4 qfy2010-050510
Titan result update 4 qfy2010-050510Titan result update 4 qfy2010-050510
Titan result update 4 qfy2010-050510Angel Broking
 
India cements result update 4 qfy2010-060510
India cements  result update 4 qfy2010-060510India cements  result update 4 qfy2010-060510
India cements result update 4 qfy2010-060510Angel Broking
 
Nestle 1QCY2010 Result Update
Nestle 1QCY2010 Result UpdateNestle 1QCY2010 Result Update
Nestle 1QCY2010 Result UpdateAngel Broking
 

Similar to HZL Q4 2010 Result Update (20)

Hindustan Zinc
Hindustan ZincHindustan Zinc
Hindustan Zinc
 
Hindalco Result Update 4 qfy2010-110510
Hindalco Result Update 4 qfy2010-110510Hindalco Result Update 4 qfy2010-110510
Hindalco Result Update 4 qfy2010-110510
 
Hindalco
Hindalco Hindalco
Hindalco
 
Godawari Power
Godawari PowerGodawari Power
Godawari Power
 
Hindalco novelis ru4 qfy2010-280510
Hindalco novelis ru4 qfy2010-280510Hindalco novelis ru4 qfy2010-280510
Hindalco novelis ru4 qfy2010-280510
 
Bhushan Steel
Bhushan Steel Bhushan Steel
Bhushan Steel
 
Graphite india ru4 qfy2010-140510
Graphite india ru4 qfy2010-140510Graphite india ru4 qfy2010-140510
Graphite india ru4 qfy2010-140510
 
Cairn India
Cairn IndiaCairn India
Cairn India
 
Inox ru4 qfy2010-240510
Inox ru4 qfy2010-240510Inox ru4 qfy2010-240510
Inox ru4 qfy2010-240510
 
India Cement
India CementIndia Cement
India Cement
 
Hzl 2 qfy2011 result update - 201010
Hzl   2 qfy2011 result update - 201010Hzl   2 qfy2011 result update - 201010
Hzl 2 qfy2011 result update - 201010
 
Jsw Steel
Jsw Steel   Jsw Steel
Jsw Steel
 
RIL - result Update
RIL - result UpdateRIL - result Update
RIL - result Update
 
Jk lakshmi ru4 qfy2010-190510
Jk lakshmi ru4 qfy2010-190510Jk lakshmi ru4 qfy2010-190510
Jk lakshmi ru4 qfy2010-190510
 
Jk lakshmi ru4 qfy2010-190510
Jk lakshmi ru4 qfy2010-190510Jk lakshmi ru4 qfy2010-190510
Jk lakshmi ru4 qfy2010-190510
 
Titan result update 4 qfy2010-050510
Titan result update 4 qfy2010-050510Titan result update 4 qfy2010-050510
Titan result update 4 qfy2010-050510
 
Nalco
Nalco Nalco
Nalco
 
India cements result update 4 qfy2010-060510
India cements  result update 4 qfy2010-060510India cements  result update 4 qfy2010-060510
India cements result update 4 qfy2010-060510
 
RIL Result Update
RIL Result UpdateRIL Result Update
RIL Result Update
 
Nestle 1QCY2010 Result Update
Nestle 1QCY2010 Result UpdateNestle 1QCY2010 Result Update
Nestle 1QCY2010 Result Update
 

More from Angel Broking

Market outlook 110612
Market outlook 110612Market outlook 110612
Market outlook 110612Angel Broking
 
Axis%20 bank ru1qfy2012-220711
Axis%20 bank ru1qfy2012-220711Axis%20 bank ru1qfy2012-220711
Axis%20 bank ru1qfy2012-220711Angel Broking
 
Electrosteel castings
Electrosteel castingsElectrosteel castings
Electrosteel castingsAngel Broking
 
Derivative report 19th July 2011
Derivative report 19th July 2011Derivative report 19th July 2011
Derivative report 19th July 2011Angel Broking
 
Market outlook 19th July 2011
Market outlook 19th July 2011Market outlook 19th July 2011
Market outlook 19th July 2011Angel Broking
 
Weekly Report 18th July 2011
Weekly Report 18th July 2011Weekly Report 18th July 2011
Weekly Report 18th July 2011Angel Broking
 
Derivative Report 18th July 2011
Derivative Report 18th July 2011Derivative Report 18th July 2011
Derivative Report 18th July 2011Angel Broking
 
Technical Report 18th July 2011
Technical Report 18th July 2011Technical Report 18th July 2011
Technical Report 18th July 2011Angel Broking
 
Market Outlook 18th July 2011
Market Outlook 18th July 2011Market Outlook 18th July 2011
Market Outlook 18th July 2011Angel Broking
 
Bajaj auto Result Updated
Bajaj auto Result UpdatedBajaj auto Result Updated
Bajaj auto Result UpdatedAngel Broking
 
Tata consultancy services
Tata consultancy services Tata consultancy services
Tata consultancy services Angel Broking
 
Derivatives Report 15th July 2011
Derivatives Report 15th July 2011Derivatives Report 15th July 2011
Derivatives Report 15th July 2011Angel Broking
 
Technical Report 15th July 2011
Technical Report 15th July 2011Technical Report 15th July 2011
Technical Report 15th July 2011Angel Broking
 
Infosys Result Updated
Infosys Result UpdatedInfosys Result Updated
Infosys Result UpdatedAngel Broking
 
Derivative Report 13th July 2011
Derivative Report 13th July 2011Derivative Report 13th July 2011
Derivative Report 13th July 2011Angel Broking
 

More from Angel Broking (20)

Market outlook 110612
Market outlook 110612Market outlook 110612
Market outlook 110612
 
Axis%20 bank ru1qfy2012-220711
Axis%20 bank ru1qfy2012-220711Axis%20 bank ru1qfy2012-220711
Axis%20 bank ru1qfy2012-220711
 
Electrosteel castings
Electrosteel castingsElectrosteel castings
Electrosteel castings
 
Persistent systems
Persistent systemsPersistent systems
Persistent systems
 
Ht media
Ht mediaHt media
Ht media
 
Derivative report 19th July 2011
Derivative report 19th July 2011Derivative report 19th July 2011
Derivative report 19th July 2011
 
Market outlook 19th July 2011
Market outlook 19th July 2011Market outlook 19th July 2011
Market outlook 19th July 2011
 
Telecom sector
Telecom sectorTelecom sector
Telecom sector
 
Weekly Report 18th July 2011
Weekly Report 18th July 2011Weekly Report 18th July 2011
Weekly Report 18th July 2011
 
Derivative Report 18th July 2011
Derivative Report 18th July 2011Derivative Report 18th July 2011
Derivative Report 18th July 2011
 
Technical Report 18th July 2011
Technical Report 18th July 2011Technical Report 18th July 2011
Technical Report 18th July 2011
 
Market Outlook 18th July 2011
Market Outlook 18th July 2011Market Outlook 18th July 2011
Market Outlook 18th July 2011
 
South Indian Bank
 South Indian Bank South Indian Bank
South Indian Bank
 
Bajaj auto Result Updated
Bajaj auto Result UpdatedBajaj auto Result Updated
Bajaj auto Result Updated
 
Tata consultancy services
Tata consultancy services Tata consultancy services
Tata consultancy services
 
Fc4 e63c4d01
Fc4 e63c4d01Fc4 e63c4d01
Fc4 e63c4d01
 
Derivatives Report 15th July 2011
Derivatives Report 15th July 2011Derivatives Report 15th July 2011
Derivatives Report 15th July 2011
 
Technical Report 15th July 2011
Technical Report 15th July 2011Technical Report 15th July 2011
Technical Report 15th July 2011
 
Infosys Result Updated
Infosys Result UpdatedInfosys Result Updated
Infosys Result Updated
 
Derivative Report 13th July 2011
Derivative Report 13th July 2011Derivative Report 13th July 2011
Derivative Report 13th July 2011
 

HZL Q4 2010 Result Update

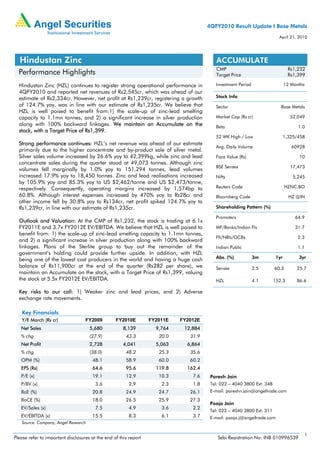
  • 1. 4QFY2010 Result Update I Base Metals April 21, 2010 Hindustan Zinc ACCUMULATE CMP Rs1,232 Performance Highlights Target Price Rs1,399 Hindustan Zinc (HZL) continues to register strong operational performance in Investment Period 12 Months 4QFY2010 and reported net revenues of Rs2,545cr, which was ahead of our estimate of Rs2,334cr. However, net profit at Rs1,239cr, registering a growth Stock Info of 124.7% yoy, was in line with our estimate of Rs1,235cr. We believe that Sector Base Metals HZL is well poised to benefit from:1) the scale-up of zinc-lead smelting capacity to 1.1mn tonnes, and 2) a significant increase in silver production Market Cap (Rs cr) 52,049 along with 100% backward linkages. We maintain an Accumulate on the Beta 1.0 stock, with a Target Price of Rs1,399. 52 WK High / Low 1,325/458 Strong performance continues: HZL’s net revenue was ahead of our estimate Avg. Daily Volume 60928 primarily due to the higher concentrate and by-product sale of silver metal. Silver sales volume increased by 26.6% yoy to 42,399kg, while zinc and lead Face Value (Rs) 10 concentrate sales during the quarter stood at 49,073 tonnes. Although zinc BSE Sensex 17,473 volumes fell marginally by 1.0% yoy to 151,294 tonnes, lead volumes increased 17.9% yoy to 18,450 tonnes. Zinc and lead realisations increased Nifty 5,245 by 105.9% yoy and 85.3% yoy to US $2,462/tonne and US $2,473/tonne, respectively. Consequently, operating margins increased by 1,574bp to Reuters Code HZNC.BO 60.8%. Although interest expenses increased by 470% yoy to Rs28cr and Bloomberg Code HZ @IN other income fell by 30.8% yoy to Rs134cr, net profit spiked 124.7% yoy to Rs1,239cr, in line with our estimate of Rs1,235cr. Shareholding Pattern (%) Promoters 64.9 Outlook and Valuation: At the CMP of Rs1,232, the stock is trading at 6.1x FY2011E and 3.7x FY2012E EV/EBITDA. We believe that HZL is well poised to MF/Banks/Indian FIs 31.7 benefit from: 1) the scale-up of zinc-lead smelting capacity to 1.1mn tonnes, FII/NRIs/OCBs 2.3 and 2) a significant increase in silver production along with 100% backward linkages. Plans of the Sterlite group to buy out the remainder of the Indian Public 1.1 government’s holding could provide further upside. In addition, with HZL Abs. (%) 3m 1yr 3yr being one of the lowest cost producers in the world and having a huge cash balance of Rs11,900cr at the end of the quarter (Rs282 per share), we Sensex 2.5 60.3 25.7 maintain an Accumulate on the stock, with a Target Price of Rs1,399, valuing the stock at 5.5x FY2012E EV/EBITDA. HZL 4.1 152.3 86.6 Key risks to our call: 1) Weaker zinc and lead prices, and 2) Adverse exchange rate movements. Key Financials Y/E March (Rs cr) FY2009 FY2010E FY2011E FY2012E Net Sales 5,680 8,139 9,764 12,884 % chg (27.9) 43.3 20.0 31.9 Net Profit 2,728 4,041 5,063 6,864 % chg (38.0) 48.2 25.3 35.6 OPM (%) 48.1 58.9 60.0 60.2 EPS (Rs) 64.6 95.6 119.8 162.4 P/E (x) 19.1 12.9 10.3 7.6 Paresh Jain P/BV (x) 3.6 2.9 2.3 1.8 Tel: 022 – 4040 3800 Ext: 348 RoE (%) 20.8 24.9 24.7 26.1 E-mail: pareshn.jain@angeltrade.com RoCE (%) 18.0 26.5 25.9 27.3 Pooja Jain EV/Sales (x) 7.5 4.9 3.6 2.2 Tel: 022 – 4040 3800 Ext: 311 EV/EBITDA (x) 15.5 8.3 6.1 3.7 E-mail: pooja.j@angeltrade.com Source: Company, Angel Research 1 Please refer to important disclosures at the end of this report Sebi Registration No: INB 010996539
  • 2. Hindustan Zinc I 4QFY2010 Result Update Exhibit 1: 4QFY2010 Performance Y/E March (Rs cr) 4QFY10 4QFY09 yoy (%) FY10 FY09 yoy (%) Net Sales 2,545 1,289 97.4 8,139 5,680 43.3 Mining and Manufacturing 566 466 21.4 1,961 1,906 2.9 expenses % of Net sales 22.3 36.2 24.1 33.5 Mining Royalty 191 84 128.0 613 364 68.2 % of Net sales 7.5 6.5 7.5 6.4 Staff Cost 135 87 55.1 457 365 25.3 % of Net sales 5.3 6.8 5.6 6.4 Admin and selling 105 71 48.3 316 311 1.4 % of Net sales 4.1 5.5 3.9 5.5 Total Expenditure 997 708 40.9 3,347 2,946 13.6 % of Net sales 39.2 54.9 41.1 51.9 EBIDTA 1,548 581 166.3 4,792 2,734 75.3 % of Net sales 60.8 45.1 58.9 48.1 Interest 28 5 469.5 44 22 100.7 Depreciation 101 75 34.1 334 285 17.2 Other Income 134 194 (30.8) 600 931 (35.5) Exceptional Items - - - - Profit before Tax 1,554 696 123.4 5,014 3,358 49.3 % of Net sales 61.1 54.0 61.6 59.1 Provision for tax 315 144 118.7 973 631 54.2 % of PBT 20.3 20.7 19.4 18.8 Profit After tax 1,239 551 124.7 4,041 2,728 48.2 % of Net sales 48.7 42.8 49.7 48.0 EPS (Rs) 29.3 13.1 124.8 95.6 64.6 48.2 Source: Company, Angel Research Higher by-product sales led to strong top-line performance HZL’s saleable zinc production was flat at 150,309 tonnes (150,544 tonnes), while saleable lead production increased by 16.9% yoy to 18,345 tonnes (15,691 tonnes). Consequently, zinc volumes declined by 1.0% yoy to 151,294 tonnes (152,796 tonnes), while lead volumes increased by 17.9% yoy to 18,450 tonnes (15,651 tonnes). However, zinc and lead realisations increased by 105.9% yoy to US $2,462/tonne and 85.3% yoy to US $2,473/tonne, respectively. Sales were also supported by higher zinc and lead concentrate sales during the quarter at 49,073 tonnes. Silver production increased by 22.4% yoy to 43,066 tonnes (35,176 tonnes), while sales grew 26.6% yoy to 42,399kg (33,496kg). Average silver realisation surged 41.0% yoy to Rs25,970/kg (Rs 19,978/kg). Thus, net revenues increased by 97.4% to Rs2,545cr, ahead of our estimate of Rs2,334cr. April 21, 2010 2
  • 3. Hindustan Zinc I 4QFY2010 Result Update Exhibit 2: Zinc Metal Volumes down 1.0%; Realisations up 105.9% 180,000 4,000 160,000 3,500 140,000 3,000 120,000 2,500 (US $/tonne) (tonnes) 100,000 2,000 80,000 1,500 60,000 40,000 1,000 20,000 500 0 0 Q2 2008 Q4 2008 2QFY09 4QFY09 2QFY10 4QFY10 Volume (LHS) Realisation (RHS) Source: Company, Angel Research Exhibit 3: Lead Metal Volumes up 17.9%; Realisation up 85.3% 25,000 4,000 3,500 20,000 3,000 (US $/tonne) 15,000 2,500 (tonnes) 2,000 10,000 1,500 1,000 5,000 500 0 0 Q2 2008 Q4 2008 2QFY09 4QFY09 2QFY10 4QFY10 Volume (LHS) Realisation (RHS) Source: Company, Angel Research EBITDA margins expand by 1,574bp to 60.8% During the quarter, royalty costs increased by 128.0% yoy to Rs191cr and salary costs were up by 55.1% yoy to Rs135cr. However, higher by-product sales resulted in operating margins expanding by 1,574bp to 60.8%, marginally lower than our estimate. Net profit up 124.7% in line with our estimate In 4QFY2010, though interest expenses increased by 470% yoy to Rs28cr and other income fell by 30.8% yoy to Rs134cr, net profit moved up 124.7% yoy to Rs1,239cr on the back of strong operating performance. Status on Expansion projects • At the end of the quarter, the 210,000 tonne zinc smelter at Dariba and 1mtpa zinc concentrator at Rampura Agucha was successfully commissioned around three months ahead of schedule. • The 100,000 tonne lead smelter is expected to be commissioned in 2QFY2011E. • Mining projects at Sindesar Khurd is also on schedule for commissioning by 1QFY2011E. April 21, 2010 3
  • 4. Hindustan Zinc I 4QFY2010 Result Update Outlook Zinc Metal surplus to decline by 40.3% in CY2010E As per ILZSG, in CY2010E, global zinc usage is expected to grow by 11.9% to 12.04mn tones, whereas refined zinc production is expected to increase by 10.1% to 12.26mn tonnes. Hence, global zinc metal supply is likely to remain in surplus by 227,000 tonnes in CY2010E, a decline of 40.3% from a surplus of 380,000 tonnes in CY2009E. Lead Metal surplus to increase by 25% in CY2010E As per ILZSG, lead metal is expected to remain in surplus by 100,000 tonnes (80,000 tonnes) in CY2010E. Global lead usage is expected to grow by 7.5% yoy to 9.6mn tonnes. ILZSG expects demand to recover in Europe and US by 8.8% and 2.9% respectively, while China’s lead demand is expected to grow by 7.8% in CY2010E. Lead metal production is likely to increase by 7.4% to 9.7mn tonnes, primarily driven by the commissioning of new plants in Brazil and India. Valuation At the CMP of Rs1,232, the stock is trading at 6.1x FY2011E and 3.7x FY2012E EV/EBITDA. We believe that HZL is well poised to benefit from: 1) the scale-up of zinc-lead smelting capacity to 1.1mn tonnes, and 2) a significant increase in silver production along with 100% backward linkages. Plans of the Sterlite group to buy out the remainder of the government’s holding could provide further upside. Moreover, with HZL being one of the lowest cost producers in the world and having a substantial cash balance of Rs11,900cr at the end of the quarter (Rs282 per share), we maintain an Accumulate on the stock, with a Target Price of Rs1,399, valuing the stock at 5.5x FY2012E EV/EBITDA. Key risks to our call: 1) Weaker zinc and lead prices, and 2) Adverse exchange rate movements. Exhibit 4: 1-year forward EV/EBITDA (Rs mn) 700,000 600,000 9x 500,000 400,000 7x 300,000 5x 200,000 3x 100,000 1x 0 (100,000) Apr-03 Apr-04 Apr-05 Apr-06 Apr-07 Apr-08 Apr-09 Apr-10 Source: Bloomberg, Angel Research April 21, 2010 4
  • 5. Hindustan Zinc I 4QFY2010 Result Update Exhibit 5: 1-year forward P/E (Rs) 1,800 14x 1,600 1,400 1,200 10x 1,000 800 6x 600 400 2x 200 0 Apr-03 Apr-04 Apr-05 Apr-06 Apr-07 Apr-08 Apr-09 Apr-10 Source: Bloomberg, Angel Research Exhibit 6: 1-year forward P/BV (Rs) 3,000 5x 2,500 2,000 3.5x 1,500 1,000 2x 500 0.5x 0 Apr-03 Apr-04 Apr-05 Apr-06 Apr-07 Apr-08 Apr-09 Apr-10 Source: Bloomberg, Angel Research April 21, 2010 5
  • 6. Hindustan Zinc I 4QFY2010 Result Update Profit & Loss Statement Rs crore Y/E March FY2007 FY2008 FY2009 FY2010 FY2011E FY2012E Gross sales 9,220 8,737 6,141 8,847 10,278 13,562 Less: Excise duty 660 859 461 708 514 678 Net Sales 8,560 7,878 5,680 8,139 9,764 12,884 Other operating income - - - - - - Total operating income 8,560 7,878 5,680 8,139 9,764 12,884 % chg 120.8 (8.0) (27.9) 43.3 20.0 31.9 Total Expenditure 2,153 2,499 2,946 3,347 3,903 5,129 Net Raw Materials 984 1,352 1,906 1,961 2,465 3,317 Other Mfg costs 644 511 364 613 683 902 Personnel 260 308 365 457 419 516 Other 266 328 311 316 335 395 EBITDA 6,407 5,378 2,734 4,792 5,861 7,754 % chg 178.6 (16.1) (49.2) 75.3 22.3 32.3 (% of Net Sales) 74.8 68.3 48.1 58.9 60.0 60.2 Depreciation 156 221 285 334 382 423 EBIT 6,251 5,158 2,449 4,458 5,479 7,331 % chg 189.2 (17.5) (52.5) 82.0 22.9 33.8 (% of Net Sales) 73.0 65.5 43.1 54.8 56.1 56.9 Interest & other Charges 28 24 22 44 24 26 Other Income 231 852 931 600 874 1,275 (% of PBT) 3.6 14.2 27.7 12.0 13.8 14.9 Share in profit of Asso. - - - - - - Recurring PBT 6,454 5,985 3,358 5,014 6,329 8,580 % chg 189.5 (7.3) (43.9) 49.3 26.2 35.6 Extraordinary Inc/(Exp.) - - - - - - PBT (reported) 6,454 5,985 3,358 5,014 6,329 8,580 Tax 2,012 1,589 631 973 1,266 1,716 (% of PBT) 31.2 26.6 18.8 19.4 20.0 20.0 PAT (reported) 4,442 4,396 2,728 4,041 5,063 6,864 Add: Share of associates - - - - - - Less: Minority interest (MI) - - - - - - Extraordinary Exp./(Inc.) - - - - - - PAT after MI (reported) 4,442 4,396 2,728 4,041 5,063 6,864 ADJ. PAT 4,442 4,396 2,728 4,041 5,063 6,864 % chg 201.7 (1.0) (38.0) 48.2 25.3 35.6 (% of Net Sales) 51.9 55.8 48.0 49.7 51.9 53.3 Basic EPS (Rs) 105.1 104.0 64.6 95.6 119.8 162.4 Fully Diluted EPS (Rs) 105.1 104.0 64.6 95.6 119.8 162.4 % chg 201.7 (1.0) (38.0) 48.2 25.3 35.6 April 21, 2010 6
  • 7. Hindustan Zinc I 4QFY2010 Result Update Balance Sheet Rs crore Y/E March FY2007 FY2008 FY2009 FY2010E FY2011E FY2012E SOURCES OF FUNDS Equity Share Capital 423 423 423 423 423 423 Reserves& Surplus 7,205 11,426 13,935 17,680 22,545 29,211 Shareholders Funds 7,627 11,848 14,358 18,102 22,968 29,634 Share Warrants - - - - - - Minority Interest - - - - - - Total Loans 0.4 0.4 9 9 9 9 Deferred Tax Liability 301 460 559 559 585 597 Total Liabilities 7,928 12,308 14,925 18,670 23,562 30,239 APPLICATION OF FUNDS Gross Block 3,500 5,182 5,856 6,983 8,110 9,037 Less: Acc. Depreciation 1,264 1,485 1,751 2,085 2,467 2,890 Net Block 2,236 3,697 4,105 4,898 5,643 6,147 Capital Work-in-Progress 635 465 1,108 1,308 1,108 408 Goodwill - - - - - - Investments 4,403 6,332 6,929 6,929 6,929 6,929 Current Assets 1,481 2,712 3,784 6,800 11,115 18,186 Cash 120 1,363 2,719 5,580 9,526 16,217 Loans & Advances 305 384 313 313 345 345 Other 1,057 965 751 906 1,244 1,624 Current liabilities 827 898 1,001 1,265 1,233 1,431 Net Current Assets 654 1,813 2,783 5,535 9,881 16,755 Mis. Exp. not written off - - - - - - Total Assets 7,928 12,308 14,925 18,670 23,562 30,239 Cash Flow Statement Rs crore Y/E March FY2007 FY2008 FY2009 FY2010E FY2011E FY2012E Profit before tax 6,454 5,985 3,358 5,014 6,329 8,580 Depreciation 157 222 286 334 382 423 Change in Working Capital 238 376 296 (87) (297) (229) Less: Other income (144) (767) (777) - - - Direct taxes paid 1,958 1,529 521 876 1,213 1,658 Cash Flow from Operations 4,747 4,288 2,642 4,386 5,201 7,116 Inc./ (Dec.) in Fixed Assets 1,110 1,513 1,374 1,327 927 227 Inc./ (Dec.) in Investments 2,798 1,407 443 - - - Inc./ (Dec.) in loans and advances 142 80 (71) - 31.3 - Other income 178 226 (1,602) - - - Cash Flow from Investing 3,872 2,774 3,348 1,327 958 227 Issue of Equity - - - - - - Inc./(Dec.) in loans (558) - 8 - - - Dividend Paid (Incl. Tax) 240 247 124 198 297 198 Others 31 24 22 - - - Cash Flow from Financing (829) (271) (137) (198) (297) (198) Inc./(Dec.) in Cash 46 1,243 (844) 2,861 3,946 6,691 Opening Cash balances 74 120 3,563 2,719 5,580 9,526 Closing Cash balances 120 1,363 2,719 5,580 9,526 16,217 April 21, 2010 7
  • 8. Hindustan Zinc I 4QFY2010 Result Update Key Ratios Y/E March FY2007 FY2008 FY2009 FY2010E FY2011E FY2012E Valuation Ratio (x) P/E (on FDEPS) 11.7 11.8 19.1 12.9 10.3 7.6 P/CEPS 11.3 11.3 17.3 11.9 9.6 7.1 P/BV 6.8 4.4 3.6 2.9 2.3 1.8 Dividend yield (%) 0.4 0.4 0.3 0.5 0.3 0.3 EV/Sales 5.6 5.6 7.5 4.9 3.6 2.2 EV/EBITDA 7.4 8.2 15.5 8.3 6.1 3.7 EV / Total Assets 6.0 3.6 2.8 2.1 1.5 1.0 Per Share Data (Rs) EPS (Basic) 105.1 104.0 64.6 95.6 119.8 162.4 EPS (fully diluted) 105.1 104.0 64.6 95.6 119.8 162.4 Cash EPS 108.8 109.3 71.3 103.6 28.9 172.5 DPS 5.0 5.0 4.0 6.0 4.0 4.0 Book Value 180.5 280.4 339.8 428.4 543.6 701.3 Dupont Analysis EBIT margin 73.0 65.5 43.1 54.8 56.1 56.9 Tax retention ratio (%) 68.8 73.4 81.2 80.6 80.0 80.0 Asset turnover (x) 2.5 1.7 1.1 1.3 1.4 1.8 ROIC (Post-tax) 126.3 82.1 37.7 58.3 61.7 82.7 Cost of Debt (Post Tax) - - - - - - Leverage (x) (0.6) (0.6) (0.7) (0.7) (0.7) (0.8) Operating ROE 51.4 28.8 12.4 18.0 17.5 18.1 Returns (%) ROCE (Pre-tax) 102.8 51.0 18.0 26.5 25.9 27.3 Angel ROIC (Pre-tax) 209.9 128.6 49.5 77.9 82.6 103.2 ROE 80.3 45.1 20.8 24.9 24.7 26.1 Turnover ratios (x) Asset Turnover (Gross Block) 2.6 1.8 1.0 1.3 1.3 1.5 Inventory / Sales (days) 84.6 75.7 67.6 67.6 75.0 75.0 Receivables (days) 23.7 20.6 10.6 11.0 15.0 15.0 Payables (days) 35.0 51.8 46.1 48.0 45.0 45.0 WC cycle (ex-cash) (days) 37.1 33.7 30.4 17.1 21.4 23.7 Solvency ratios (x) Net debt to equity (0.6) (0.6) (0.7) (0.7) (0.7) (0.8) Net debt to EBITDA (0.7) (1.4) (3.5) (2.6) (2.8) (3.0) Interest Coverage 219.8 213.4 111.9 101.5 225.6 278.8 April 21, 2010 8
  • 9. Hindustan Zinc I 4QFY2010 Result Update Research Team Tel: 4040 3800 E-mail: research@angeltrade.com Website: www.angeltrade.com DISCLAIMER This document is solely for the personal information of the recipient, and must not be singularly used as the basis of any investment decision. Nothing in this document should be construed as investment or financial advice. Each recipient of this document should make such investigations as they deem necessary to arrive at an independent evaluation of an investment in the securities of the companies referred to in this document (including the merits and risks involved), and should consult their own advisors to determine the merits and risks of such an investment. Angel Securities Limited, its affiliates, directors, its proprietary trading and investment businesses may, from time to time, make investment decisions that are inconsistent with or contradictory to the recommendations expressed herein. The views contained in this document are those of the analyst, and the company may or may not subscribe to all the views expressed within. Reports based on technical and derivative analysis center on studying charts of a stock's price movement, outstanding positions and trading volume, as opposed to focusing on a company's fundamentals and, as such, may not match with a report on a company's fundamentals. The information in this document has been printed on the basis of publicly available information, internal data and other reliable sources believed to be true, and is for general guidance only. Angel Securities Limited has not independently verified all the information contained within this document. Accordingly, we cannot testify, nor make any representation or warranty, express or implied, to the accuracy, contents or data contained within this document. While Angel Securities Limited endeavours to update on a reasonable basis the information discussed in this material, there may be regulatory, compliance, or other reasons that prevent us from doing so. This document is being supplied to you solely for your information, and its contents, information or data may not be reproduced, redistributed or passed on, directly or indirectly. Angel Securities Limited and its affiliates may seek to provide or have engaged in providing corporate finance, investment banking or other advisory services in a merger or specific transaction to the companies referred to in this report, as on the date of this report or in the past. Neither Angel Securities Limited, nor its directors, employees or affiliates shall be liable for any loss or damage that may arise from or in connection with the use of this information. Note: Please refer to the important `Stock Holding Disclosure' report on the Angel website (Research Section). Disclosure of Interest Statement Hindustan Zinc 1. Analyst ownership of the stock No 2. Angel and its Group companies ownership of the stock No 3. Angel and its Group companies’ Directors ownership of the stock No 4. Broking relationship with company covered No Note: We have not considered any Exposure below Rs 1 lakh for Angel and its Group companies. Address: Acme Plaza, ‘A’ Wing, 3rd Floor, M.V. Road, Opp. Sangam Cinema, Andheri (E), Mumbai - 400 059. Tel: (022) 3952 4568 / 4040 3800 Angel Broking Ltd: BSE Sebi Regn No : INB 010996539 / CDSL Regn No: IN - DP - CDSL - 234 - 2004 / PMS Regn Code: PM/INP000001546 Angel Securities Ltd:BSE: INB010994639/INF010994639 NSE: INB230994635/INF230994635 Membership numbers: BSE 028/NSE:09946 Angel Capital & Debt Market Ltd: INB 231279838 / NSE FNO: INF 231279838 / NSE Member code -12798 Angel Commodities Broking (P) Ltd: MCX Member ID: 12685 / FMC Regn No: MCX / TCM / CORP / 0037 NCDEX : Member ID 00220 / FMC Regn No: NCDEX / TCM / CORP / 0302 April 21, 2010 9