1. Derivative Report
India Research
May 19, 2010
Comments
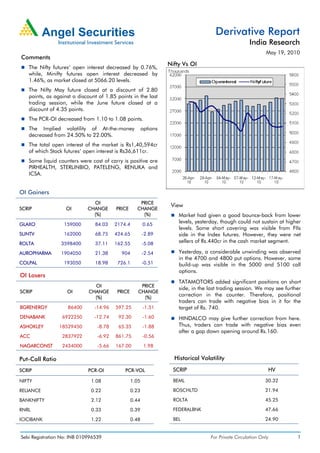
Nifty Vs OI
The Nifty futures’ open interest decreased by 0.76%,
while, Minifty futures open interest decreased by
1.46%, as market closed at 5066.20 levels.
The Nifty May future closed at a discount of 2.80
points, as against a discount of 1.85 points in the last
trading session, while the June future closed at a
discount of 4.35 points.
The PCR-OI decreased from 1.10 to 1.08 points.
The Implied volatility of At-the-money options
decreased from 24.50% to 22.00%.
The total open interest of the market is Rs1,40,594cr
of which Stock futures’ open interest is Rs36,611cr.
Some liquid counters were cost of carry is positive are
PIRHEALTH, STERLINBIO, PATELENG, RENUKA and
ICSA.
OI Gainers
OI PRICE
View
SCRIP OI CHANGE PRICE CHANGE
(%) (%) Market had given a good bounce-back from lower
GLAXO 159000 84.03 2174.4 0.65
levels, yesterday, though could not sustain at higher
levels. Some short covering was visible from FIIs
SUNTV 162000 68.75 424.65 -2.89 side in the Index futures. However, they were net
ROLTA 3598400 37.11 162.55 -5.08 sellers of Rs.440cr in the cash market segment.
AUROPHARMA 1904050 21.38 904 -2.54 Yesterday, a considerable unwinding was observed
in the 4700 and 4800 put options. However, some
COLPAL 193050 18.98 726.1 -0.51 build-up was visible in the 5000 and 5100 call
options.
OI Losers
TATAMOTORS added significant positions on short
OI PRICE
side, in the last trading session. We may see further
SCRIP OI CHANGE PRICE CHANGE
(%) (%)
correction in the counter. Therefore, positional
traders can trade with negative bias in it for the
BGRENERGY 86400 -14.96 597.25 -1.51 target of Rs. 740.
DENABANK 6922250 -12.74 92.30 -1.60 HINDALCO may give further correction from here.
ASHOKLEY 18529450 -8.78 65.35 -1.88 Thus, traders can trade with negative bias even
after a gap down opening around Rs.160.
ACC 2837922 -6.92 861.75 -0.56
NAGARCONST 2434000 -5.66 167.00 1.98
Put-Call Ratio Historical Volatility
SCRIP PCR-OI PCR-VOL SCRIP HV
NIFTY 1.08 1.05 BEML 30.32
RELIANCE 0.22 0.23 BOSCHLTD 21.94
BANKNIFTY 2.12 0.44 ROLTA 45.25
RNRL 0.33 0.39 FEDERALBNK 47.66
ICICIBANK 1.22 0.48 BEL 24.90
Sebi Registration No: INB 010996539 For Private Circulation Only 1
2. Derivative Report | India Research
FII Statistics for 18-May-2010 Turnover on 18-May-2010
Open Interest
No. of Turnover Change
Detail Buy Sell Net Instrument
Contracts (Rs. in cr.) (%)
Contracts Value Change
(Rs. in cr.) (%)
INDEX Index Futures 718287 17026.78 -20.47
2720.97 2264.38 456.58 556086 14049.91 -7.68
FUTURES
INDEX Stock Futures 524096 17020.93 -8.42
4907.69 4996.42 (88.72) 1938339 49074.14 0.52
OPTIONS
STOCK Index Options 2231613 56957.55 -18.30
2632.87 2252.36 380.51 1037993 29881.07 1.00
FUTURES
STOCK Stock Options 102640 3570.03 -18.19
279.79 326.56 (46.77) 45442 1380.99 5.96
OPTIONS
TOTAL 10541.32 9839.72 701.60 3577860 94386.11 -0.65 Total 3576636 94575.29 -17.09
Nifty Spot = 5066.20 Lot Size = 50
Bull-Call Spreads Bear-Put Spreads
Action Strike Price Risk Reward BEP Action Strike Price Risk Reward BEP
Buy 5100 56.65 Buy 5000 52.30
34.45 65.55 5134.45 24.35 75.65 4975.65
Sell 5200 22.20 Sell 4900 27.95
Buy 5100 56.65 Buy 5000 52.30
49.75 150.25 5149.75 38.30 161.70 4961.70
Sell 5300 6.90 Sell 4800 14.00
Buy 5200 22.20 Buy 4900 27.95
15.30 84.70 5215.30 13.95 86.05 4886.05
Sell 5300 6.90 Sell 4800 14.00
Note: Above mentioned Bullish or Bearish Spreads in Nifty (May Series) are given as an information and not as a recommendation
Nifty Put-Call Analysis
For Private Circulation Only Sebi Registration No: INB 010996539 2
3. Derivative Report | India Research
Strategy Date Scrip Strategy Status
30-04-2010 RELCAPITAL Long Call Ladder Continue
30-04-2010 NAGARFERT Long Call Continue
08-05-2010 HINDUNILVR Short Strangle Continue
17-May-2010 CAIRN Long Put Continue
DISCLAIMER:
This document is not for public distribution and has been furnished to you solely for your information and must not be reproduced or redistributed to any other person.
Persons into whose possession this document may come are required to observe these restrictions.
Opinion expressed is our current opinion as of the date appearing on this material only. While we endeavor to update on a reasonable basis the information discussed in
this material, there may be regulatory, compliance, or other reasons that prevent us from doing so. Prospective investors and others are cautioned that any forward-
looking statements are not predictions and may be subject to change without notice. Our proprietary trading and investment businesses may make investment decisions
that are inconsistent with the recommendations expressed herein.
The information in this document has been printed on the basis of publicly available information, internal data and other reliable sources believed to be true and are for
general guidance only. While every effort is made to ensure the accuracy and completeness of information contained, the company takes no guarantee and assumes no
liability for any errors or omissions of the information. No one can use the information as the basis for any claim, demand or cause of action.
Recipients of this material should rely on their own investigations and take their own professional advice. Each recipient of this document should make such investigations
as it deems necessary to arrive at an independent evaluation of an investment in the securities of companies referred to in this document (including the merits and risks
involved), and should consult their own advisors to determine the merits and risks of such an investment. Price and value of the investments referred to in this material may
go up or down. Past performance is not a guide for future performance.
Certain transactions - futures, options and other derivatives as well as non-investment grade securities - involve substantial risks and are not suitable for all investors.
Reports based on technical analysis centers on studying charts of a stock's price movement and trading volume, as opposed to focusing on a company's fundamentals and
as such, may not match with a report on a company's fundamentals.
We do not undertake to advise you as to any change of our views expressed in this document. While we would endeavor to update the information herein on a reasonable
basis, Angel Broking, its subsidiaries and associated companies, their directors and employees are under no obligation to update or keep the information current. Also
there may be regulatory, compliance, or other reasons that may prevent Angel Broking and affiliates from doing so. Prospective investors and others are cautioned that
any forward-looking statements are not predictions and may be subject to change without notice.
Angel Broking Limited and affiliates, including the analyst who has issued this report, may, on the date of this report, and from time to time, have long or short positions
in, and buy or sell the securities of the companies mentioned herein or engage in any other transaction involving such securities and earn brokerage or compensation or
act as advisor or have other potential conflict of interest with respect to company/ies mentioned herein or inconsistent with any recommendation and related information
and opinions.
Angel Broking Limited and affiliates may seek to provide or have engaged in providing corporate finance, investment banking or other advisory services in a merger or
specific transaction to the companies referred to in this report, as on the date of this report or in the past.
Sebi Registration No.: INB 010996539
Derivative Research Team derivatives.desk@angeltrade.com
For Private Circulation Only Sebi Registration No: INB 010996539 3