Significant AI Trends for the Financial Industry in 2024 and How to Utilize Them
Cairn India
1. 1QFY2011 Result Update | Oil & Gas
July 29, 2010
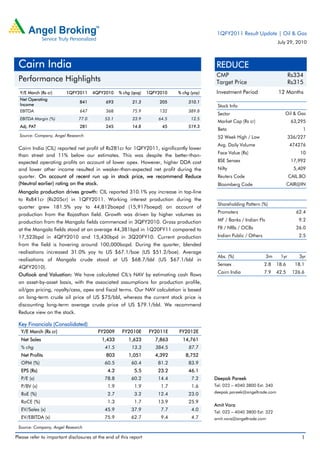
Cairn India REDUCE
CMP Rs334
Performance Highlights Target Price Rs315
Y/E March (Rs cr) 1QFY2011 4QFY2010 % chg (qoq) 1QFY2010 % chg (yoy) Investment Period 12 Months
Net Operating
841 693 21.3 205 310.1
Income Stock Info
EBITDA 647 368 75.9 132 389.8
Sector Oil & Gas
EBITDA Margin (%) 77.0 53.1 23.9 64.5 12.5
Market Cap (Rs cr) 63,295
Adj. PAT 281 245 14.8 45 519.3
Beta 1
Source: Company, Angel Research 52 Week High / Low 336/227
Avg. Daily Volume 474276
Cairn India (CIL) reported net profit of Rs281cr for 1QFY2011, significantly lower
Face Value (Rs) 10
than street and 11% below our estimates. This was despite the better-than-
expected operating profits on account of lower opex. However, higher DDA cost BSE Sensex 17,992
and lower other income resulted in weaker-than-expected net profit during the Nifty 5,409
quarter. On account of recent run up in stock price, we recommend Reduce Reuters Code CAIL.BO
(Neutral earlier) rating on the stock. Bloomberg Code CAIR@IN
Mangala production drives growth: CIL reported 310.1% yoy increase in top-line
to Rs841cr (Rs205cr) in 1QFY2011. Working interest production during the
Shareholding Pattern (%)
quarter grew 181.5% yoy to 44,812boepd (15,917boepd) on account of
Promoters 62.4
production from the Rajasthan field. Growth was driven by higher volumes as
production from the Mangala fields commenced in 3QFY2010. Gross production MF / Banks / Indian Fls 9.2
at the Mangala fields stood at an average 44,381bpd in 1Q20FY11 compared to FII / NRIs / OCBs 26.0
17,523bpd in 4QFY2010 and 15,430bpd in 3Q20FY10. Current production Indian Public / Others 2.5
from the field is hovering around 100,000bopd. During the quarter, blended
realisations increased 31.0% yoy to US $67.1/boe (US $51.2/boe). Average
Abs. (%) 3m 1yr 3yr
realisations of Mangala crude stood at US $68.7/bbl (US $67.1/bbl in
Sensex 2.8 18.6 18.1
4QFY2010).
Cairn India 7.9 42.5 126.6
Outlook and Valuation: We have calculated CIL's NAV by estimating cash flows
on asset-by-asset basis, with the associated assumptions for production profile,
oil/gas pricing, royalty/cess, opex and fiscal terms. Our NAV calculation is based
on long-term crude oil price of US $75/bbl, whereas the current stock price is
discounting long-term average crude price of US $79.1/bbl. We recommend
Reduce view on the stock.
Key Financials (Consolidated)
Y/E March (Rs cr) FY2009 FY2010E FY2011E FY2012E
Net Sales 1,433 1,623 7,863 14,761
% chg 41.5 13.3 384.5 87.7
Net Profits 803 1,051 4,392 8,752
OPM (%) 60.5 60.4 81.2 83.9
EPS (Rs) 4.2 5.5 23.2 46.1
P/E (x) 78.8 60.2 14.4 7.2 Deepak Pareek
P/BV (x) 1.9 1.9 1.7 1.6 Tel: 022 – 4040 3800 Ext: 340
RoE (%) 2.7 3.2 12.4 23.0 deepak.pareek@angeltrade.com
RoCE (%) 1.3 1.7 13.9 25.9
Amit Vora
EV/Sales (x) 45.9 37.9 7.7 4.0 Tel: 022 – 4040 3800 Ext: 322
EV/EBITDA (x) 75.9 62.7 9.4 4.7 amit.vora@angeltrade.com
Source: Company, Angel Research
Please refer to important disclosures at the end of this report 1
2. Cairn India |1QFY2011 Result Update
Exhibit 1: 1QFY2011 Performance
Y/E March (Rs cr) 1QFY2011 4QFY2010 % chg (qoq) 1QFY2010 % chg (yoy) FY2010 FY2009 % chg (yoy)
Net Operating Income 841 693 21.3 205 310.1 1623 1433 13.3
operating expenditure 219 184 18.7 44 397.2 425 213 99.5
other expenditure (25) 141 (118.0) 29 (188.1) 218 290 (24.8)
EBITDA 647 368 75.9 132 389.8 981 930 5.4
EBITDA Margin (%) 77.0 53.1 64.5 60.4 64.9
Other Income 28 88 (68.1) 129 (78.2) 422 516 (18.2)
DD&A 166 38 334.9 41 301.5 149 270 (45.0)
Exploration costs w/o 32 122 31 209 168
Interest 49 2 2520.2 1 6647.9 29 6 360.1
Forex fluctuation 41 0 0 0 9
PBT 387 294 31.6 188 105.5 1016 993 2.4
PBT Margin (%) 46.0 42.4 91.8 62.6 69.3
Total Tax 105 49 116.5 (21) (601.0) (35) 184 (118.8)
% of PBT 27.2 16.5 (11.2) (3.4) 18.6
Extra ordinaries/sales tax benefit - - 163.71 - 4.83
PAT before MI 281 245 14.8 45 519.3 1051 803 30.8
Minority interest - - - - -
PAT 281 245 14.8 45 519.3 1051 803 30.8
PAT Margin (%) 33.5 35.4 22.2 64.8 56.1
Source: Company, Angel Research
Exhibit 2: 1QFY2011 Actual v/s Estimates
(Rs cr) Estimates Actual Variation (%)
Net Operating Income 795 841 5.7
EBITDA 435 647 48.8
EBITDA Margin %) 54.7 77.0 (22.3)
PBT 408 387 (5.2)
Adj. PAT 317 281 (11.2)
Source: Company, Angel Research
Rajasthan crude production and higher realisations drive sales: During 1QFY201,
CIL’s top-line increased 310.1% yoy to Rs841cr (Rs205cr), which was higher than
our expectation of Rs795cr. Growth was driven by higher volumes and realisations
driven by sales from the Mangala fields. Working interest production during the
quarter registered an increase of 181.5% yoy to 44,812boepd (15,917boepd) on
account of production from the Rajasthan field. Gross production at Cairn’s
Mangala fields stood at average of 44,381bpd in 1QFY2011 compared with
17,523bpd in 4QFY2010 and 15,430bpd in 3QFY2010. Current production from
the field is hovering around 100,000bopd.
During the quarter, blended realisations registered an increase of 31.0% yoy to
US $67.1/boe (US $51.2/boe). Average oil price realisations increased 19.6% yoy
to US $72.7/bbl (US $60.2/bbl) on account of higher crude price during the
quarter. Gas price realisations increased 15.0% yoy to US $4.6/mnscf
(US $4.0/mnscf) owing to improved realisations from the Cambay basin. Average
realisations of Mangala crude stood at US $68.7/bbl ($67.1/bbl in 4QFY2010).
July 29, 2010 2
3. Cairn India |1QFY2011 Result Update
The discount to Brent oil prices stood at US $10/bbl or 13% to the Brent, which
was in line with the discount of 12% to Brent crude in 4QFY2010.
Exhibit 3: Operating income growth trend
900 140.0
800 120.0
115.6
700
100.0
600
80.0
(Rs cr)
500
(%)
400 60.0
300 39.8
40.0
200
21.3 20.0
100 12.1
12.8
- -
1QFY10 2QFY10 3QFY10 4QFY10 1QFY11
Operating Income Operating Income growth (RHS)
Source: Company, Angel Research
Exhibit 4: Working interest oil production
Working interest % chg % chg
1QFY2011 4QFY2010 1QFY2010
(bopd) (qoq) (yoy)
Ravva 6,496 6,660 (2.5) 8,226 (21.0)
Cambay 3,292 3,322 (0.9) 3,978 (17.2)
Rajasthan 31,067 12,272 153.2 - -
Total 40,855 22,254 83.6 12,204 234.8
Source: Company, Angel Research
Exhibit 5: Working interest gas production
Working % chg % chg
1QFY2011 4QFY2010 1QFY2010
Interest (mmscmd) (qoq) (yoy)
Ravva 0.3 0.3 6.7 0.3 (0.8)
Cambay 0.4 0.2 65.2 0.3 30.4
Total 0.7 0.5 33.1 0.6 14.5
Source: Company, Angel Research
OPM expands by 1,253bp yoy and 2,390bp qoq: During 1QFY2011, total direct
operating expenses (opex) for Rajasthan crude stood at US $4.3/bbl. Opex of
US $4.3/bbl was lower than our expectation; sequentially too it was lower -
US $6.1/bbl in 4QFY2010. Management has maintained that opex will hover
around US $3.5/bbl on a long-term basis once production at the Rajasthan field
stabilises. OPM expanded by 1,253bp yoy to 77.0% (64.5%) and exceeded our
expectation due to the reduction in direct opex during the quarter. EBITDA
increased by 389.8% yoy to Rs647cr (Rs132cr) on higher entitlement production
and realisations during the quarter.
July 29, 2010 3
4. Cairn India |1QFY2011 Result Update
Exhibit 6: Operating performance trend
700 90.0
77.0 80.0
600
64.5 70.1 70.0
500
58.0 60.0
53.1
(Rs cr)
400 50.0
(%)
300 40.0
30.0
200
20.0
100 10.0
- -
1QFY10 2QFY10 3QFY10 4QFY10 1QFY11
Operating Profit Operating Margins (RHS)
Source: Company, Angel Research
DD&A increases, exploration cost flat: DD&A expenditure increased by 301.5% yoy
to Rs166cr (Rs41cr) during the quarter due to the increase in depreciation cost on
account of commissioning of the pipeline, and increase in depletion cost on
account of production from the Mangala fields. CIL commissioned crude oil
pipeline and new trains during the quarter, which resulted in excess DD&A
expenditure of Rs120cr. Exploration cost (includes costs pertaining to
geological/geophysical studies, seismic studies, other surveys and unsuccessful
wells) was flat at Rs32cr (Rs31cr) in 4QFY2010.
Interest expenditure registered significant growth, other income declines: Interest
expenditure during the quarter grew significantly to Rs49cr as against Rs1cr in
1QFY2010 and Rs2cr in 4QFY2010. The increase could be attributed to
capitalisation of debt related to pipeline and newly commissioned fields. Other
income declined by 68.1% yoy to Rs28cr (Rs88cr in 4QFY2010) as during
4QFY2010 other income included forex gains.
Adjusted PAT increases 34.5%: Total tax during the quarter came in higher at
Rs105cr as against negative tax charge of Rs21cr in 1QFY2010. On account of
robust top-line growth, OPM expansion during the quarter and extra-ordinary
expenditure during 1QFY2010, PAT surged 519.3% yoy to Rs281cr (Rs45cr) during
1QFY2011, which was below our expectation of Rs317cr. Adjusted for the
extra-ordinary item of Rs164cr during 1QFY2010, bottom-line registered 34.5%
yoy growth.
July 29, 2010 4
5. Cairn India |1QFY2011 Result Update
Exhibit 7: PAT growth trend
500 1,000.0
933.0
400 800.0
600.0
300
(Rs cr)
(%)
400.0
200
143.3 200.0
14.8
100 (38.0) (15.7) -
- (200.0)
1QFY10 2QFY10 3QFY10 4QFY10 1QFY11
PAT PAT growth (RHS)
Source: Company, Angel Research
Production Block Highlights
Ravva block: Average gross production at the Ravva field for 1QFY2011 stood
at 37,043boepd (comprising average oil production of 28,871bopd and
average gas production of 49mnscfd). Originally estimated to produce
101mnbbl of crude oil, the field has till date produced close to 225mnbbl of
crude oil. Following the company’s comprehensive assessment of the
remaining potential, the gross proved plus probable (2P) reserve estimates of
the Ravva field increased by 20% to 72mnboe from 60mnboe in FY2009.
CB/OS-2 Block: Average gross production from the CB/OS-2 block for
1QFY2011 stood at 13,527boepd (comprising average oil/condensate
production of 8,229bopd and average gas production of 32mmscfd).
Exploration Highlights
Rajasthan Exploration portfolio now consists of a most-likely risked mean
estimate of 2.5bnboe. In the RJ-ON-90/1 block, results of the successful
Tukaram 2 and Tukaram SE-1 wells drilled in 1QCY2010, both of which
encountered oil and gas, are under review.
CIL made two successful bids in the NELP VIII licensing round and was
awarded the KG-OSN-2009/3 and MB-DWN-2009/1 blocks. The PSCs for
these blocks were signed on June 30, 2010. The PSCs are expected to
become effective in the next couple of months, once the petroleum exploration
licences are issued.
Apart from these blocks, CIL currently has exploration interests in five blocks in
India and one in Sri Lanka, three of which are operated by the company.
Of these five Indian blocks, the northern area of the KG-DWN-98/2 (Cairn
India - 10%, ONGC is the operator) is now at appraisal phase following
completion of the exploration period. The second and third appraisal wells are
currently being drilled.
Drilling of the five exploration wells in KG-ONN-2003/1 (CIL - 49%, operator)
commenced in 1QCY2010. The second well, Daliparu-1- commenced drilling
in March 2010 immediately followed by drilling at the third well, Lankepalli-1.
July 29, 2010 5
6. Cairn India |1QFY2011 Result Update
Gas shows were observed during drilling and all the three wells have been
plugged and abandoned. The other commitment wells, Krishna-1 and
Nagalyanka-1, are currently being drilled, which would be completed by early
3QCY2010.
In SL 2007-01-001, Cairn Lanka Private Limited, the wholly-owned subsidiary
of CIL, is currently processing the 1750 km2 3D seismic data, with data
completion expected over the next few months. A detailed Metocean study is
ongoing in preparation for exploration drilling of three wells planned to
commence in 2QCY2011.
Processing of 4D seismic data in Ravva is currently underway, which would
help identify bypassed oil zones and potentially new targets for infill drilling.
Upstream Development Highlights
Development drilling and well completion activities are progressing with three
drilling rigs and one completion rig operating in the Mangala development
area.
Till date, 81 development wells have been drilled, of which 65 wells have
been completed and are ready for initial production. Currently, 30 Mangala
wells are producing over 1,00,000bpd of crude oil.
CIL sold 2.7mnbbl (production of around 4mnbbls) to MRPL and private
finance during the quarter. This excludes the 1.1mnbbl, which is there in the
pipeline and therefore not included as a part of sales and the balance 0.2 was
actually inventory.
The Raageshwari gas terminal, the Thumbli water field (saline aquifer) and the
captive power plant at MPT have been commissioned and are operational.
First phase of the EOR pilot consisting four injectors and one producer has
been drilled, with production and water injection in the pilot likely to start this
year, followed by polymer and alkali surfactant polymer injection. If the trials
are successful, then the company plans to implement chemical flooding on a
field scale in Mangala, followed by Bhagyam and Aishwariya.
To date, more than seven million barrels of crude from Mangala have been
delivered to the refiners.
After the success of the first horizontal well at Mangala, which tested at an oil
production rate of more than 11,500bopd, CIL successfully drilled and
completed eight more horizontal wells in Mangala. Six horizontal wells have
been put on production. Water injection has started and will be further
ramped up in the coming months.
Train-II and III were commissioned in May and June 2010, respectively, with a
capacity to process 1,00,000bopd of crude oil. Total processing capacity now
stands at 130,000bopd. Train-I, II and III are handling Mangala production,
which currently stands over 1,00,000bopd.
Sales arrangements are now in place for 143,000bopd of crude oil, with four
refineries. Discussions are in progress with the Government of India to allow
access to more refining capacity by allowing sales to special economic zones
(SEZs) and to the overseas refineries. Following completion of the pipeline and
related facilities, sales to both the public and private refiners are expected to
ramp up to the currently approved plateau of 125,000bopd in 2HCY2010.
July 29, 2010 6
7. Cairn India |1QFY2011 Result Update
Mid-stream Development Highlights
Of the total length (670km) of the MPT to the Bhogat pipeline, which passes
through Rajasthan and Gujarat, MPT to the Salaya section (length of 590km)
is now operational along with the final delivery infrastructure to each buyer.
Pipeline sales started to private refiners in June 2010 and to IOC in July 2010.
Approvals for the Salaya to Bhogat section have been obtained and the
necessary land purchase has been completed. The contracting process is well
underway with some key contracts already placed. Bhogat lies on the Gujarat
coast and provides further flexibility with respect to future off-take in volumes.
July 29, 2010 7
8. Cairn India |1QFY2011 Result Update
Investment Arguments
Subdued outlook on crude impinging valuation: CIL is the only proxy play on
crude oil prices amongst the listed E&P companies in India, and its stock has seen
a strong correlation with the crude oil prices. Compared to the other majors in the
segment, viz. ONGC, OIL India and RIL, CIL has the highest leverage to crude oil
prices. ONGC and OIL India have to bear the subsidy burden, which weakens
their correlation with the crude oil prices. In case of RIL, its upstream revenues
would largely accrue from gas sales going ahead. Thus, CIL is a proxy play on
medium-term crude oil prices, especially considering the fact that the commodities
market in India does not provide long-term futures contract for crude oil. Thus, for
an investor betting on increase/decrease in crude oil prices in the long run, CIL is
an appropriate proxy play on the same.
Given our subdued outlook on oil prices going ahead, we expect CIL's stock to
underperform the benchmark indices. Our long-term crude oil estimates are
pegged at US $75/bbl (FY2012 onwards). We believe that this will be sufficient to
incentivise production from costlier sources such as deepwater fields. Ceteris
paribus, CIL's current market price of Rs334/share discounts crude oil price of US
$79.1/bbl, which we believe is fair and leaves no margin of safety for investors.
Attractive exploratory portfolio though too early to factor in: Any success in CIL’s
exploratory portfolio beyond Rajasthan is likely to re-rate the stock. The stock is
currently discounting high exploratory success rate of 17.6%. We, however, believe
that any meaningful exploratory success is sometime away, as CIL's exploratory
portfolio comprises assets at early stages of exploration. For valuing the
exploratory upside, we have factored in a probable success ratio of 13.4% of CIL's
net un-risked prospective resources of 3,985mnboe.
Enhanced oil recovery (EOR) opportunity captured in valuation: Given the scale,
EOR at MBA fields could be a challenging task as it is one of the largest field-wise
EOR implementation across the globe. We have factored in EOR recovery rate of
15% for the MBA fields. However, even if there is any improvement in the EOR rate
going ahead, we expect CIL to register limited benefits due to the high costs
involved and back-ended nature of EOR volumes.
Outlook and Valuation
Development work at the Rajasthan block is progressing well, with production from
Train-I, II and III and pipeline for crude evacuation already started, while Train-IV
and the marine facility is likely to be commissioned in CY2011. Development work
undertaken by the company points towards its superior execution skills. CIL has
already tied up volumes of 1,43,000bpd with four buyers, viz. RIL, IOC, Essar and
MRPL, which puts to rest concerns about users of the waxy crude produced from
the Rajasthan field.
In the absence of any major discoveries and the company’s focus on development
of the Rajasthan block, CIL’s stock price is likely to be driven by the direction of
crude oil prices, news flow associated with developmental status and ramp up of
sales. In the past, the CIL stock has demonstrated strong correlation with the crude
oil prices, which we expect will continue going ahead. Thus, in spite of our
subdued outlook on oil prices, we believe the stock will be affected by positive
July 29, 2010 8
9. Cairn India |1QFY2011 Result Update
developmental updates from the Rajasthan block. Given the expected ramp up in
production, the earnings-based valuation will increasingly provide a downward
support to our valuations.
We have calculated CIL's NAV by estimating cash flows on asset-by-asset basis,
with associated assumptions for production profile, oil/gas pricing, royalty/cess,
opex and fiscal terms. Our NAV calculation is based on long-term crude oil price
of US $75/bbl, whereas the current stock price is discounting long-term average
crude price of US $79.1/bbl. On account of recent run up in stock price, we
recommend Reduce (Neutral earlier) rating on the stock.
Exhibit 8: SOTP Valuation Summary
Particulars (Rs cr) FY2011E FY2012E
Rajasthan Block
RJ-ON-90/1 (MBA block) 36,437 38,617
Value per share 192 204
RJ-ON-90/1 (MBA EOR) 5,412 6,062
Value per share 29 32
RJ-ON-90/1 (Barmer Hill) 2,525 2,696
Value per share 13 14
RJ-ON-90/1 (Southern fields) 505 539
Value per share 3 3
RJ-ON-90/1 (Other fields) 4,196 4,480
Value per share 22 24
Value of Rajasthan Block 49,075 52,394
Value per share 259 276
CB-OS-2 594 413
Value per share 3 2
Ravva 1,830 1,653
Value per share 10 9
Upside potential (KG-DWN-98/2) 302 331
Value per share 2 2
Exploratory portfolio upsides 6,231 6,828
Value per share 33 36
Total Asset Value 58,032 61,618
Less: Corporate expenditure 2,333 2,243
Value per share 12 12
Less: Net debt (148) (288)
Value per share (1) (2)
Equity value 55,847 59,663
Equity shares (mn) 190 190
Equity value per share 294 315
Source: Company, Angel Research
July 29, 2010 9
15. Cairn India |1QFY2011 Result Update
Research Team Tel: 022 - 4040 3800 E-mail: research@angeltrade.com Website: www.angeltrade.com
Disclaimer
This document is solely for the personal information of the recipient, and must not be singularly used as the basis of any investment
decision. Nothing in this document should be construed as investment or financial advice. Each recipient of this document should make
such investigations as they deem necessary to arrive at an independent evaluation of an investment in the securities of the companies
referred to in this document (including the merits and risks involved), and should consult their own advisors to determine the merits and
risks of such an investment.
Angel Broking Limited, its affiliates, directors, its proprietary trading and investment businesses may, from time to time, make
investment decisions that are inconsistent with or contradictory to the recommendations expressed herein. The views contained in this
document are those of the analyst, and the company may or may not subscribe to all the views expressed within.
Reports based on technical and derivative analysis center on studying charts of a stock's price movement, outstanding positions and
trading volume, as opposed to focusing on a company's fundamentals and, as such, may not match with a report on a company's
fundamentals.
The information in this document has been printed on the basis of publicly available information, internal data and other reliable
sources believed to be true, but we do not represent that it is accurate or complete and it should not be relied on as such, as this
document is for general guidance only. Angel Broking Limited or any of its affiliates/ group companies shall not be in any way
responsible for any loss or damage that may arise to any person from any inadvertent error in the information contained in this report.
Angel Broking Limited has not independently verified all the information contained within this document. Accordingly, we cannot testify,
nor make any representation or warranty, express or implied, to the accuracy, contents or data contained within this document. While
Angel Broking Limited endeavours to update on a reasonable basis the information discussed in this material, there may be regulatory,
compliance, or other reasons that prevent us from doing so.
This document is being supplied to you solely for your information, and its contents, information or data may not be reproduced,
redistributed or passed on, directly or indirectly.
Angel Broking Limited and its affiliates may seek to provide or have engaged in providing corporate finance, investment banking or
other advisory services in a merger or specific transaction to the companies referred to in this report, as on the date of this report or in
the past.
Neither Angel Broking Limited, nor its directors, employees or affiliates shall be liable for any loss or damage that may arise from or in
connection with the use of this information.
Note: Please refer to the important `Stock Holding Disclosure' report on the Angel website (Research Section). Also, please refer to the
latest update on respective stocks for the disclosure status in respect of those stocks. Angel Broking Limited and its affiliates may have
investment positions in the stocks recommended in this report.
Disclosure of Interest Statement Cairn India
1. Analyst ownership of the stock No
2. Angel and its Group companies ownership of the stock No
3. Angel and its Group companies' Directors ownership of the stock No
4. Broking relationship with company covered No
Note: We have not considered any Exposure below Rs 1 lakh for Angel, its Group companies and Directors.
Ratings (Returns) : Buy (> 15%) Accumulate (5% to 15%) Neutral (-5 to 5%)
Reduce (-5% to 15%) Sell (< -15%)
July 29, 2010 15