1. 4QFY2010 Result Update I Mining
April 20, 2010
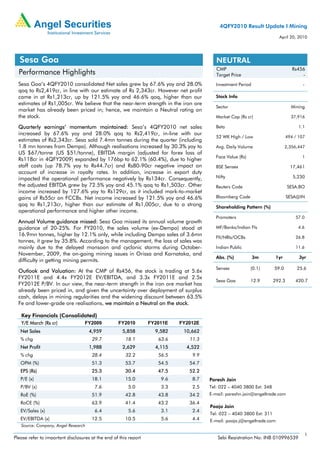
Sesa Goa NEUTRAL
CMP Rs456
Performance Highlights Target Price -
Sesa Goa’s 4QFY2010 consolidated Net sales grew by 67.6% yoy and 28.0% Investment Period -
qoq to Rs2,419cr, in line with our estimate of Rs 2,343cr. However net profit
came in at Rs1,213cr, up by 121.5% yoy and 46.6% qoq, higher than our Stock Info
estimates of Rs1,005cr. We believe that the near-term strength in the iron ore
Sector Mining
market has already been priced in; hence, we maintain a Neutral rating on
the stock. Market Cap (Rs cr) 37,916
Quarterly earnings’ momentum maintained: Sesa’s 4QFY2010 net sales Beta 1.1
increased by 67.6% yoy and 28.0% qoq to Rs2,419cr, in-line with our
52 WK High / Low 494 / 107
estimates of Rs2,343cr. Sesa sold 7.4mn tonnes during the quarter (including
1.8 mn tonnes from Dempo). Although realisations increased by 30.3% yoy to Avg. Daily Volume 2,356,447
US $67/tonne (US $51/tonne), EBITDA margin (adjusted for forex loss of
Face Value (Rs) 1
Rs118cr in 4QFY2009) expanded by 176bp to 62.1% (60.4%), due to higher
staff costs (up 78.7% yoy to Rs44.7cr) and Rs80-90cr negative impact on BSE Sensex 17,461
account of increase in royalty rates. In addition, increase in export duty
impacted the operational performance negatively by Rs134cr. Consequently, Nifty 5,230
the adjusted EBITDA grew by 72.5% yoy and 45.1% qoq to Rs1,503cr. Other Reuters Code SESA.BO
income increased by 127.6% yoy to Rs129cr, as it included mark-to-market
gains of Rs55cr on FCCBs. Net income increased by 121.5% yoy and 46.6% Bloomberg Code SESA@IN
qoq to Rs1,213cr, higher than our estimate of Rs1,005cr, due to a strong Shareholding Pattern (%)
operational performance and higher other income.
Promoters 57.0
Annual Volume guidance missed: Sesa Goa missed its annual volume growth
guidance of 20-25%. For FY2010, the sales volume (ex-Dempo) stood at MF/Banks/Indian FIs 4.6
16.9mn tonnes, higher by 12.1% only, while including Dempo sales of 3.6mn FII/NRIs/OCBs 26.8
tonnes, it grew by 35.8%. According to the management, the loss of sales was
mainly due to the delayed monsoon and cyclonic storms during October- Indian Public 11.6
November, 2009, the on-going mining issues in Orissa and Karnataka, and
Abs. (%) 3m 1yr 3yr
difficulty in getting mining permits.
Sensex (0.1) 59.0 25.6
Outlook and Valuation: At the CMP of Rs456, the stock is trading at 5.6x
FY2011E and 4.4x FY2012E EV/EBITDA, and 3.3x FY2011E and 2.5x
Sesa Goa 12.9 292.3 420.7
FY2012E P/BV. In our view, the near-term strength in the iron ore market has
already been priced in, and given the uncertainty over deployment of surplus
cash, delays in mining regularities and the widening discount between 63.5%
Fe and lower-grade ore realisations, we maintain a Neutral on the stock.
Key Financials (Consolidated)
Y/E March (Rs cr) FY2009 FY2010 FY2011E FY2012E
Net Sales 4,959 5,858 9,582 10,662
% chg 29.7 18.1 63.6 11.3
Net Profit 1,988 2,629 4,115 4,522
% chg 28.4 32.2 56.5 9.9
OPM (%) 51.3 53.7 54.5 54.7
EPS (Rs) 25.3 30.4 47.5 52.2
P/E (x) 18.1 15.0 9.6 8.7 Paresh Jain
P/BV (x) 7.6 5.0 3.3 2.5 Tel: 022 – 4040 3800 Ext: 348
RoE (%) 51.9 42.8 43.8 34.2 E-mail: pareshn.jain@angeltrade.com
RoCE (%) 63.9 41.4 43.2 36.4
Pooja Jain
EV/Sales (x) 6.4 5.6 3.1 2.4
Tel: 022 – 4040 3800 Ext: 311
EV/EBITDA (x) 12.5 10.5 5.6 4.4 E-mail: pooja.j@angeltrade.com
Source: Company, Angel Research
1
Please refer to important disclosures at the end of this report Sebi Registration No: INB 010996539
2. Sesa Goa I 4QFY2010 Result Update
Exhibit 1: 4QFY2010 Performance (Consolidated)
(All values in Rs cr) 4QFY10 4QFY09 YoY% FY10 FY09 YoY%
Net Sales 2,419 1,444 67.6 5,858 4,959 18.1
Raw Material 186 208 (10.5) 534 494 8.1
% of Net sales 7.7 14.4 9.1 10.1
Consumption of Stores 69 55 25.8 244 178 36.7
% of Net sales 2.8 3.8 4.2 3.6
Staff Cost 45 25 78.7 169 77 119.8
% of Net sales 1.8 1.7 2.9 2.0
Export Duty 121 (13) - 148 216 (31.6)
% of Net sales 5.0 (0.9) 2.5 4.3
Other Expenditure 495 415 19.2 1,639 1,446 13.4
% of Net sales 20.5 28.8 28.0 29.2
Total Expenditure 916 690 32.7 2,713 2,417 12.3
% of Net sales 37.9 47.8 46.3 48.8
EBITDA 1,503 754 99.5 3,145 2,542 23.7
% of Net sales 62.1 52.2 53.7 51.3
Interest 23 1 2,960.8 52 4 1,111.2
Depreciation 17 15 10.7 75 52 44.2
Other Income 129 57 127.6 426 224 90.1
Exceptional Items - - - -
Profit before Tax 1,593 794 100.5 3,445 2,710 27.1
% of Net sales 65.8 55.0 58.8 54.7
Tax 378 246 53.5 806 715 12.6
% of PBT 23.7 31.0 23.4 26.4
Profit After tax 1,213 548 121.5 2,629 1,988 32.2
% of Net sales 50.1 37.9 44.9 40.1
EPS (Rs) 14.0 7.0 101.4 30.4 25.3 20.3
Source: Company, Angel Research
Other key Concall takeaways
• Total reserves and resources as on March 31, 2010 stood at 353mn tonnes
(including 70mn tonnes from the Dempo acquisition), as against 240mn tonnes
in FY2009. Thus, the net addition for FY2010 was 43mn tonnes, of which a
significant quantity came from Dempo mines.
• The management indicated that there is no confirmed news about China’s ban
on low-grade ore imports by traders. Sesa sells less than 25% of its iron ore
quantity below 60% Fe content through traders.
• The management indicated that the spot iron ore prices for 58% Fe content is
US $126/tonne.
• In 4QFY10, Goa sales accounted for nearly 83.8% of the total volumes, the
balance was sold from Karnataka and Orissa. The spot:contract mix for FY2010
was 80:20.
• The tax rate was lower as some units in Goa availed tax benefits. The
management indicated that the Export Oriented Unit (EOU) status is valid up till
FY2011E and guided for a tax rate of 23-24% for FY2011E.
• The long-term agreement for the Orissa mines is yet to be finalised.
• Cash and Cash equivalents stood at Rs6,952cr, which excludes the loan of
Rs1,000cr given to Vedanta Aluminium.
April 20, 2010 2
3. Sesa Goa I 4QFY2010 Result Update
Outlook and Valuation
At the CMP of Rs456, the stock is trading at 5.6x FY2011E and 4.4x FY2012E
EV/EBITDA, and 3.3x FY2011E and 2.5x FY2012E P/BV. 4QFY2010 saw a structural
shift in the benchmark contract system, with global miners reportedly signing
contracts on a quarterly basis. We believe that the new pricing mechanism is likely to
help miners in fetching better realisations. However, in our view, the near-term
strength in the iron ore market has already been priced in, and given the uncertainty
over deployment of surplus cash, delays in mining regularities and the widening
discount between 63.5% Fe and lower-grade ore realisations, we maintain a Neutral
on the stock.
Exhibit 2: 1-year forward EV/EBITDA band
(Rs mn)
800 ,000
700,000 13x
600,000
10x
500,000
400,000 7x
300 ,000
200,000 4x
100,000
1x
0
Apr-02 Apr-03 Apr-04 Apr-05 Apr-06 Apr-07 Apr-08 Apr-09 Apr-10
Source: Bloomberg, Angel Research
Exhibit 3: 1-year forward P/E band
(Rs)
800
15x
700
600
11x
500
400
7x
300
200
3x
100
0
Apr-02 Apr-03 Apr-04 Apr-05 Apr-06 Apr-07 Apr-08 Apr-09 Apr-10
Source: Bloomberg, Angel Research
April 20, 2010 3
4. Sesa Goa I 4QFY2010 Result Update
Exhibit 4: 1-year forward P/BV band
(Rs)
600
4x
500
400 3x
300 2x
200
1x
100
0
Apr-02 Apr-03 Apr-04 Apr-05 Apr-06 Apr-07 Apr-08 Apr-09 Apr-10
Source: Bloomberg, Angel Research
Exhibit 5: Spot iron ore prices
Source: Bloomberg, Angel Research
Exhibit 6: Monthly iron ore production in China
Source: Bloomberg, Angel Research
April 20, 2010 4
5. Sesa Goa I 4QFY2010 Result Update
Exhibit 7: Monthly iron ore imports in China
Source: Bloomberg, Angel Research
April 20, 2010 5
9. Sesa Goa I 4QFY2010 Result Update
Research Team Tel: 022-4040 3800 E-mail: research@angeltrade.com Website: www.angeltrade.com
DISCLAIMER
This document is solely for the personal information of the recipient, and must not be singularly used as the basis of any investment decision. Nothing in this
document should be construed as investment or financial advice. Each recipient of this document should make such investigations as they deem necessary to
arrive at an independent evaluation of an investment in the securities of the companies referred to in this document (including the merits and risks involved),
and should consult their own advisors to determine the merits and risks of such an investment.
Angel Securities Limited, its affiliates, directors, its proprietary trading and investment businesses may, from time to time, make investment decisions that are
inconsistent with or contradictory to the recommendations expressed herein. The views contained in this document are those of the analyst, and the company
may or may not subscribe to all the views expressed within.
Reports based on technical and derivative analysis center on studying charts of a stock's price movement, outstanding positions and trading volume, as
opposed to focusing on a company's fundamentals and, as such, may not match with a report on a company's fundamentals.
The information in this document has been printed on the basis of publicly available information, internal data and other reliable sources believed to be true,
and is for general guidance only. Angel Securities Limited has not independently verified all the information contained within this document. Accordingly, we
cannot testify, nor make any representation or warranty, express or implied, to the accuracy, contents or data contained within this document. While Angel
Securities Limited endeavours to update on a reasonable basis the information discussed in this material, there may be regulatory, compliance, or other
reasons that prevent us from doing so.
This document is being supplied to you solely for your information, and its contents, information or data may not be reproduced, redistributed or passed on,
directly or indirectly.
Angel Securities Limited and its affiliates may seek to provide or have engaged in providing corporate finance, investment banking or other advisory services
in a merger or specific transaction to the companies referred to in this report, as on the date of this report or in the past.
Neither Angel Securities Limited, nor its directors, employees or affiliates shall be liable for any loss or damage that may arise from or in connection with the
use of this information.
Note: Please refer to the important `Stock Holding Disclosure' report on the Angel website (Research Section).
Disclosure of Interest Statement Sesa Goa
1. Analyst ownership of the stock No
2. Angel and its Group companies ownership of the stock Yes
3. Angel and its Group companies’ Directors ownership of the stock No
4. Broking relationship with company covered No
Note: We have not considered any Exposure below Rs 1 lakh for Angel and its Group companies.
Address: Acme Plaza, ‘A’ Wing, 3rd Floor, M.V. Road, Opp. Sangam Cinema, Andheri (E), Mumbai - 400 059.
Tel : (022) 3952 4568 / 4040 3800
Angel Broking Ltd: BSE Sebi Regn No : INB 010996539 / CDSL Regn No: IN - DP - CDSL - 234 - 2004 / PMS Regn Code: PM/INP000001546 Angel Securities Ltd:BSE: INB010994639/INF010994639 NSE:
INB230994635/INF230994635 Membership numbers: BSE 028/NSE:09946
Angel Capital & Debt Market Ltd: INB 231279838 / NSE FNO: INF 231279838 / NSE Member code -12798 Angel Commodities Broking (P) Ltd: MCX Member ID: 12685 / FMC Regn No: MCX / TCM /
CORP / 0037 NCDEX : Member ID 00220 / FMC Regn No: NCDEX / TCM / CORP / 0302
April 20, 2010 9