Solution Manual for Principles of Corporate Finance 14th Edition by Richard B...
Market outlook 20.10.10
1. Market Outlook
India Research
October 20, 2010
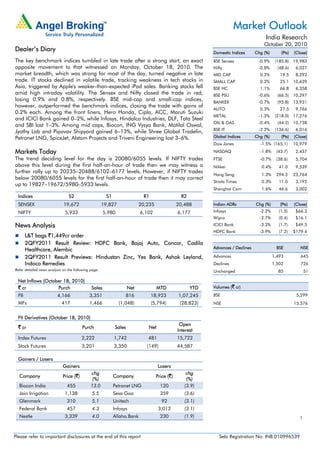
Dealer’s Diary Domestic Indices Chg (%) (Pts) (Close)
The key benchmark indices tumbled in late trade after a strong start, an exact BSE Sensex -0.9% (185.8) 19,983
opposite movement to that witnessed on Monday, October 18, 2010. The Nifty -0.8% (48.6) 6,027
market breadth, which was strong for most of the day, turned negative in late MID CAP 0.2% 19.5 8,292
trade. IT stocks declined in volatile trade, tracking weakness in tech stocks in SMALL CAP 0.2% 25.1 10,639
Asia, triggered by Apple's weaker-than-expected iPad sales. Banking stocks fell BSE HC 1.1% 66.8 6,358
amid high intraday volatility. The Sensex and Nifty closed the trade in red, BSE PSU -0.6% (66.5) 10,297
losing 0.9% and 0.8%, respectively. BSE mid-cap and small-cap indices, BANKEX -0.7% (95.8) 13,931
however, outperformed the benchmark indices, closing the trade with gains of
AUTO 0.3% 27.5 9,766
0.2% each. Among the front liners, Hero Honda, Cipla, ACC, Maruti Suzuki
METAL -1.3% (218.0) 17,276
and ICICI Bank gained 0–2%, while Infosys, Hindalco Industries, DLF, Tata Steel
OIL & GAS -0.4% (44.2) 10,738
and SBI lost 1–3%. Among mid caps, Biocon, ING Vysya Bank, Motilal Oswal,
BSE IT -2.2% (136.6) 6,016
Jyothy Lab and Pipavav Shipyard gained 6–13%, while Shree Global Tradefin,
Petronet LNG, SpiceJet, Alstom Projects and Triveni Engineering lost 3–6%. Global Indices Chg (%) (Pts) (Close)
Dow Jones -1.5% (165.1) 10,979
Markets Today NASDAQ -1.8% (43.7) 2,437
The trend deciding level for the day is 20080/6055 levels. If NIFTY trades FTSE -0.7% (38.6) 5,704
above this level during the first half-an-hour of trade then we may witness a Nikkei 0.4% 41.0 9,539
further rally up to 20235–20488/6102–6177 levels. However, if NIFTY trades
Hang Seng 1.3% 294.3 23,764
below 20080/6055 levels for the first half-an-hour of trade then it may correct
Straits Times 0.3% 11.0 3,192
up to 19827–19672/5980–5933 levels.
Shanghai Com 1.6% 46.6 3,002
Indices S2 S1 R1 R2
SENSEX 19,672 19,827 20,235 20,488 Indian ADRs Chg (%) (Pts) (Close)
NIFTY 5,933 5,980 6,102 6,177 Infosys -2.2% (1.5) $66.3
Wipro -2.7% (0.4) $16.1
News Analysis ICICI Bank -3.3% (1.7) $49.5
HDFC Bank -3.9% (7.2) $179.4
L&T bags `1,449cr order
2QFY2011 Result Review: HDFC Bank, Bajaj Auto, Concor, Cadila
Healthcare, Alembic Advances / Declines BSE NSE
2QFY2011 Result Previews: Hindustan Zinc, Yes Bank, Ashok Leyland, Advances 1,493 645
Indoco Remedies Declines 1,502 726
Refer detailed news analysis on the following page. Unchanged 85 51
Net Inflows (October 18, 2010)
` cr Purch Sales Net MTD YTD Volumes (` cr)
FII 4,166 3,351 816 18,923 1,07,245 BSE 5,299
MFs 417 1,466 (1,048) (5,794) (28,823) NSE 15,576
FII Derivatives (October 18, 2010)
Open
` cr Purch Sales Net
Interest
Index Futures 2,222 1,742 481 15,722
Stock Futures 3,201 3,350 (149) 44,587
Gainers / Losers
Gainers Losers
chg chg
Company Price (`) Company Price (`)
(%) (%)
Biocon India 455 13.0 Petronet LNG 120 (3.9)
Jain Irrigation 1,138 5.5 Sesa Goa 359 (3.6)
Glenmark 310 5.1 Unitech 92 (3.1)
Federal Bank 457 4.3 Infosys 3,012 (3.1)
Nestle 3,339 4.0 Allaha.Bank 230 (1.9) 1
Please refer to important disclosures at the end of this report Sebi Registration No: INB 010996539
2. Market Outlook | India Research
L&T bags `1,449cr order
Larsen & Toubro (L&T) has bagged an order valued at `1,449cr from DB Power Limited,
promoted by the Bhaskar Group. L&T will execute the complete Balance of Plant (BOP)
package for DB Power’s 2x600MW thermal power plant at Baradarha, Chhattisgarh. The
entire plant will be commissioned within 31 months. L&T is one of the few companies to
bag consistent orders in the recent times, especially in the power space. At `1,994 –
FY2012E P/E of 28.4x and FY2012E P/BV of 4.9x on standalone basis – we believe that
most of the positives are factored in and, hence, maintain our Neutral rating on the stock.
We have used the sum-of-the-parts (SOTP) methodology to value the company to capture
all its business initiatives and investments/stakes in the different businesses and have
arrived at a Target Price of `2,024.
Result Review – 2QFY2011
HDFC Bank
HDFC Bank announced its 2QFY2011 results. The bank registered net profit growth of
32.7% yoy to `912cr, in line with our estimates of `908cr. Advances grew by a healthy
6.4% sequentially compared to marginal industry growth of ~0.6%. Deposits increased by
6.7% sequentially compared to ~1.6% industry growth. Adjusting for one-off movements
in wholesale loans, core growth in advances stood at ~32% yoy. Retail loans grew by a
healthy 30.8% yoy, constituting 51.7% of gross advances. The bank registered strong
expansion in its balance sheet, while improving the CASA ratio to 50.6% and maintaining
the NIMs at 4.2%. This is in line with our expectations that strong capital adequacy and
branch expansion will increasingly drive market share gains in credit as well as CASA for
the bank in the coming quarters. Moreover, asset quality remained stable sequentially and
was materially better than the year-ago numbers (reflected in the decline in provisions to
avg. assets from 1.1% in FY2010 to 0.7% in 2QFY2011).
During the quarter, NII increased by 29.2% yoy and 5.2% qoq to `2,526cr. Fee income
grew by a moderate 16% yoy to `857cr. The cost-to-income ratio stood at 48.2%, in line
with its eight-quarter average of 48.6%. Gross NPAs increased by 2.8% sequentially to
`1,841cr. Net NPAs stood at `409cr compared to `413cr in 1QFY2011. Gross and net
NPA ratios of the bank stood at 1.16% (1.21% in 1QFY2011) and 0.3% (0.30% in
1QFY2011), respectively, implying a healthy provision coverage ratio of 77.8%, excluding
technical write-offs. The bank’s CAR continued to be healthy at 17.0%, with tier-I at 12.7%.
At the CMP, the stock is trading at 3.8x FY2012E ABV, which is close to our target multiple
of 4.0x (benchmarked at a 30% premium to our Sensex target multiple). We maintain an
Accumulate recommendation on the stock with Target Price of `2,514.
October 20, 2010 2
3. Market Outlook | India Research
Bajaj Auto
Bajaj Auto (BAL) reported 50.4% yoy top-line growth to `4,342cr, which was above our
expectation of `4,212cr. Growth was largely aided by ~46% yoy jump in volumes. The
top-line performance was also aided by ~71% increase in other operating income at
`161cr (`94.3cr in 2QFY2010). Favourable product mix helped the company to register
~3% yoy increase in average net realisation at `41,786.
On the operating front, EBITDA margins were 66bp ahead of our estimate at 20.7%, a
jump of 69bp qoq and a fall of 138bp yoy. Raw-material cost for the quarter increased by
almost 490bp yoy, while it declined by 110bp on a qoq basis. Richer product mix along
with higher commercial vehicle volumes supported the company to report sequential
improvement at the operating front. Further, improved operating leverage helped the
company to save on staff cost and other fixed expenditure, which restricted the contraction
in EBITDA margins yoy to a certain extent. Net profit grew 69.3% yoy to `682cr (`403cr in
2QFY2010), as against our estimate of `644cr, largely aided by improved operating
performance and higher other income. Other income for the quarter increased to `83.7cr
(`21.7cr in 2QFY2010).
At current levels, the stock is trading at 19x FY2011E and 16x FY2012E earnings. We
maintain our positive outlook on the company. However, due to the recent run-up in the
stock price, we recommend a Neutral view to the stock, as we believe most of the positive
news flow is already factored in. At present, our fair value for the stock works out to be
`1,603. We would release a detailed result update post the earnings conference call with
the management.
Container Corporation
Container Corporation (Concor) reported its 2QFY2011 results, which were above our
expectations on account of better Exim performance. The company reported a 1.6% yoy
decline in total revenue to `944cr, against our estimate of `891cr. There was moderate
decline of 5.2% yoy in the company’s Exim revenue to `733cr, which came in as a positive
surprise as volumes at JNPT were impacted on account of shutdown of operations for five
days in August and prolonged monsoon. Domestic revenue grew by 13.1% yoy to `211cr,
above our expectation. We were positively surprised by higher EBIDTA margin, which came
in much above our estimate (27.0%) at 27.7%. Margins of the Exim business grew by
150bp yoy and 90bp qoq to 28.5%. However, margins of the domestic segment declined
by 290bp yoy and 360bp qoq to 9.9%. Consequently, PAT grew by 1.2% yoy to `206.7cr,
which was above our estimate (`187cr). At the CMP of `1,292, Concor is trading at 17.8x
its FY2012E EPS and 3.2x P/BV on FY2012E. We maintain our Reduce rating on the stock
with a Target Price of `1,194. We will be releasing a detailed note after the conference call
today.
Cadila Healthcare
Cadila Healthcare (Cadila) reported 2QFY2011 results, which were ahead of our
estimates. Net sales came in at `1,106cr (`913cr), up 21.2% yoy, driven by US (up 40.8%
yoy, `226cr), domestic formulation (up 19.1% yoy, `440cr), Zydus Wellness (up 23% yoy,
`80cr) and Latin America (up 27% yoy, `58cr). The company reported gross margins of
68.0% (66.9%) on the back of favourable product mix. Employee expenses increased
22.8% yoy to `137cr (`111cr). Cadila reported OPM of 21.2% (18.9%), which was higher
than our estimates of 20.5%. Financial cost went down 30.5% yoy to `16.0cr (`23cr), while
depreciation cost remained flat at `30cr. Cadila reported net profit of `171cr (`132cr), up
29.5% yoy. The stock is trading at 22.2x FY2011E and 17.2x FY2012E earnings. We
maintain our Neutral view on the stock.
October 20, 2010 3
4. Market Outlook | India Research
Alembic
Alembic reported its 2QFY2011 results, which were ahead of our estimates. Net sales
came in at strong `363cr (`282cr), up 27.8% yoy, driven by the domestic formulation
business (up 27.3%, `207cr), domestic API business (up 126.7%, `55cr) and export
formulation (up 18.8%, `55cr) business; however, the export API business declined (down
10.7%, `45cr). The company reported gross margins of 51.5% (53.9%), primarily on
account of higher proportion of low-margin domestic API business (15.1% v/s 8.5%).
Employee expenses increased 19.6% yoy to `46cr (`39cr). Alembic reported OPM of
11.9% (11.9%), which was marginally lower than our estimates. Financial cost went down
26.3% yoy to `7cr (`9cr). Depreciation cost remained flat at `12cr. Alembic reported net
profit of `22cr (`13cr), up 64.3% yoy, driven by top-line growth and lower financial cost.
We recommend Accumulate on the stock with a Target Price of `74.
Result Previews – 2QFY2011
Hindustan Zinc
Hindustan Zinc is expected to announce its results. We expect the company’s top line to
grow by 14.5% to `2,049cr on account of higher zinc volumes. EBITDA margins are
expected to contract by 525bp to 53.2%. Consequently, net income is expected to increase
marginally by 3.3% to `966cr. We recommend a Neutral rating on the stock.
Yes Bank
Yes Bank is scheduled to announce its 2QFY2011 results. We expect the bank to report
robust NII growth of 75.9% yoy, driven by strong growth in advances, while the non-
interest income is expected to decline by 9.3% yoy. The cost-to-income ratio is expected to
deteriorate to 39.5% compared to 38.7% in 1QFY2011 and 36.9% in 2QFY2010 on
account of higher employee additions in 1QFY2011. The pre-provision profit of the bank
is expected to register healthy growth of 32.1% yoy. Net profit is expected to increase by
23.5% on a yoy basis to `138cr. At the CMP, the stock is trading at valuations of 2.8x
FY2012E ABV. We maintain our Neutral rating on the stock.
Ashok Leyland
Ashok Leyland is slated to announce its 2QFY2011 results. We expect the company’s top
line to grow by a substantial 62.2% yoy to `2,559cr on account of 72% yoy growth in
volumes and marginal increase in realisation. On the operating front, EBITDA margin is
expected to decline by 53bp yoy to 10% on account of increased raw-material cost.
However, the bottom line is expected to surge by 51.7% yoy to `134.4cr. The stock rating
is under review.
Indoco Remedies
Indoco Remedies is expected to report top-line growth of 17.9% to `113cr, driven by the
domestic and export segments. The domestic formulation segment is expected to grow by
17.5% to `78cr. The company's OPM is expected to expand by 260bp to 15.6%, driven by
top-line growth. As a result, net profit is expected to increase by 55.6% to `14.3cr. We
maintain Buy on the stock with a Target Price of `541.
October 20, 2010 4
5. Market Outlook | India Research
Economic and Political News
Domestic air passenger numbers drop 11.08%
TRAI regulation on unsolicited calls by October-end
India to step up asset sales in next six months as investor appetite grows
Corporate News
SBI grants highest ever loan of `300cr for dairy firms in Punjab
Videocon discovers Gas in another well in Mozambique
KAL Airways buys further 2.28% stake in SpiceJet
Havells enters new generation Electric Water Heaters business
Source: Economic Times, Business Standard, Business Line, Financial Express, Mint
Events for the day
Agro Tech Foods Results
Ashok Leyland Results
BASF India Results
Bombay Dyeing Results
Canara Bank Results
Ceat Results
Gujarat State Fertilizers Results
HCL Tech Results
Hindustan Zinc Results
Indiabulls Power Results
Indiabulls Real Estate Results
Indoco Remedies Results
Jubilant Organosys Results
Kotak Mahindra Bank Results
Lanco Industries Results
Mahindra Lifespace Developers Results
Pidilite Industries Results
Power Grid Corporation Results
VIP Industries Results
Yes Bank Results
October 20, 2010 5
6. Market Outlook | India Research
Research Team Tel: 022-4040 3800 E-mail: research@angeltrade.com Website: www.angeltrade.com
DISCLAIMER
This document is solely for the personal information of the recipient, and must not be singularly used as the basis of any investment
decision. Nothing in this document should be construed as investment or financial advice. Each recipient of this document should make
such investigations as they deem necessary to arrive at an independent evaluation of an investment in the securities of the companies
referred to in this document (including the merits and risks involved), and should consult their own advisors to determine the merits and
risks of such an investment.
Angel Broking Limited, its affiliates, directors, its proprietary trading and investment businesses may, from time to time, make investment
decisions that are inconsistent with or contradictory to the recommendations expressed herein. The views contained in this document are
those of the analyst, and the company may or may not subscribe to all the views expressed within.
Reports based on technical and derivative analysis center on studying charts of a stock's price movement, outstanding positions and
trading volume, as opposed to focusing on a company's fundamentals and, as such, may not match with a report on a company's
fundamentals.
The information in this document has been printed on the basis of publicly available information, internal data and other reliable sources
believed to be true, but we do not represent that it is accurate or complete and it should not be relied on as such, as this document is for
general guidance only. Angel Broking Limited or any of its affiliates/ group companies shall not be in any way responsible for any loss or
damage that may arise to any person from any inadvertent error in the information contained in this report. Angel Broking Limited has
not independently verified all the information contained within this document. Accordingly, we cannot testify, nor make any representation
or warranty, express or implied, to the accuracy, contents or data contained within this document. While Angel Broking Limited
endeavours to update on a reasonable basis the information discussed in this material, there may be regulatory, compliance, or other
reasons that prevent us from doing so.
This document is being supplied to you solely for your information, and its contents, information or data may not be reproduced,
redistributed or passed on, directly or indirectly.
Angel Broking Limited and its affiliates may seek to provide or have engaged in providing corporate finance, investment banking or other
advisory services in a merger or specific transaction to the companies referred to in this report, as on the date of this report or in the past.
Neither Angel Broking Limited, nor its directors, employees or affiliates shall be liable for any loss or damage that may arise from or in
connection with the use of this information.
Note: Please refer to the important `Stock Holding Disclosure' report on the Angel website (Research Section). Also, please refer to the
latest update on respective stocks for the disclosure status in respect of those stocks. Angel Broking Limited and its affiliates may have
investment positions in the stocks recommended in this report.
Address: Acme Plaza, ‘A’ Wing, 3rd Floor, M.V. Road, Opp. Sangam Cinema, Andheri (E), Mumbai - 400 059.
Tel : (022) 3952 4568 / 4040 3800
Angel Broking Ltd: BSE Sebi Regn No : INB 010996539 / CDSL Regn No: IN - DP - CDSL - 234 - 2004 / PMS Regn Code: PM/INP000001546
Angel Capital & Debt Market Ltd: INB 231279838 / NSE FNO: INF 231279838 / NSE Member code -12798 Angel Commodities Broking (P) Ltd: MCX Member ID: 12685 / FMC Regn No: MCX / TCM /
CORP / 0037 NCDEX : Member ID 00220 / FMC Regn No: NCDEX / TCM / CORP / 0302
October 20, 2010 6