Lundin Gold April 2024 Corporate Presentation v4.pdf
Godawari Power
1. 1QFY2011 Result Update | Steel
August 4, 2010
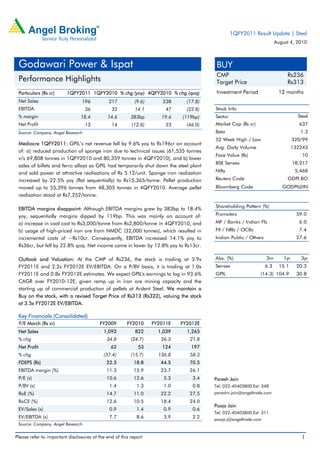
Godawari Power & Ispat BUY
CMP Rs236
Performance Highlights Target Price Rs313
Particulars (Rs cr) 1QFY2011 1QFY2010 % chg (yoy) 4QFY2010 % chg (qoq) Investment Period 12 months
Net Sales 196 217 (9.6) 238 (17.8)
EBITDA 36 32 14.1 47 (22.8) Stock Info
% margin 18.4 14.6 383bp 19.6 (119bp) Sector Steel
Net Profit 13 14 (12.8) 23 (46.0) Market Cap (Rs cr) 637
Source: Company, Angel Research Beta 1.3
52 Week High / Low 320/99
Mediocre 1QFY2011: GPIL’s net revenue fell by 9.6% yoy to Rs196cr on account
Avg. Daily Volume 132243
of: a) reduced production of sponge iron due to technical issues (61,535 tonnes
Face Value (Rs) 10
v/s 69,808 tonnes in 1QFY2010 and 80,359 tonnes in 4QFY2010), and b) lower
BSE Sensex 18,217
sales of billets and ferro alloys as GPIL had temporarily shut down the steel plant
and sold power at attractive realisations of Rs 5.12/unit. Sponge iron realisation Nifty 5,468
increased by 22.5% yoy (flat sequentially) to Rs15,365/tonne. Pellet production Reuters Code GDPI.BO
moved up to 55,396 tonnes from 48,305 tonnes in 4QFY2010. Average pellet Bloomberg Code GODPI@IN
realisation stood at Rs7,252/tonne.
Shareholding Pattern (%)
EBITDA margins disappoint: Although EBITDA margins grew by 383bp to 18.4%
yoy, sequentially margins dipped by 119bp. This was mainly on account of: Promoters 59.0
a) increase in coal cost to Rs3,000/tonne from Rs2,800/tonne in 4QFY2010, and MF / Banks / Indian Fls 6.0
b) usage of high-priced iron ore from NMDC (32,000 tonnes), which resulted in FII / NRIs / OCBs 7.4
incremental costs of ~Rs10cr. Consequently, EBITDA increased 14.1% yoy to Indian Public / Others 27.6
Rs36cr, but fell by 22.8% qoq. Net income came in lower by 12.8% yoy to Rs13cr.
Outlook and Valuation: At the CMP of Rs236, the stock is trading at 3.9x Abs. (%) 3m 1yr 3yr
FY2011E and 2.2x FY2012E EV/EBITDA. On a P/BV basis, it is trading at 1.0x Sensex 6.3 15.1 20.3
FY2011E and 0.8x FY2012E estimates. We expect GPIL's earnings to log in 93.6% GPIL (14.3) 104.9 30.8
CAGR over FY2010-12E, given ramp up in iron ore mining capacity and the
starting up of commercial production of pellets at Ardent Steel. We maintain a
Buy on the stock, with a revised Target Price of Rs313 (Rs322), valuing the stock
at 3.5x FY2012E EV/EBITDA.
Key Financials (Consolidated)
Y/E March (Rs cr) FY2009 FY2010 FY2011E FY2012E
Net Sales 1,092 822 1,039 1,265
% chg 34.8 (24.7) 26.3 21.8
Net Profit 62 53 124 197
% chg (37.4) (15.7) 136.8 58.3
FDEPS (Rs) 22.3 18.8 44.5 70.5
EBITDA margin (%) 11.3 15.9 23.7 26.1
P/E (x) 10.6 12.6 5.3 3.4 Paresh Jain
P/BV (x) 1.4 1.3 1.0 0.8 Tel: 022-40403800 Ext: 348
RoE (%) 14.7 11.0 22.2 27.5 pareshn.jain@angeltrade.com
RoCE (%) 12.6 10.5 18.4 24.0
Pooja Jain
EV/Sales (x) 0.9 1.4 0.9 0.6
Tel: 022-40403800 Ext: 311
EV/EBITDA (x) 7.7 8.6 3.9 2.2 pooja.j@angeltrade.com
Source: Company, Angel Research
Please refer to important disclosures at the end of this report 1
2. Godawari Power| 1QFY2011 Result Update
Exhibit 1: 1QFY2011 performance (Consolidated)
Y/E March (Rs cr) 1QFY11 1QFY10 yoy % FY10 FY09 yoy %
Net sales 196 217 (9.6) 822 1,092 (24.7)
Raw material 122 166 (26.5) 580 876 (33.8)
% of net sales 62.2 76.4 70.6 80.2
Staff cost 6 4 61.8 19 14 37.4
% of net sales 2.9 1.6 2.3 1.3
Other expenditure 32 16 102.7 92 79 16.9
% of net sales 16.5 7.4 11.2 7.2
Total expenditure 160 185 (13.7) 692 969 (28.6)
% of net sales 81.6 85.4 84.1 88.7
Operating profit 36 32 14.1 131 123 6.2
OPM(%) 18.4 14.6 15.9 11.3
Other operating income 0 0 - 0 0 -
EBIDTA 36 32 14.1 131 123 6.2
EBITDA margins (%) 18.4 14.6 15.9 11.3
Interest 10 7 38.6 34 36 (5.3)
Depreciation 11 8 43.0 34 28 19.9
Other income 0 0 (42.5) 4 11 (64.9)
Exceptional items 0 1 - 0 0 -
Profit before tax 15 18 (15.1) 67 70 (5.1)
% of net sales 7.8 8.3 8.1 6.4
Tax 3 4 (24.2) 11 8 27.6
% of PBT 17.7 19.9 15.9 11.9
Profit after tax 13 14 (12.8) 53 62 (15.7)
% of net sales 6.4 6.7 6.4 5.7
FDEPS (Rs) 4.7 5.4 (12.8) 18.8 22.3 (15.7)
Source: Company, Angel Research
Exhibit 2: Quarterly production trend
(tonnes) 1QFY10 2QFY10 3QFY10 4QFY10 1QFY11 yoy % qoq %
Sponge iron 69,808 60,860 74,806 80,359 61,535 (11.9) (23.4)
Billets 2,101 16,802 14,205 23,370 - - -
HB wire 19,918 19,506 16,033 17,088 14,193 (28.7) (16.9)
Ferro alloys - - - 1,500 - - -
Power (mn units) 79 71 95 88 76 (3.9) (14.3)
Iron ore 45,500 32,418 130,530 128,044 141,984 212.1 10.9
Pellet - - - 48,305 55,396 - 14.7
Source: Company, Angel Research
August 4, 2010 2
3. Godawari Power| 1QFY2011 Result Update
Exhibit 3: Quarterly sales volume trend
(tonnes) 1QFY10 2QFY10 3QFY10 4QFY10 1QFY11 yoy % qoq %
Sponge iron 68,577 42,226 69,064 59,768 61,144 (10.8) 2.3
Billets 1,301 17,153 14,160 23,221 533 (59.0) (97.7)
HB wire 19,906 15,569 18,273 17,934 13,609 (31.6) (24.1)
Ferro alloys - - - 1,168 649 - (44.4)
Power (mn units) 57 36 60 37 52 (9.9) 41.6
Pellet - - - 8,473 8,591 - 1.4
Source: Company, Angel Research
Exhibit 4: Quarterly realisation trend
(tonnes) 1QFY10 2QFY10 3QFY10 4QFY10 1QFY11 yoy % qoq %
Sponge iron 12,548 12,236 12,310 15,384 15,365 22.5 (0.1)
Billets 21,752 21,005 21,264 24,151 28,143 29.4 16.5
HB wire 29,850 27,703 26,547 29,458 30,502 2.2 3.5
Ferro alloys - - - 57,534 57,319 - (0.4)
Power (mn units) 6.8 3.4 5.2 3.9 5.1 (24.3) 30.5
Pellet - - - 5,571 7,252 - 30.2
Source: Company, Angel Research
Key result Highlights
Production of sponge iron was low during the quarter due to technical
problems. Management is trying to resolve the issue and production is
expected to be on similar lines in 2QFY2011.
Pellet production in 2QFY2011 is expected to be at same levels as in
1QFY2011.
During the quarter the company sold ~10,000 tonnes of iron ore purchased
from NMDC to third parties, which is expected to have contributed ~Rs1.0cr
to the operating profit.
The sponge iron plant is expected to use high-priced iron ore (~10,000
tonnes) in 2QFY2011 also. This is mainly on account of high magnetic content
in the iron ore from its Ari Dongri mines. We expect the usage to decrease as
pellet production stabilises.
In the current quarter (2QFY2011), the company has restarted the billet and
ferro alloy plant. Consequently, power sales volumes are expected to dip in
2QFY2011.
The sponge iron prices have increased by ~Rs1,000 and are currently at
Rs16,000/tonne.
The 0.6mn tonne pellet plant at Ardent Steel started commercial production
from August 01, 2010.
August 4, 2010 3
4. Godawari Power| 1QFY2011 Result Update
Investment Rationale
Mining capacity at Ari Dongri mine to increase
Currently, GPIL has approval to mine 0.6mn tonnes of iron ore from the Ari
Dongri mine. Management expects to increase the mining capacity to 0.9mn
tonnes by March 2011E.
Iron ore mining operations at Boria Tibu to start soon
GPIL has received all the necessary clearances for the Boria Tibu mine, and the
lease has been executed in the company's favour. The mine is located in the
Rajnandgaon district of Chhattisgarh, ~170km away from GPIL's plant and is
estimated to have initial reserves of 7.0mn tonnes, with average Fe content of 62-
63%. Management expects to start mining operations post monsoons. Iron ore
from the mine will be used for captive consumption for making pellets. Potential
upside to our estimates exists from successful ramp up of mining operations at
Boria Tibu.
Pellet production at Ardent Steel started
GPIL’s 0.6mn tonne pellet plant in its 75% subsidiary Ardent Steel in Keonjhar,
Orissa has started commercial production from August 01, 2010. The company
has deployed the same technical team that has worked earlier in the pellet plant at
Raipur to ensure smooth progression. This will ensure that the learning curve is
faster and technical problems are easily sorted out. We expect the plant to
contribute Rs18cr and Rs52cr to consolidated EBITDA in FY2011E and FY2012E,
respectively.
August 4, 2010 4
5. Godawari Power| 1QFY2011 Result Update
Outlook and valuation
We are lowering our estimates marginally for FY2011E to factor in reduced
sponge iron production and pellet production, and higher cost of iron ore. We
maintain our FY2012E estimates.
At the CMP of Rs236, the stock is trading at 3.9x FY2011E and 2.2x FY2012E
EV/EBITDA. On a P/BV basis, it is trading at 1.0x FY2011E and 0.8x FY2012E
estimates. We expect GPIL's earnings to post 93.6% CAGR over FY2010-12E,
given the ramp up of iron ore mining capacity and the starting up of commercial
production of pellets at Ardent Steel. We maintain a Buy on the stock, with a
revised Target Price of Rs313 (Rs322), valuing the stock at 3.5x FY2012E
EV/EBITDA.
Exhibit 5: Key assumptions
FY2011E FY2012E
Sales volume (mn tonnes)
Sponge Iron 209,250 243,900
Billets 60,000 60,000
HB Wire 74,400 78,000
Power (mn units) 266 310
Pellet 87,175 78,270
Average realization (Rs/tonne)
Sponge Iron 17,000 17,500
Billets 24,272 24,772
HB Wire 30,000 30,000
Power (mn units) 4.5 4.5
Pellet 6,000 6,250
Average cost (Rs/tonne)
Iron ore 1,900 1,500
Source: Angel Research
Exhibit 6: Revision of estimates
(Rs cr) Earlier estimates Revised estimates Upgrade/(downgrade) (%)
FY11E FY12E FY11E FY12E FY11E FY12E
Net sales 1,084 1,265 1,039 1,265 (4.2) 0.0
EBITDA 277 330 246 330 (11.4) 0.0
EBITDA margin (%) 25.6 26.1 23.7 26.1 (192bp) 0bp
PBT 188 254 156 253 (16.9) (0.6)
PAT 150 198 124 197 (16.9) (0.6)
PAT margin (%) 13.8 15.7 12.0 15.6 (183bp) (9bp)
Source: Company, Angel Research
August 4, 2010 5
6. Godawari Power| 1QFY2011 Result Update
Exhibit 7: EPS - Angel forecast vs. consensus
Year (%) Angel forecast Bloomberg consensus Variation (%)
FY11E 44.5 44.1 1.0
FY12E 70.5 62.7 12.3
Source: Bloomberg, Angel Research
Exhibit 8: EV/EBITDA band
2,500
8x
2,000
6x
1,500
(Rs cr)
4x
1,000
2x
500
0
Apr-06 Apr-07 Apr-08 Apr-09 Apr-10
Source: Bloomberg, Angel Research
Exhibit 9: P/E band
700 12x
600
500
8x
400
(Rs)
300 6x
4x
200
100 2x
0
Apr-06 Apr-07 Apr-08 Apr-09 Apr-10
Source: Bloomberg, Angel Research
August 4, 2010 6
12. Godawari Power| 1QFY2011 Result Update
Research Team Tel: 022 - 4040 3800 E-mail: research@angeltrade.com Website: www.angeltrade.com
DISCLAIMER
This document is solely for the personal information of the recipient, and must not be singularly used as the basis of any investment
decision. Nothing in this document should be construed as investment or financial advice. Each recipient of this document should make
such investigations as they deem necessary to arrive at an independent evaluation of an investment in the securities of the companies
referred to in this document (including the merits and risks involved), and should consult their own advisors to determine the merits and
risks of such an investment.
Angel Broking Limited, its affiliates, directors, its proprietary trading and investment businesses may, from time to time, make
investment decisions that are inconsistent with or contradictory to the recommendations expressed herein. The views contained in this
document are those of the analyst, and the company may or may not subscribe to all the views expressed within.
Reports based on technical and derivative analysis center on studying charts of a stock's price movement, outstanding positions and
trading volume, as opposed to focusing on a company's fundamentals and, as such, may not match with a report on a company's
fundamentals.
The information in this document has been printed on the basis of publicly available information, internal data and other reliable
sources believed to be true, but we do not represent that it is accurate or complete and it should not be relied on as such, as this
document is for general guidance only. Angel Broking Limited or any of its affiliates/ group companies shall not be in any way
responsible for any loss or damage that may arise to any person from any inadvertent error in the information contained in this report.
Angel Broking Limited has not independently verified all the information contained within this document. Accordingly, we cannot testify,
nor make any representation or warranty, express or implied, to the accuracy, contents or data contained within this document. While
Angel Broking Limited endeavours to update on a reasonable basis the information discussed in this material, there may be regulatory,
compliance, or other reasons that prevent us from doing so.
This document is being supplied to you solely for your information, and its contents, information or data may not be reproduced,
redistributed or passed on, directly or indirectly.
Angel Broking Limited and its affiliates may seek to provide or have engaged in providing corporate finance, investment banking or
other advisory services in a merger or specific transaction to the companies referred to in this report, as on the date of this report or in
the past.
Neither Angel Broking Limited, nor its directors, employees or affiliates shall be liable for any loss or damage that may arise from or in
connection with the use of this information.
Note: Please refer to the important `Stock Holding Disclosure' report on the Angel website (Research Section). Also, please
refer to the latest update on respective stocks for the disclosure status in respect of those stocks. Angel Broking Limited and
its affiliates may have investment positions in the stocks recommended in this report.
Disclosure of Interest Statement Godawari Power
1. Analyst ownership of the stock No
2. Angel and its Group companies ownership of the stock No
3. Angel and its Group companies' Directors ownership of the stock No
4. Broking relationship with company covered No
Note: We have not considered any Exposure below Rs 1 lakh for Angel, its Group companies and Directors.
Ratings (Returns) : Buy (> 15%) Accumulate (5% to 15%) Neutral (-5 to 5%)
Reduce (-5% to 15%) Sell (< -15%)
August 4, 2010 12