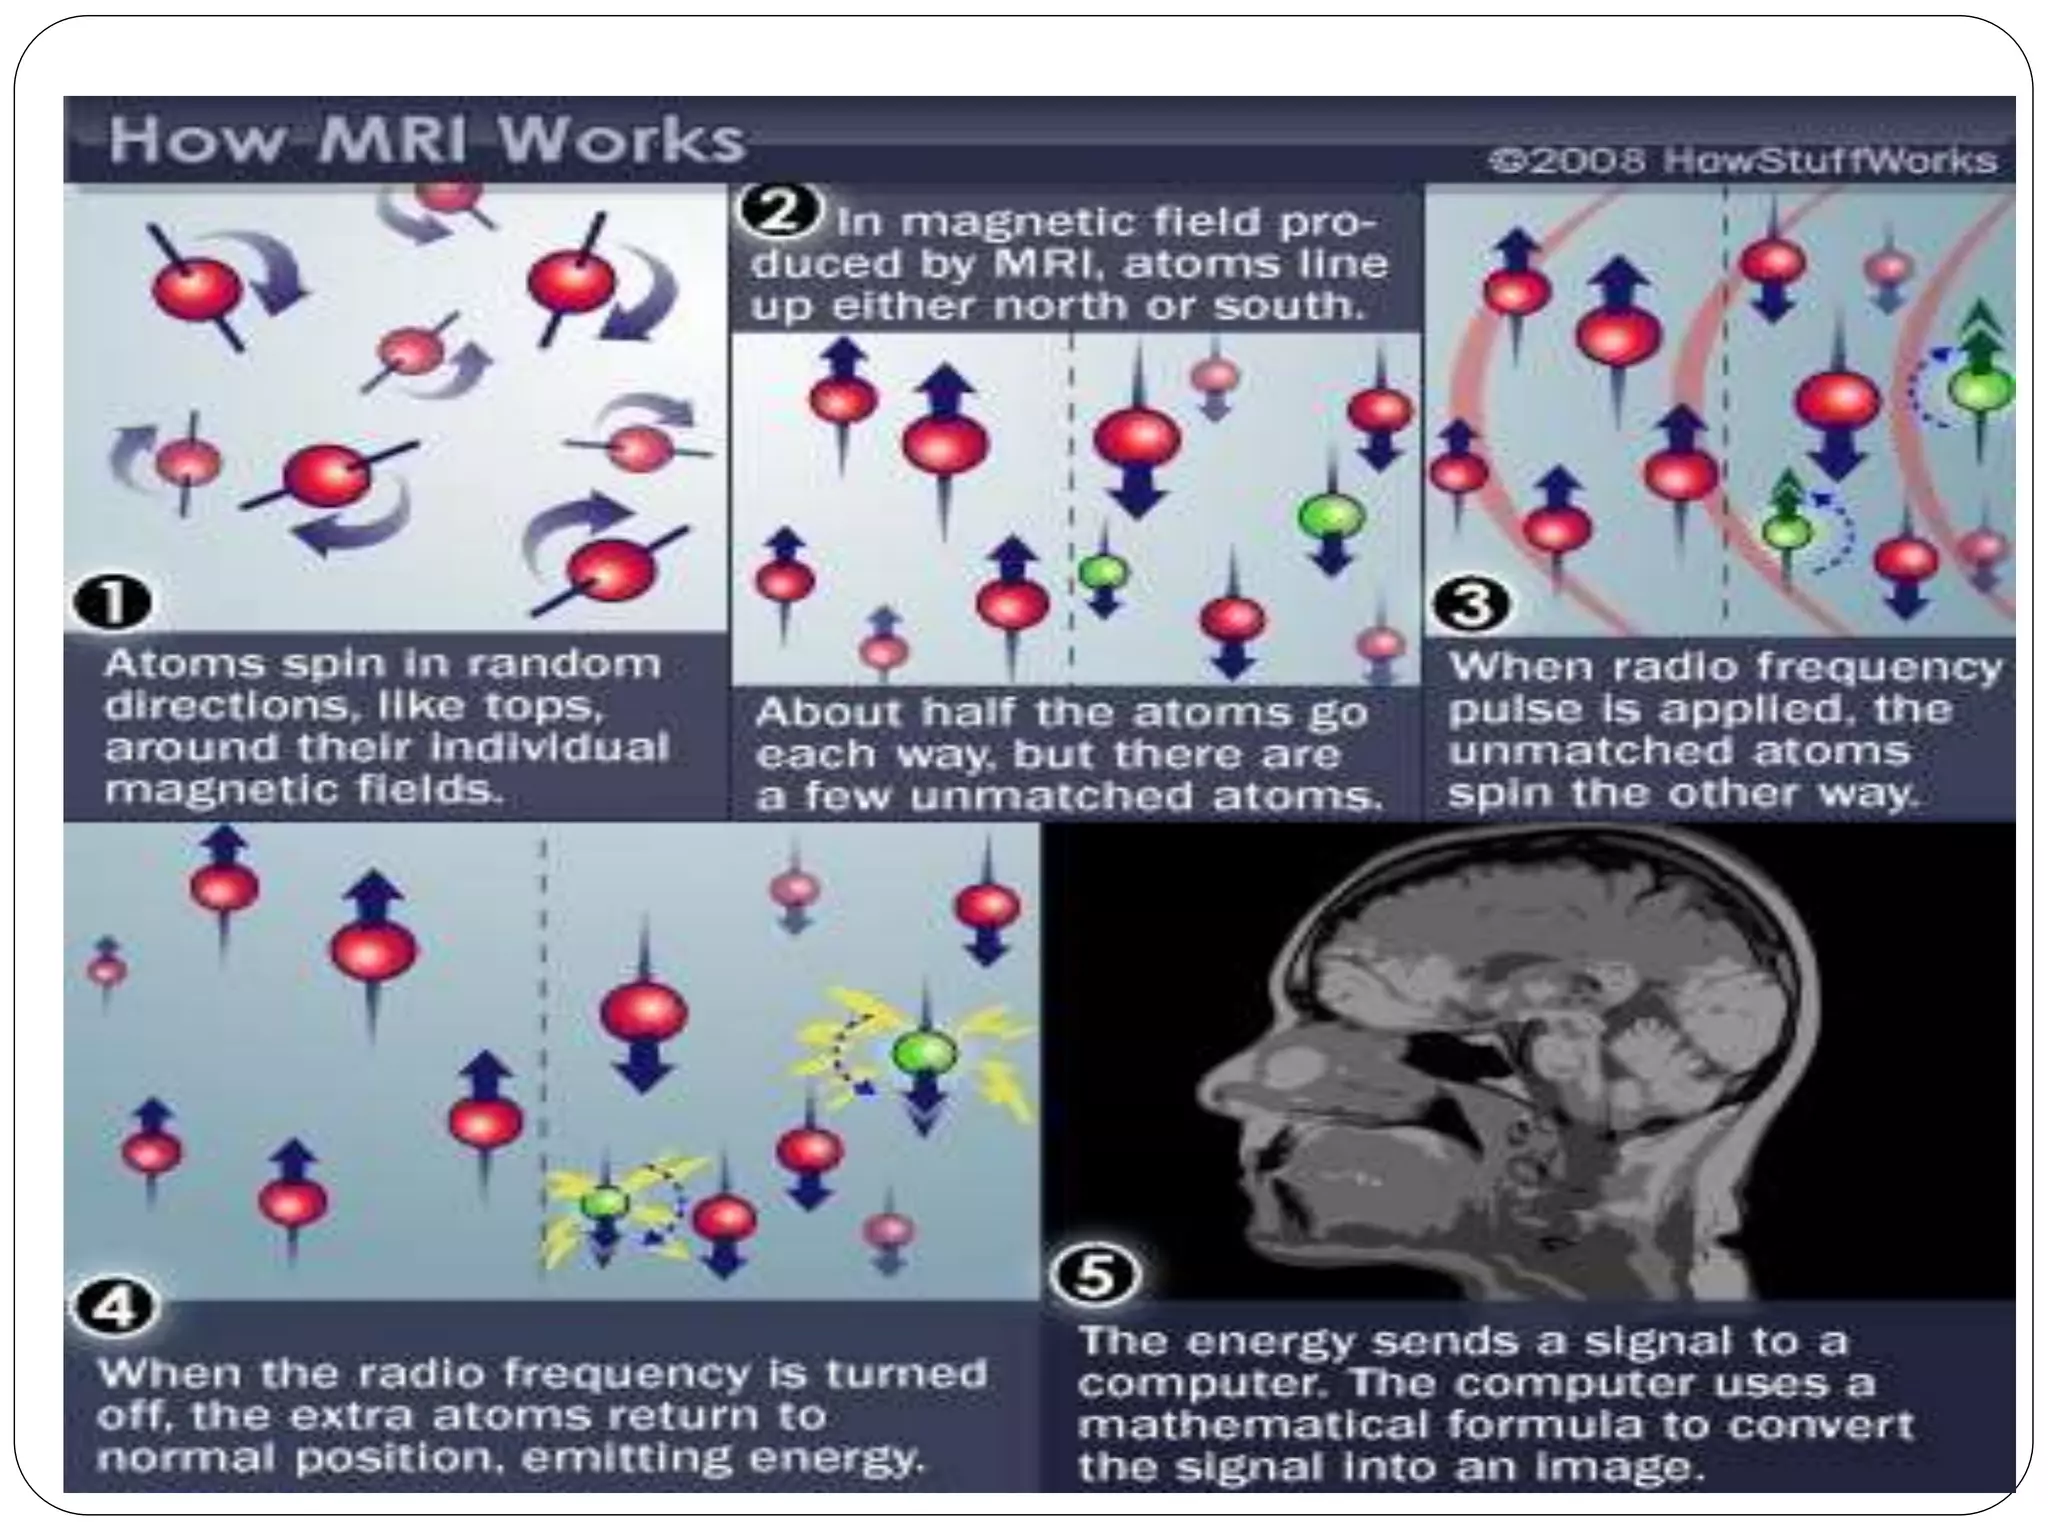
Dr Pawan Kumar presented on MRI principles, techniques, and reading. MRI works by using a strong magnetic field to align proton spins in the body. Radiofrequency pulses excite the protons, causing them to emit signals as they relax back to equilibrium. These signals are used to form MRI images. Key hardware includes magnets, gradient coils, and RF coils. MRI contrast depends on tissue T1 and T2 relaxation times and the chosen TR and TE parameters. Different sequences like T1-weighted, T2-weighted, and FLAIR are used to highlight various tissues and pathologies. Contrast agents can also be used to improve tissue contrast on MRI scans.
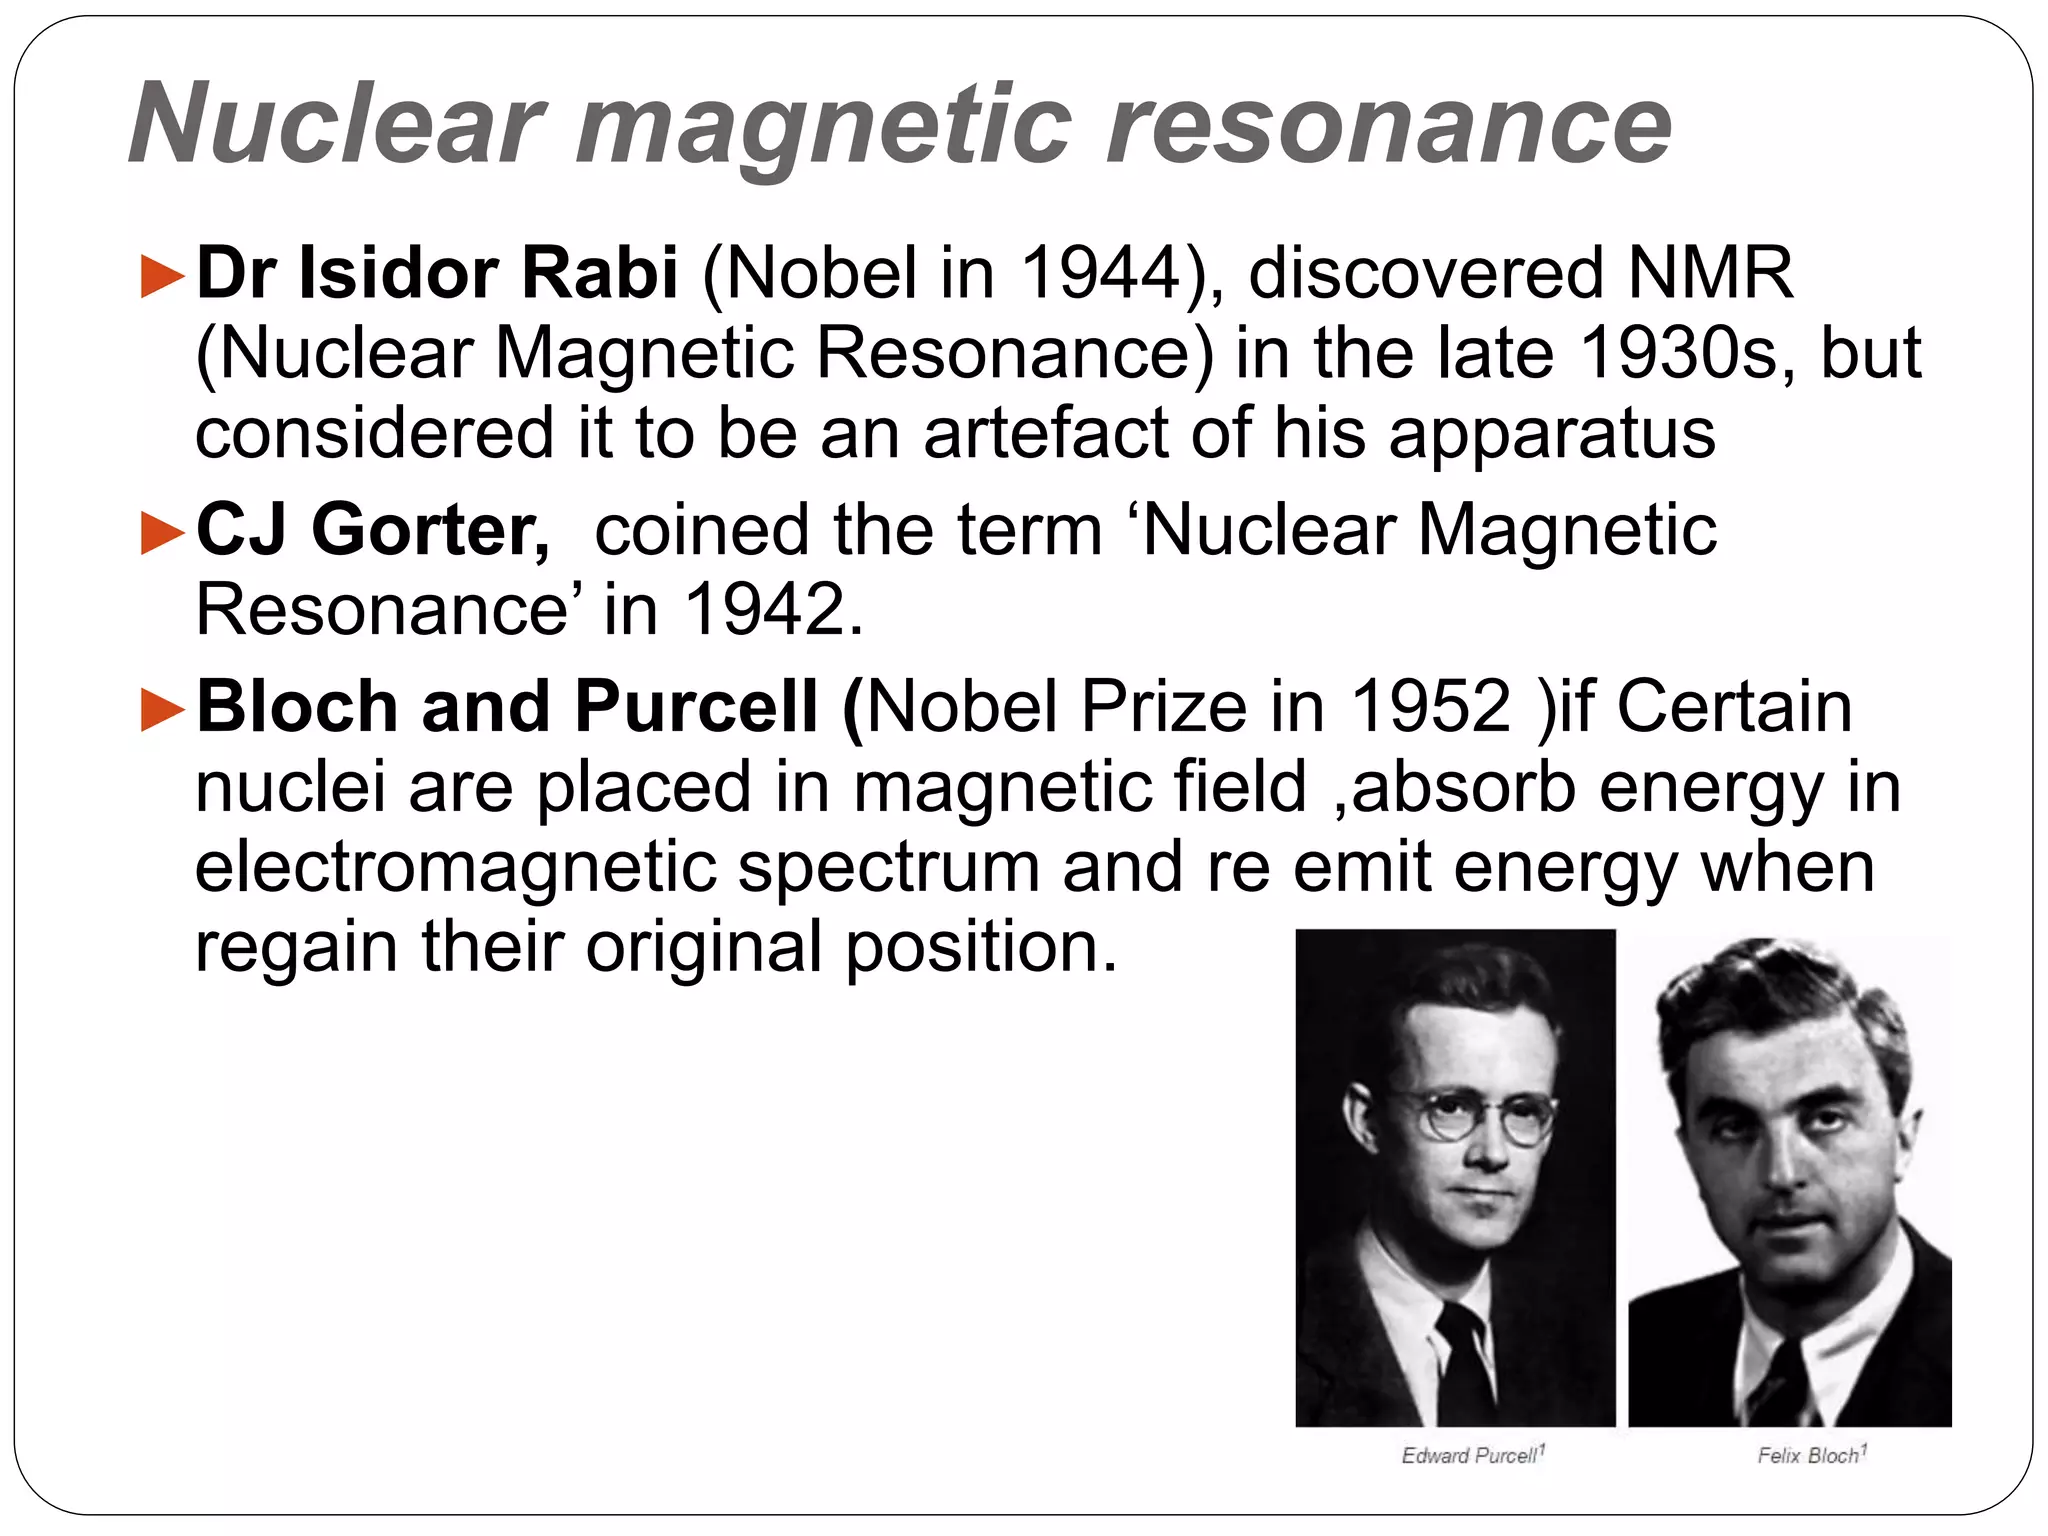
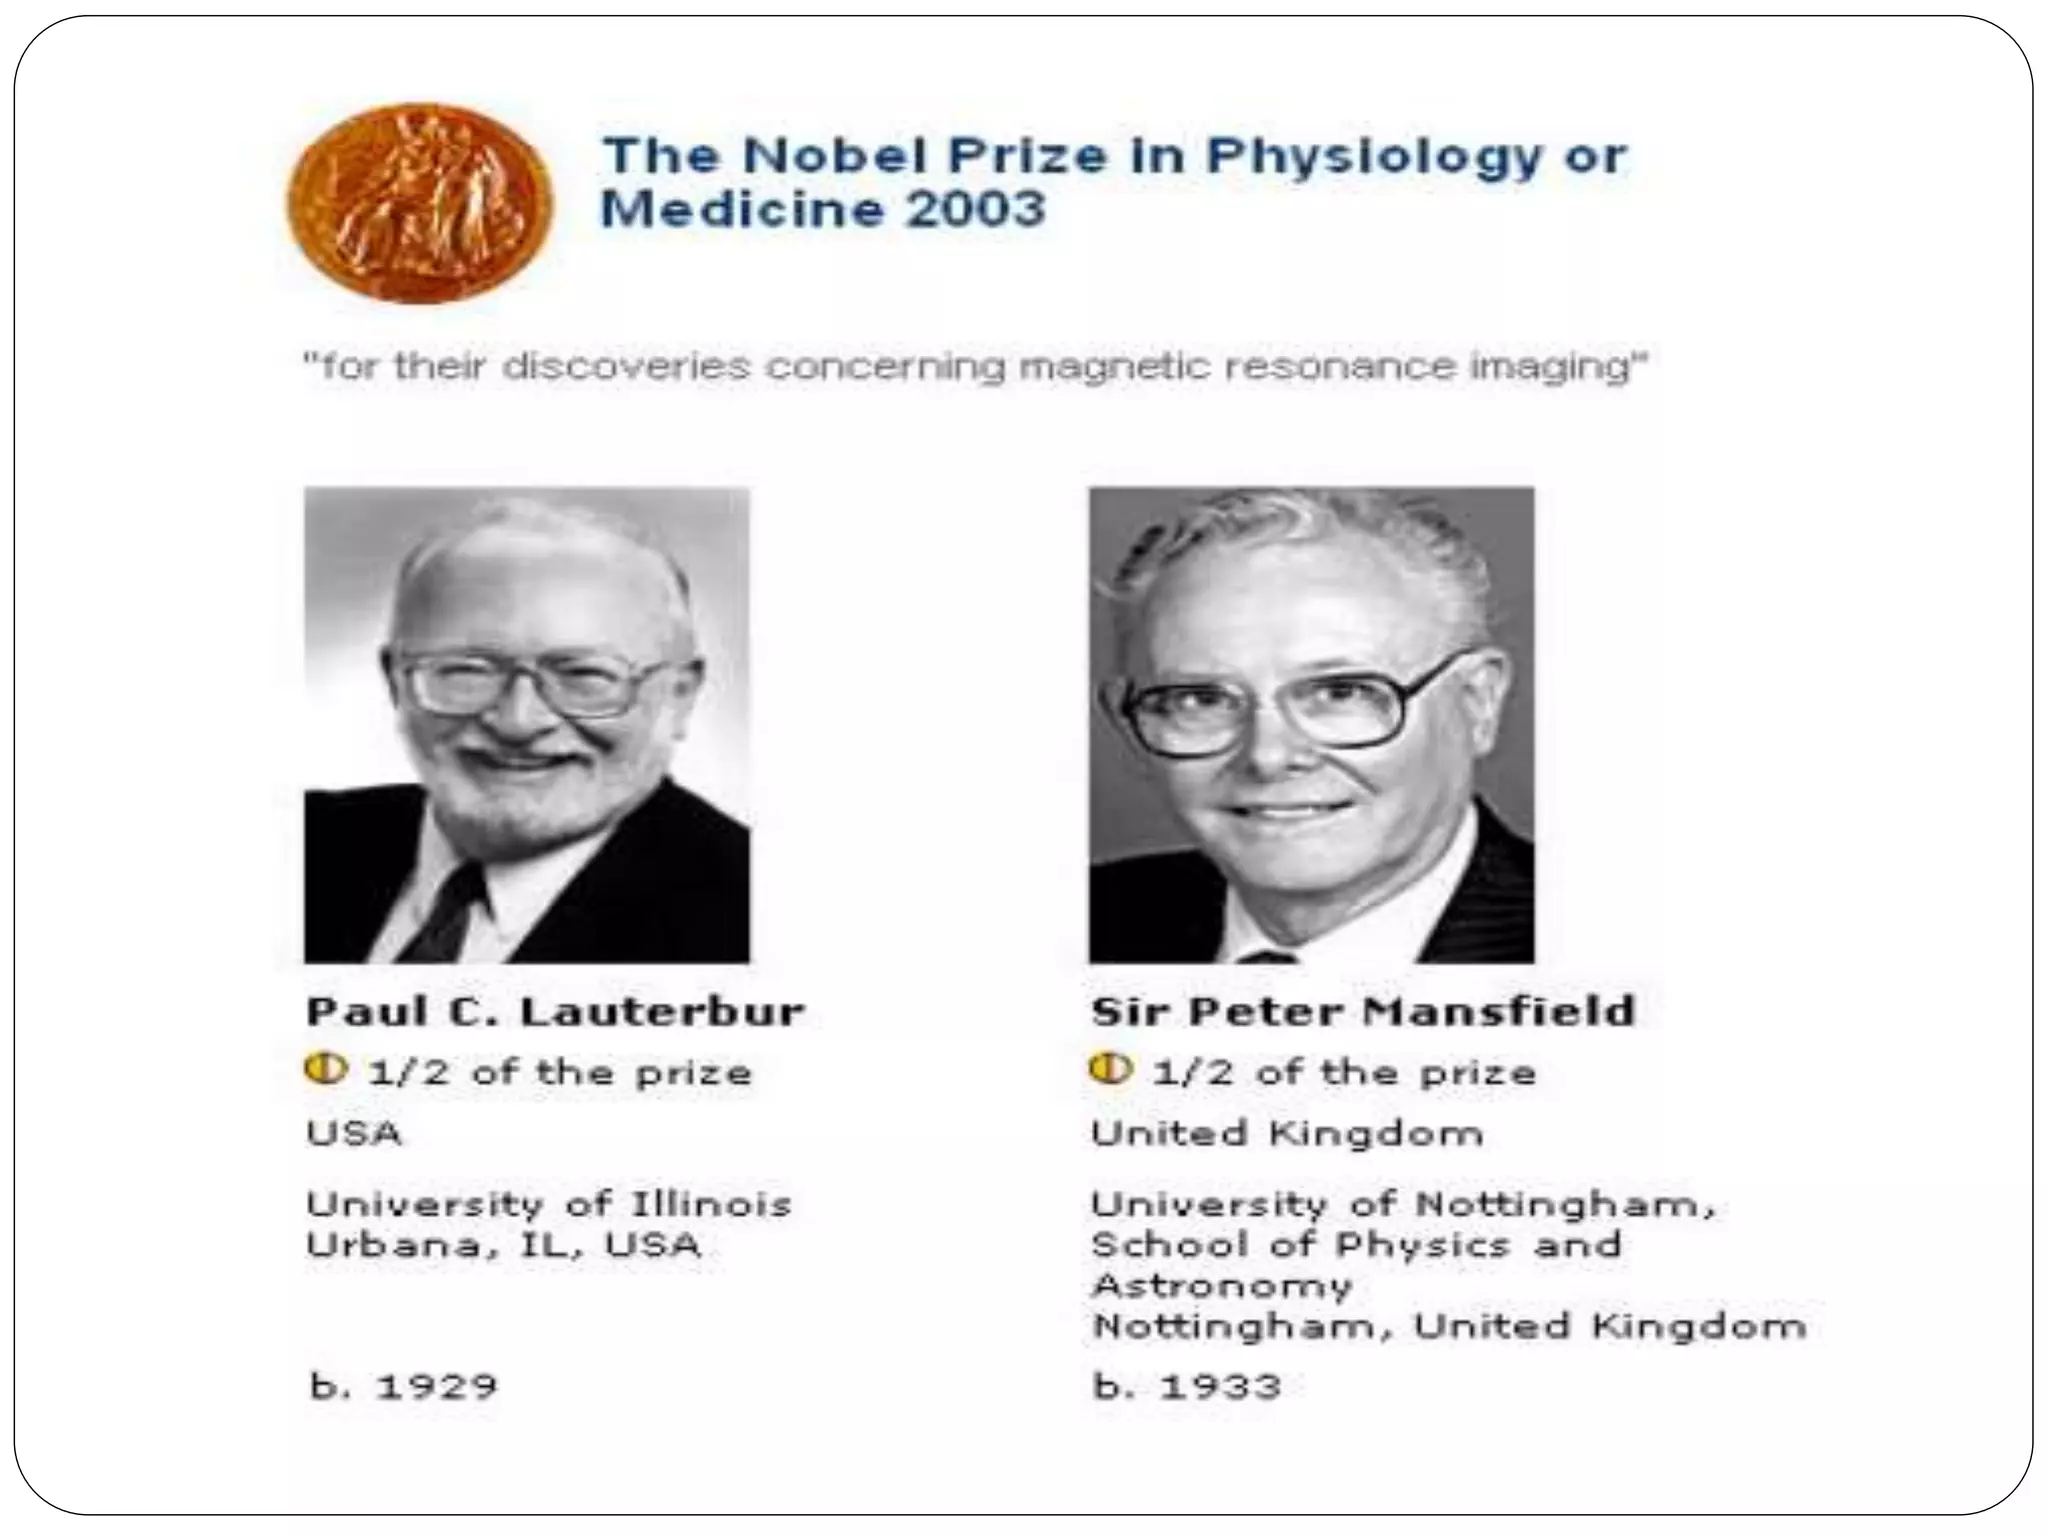
Presentation by Dr. Pawan Kumar on MRI principles. NMR was discovered by Dr. Rabi; terms introduced by CJ Gorter and Nobel Prize winners Bloch & Purcell.
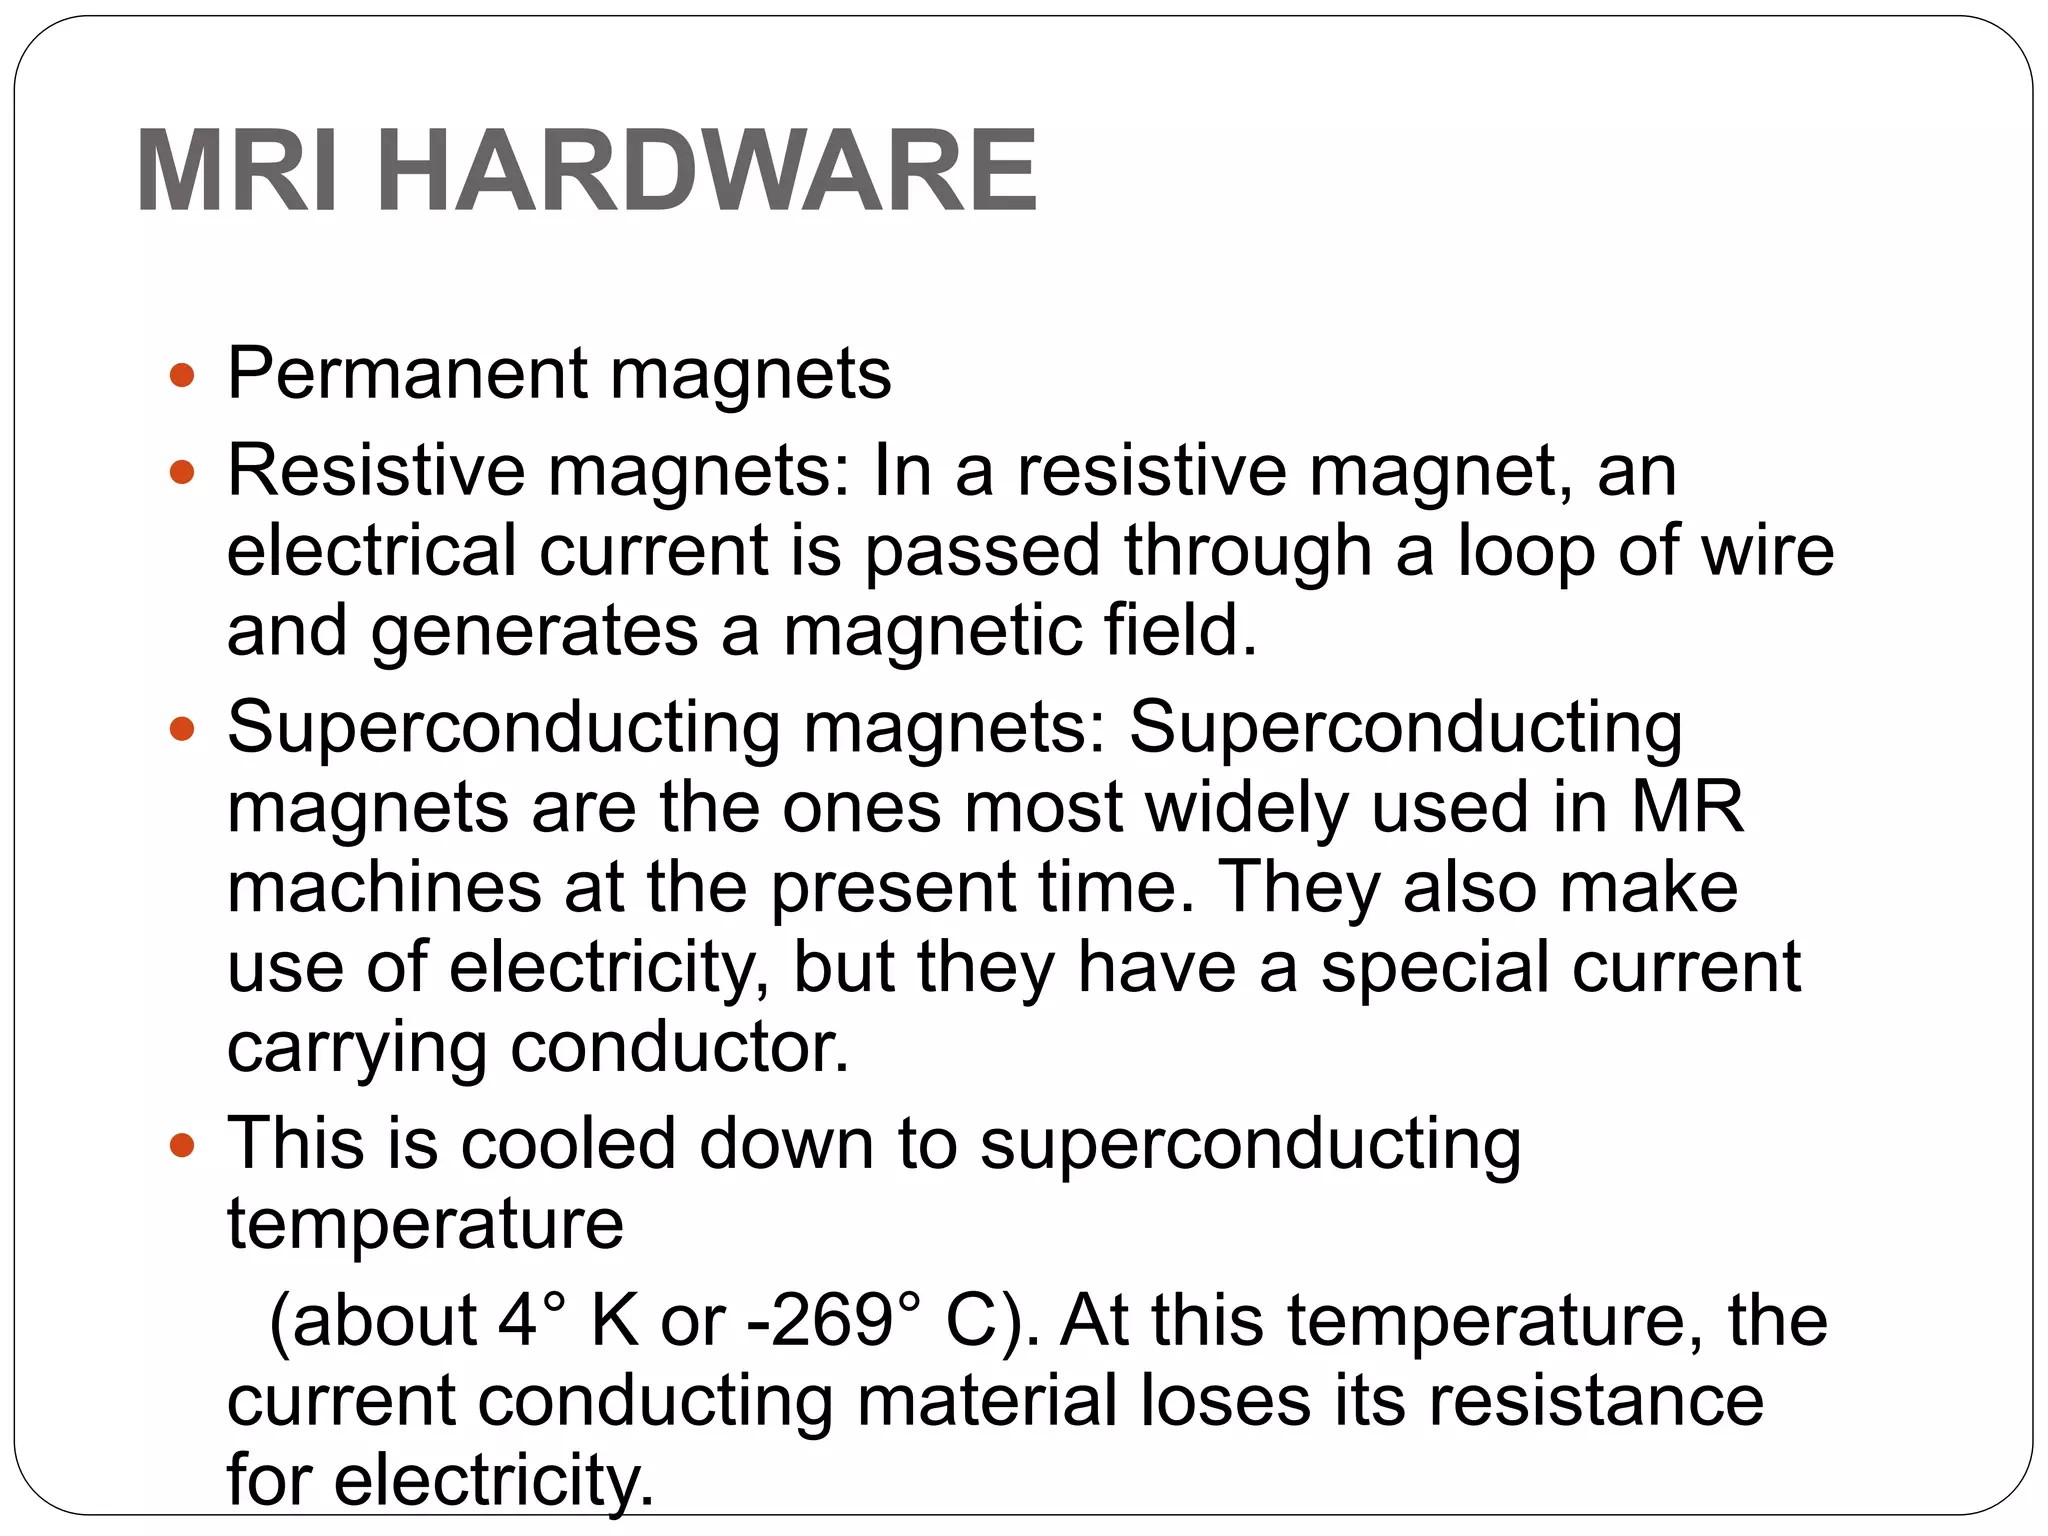
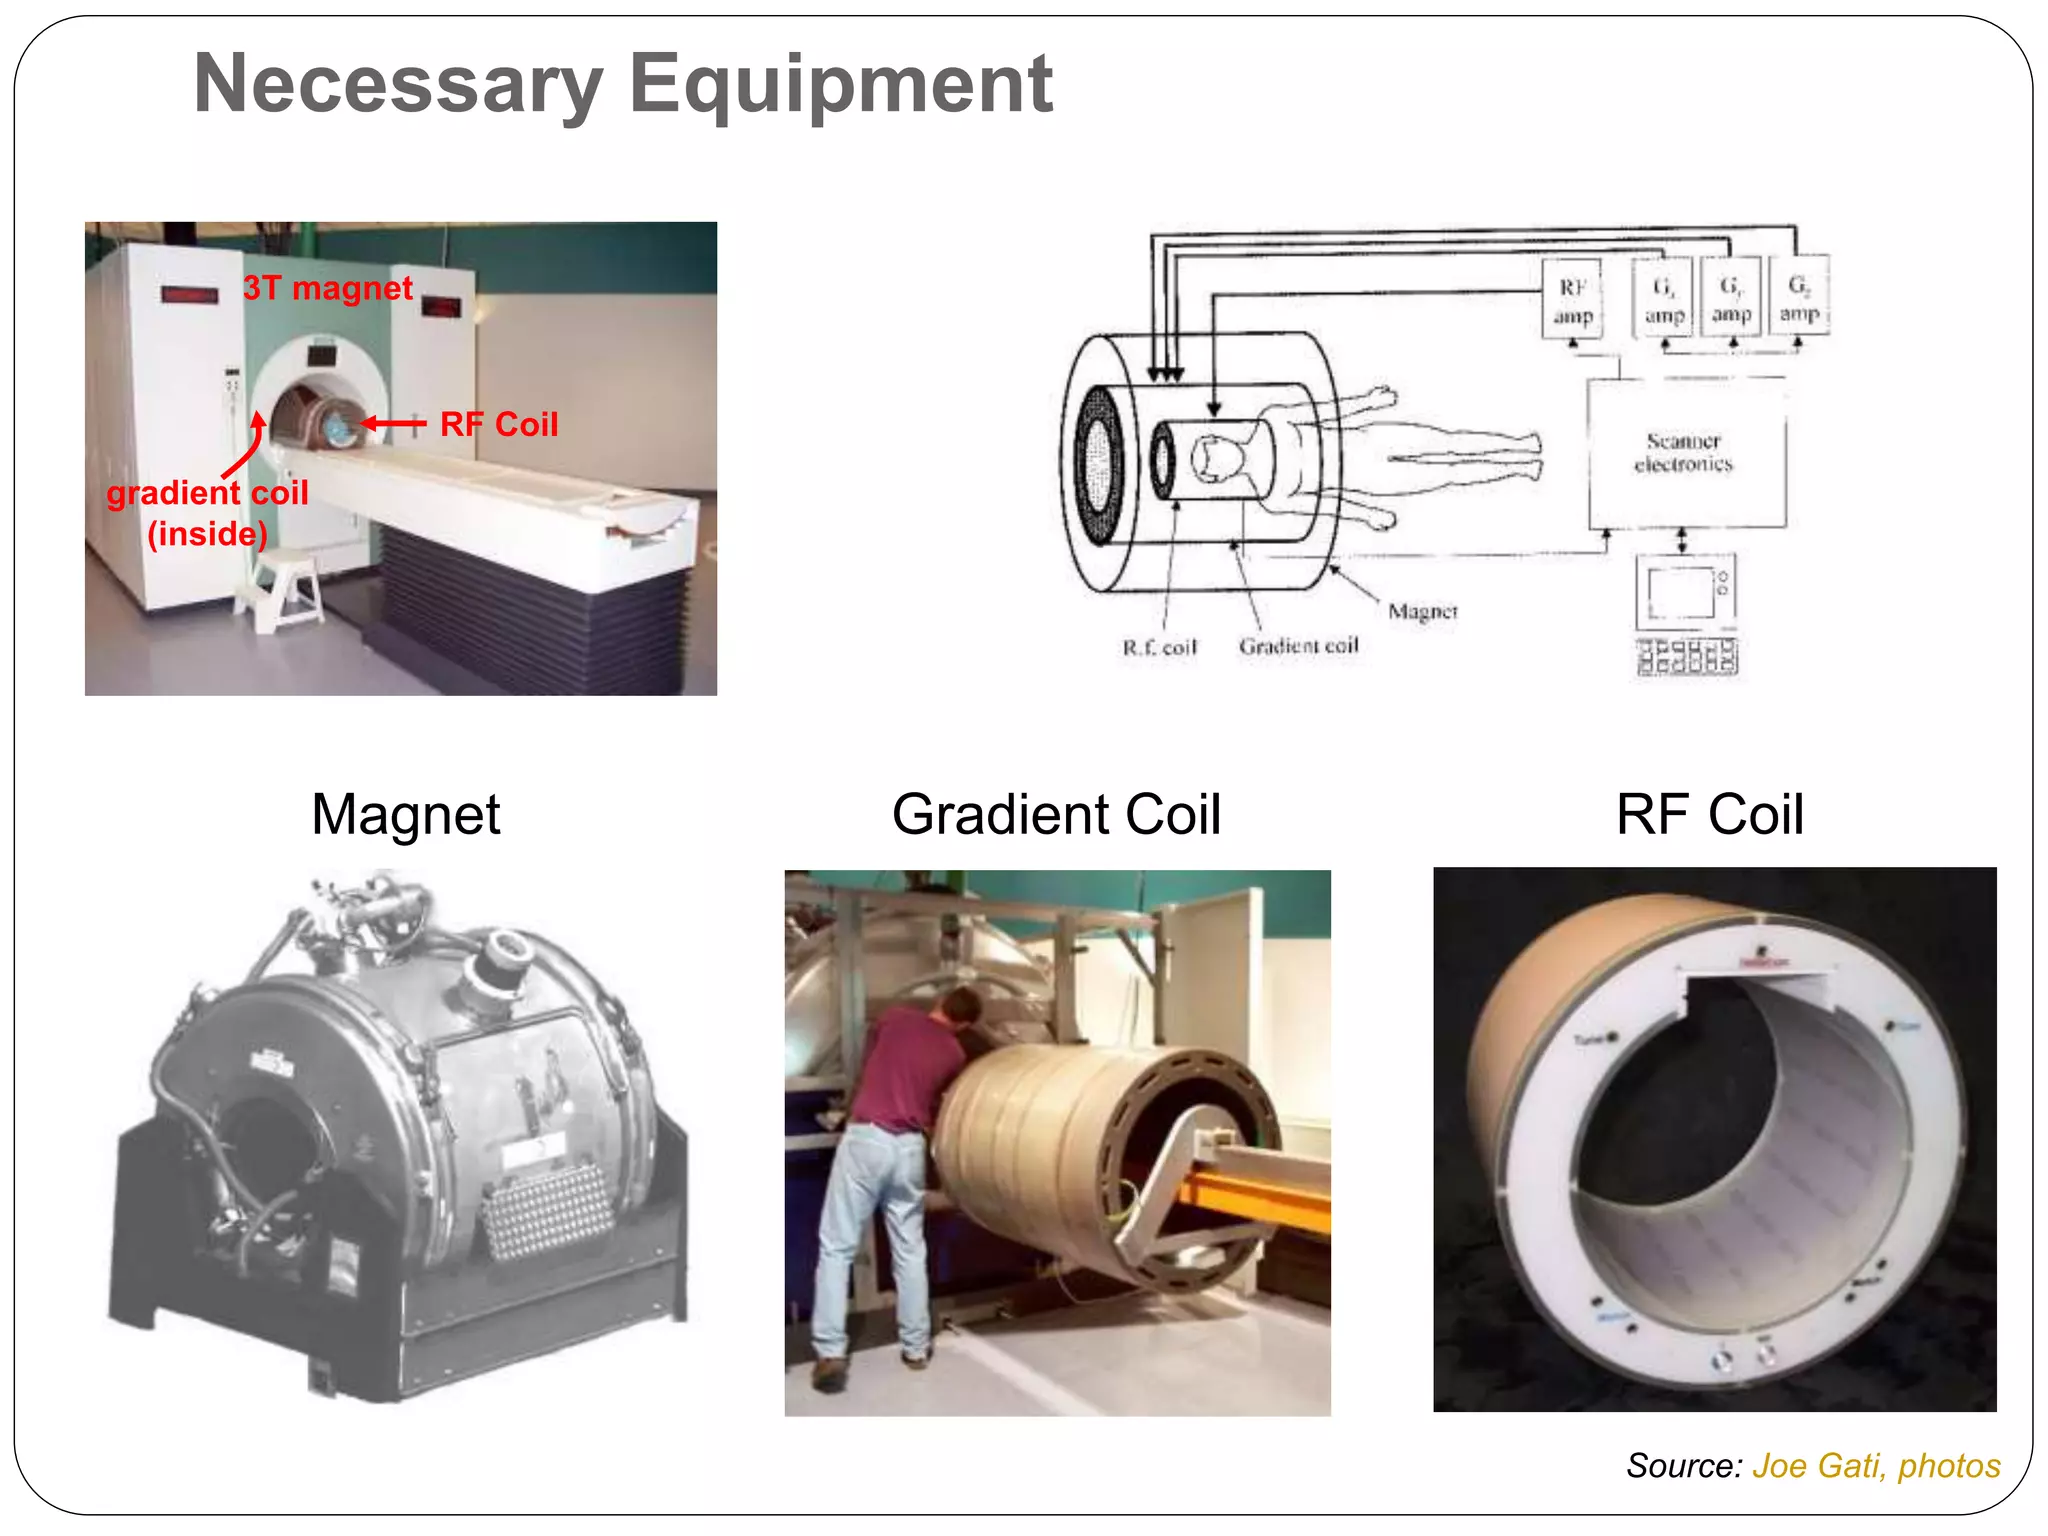
Overview of MRI hardware: permanent, resistive, and superconducting magnets; RF coils for signal transmission and reception.
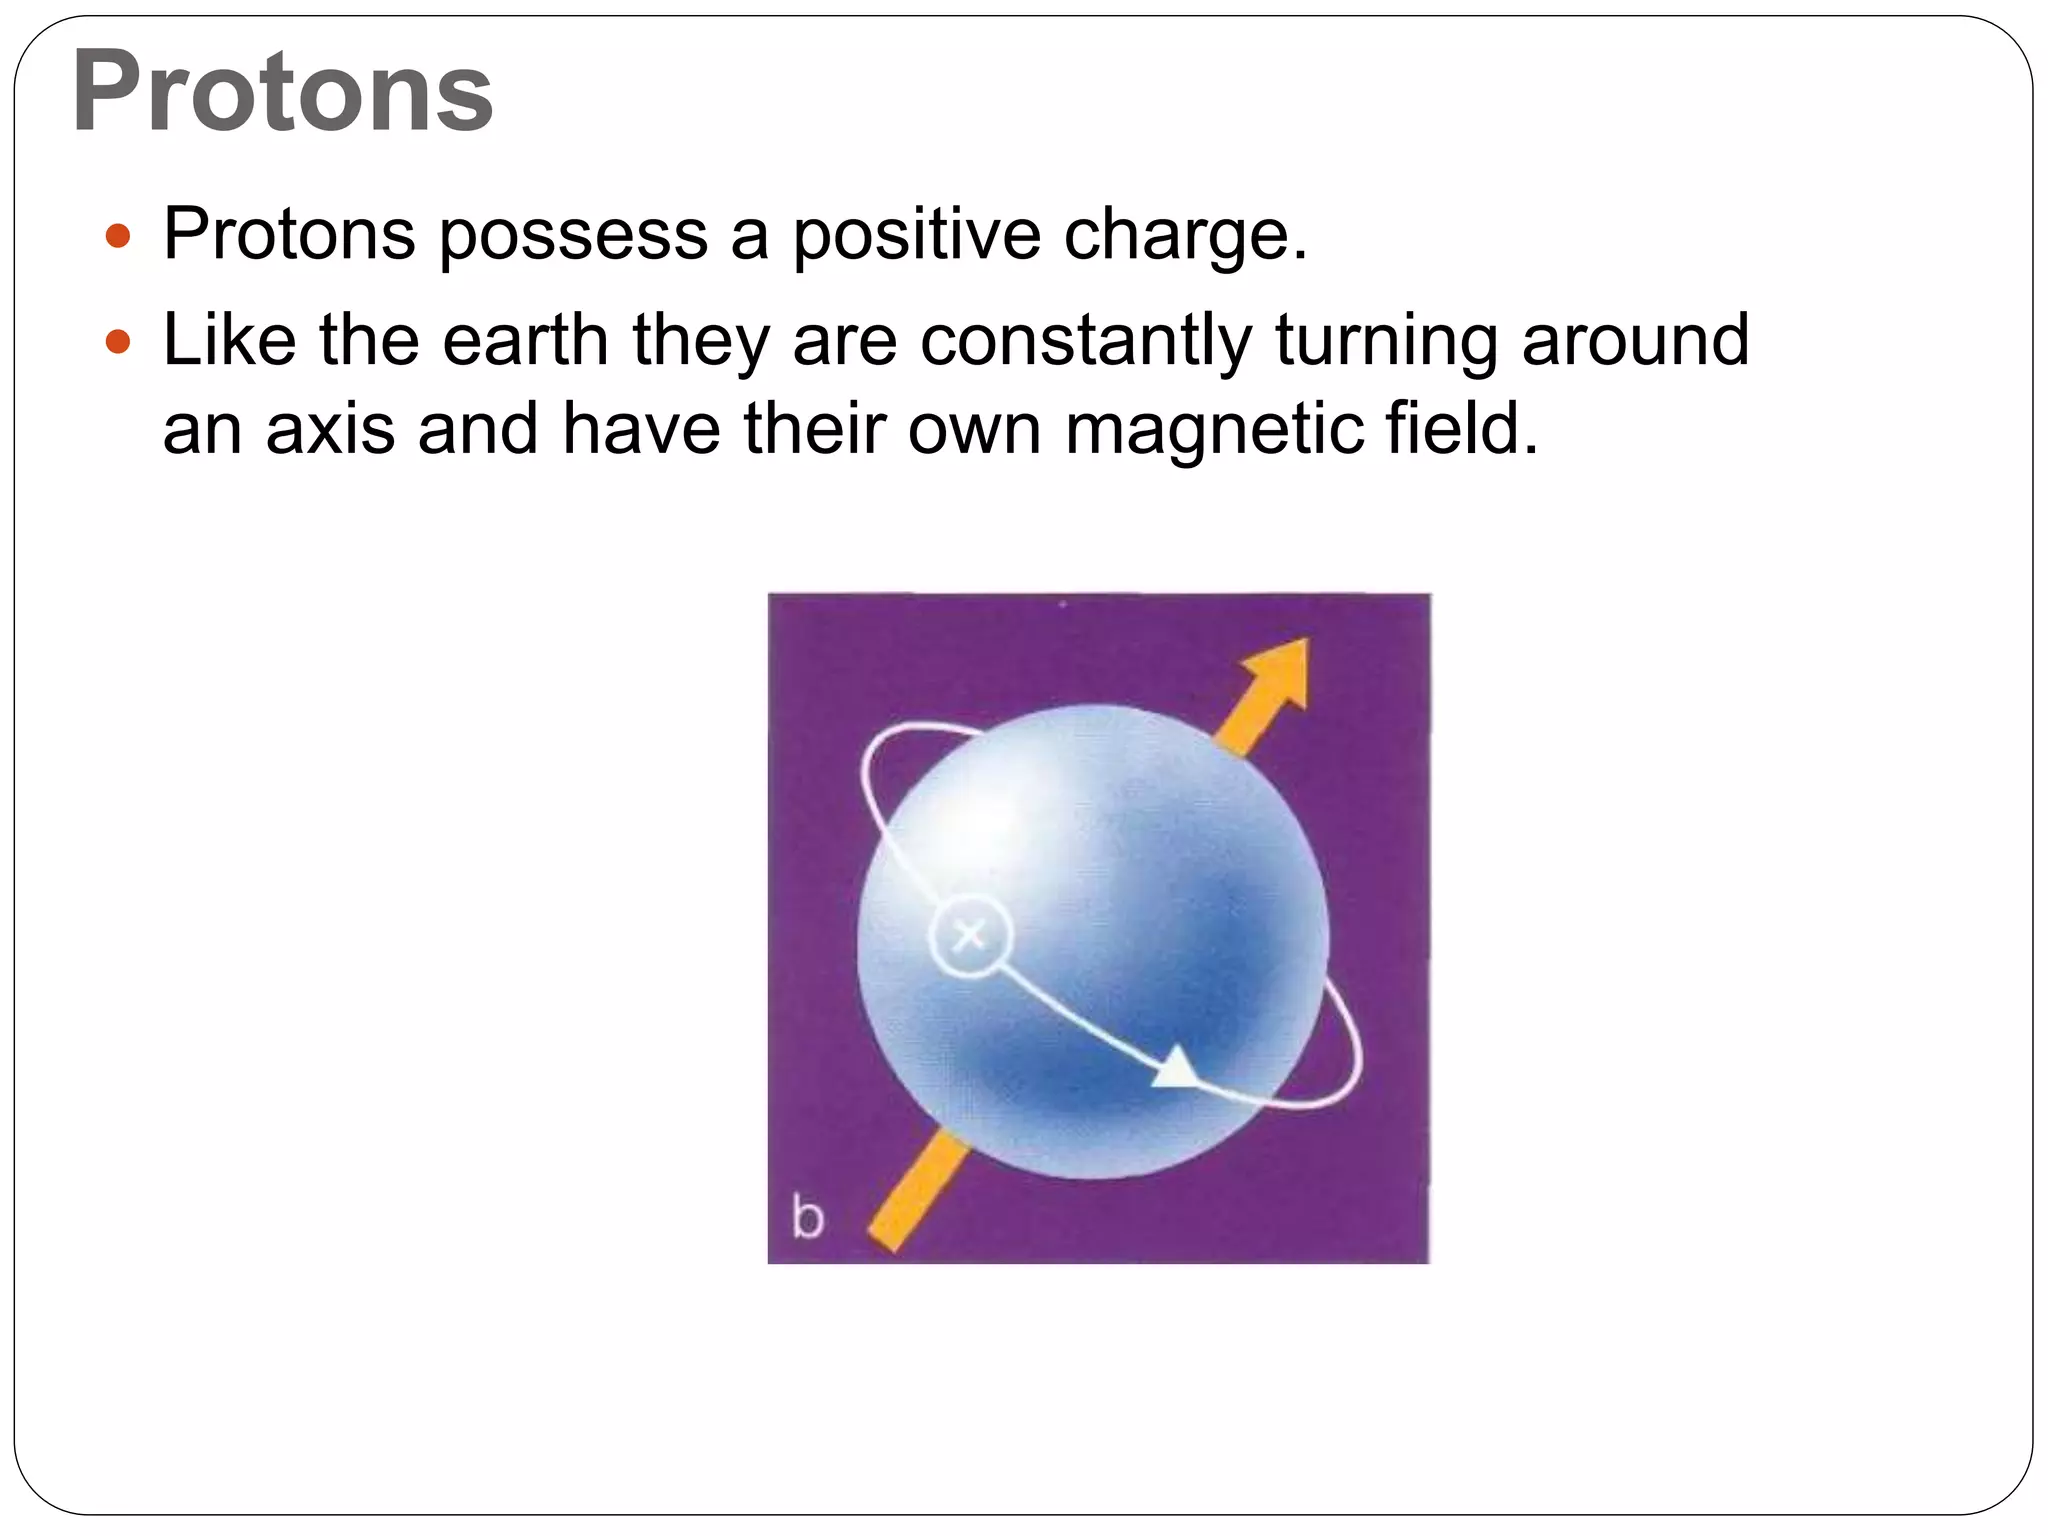
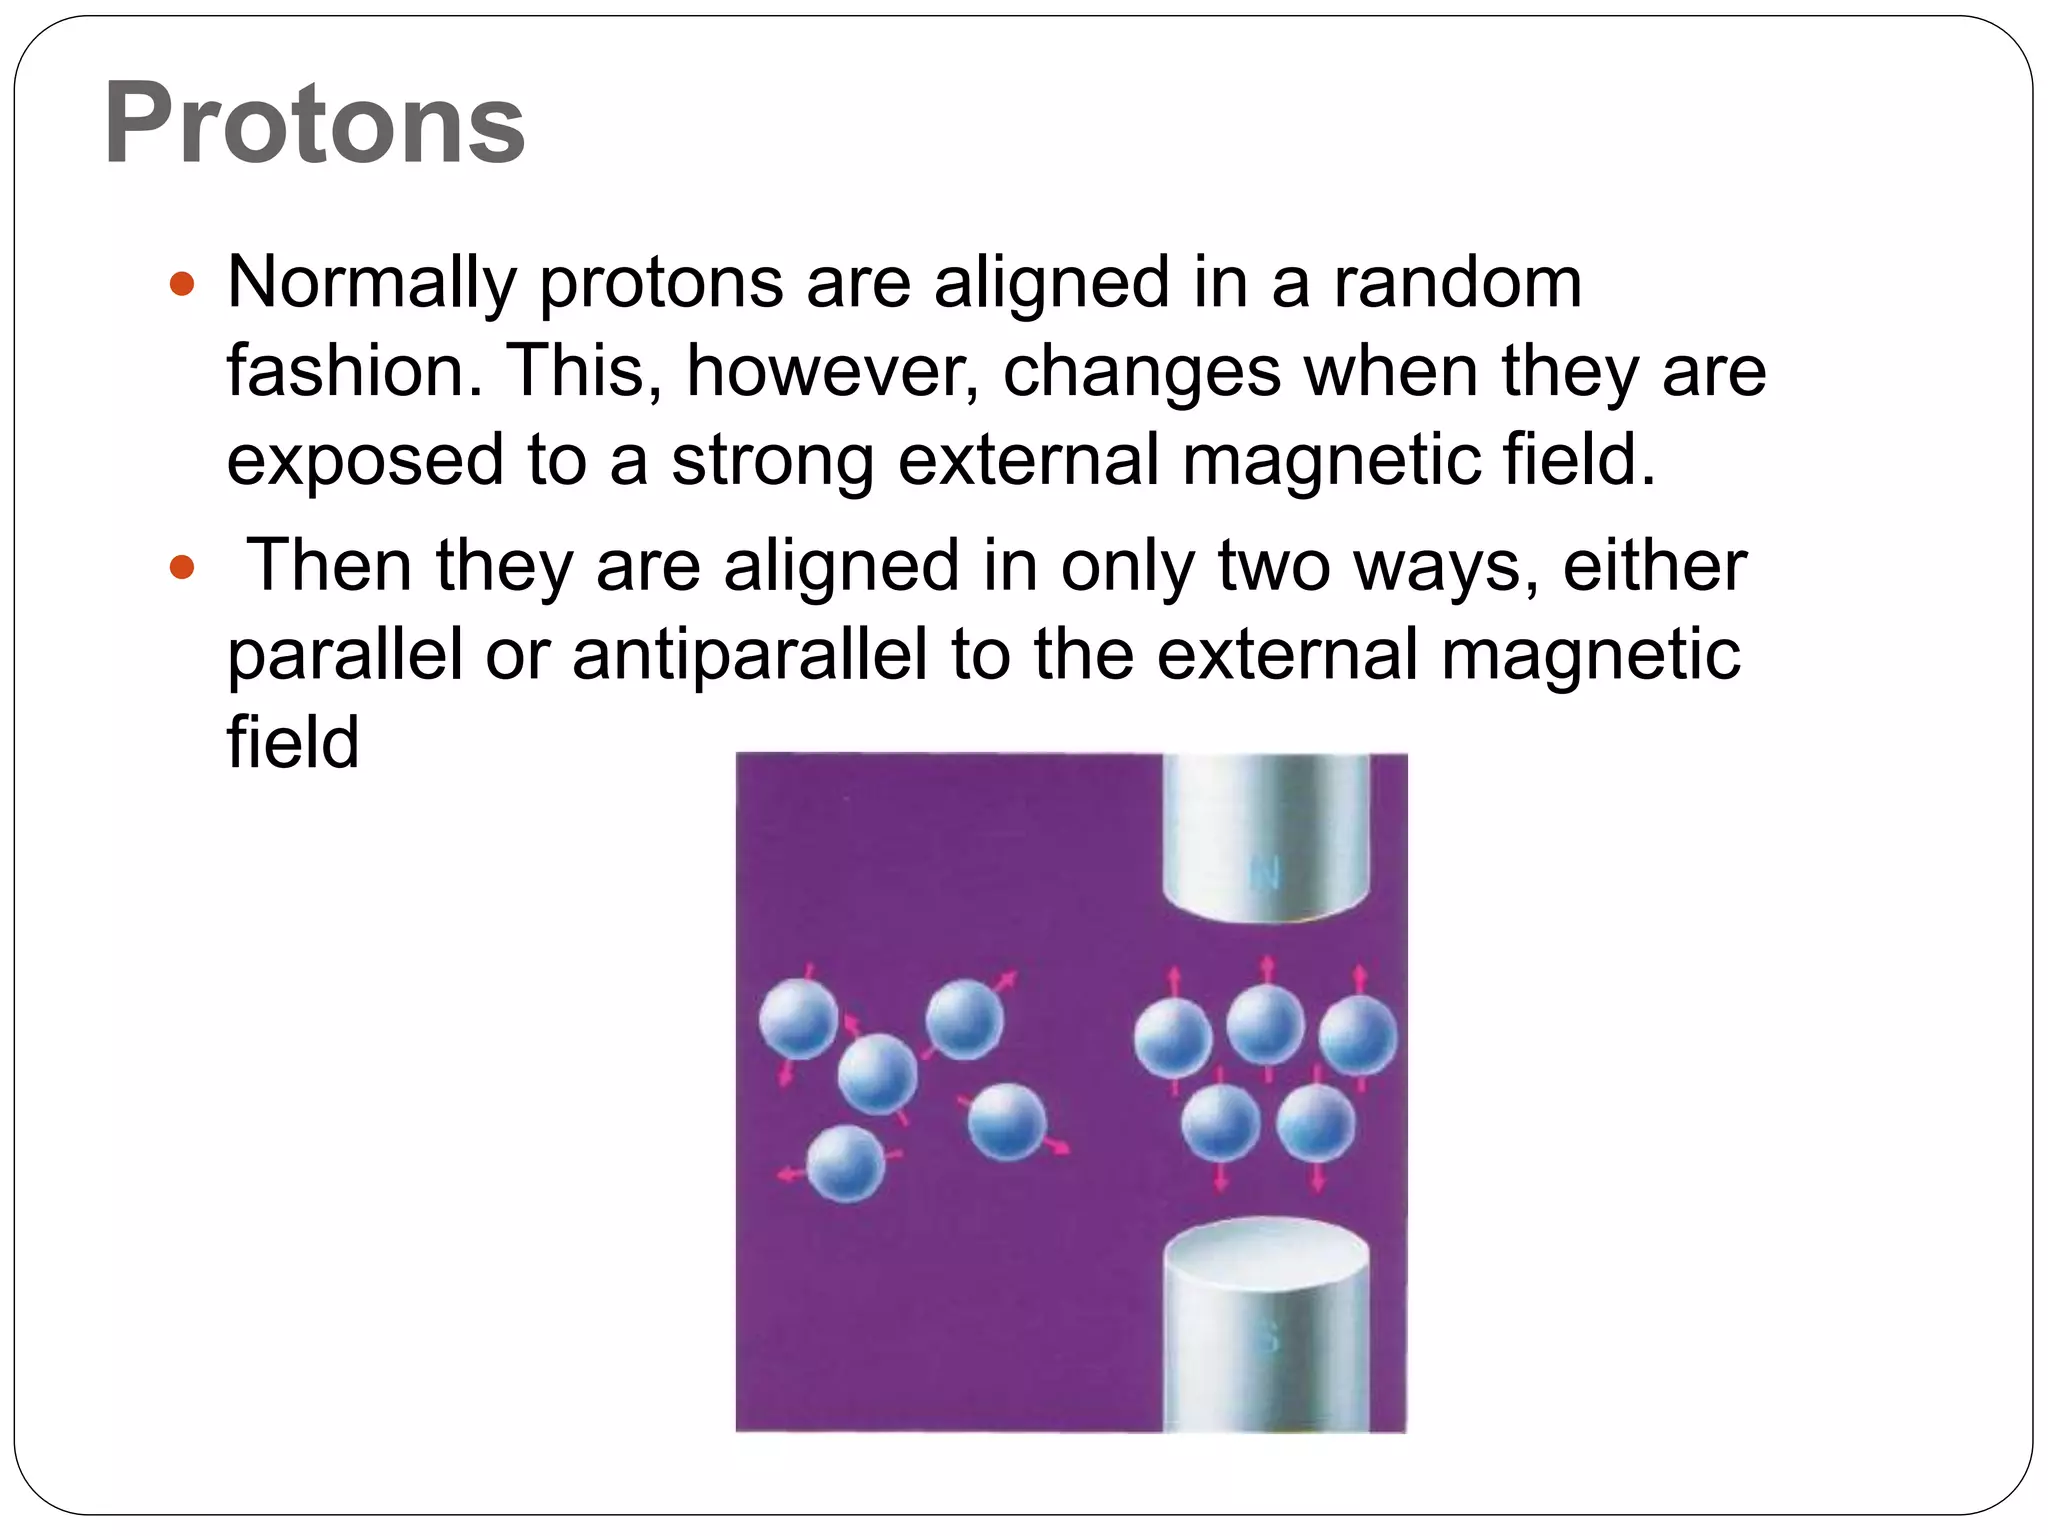
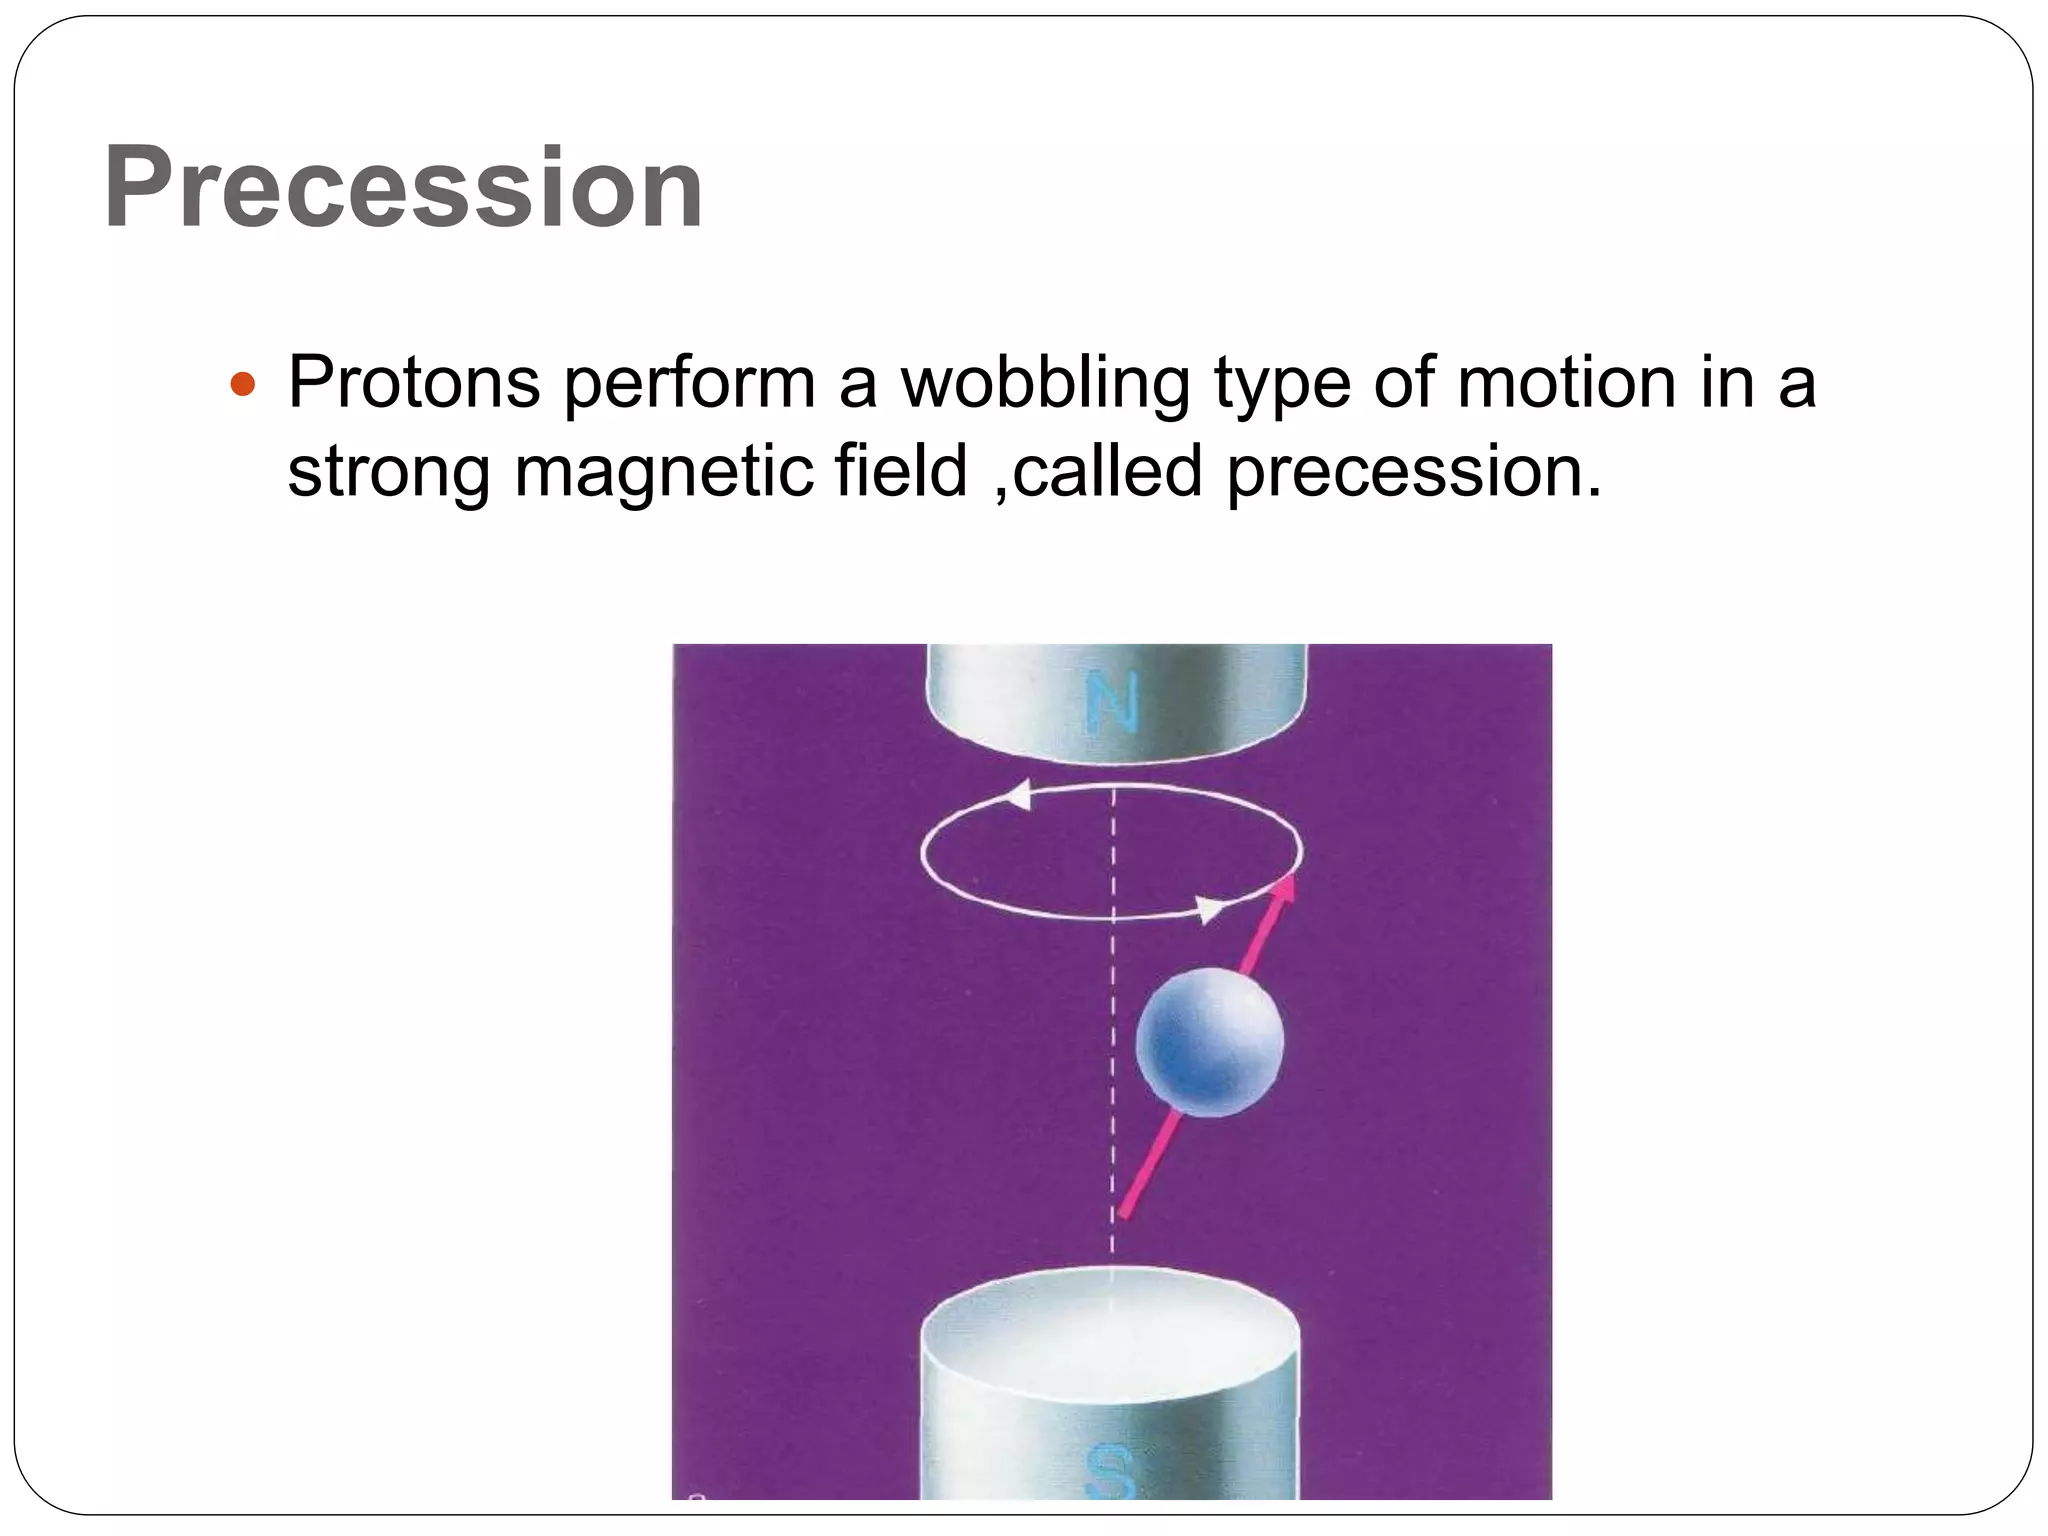
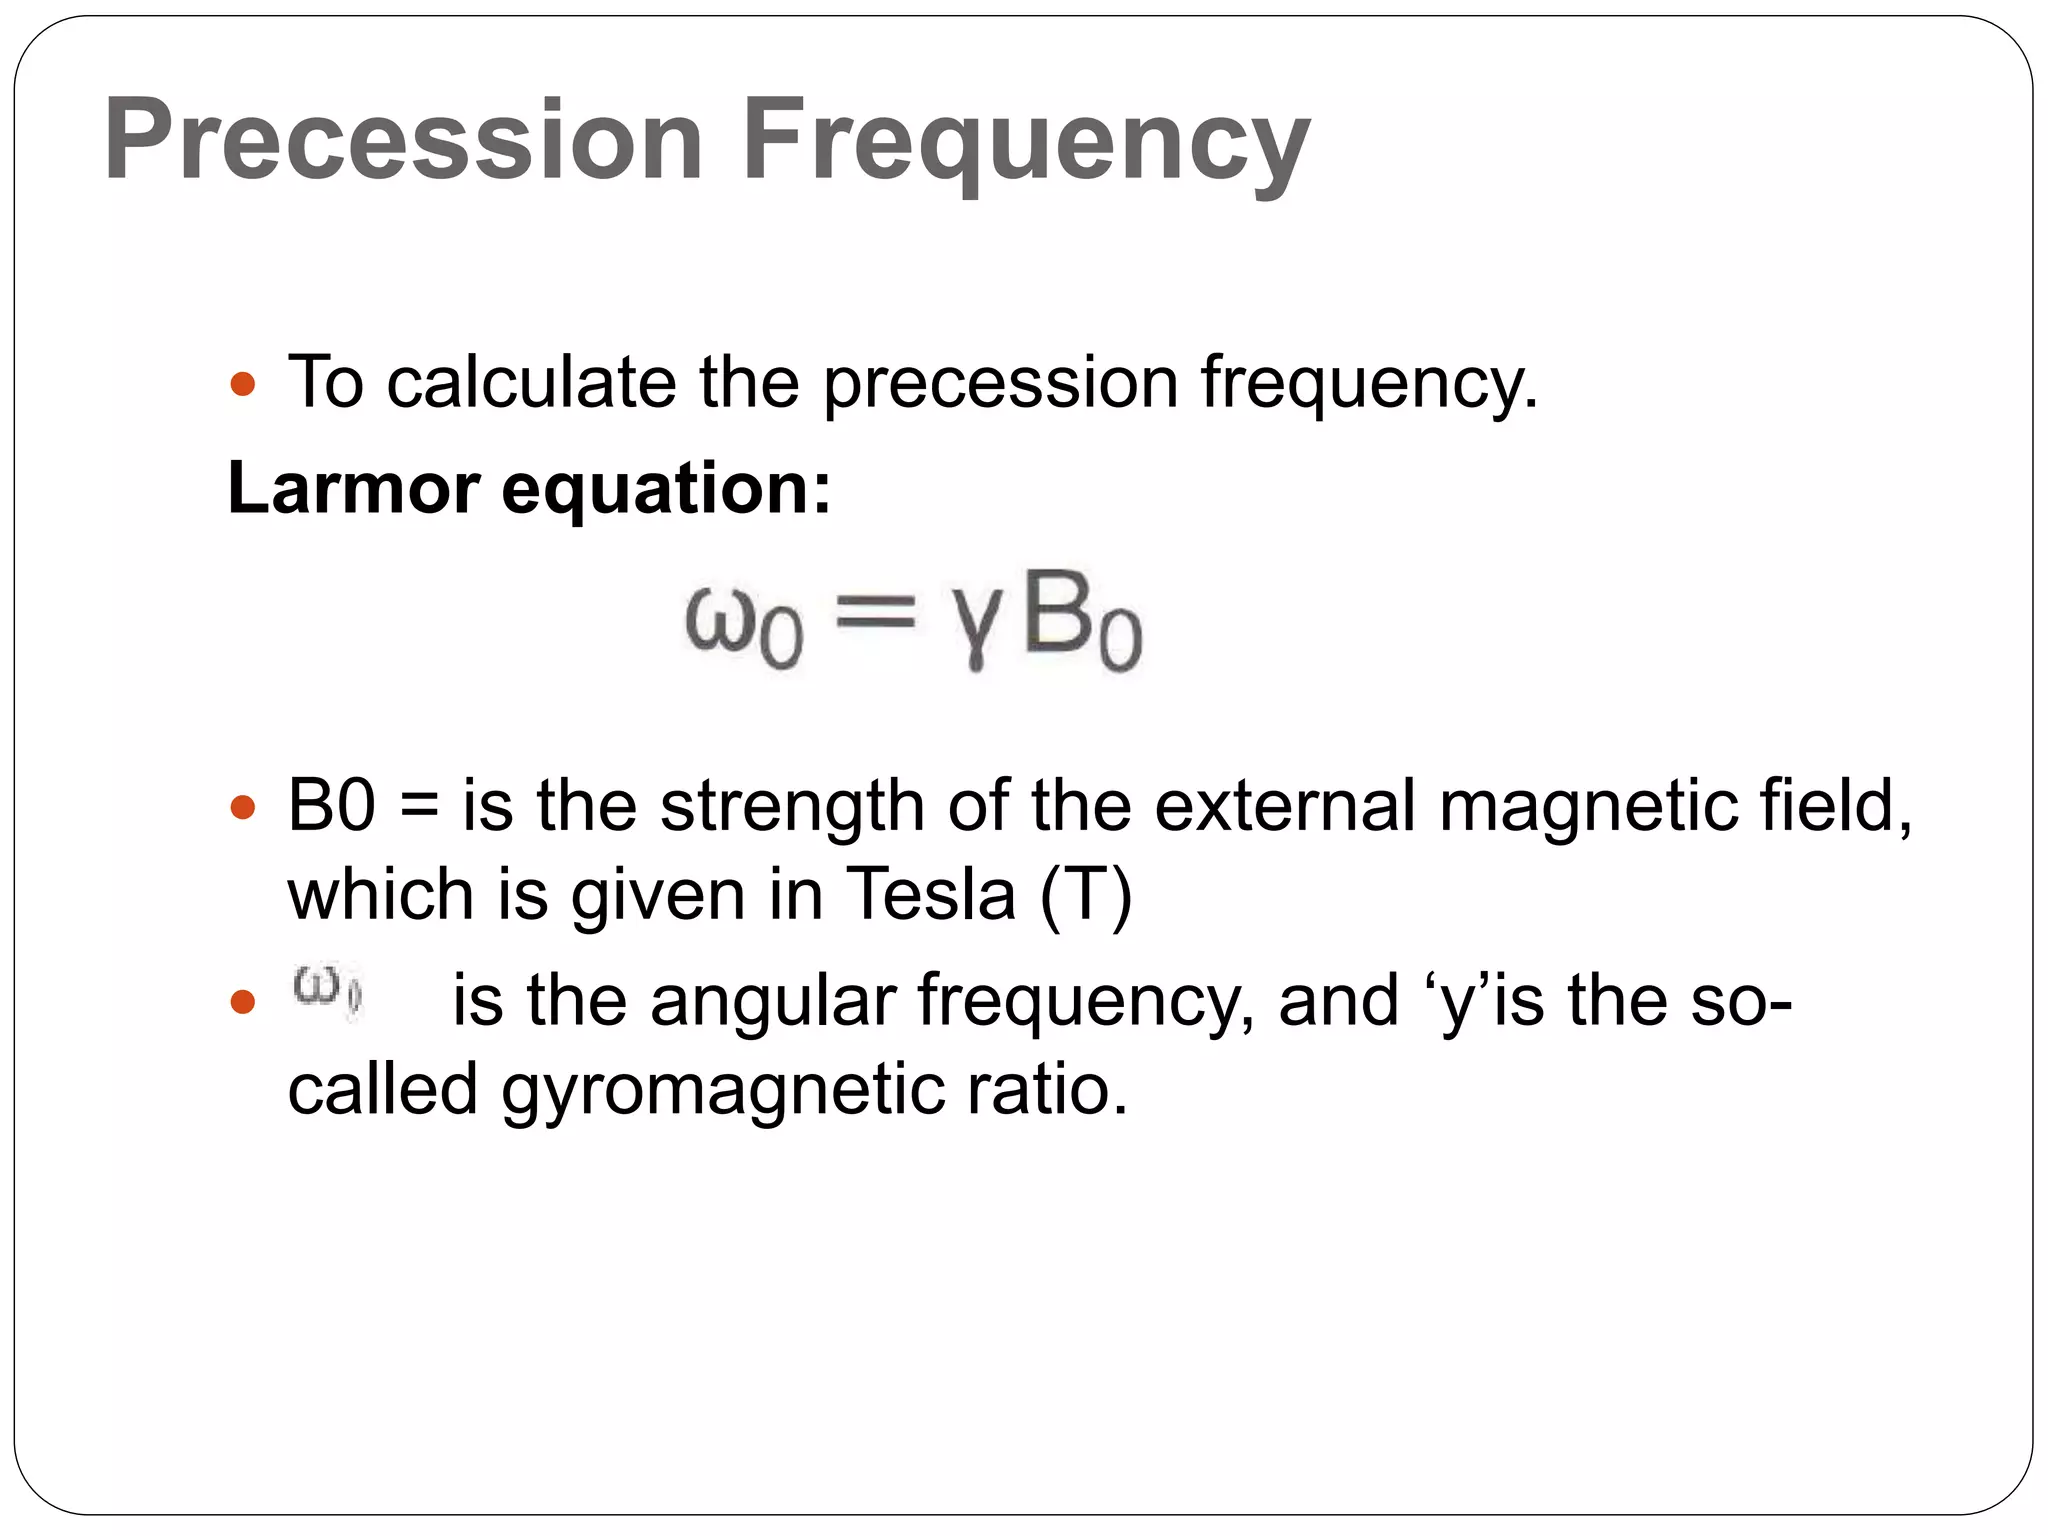
MRI operates on nuclear magnetic resonance principles, focusing on protonsâ alignment and precession in magnetic fields.
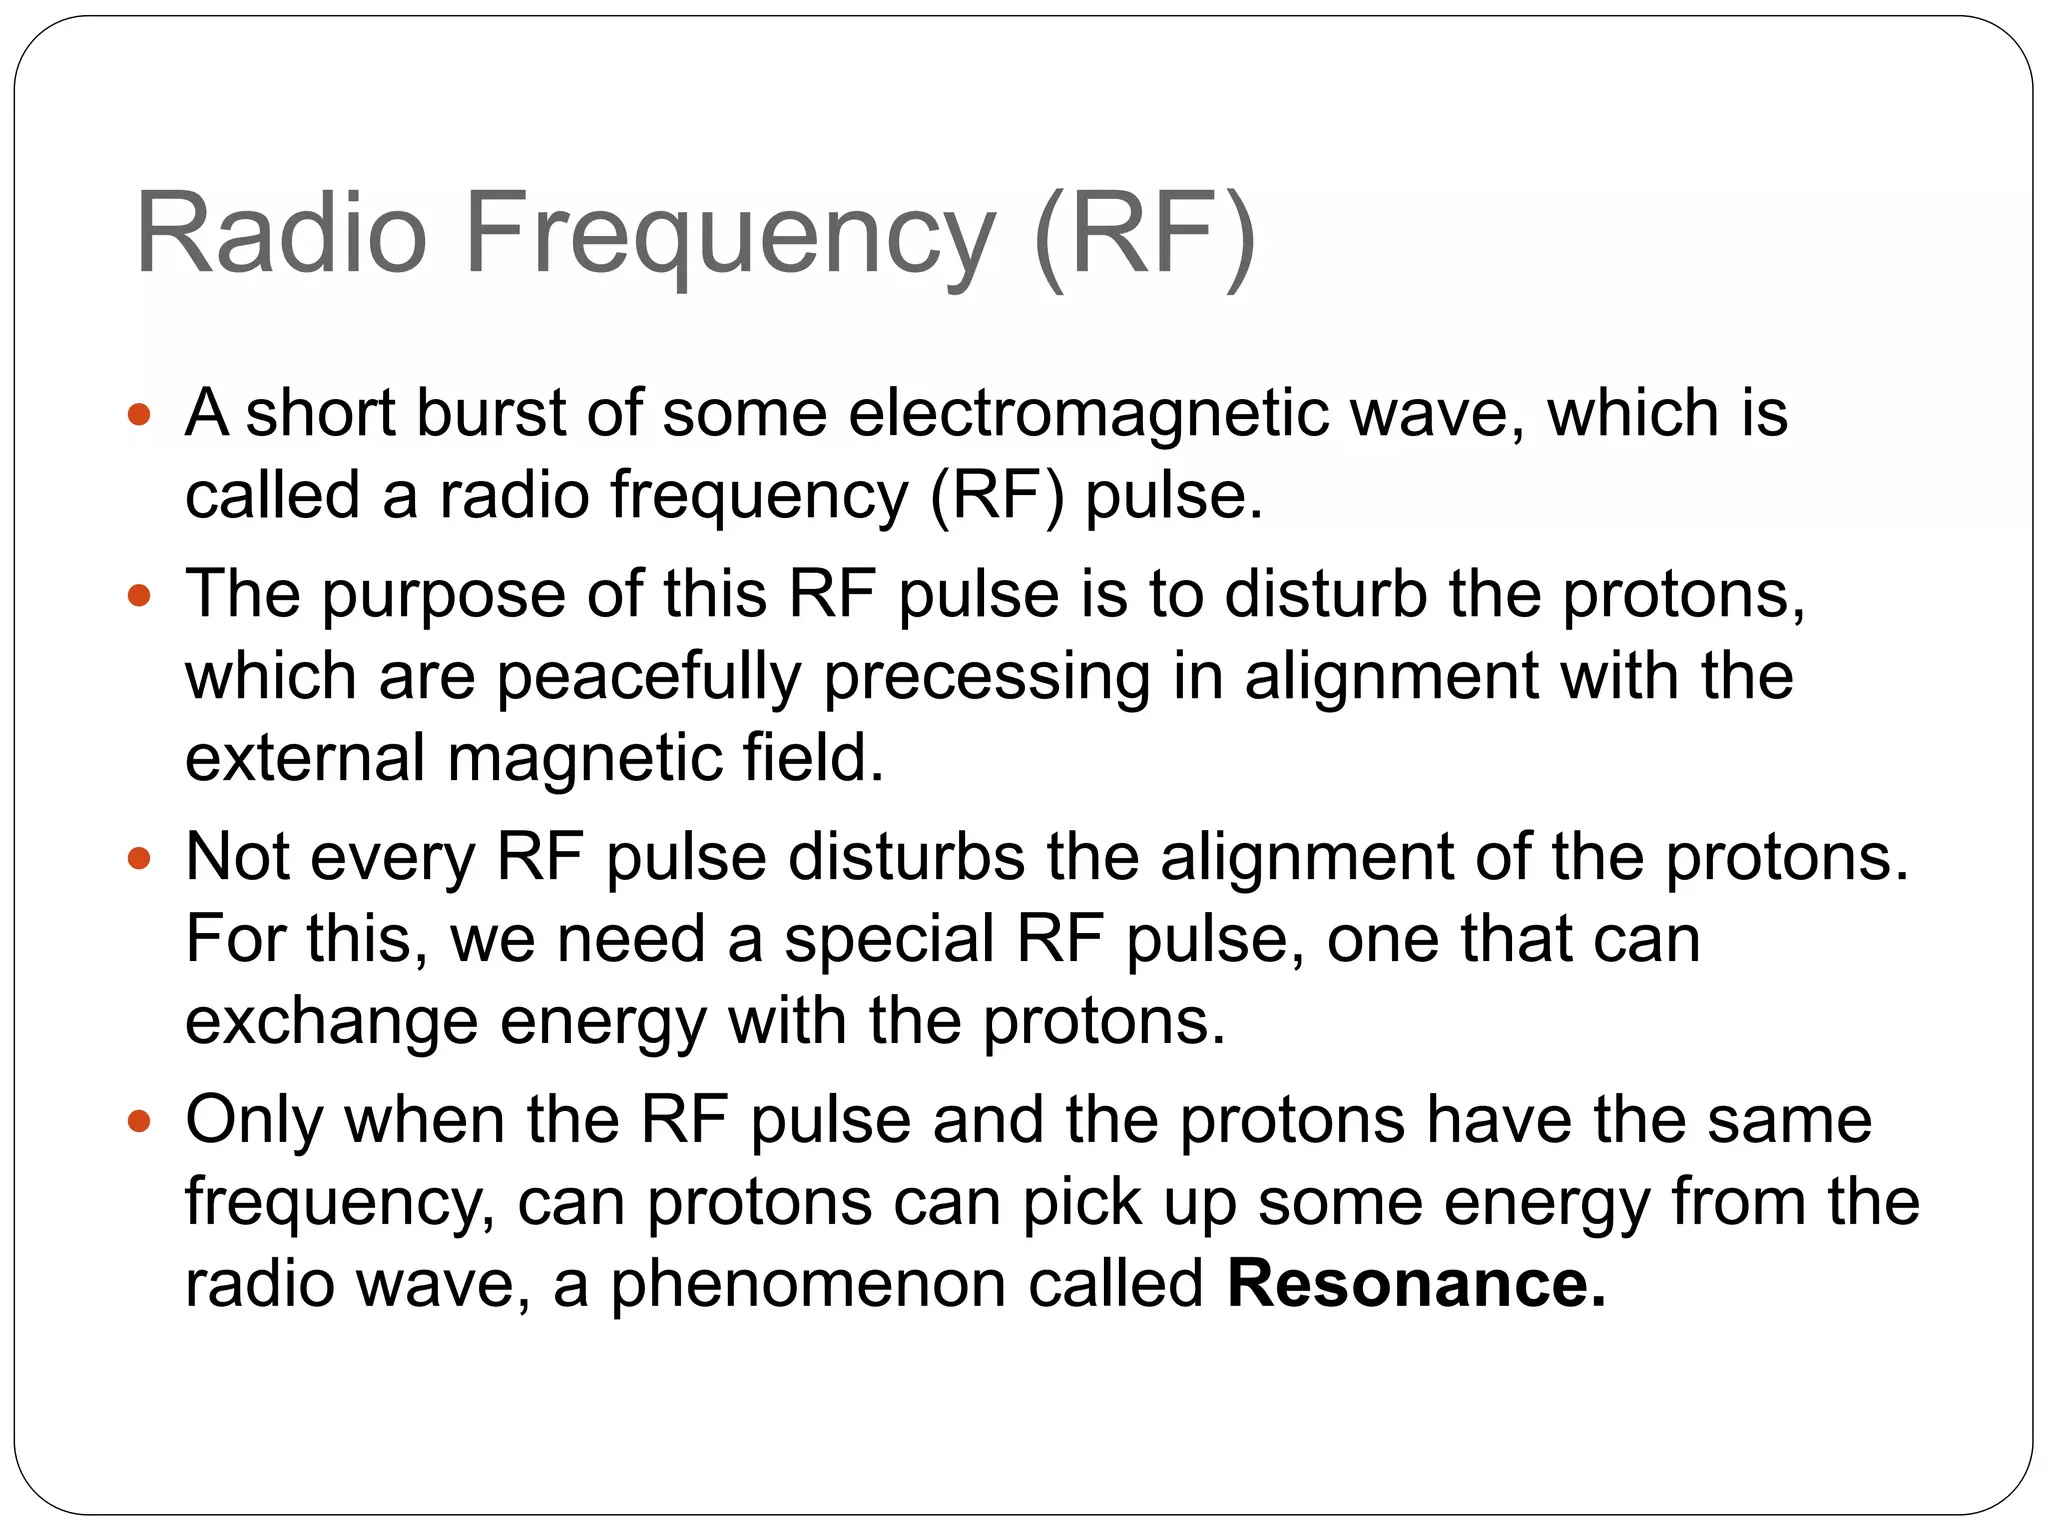
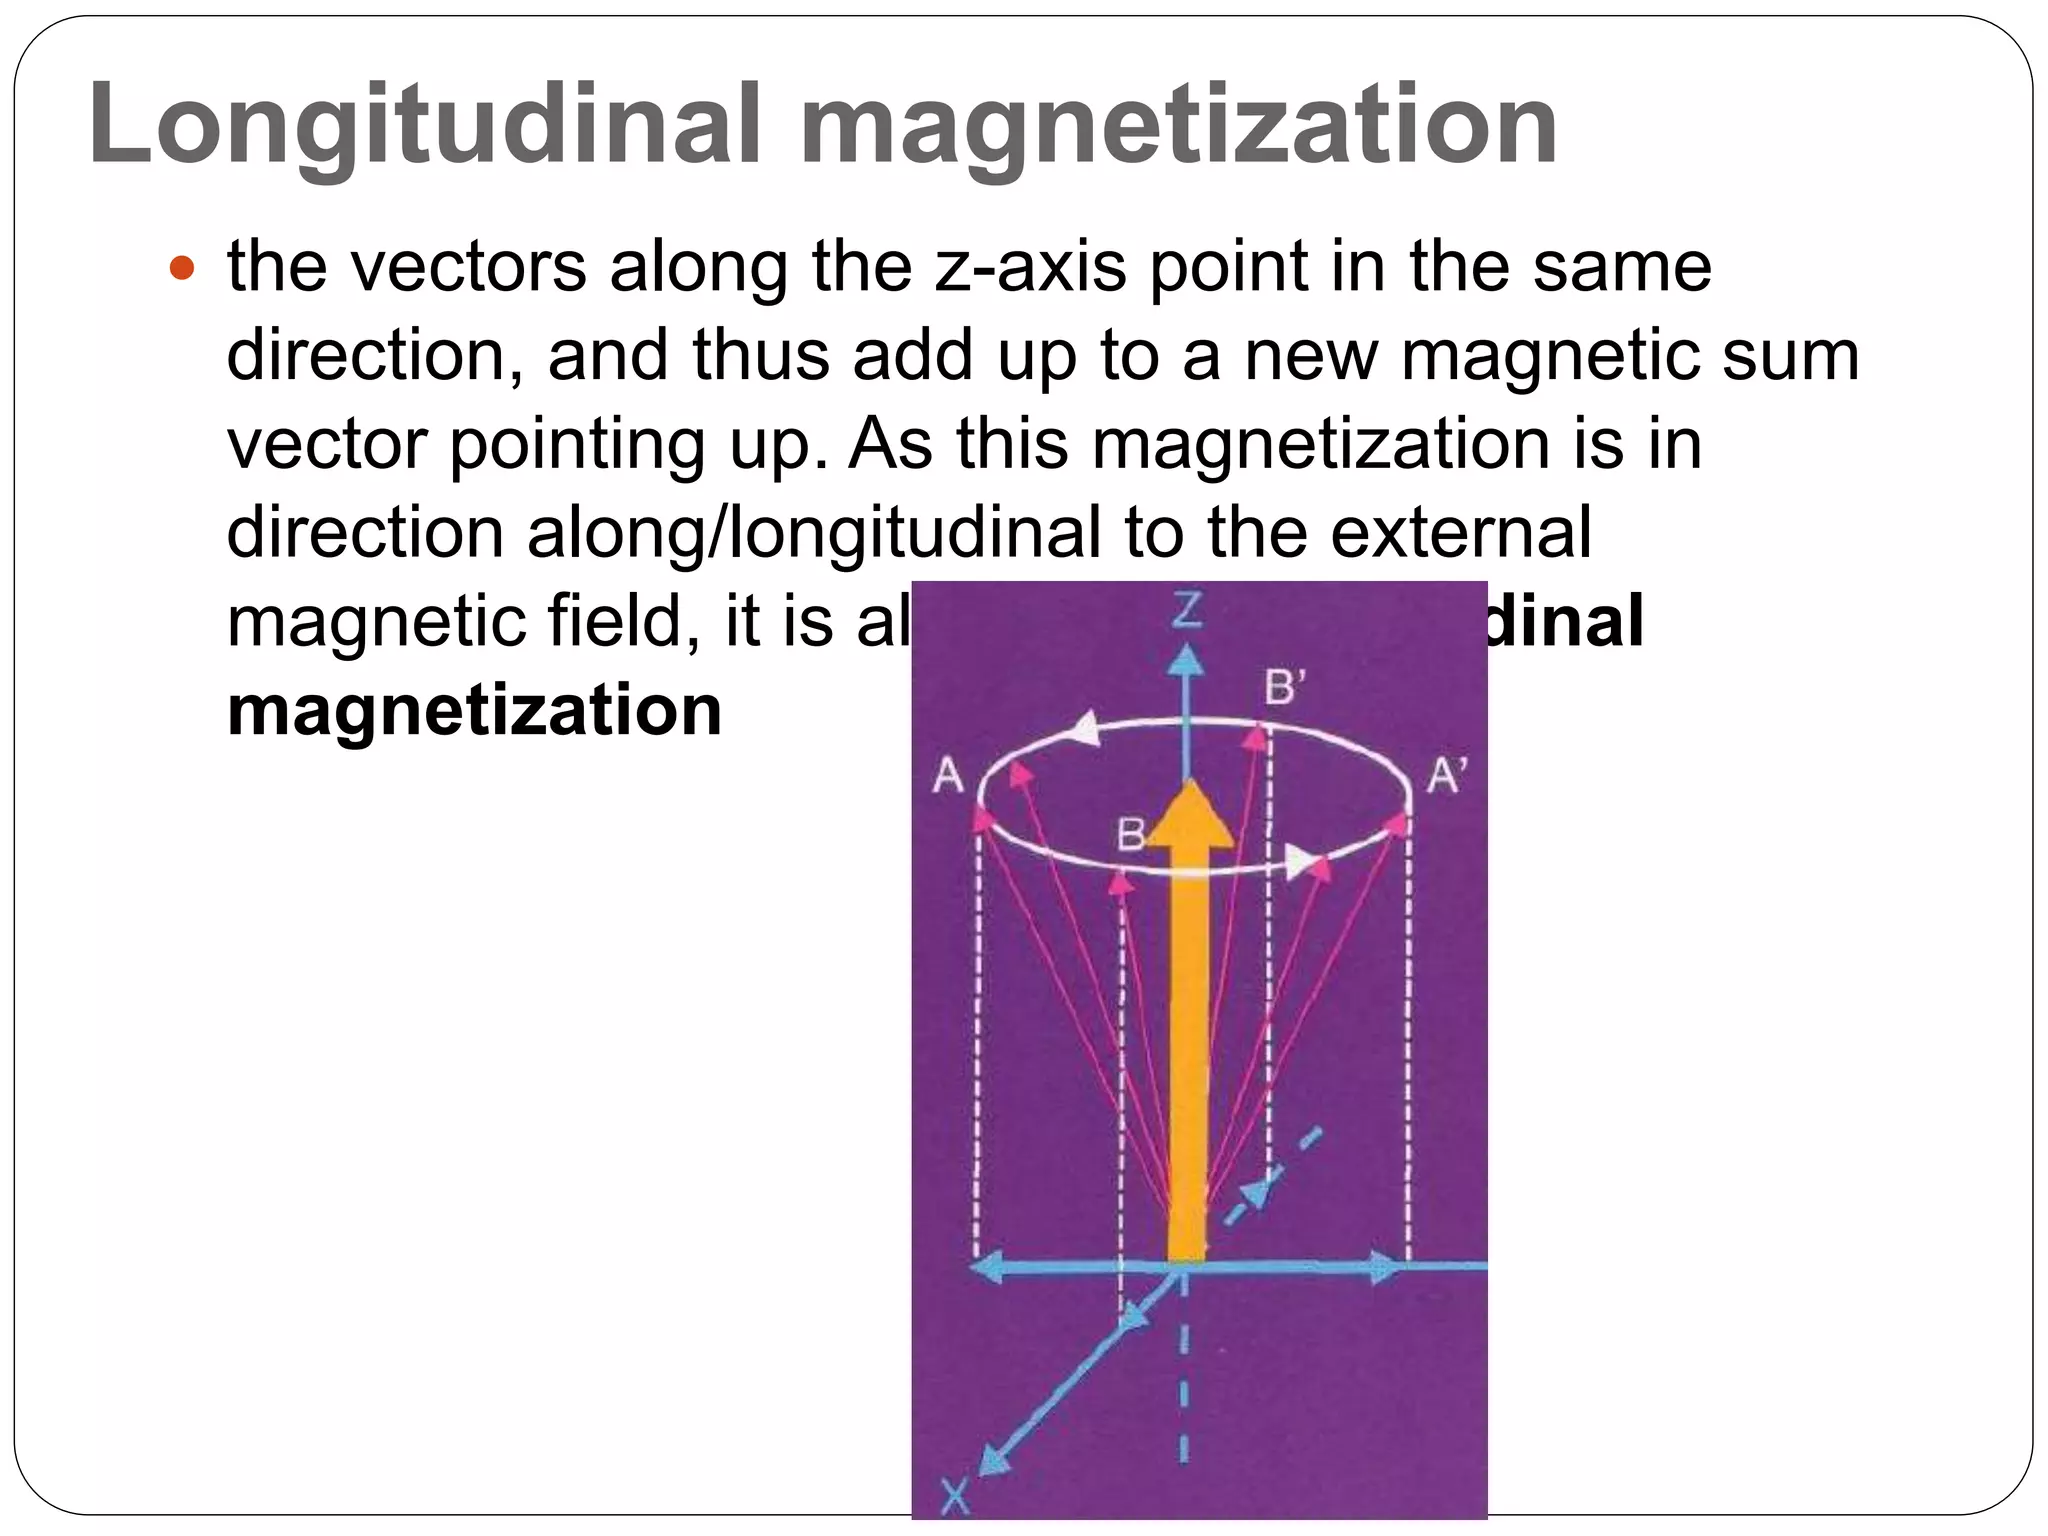
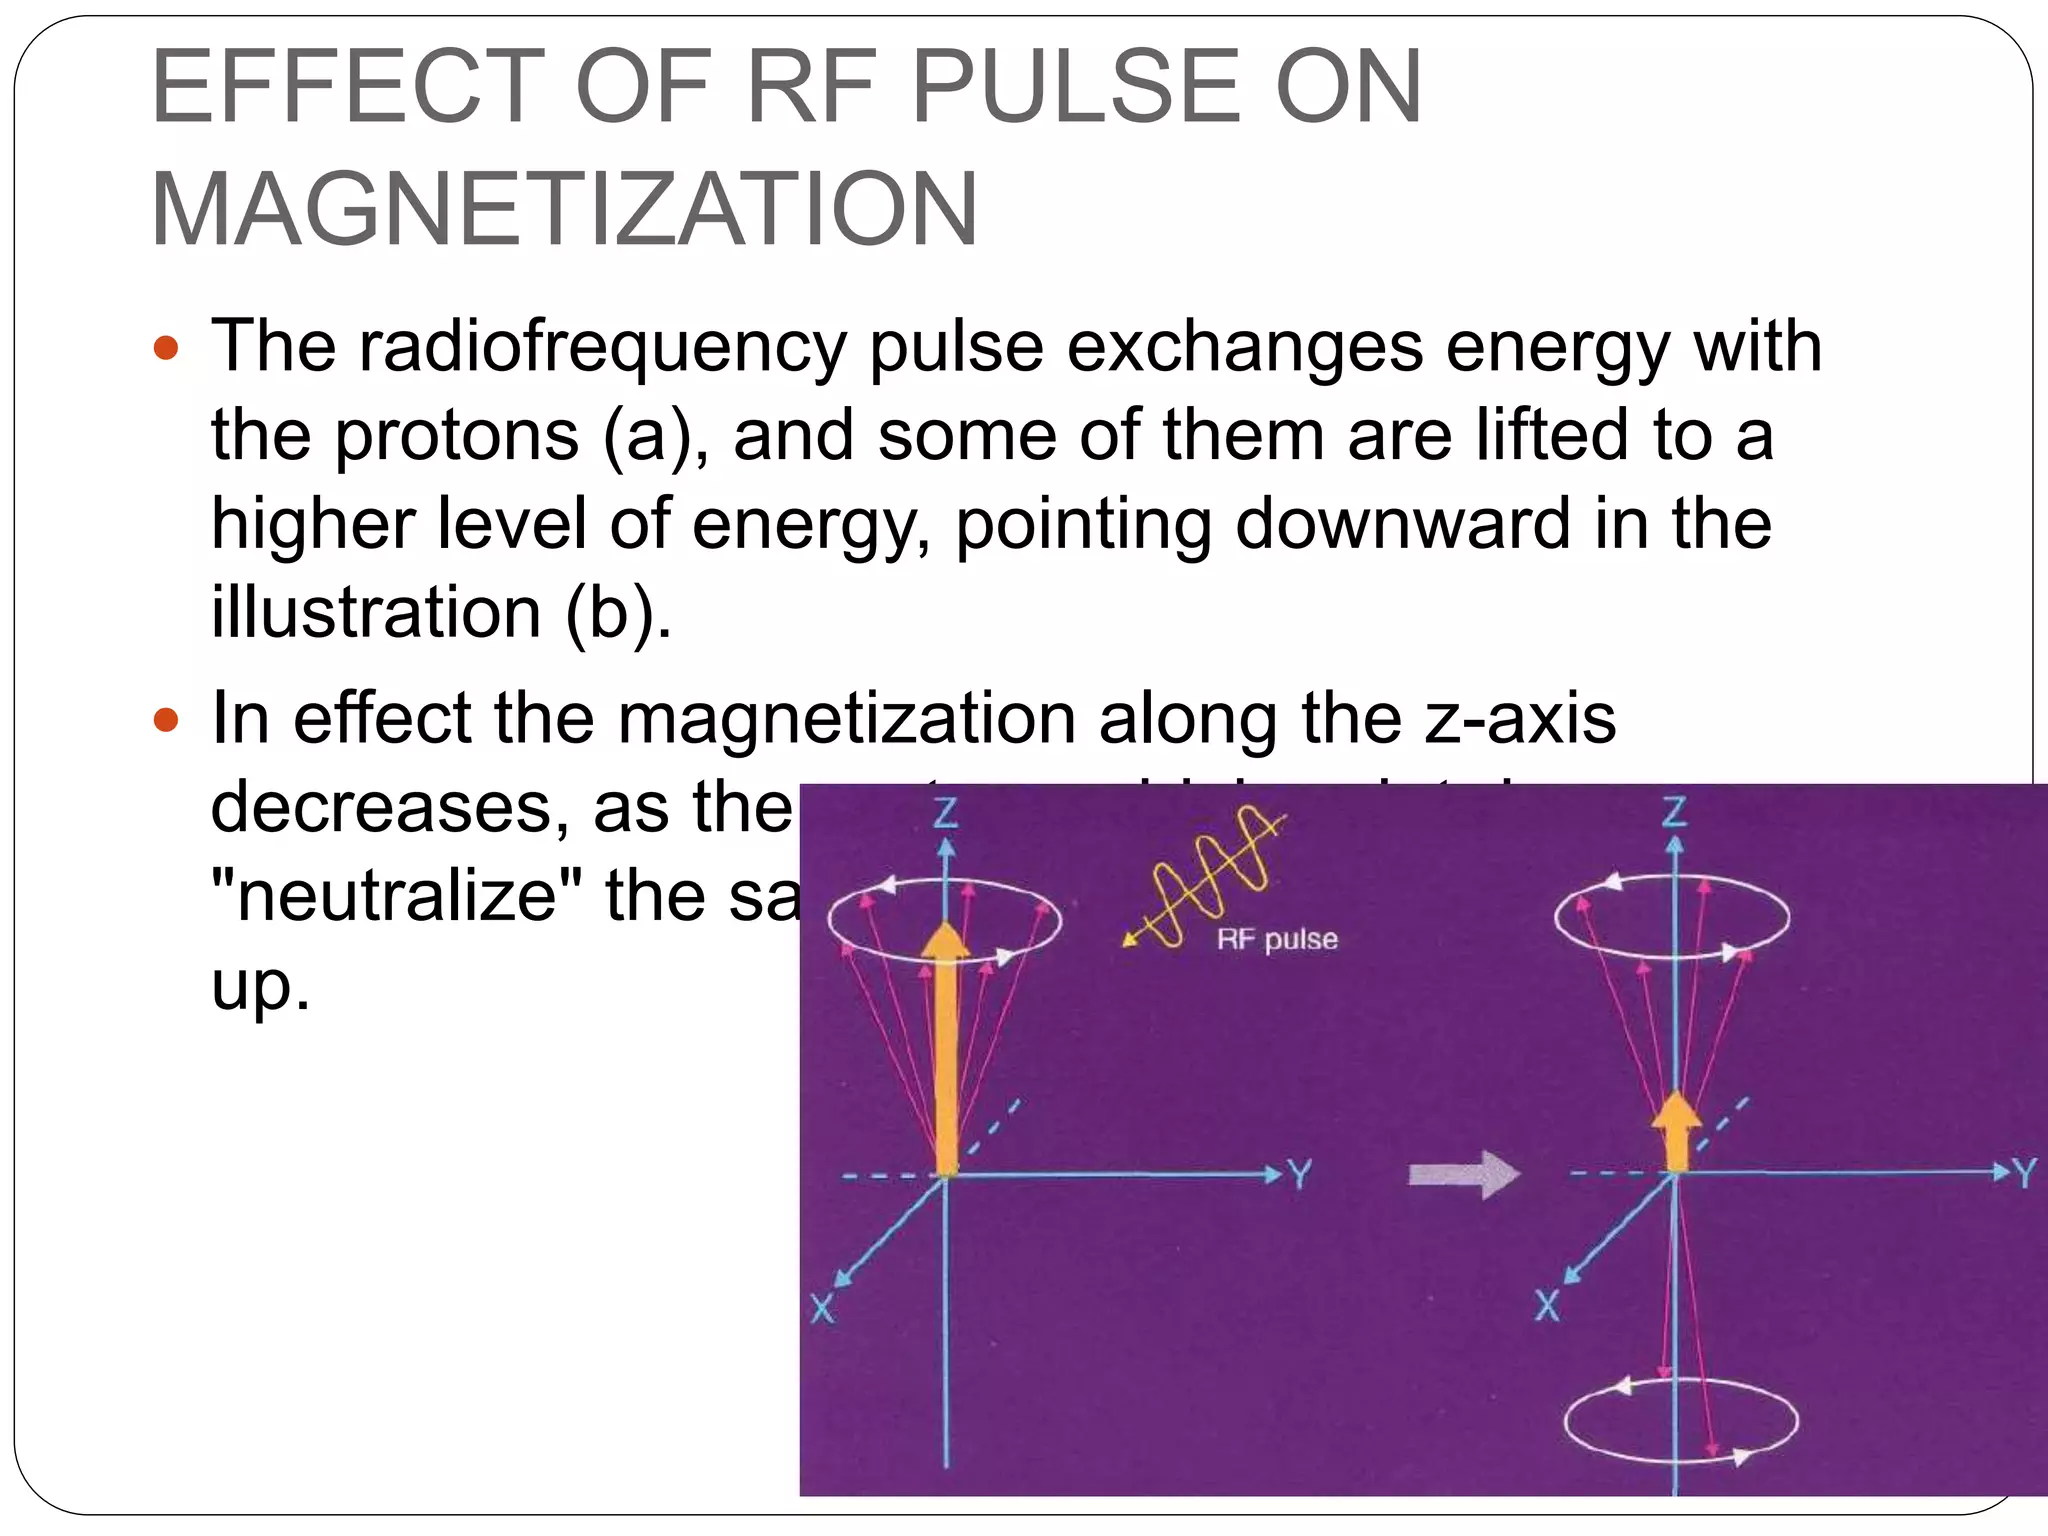
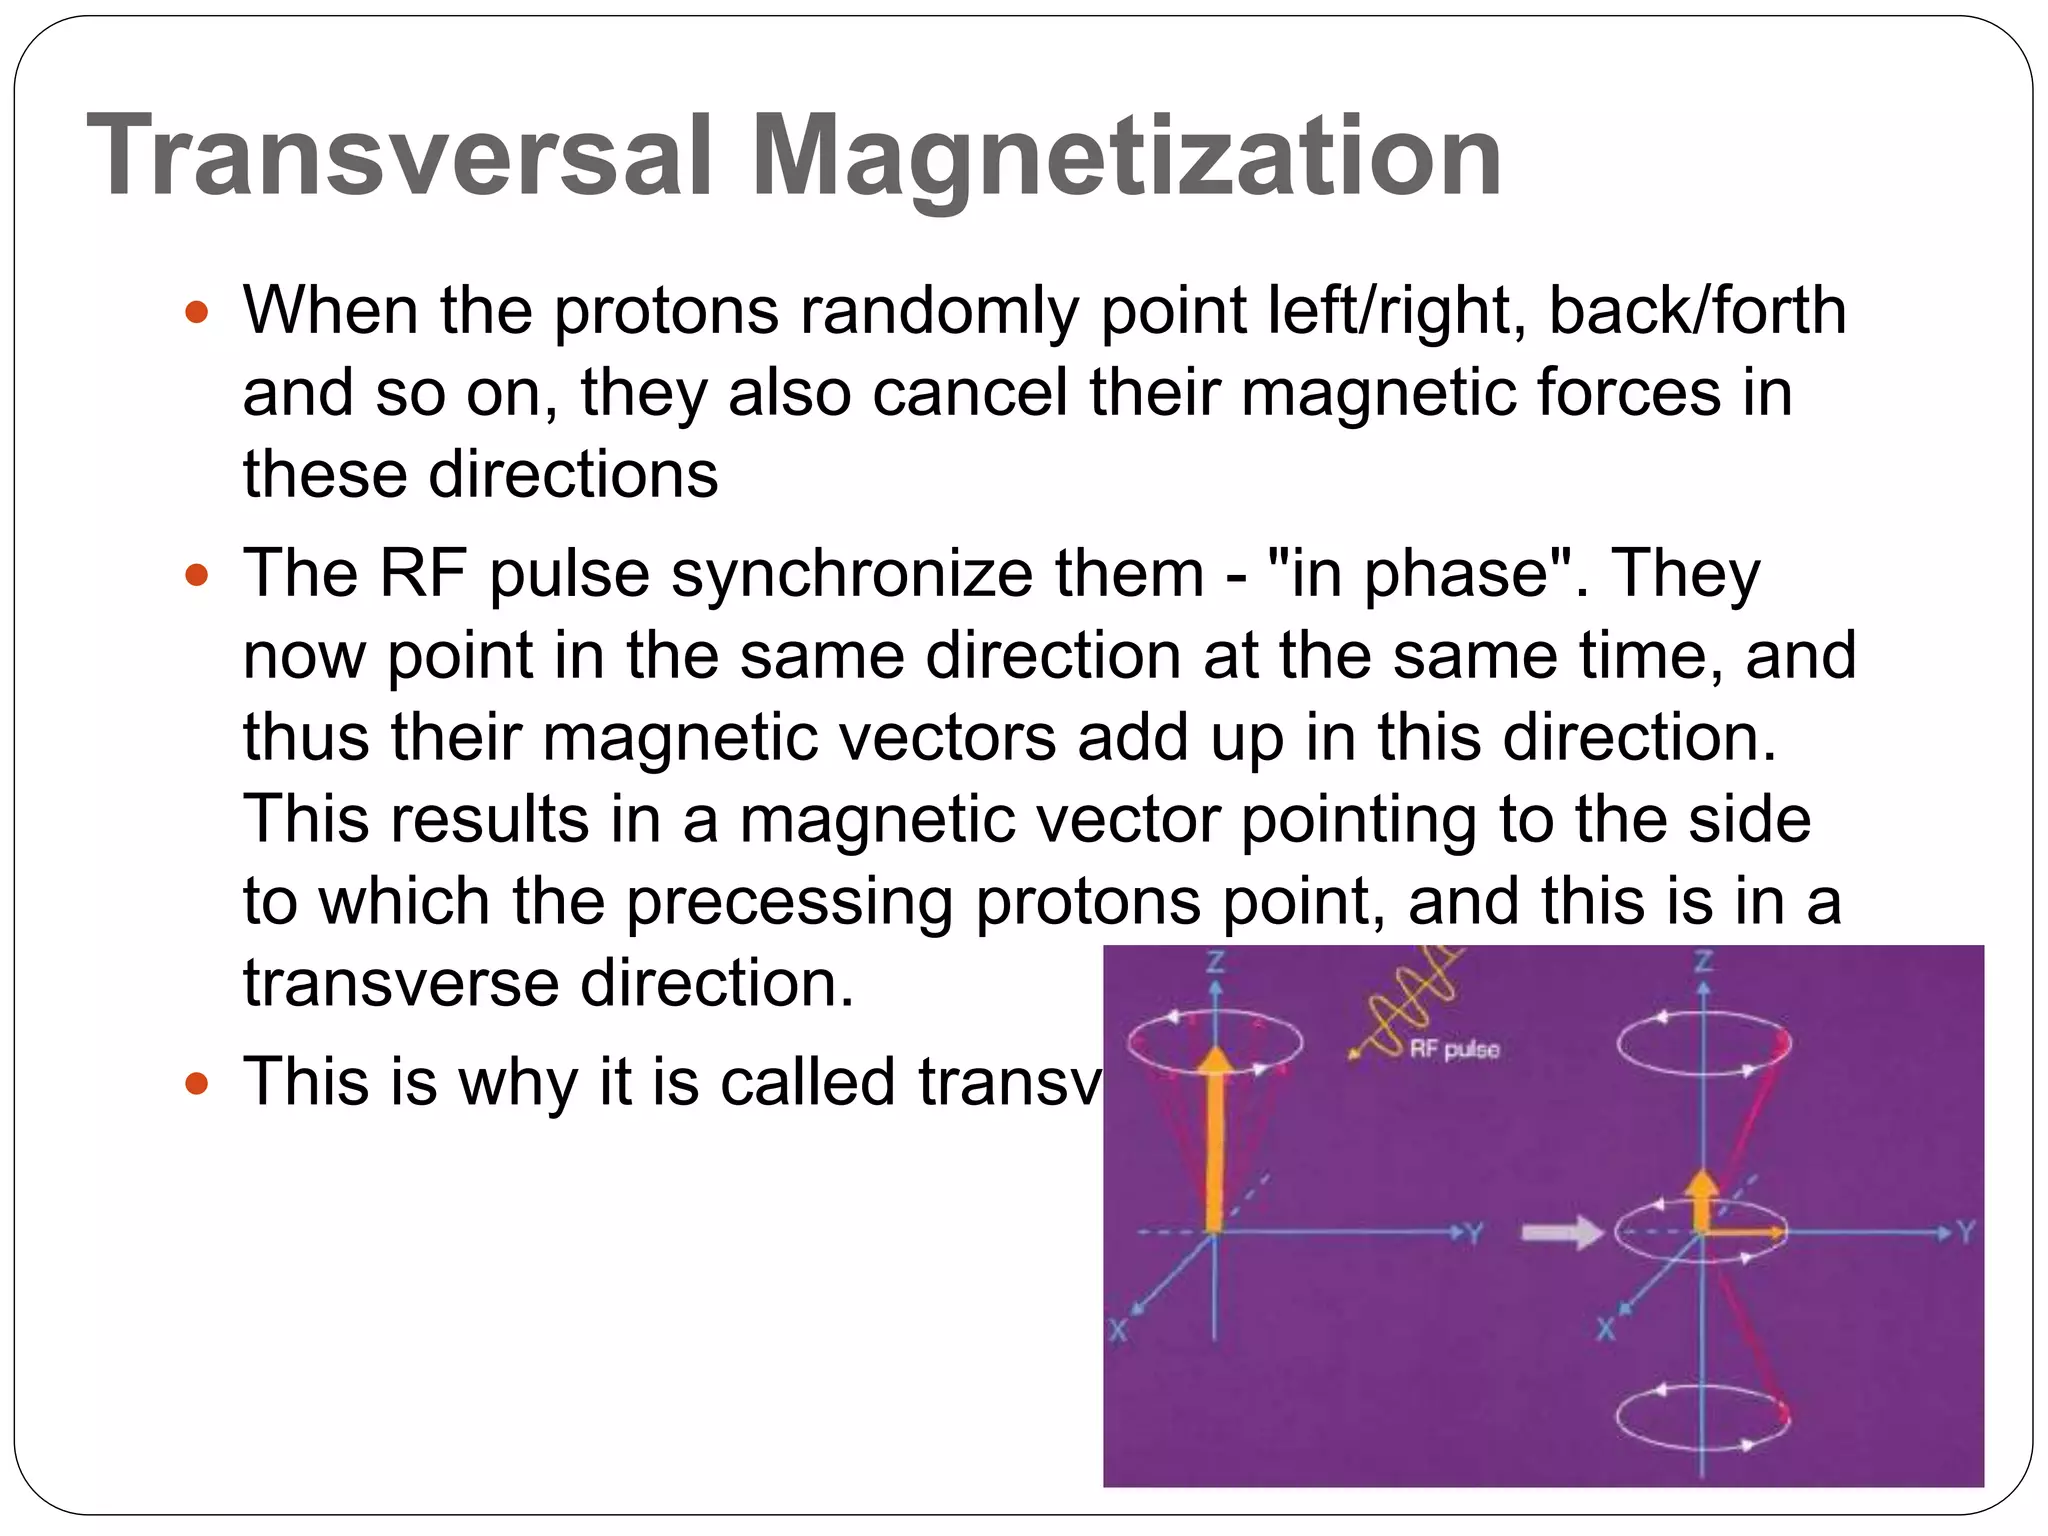
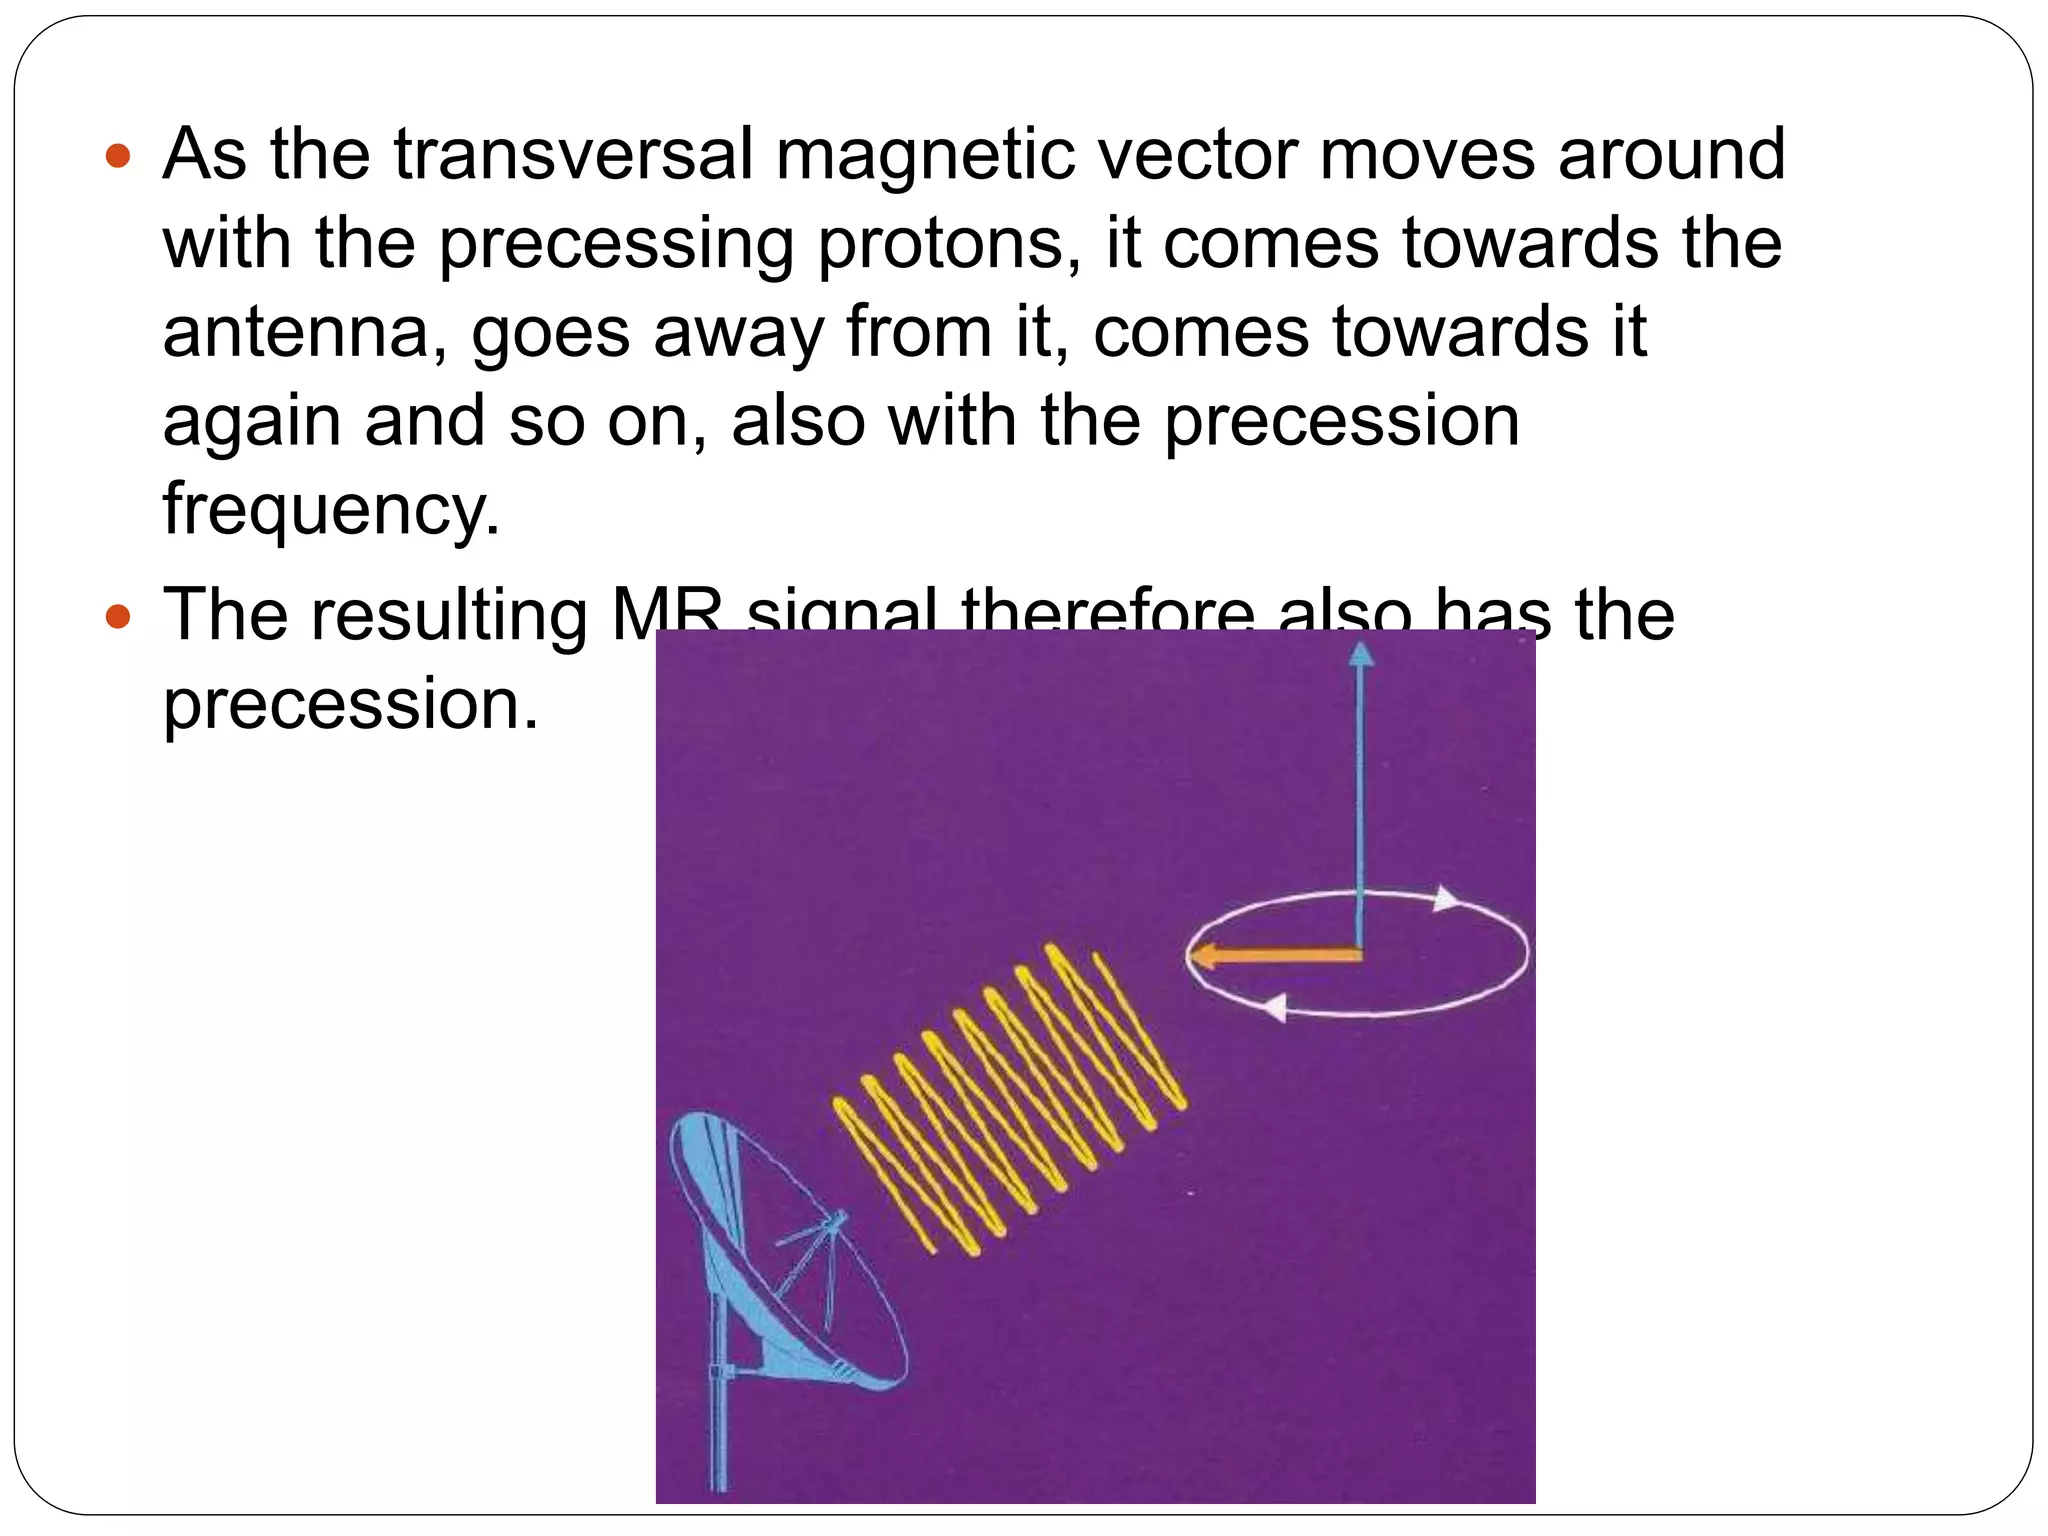
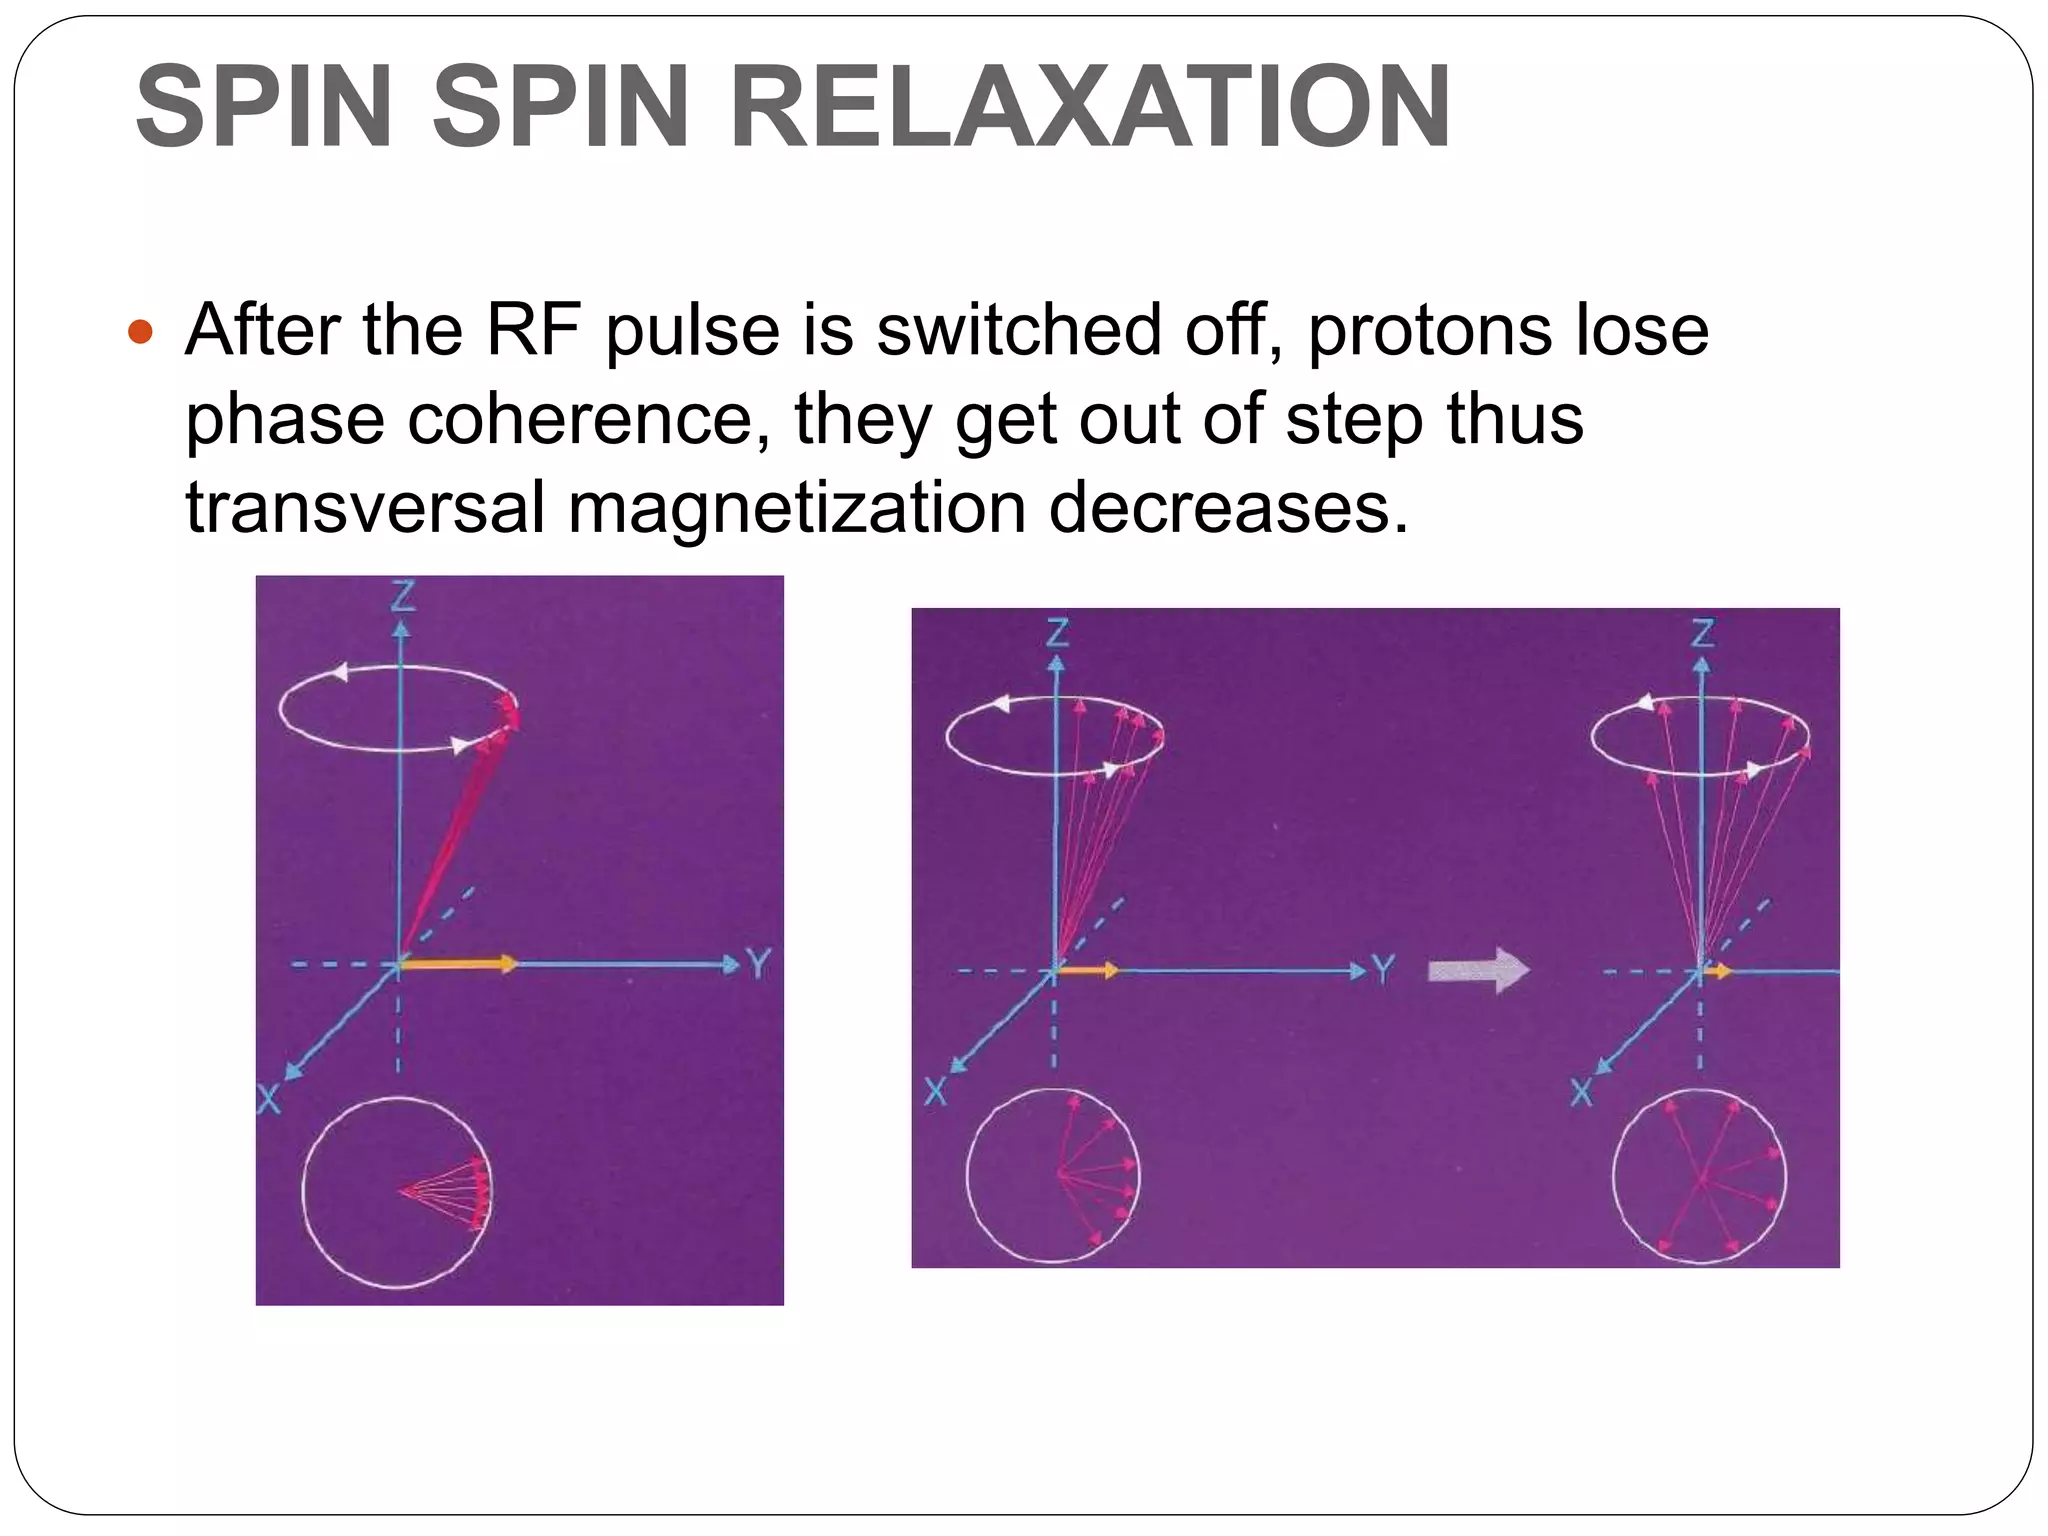
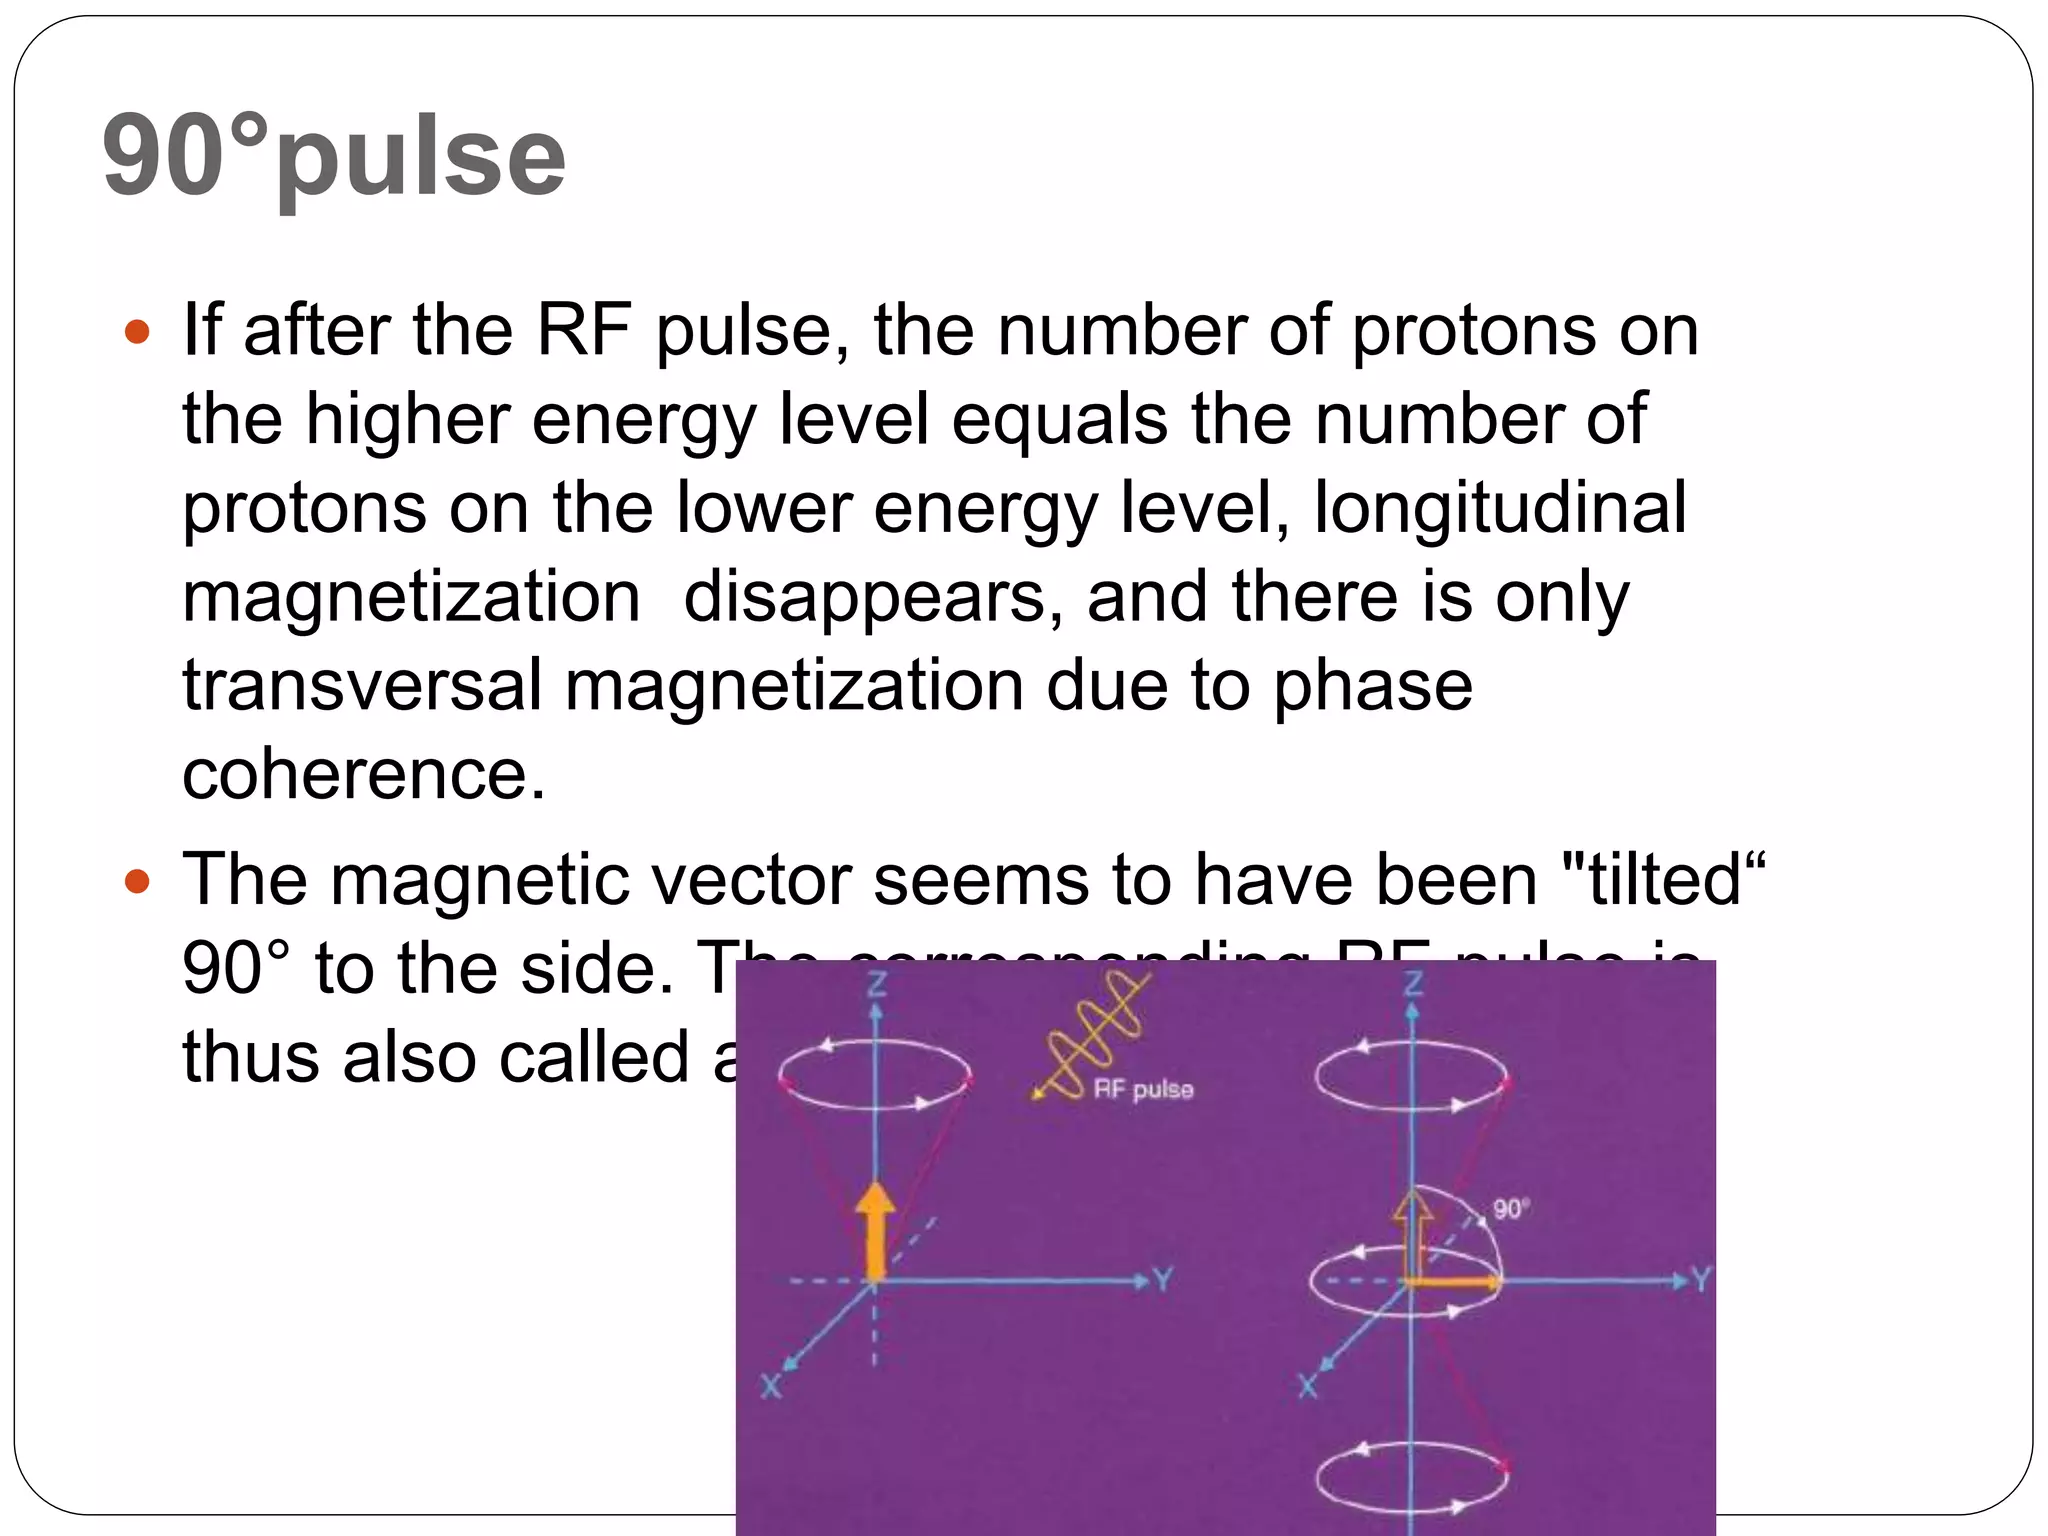
Explains RF pulses' effects on protonsâ alignment and magnetization. Concepts of longitudinal and transversal magnetization are clarified.
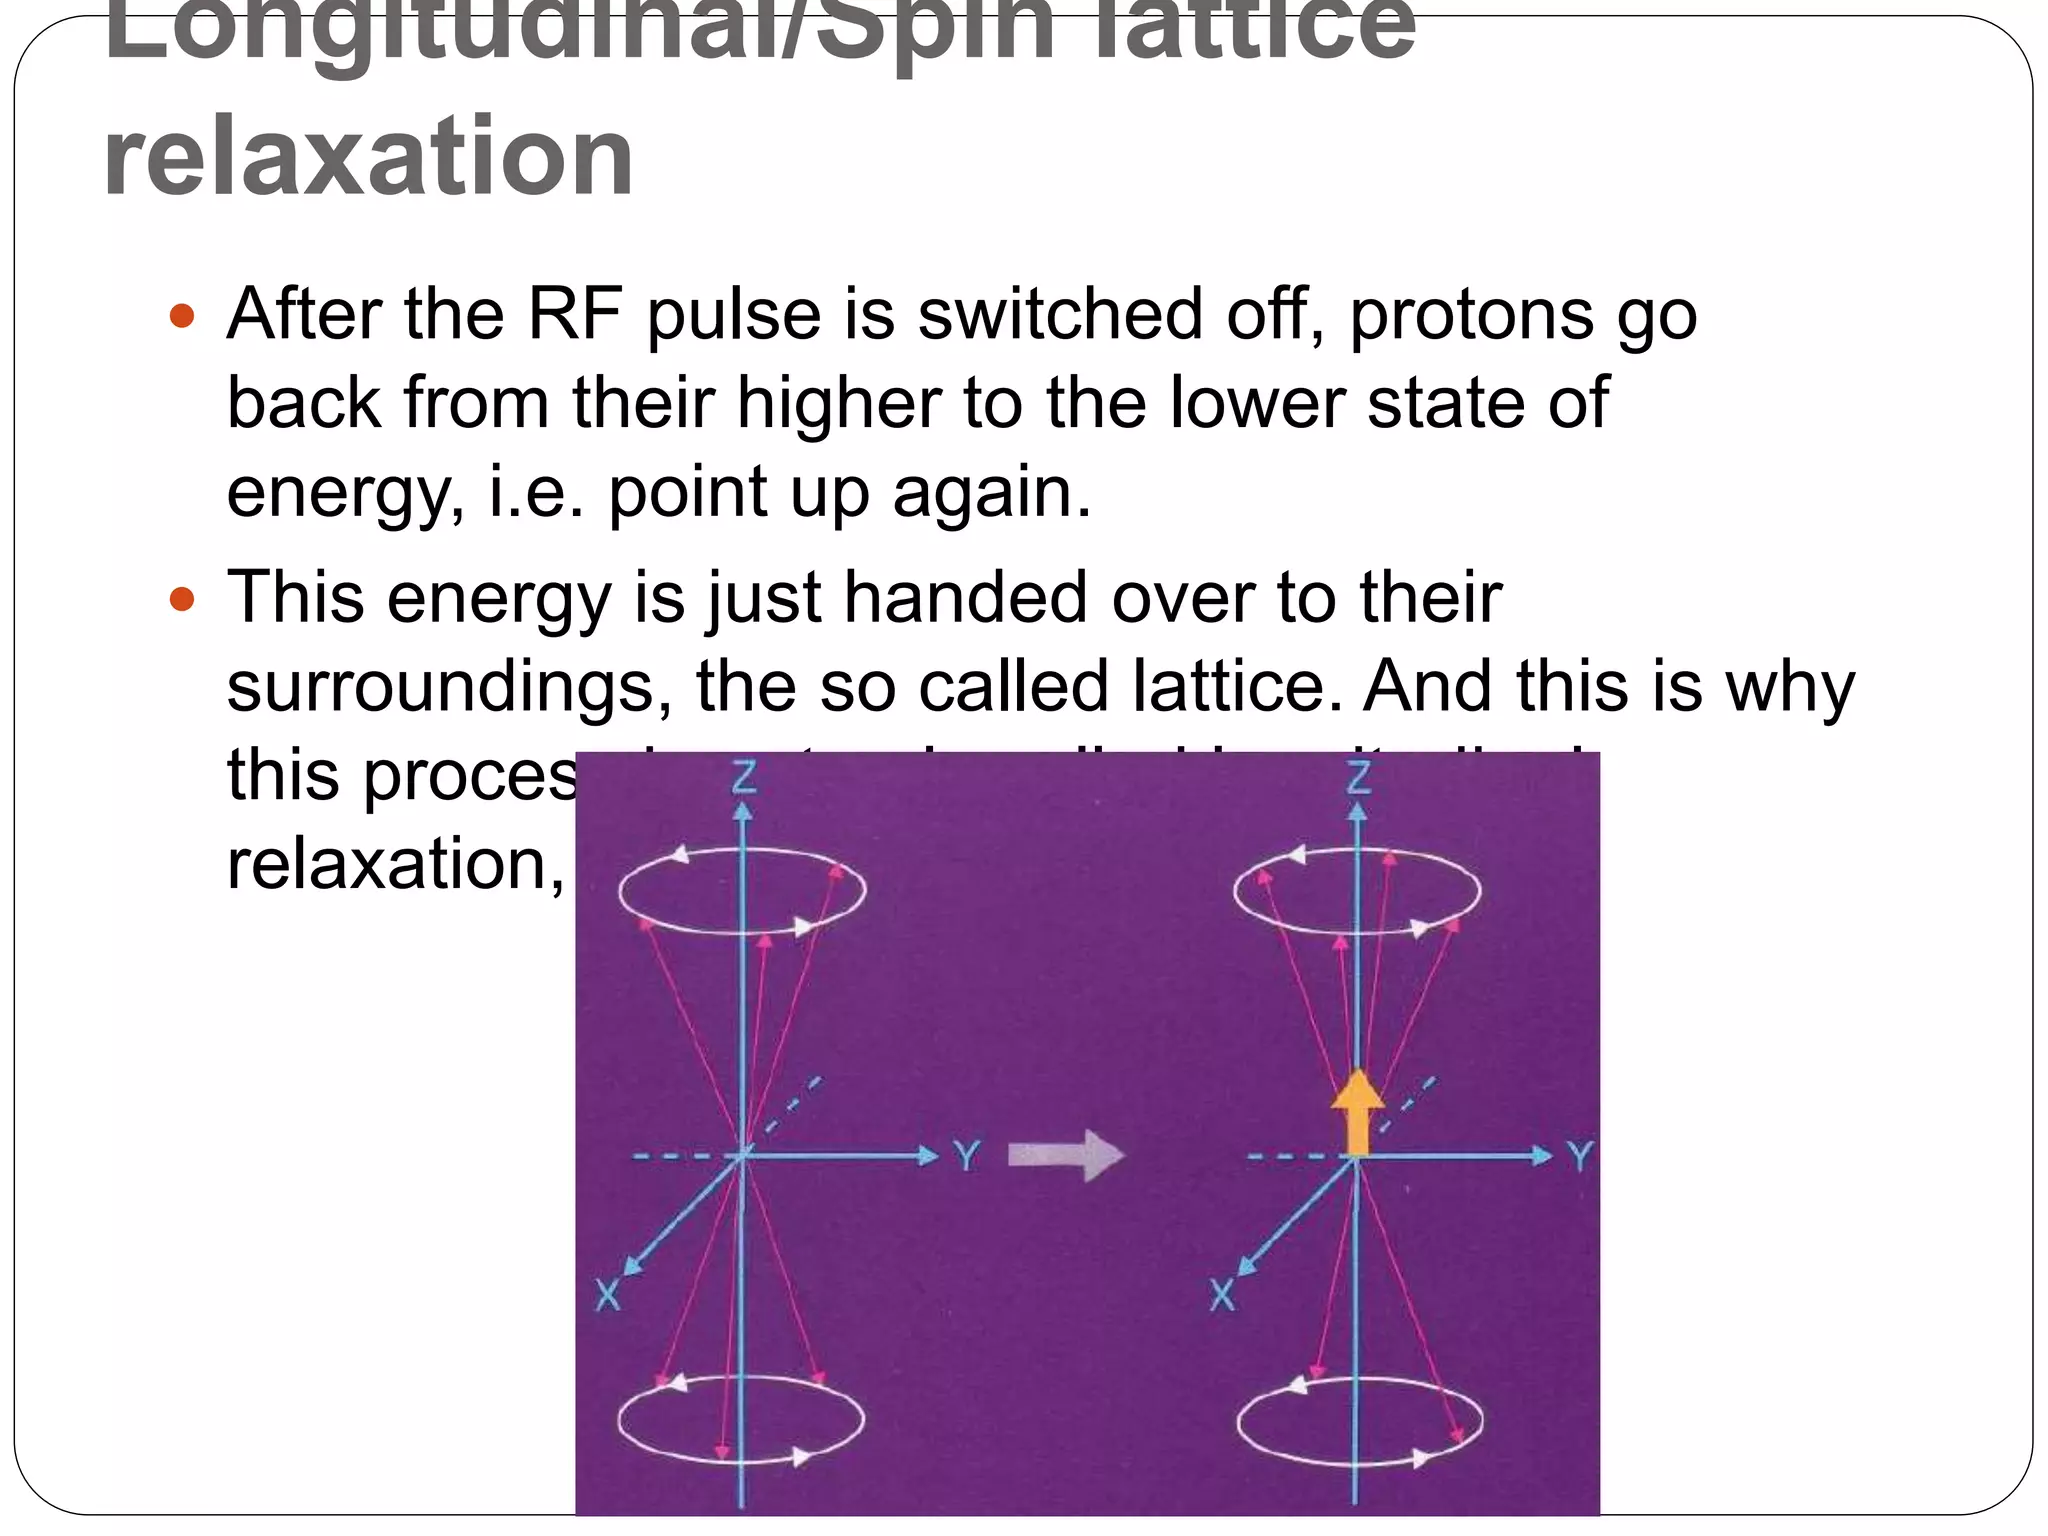
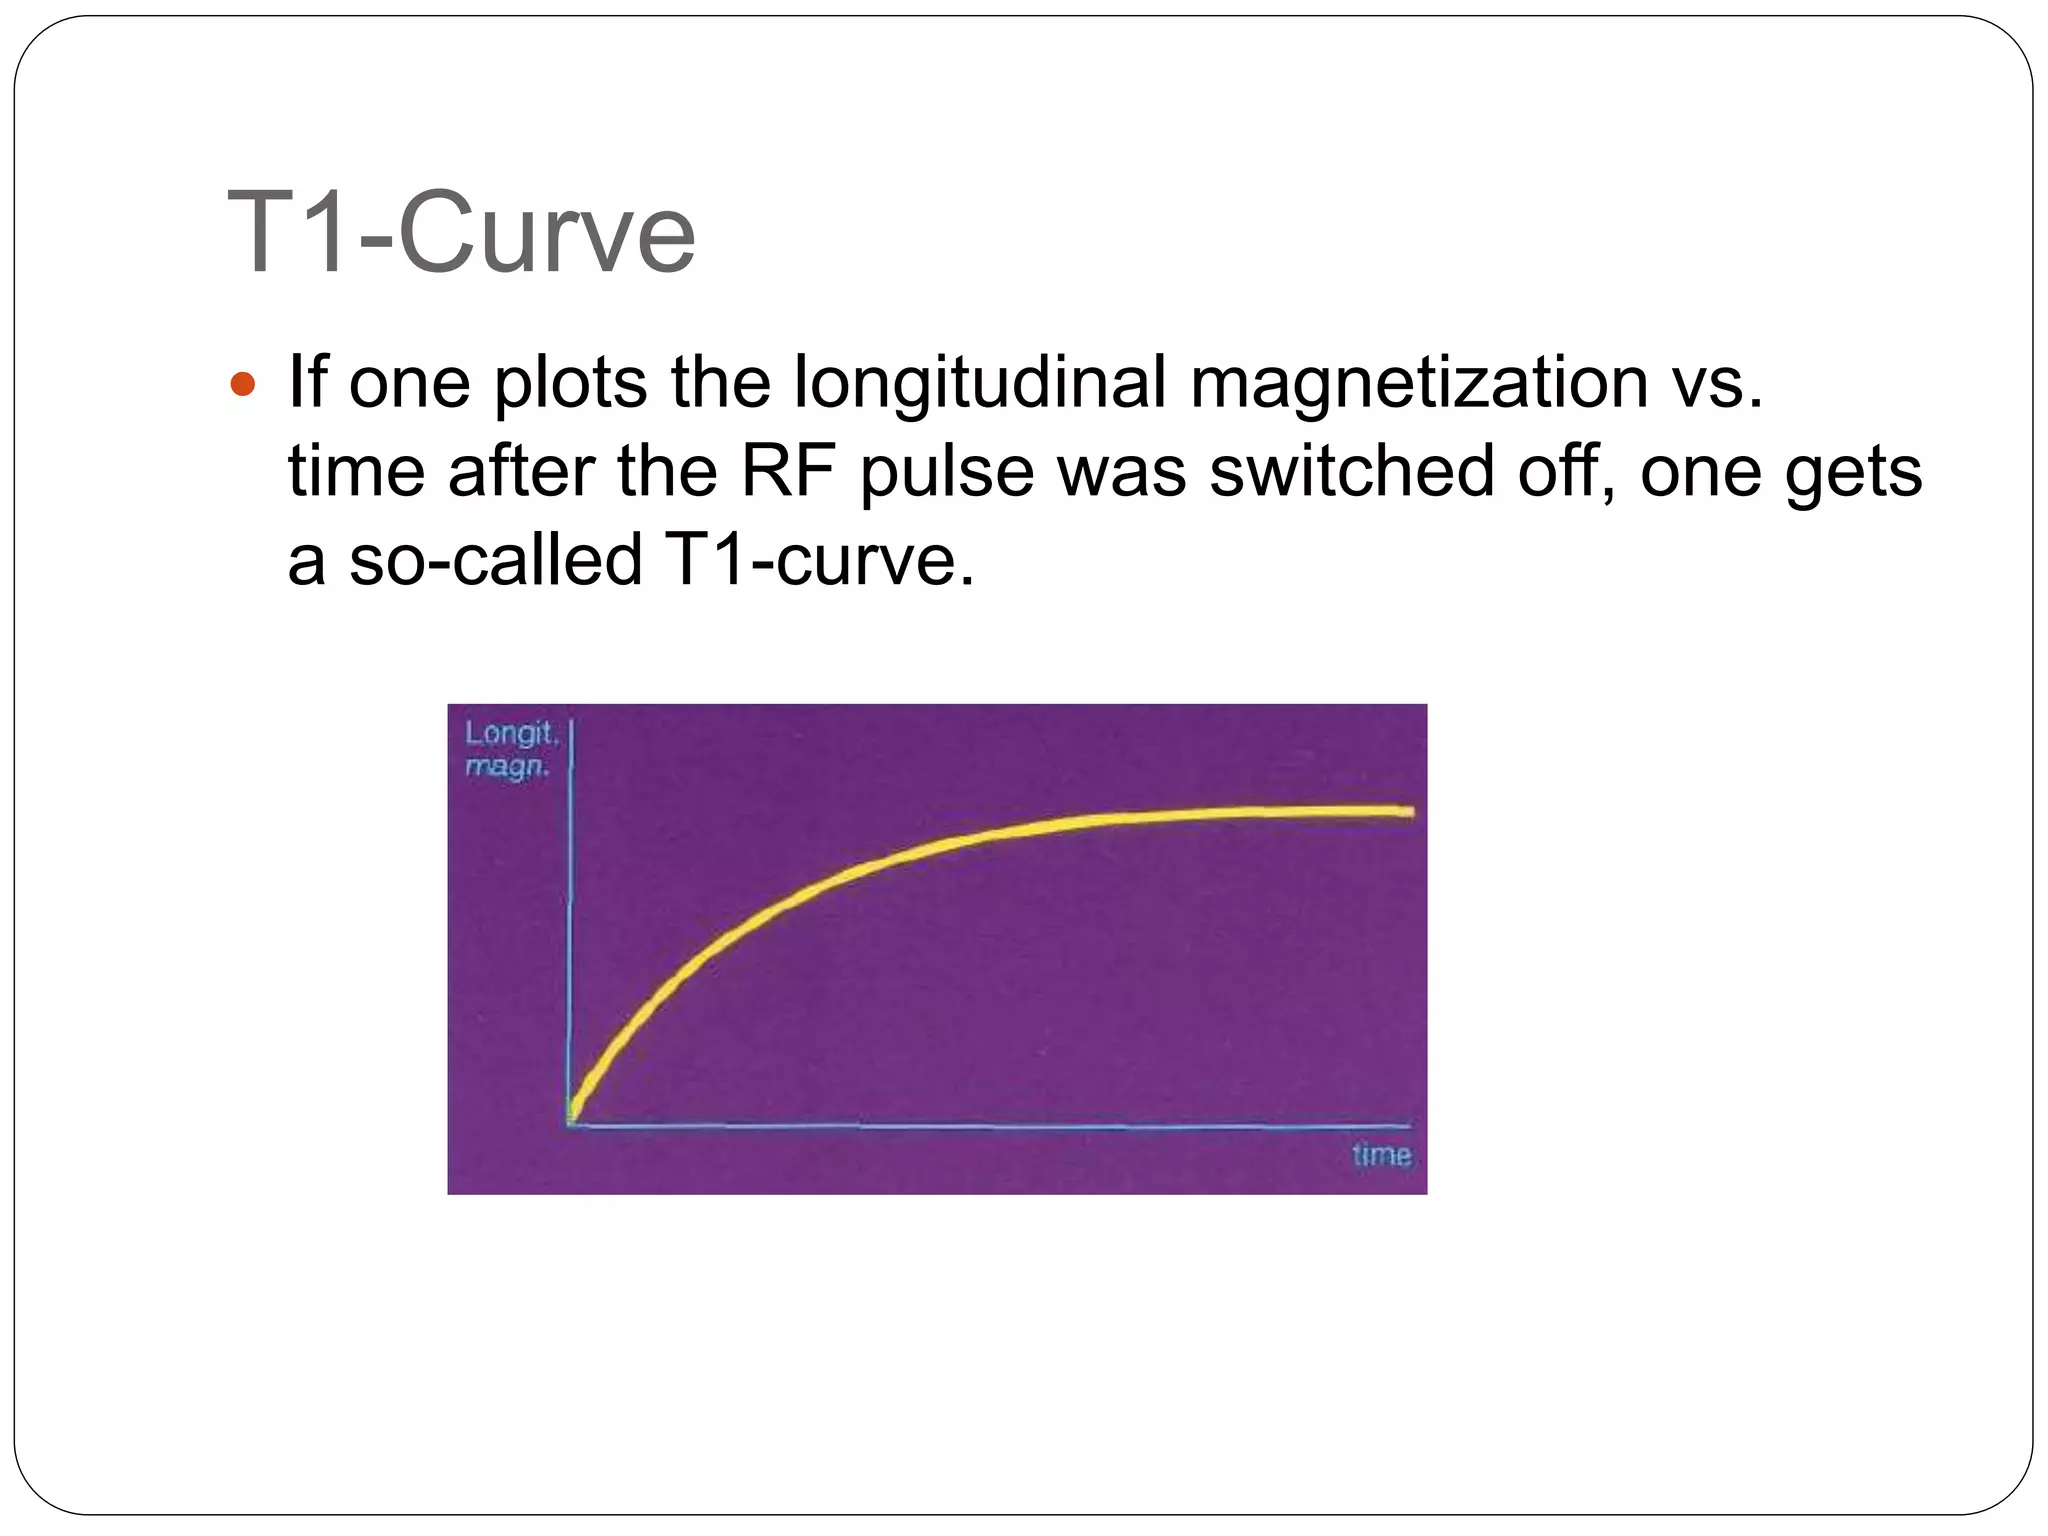
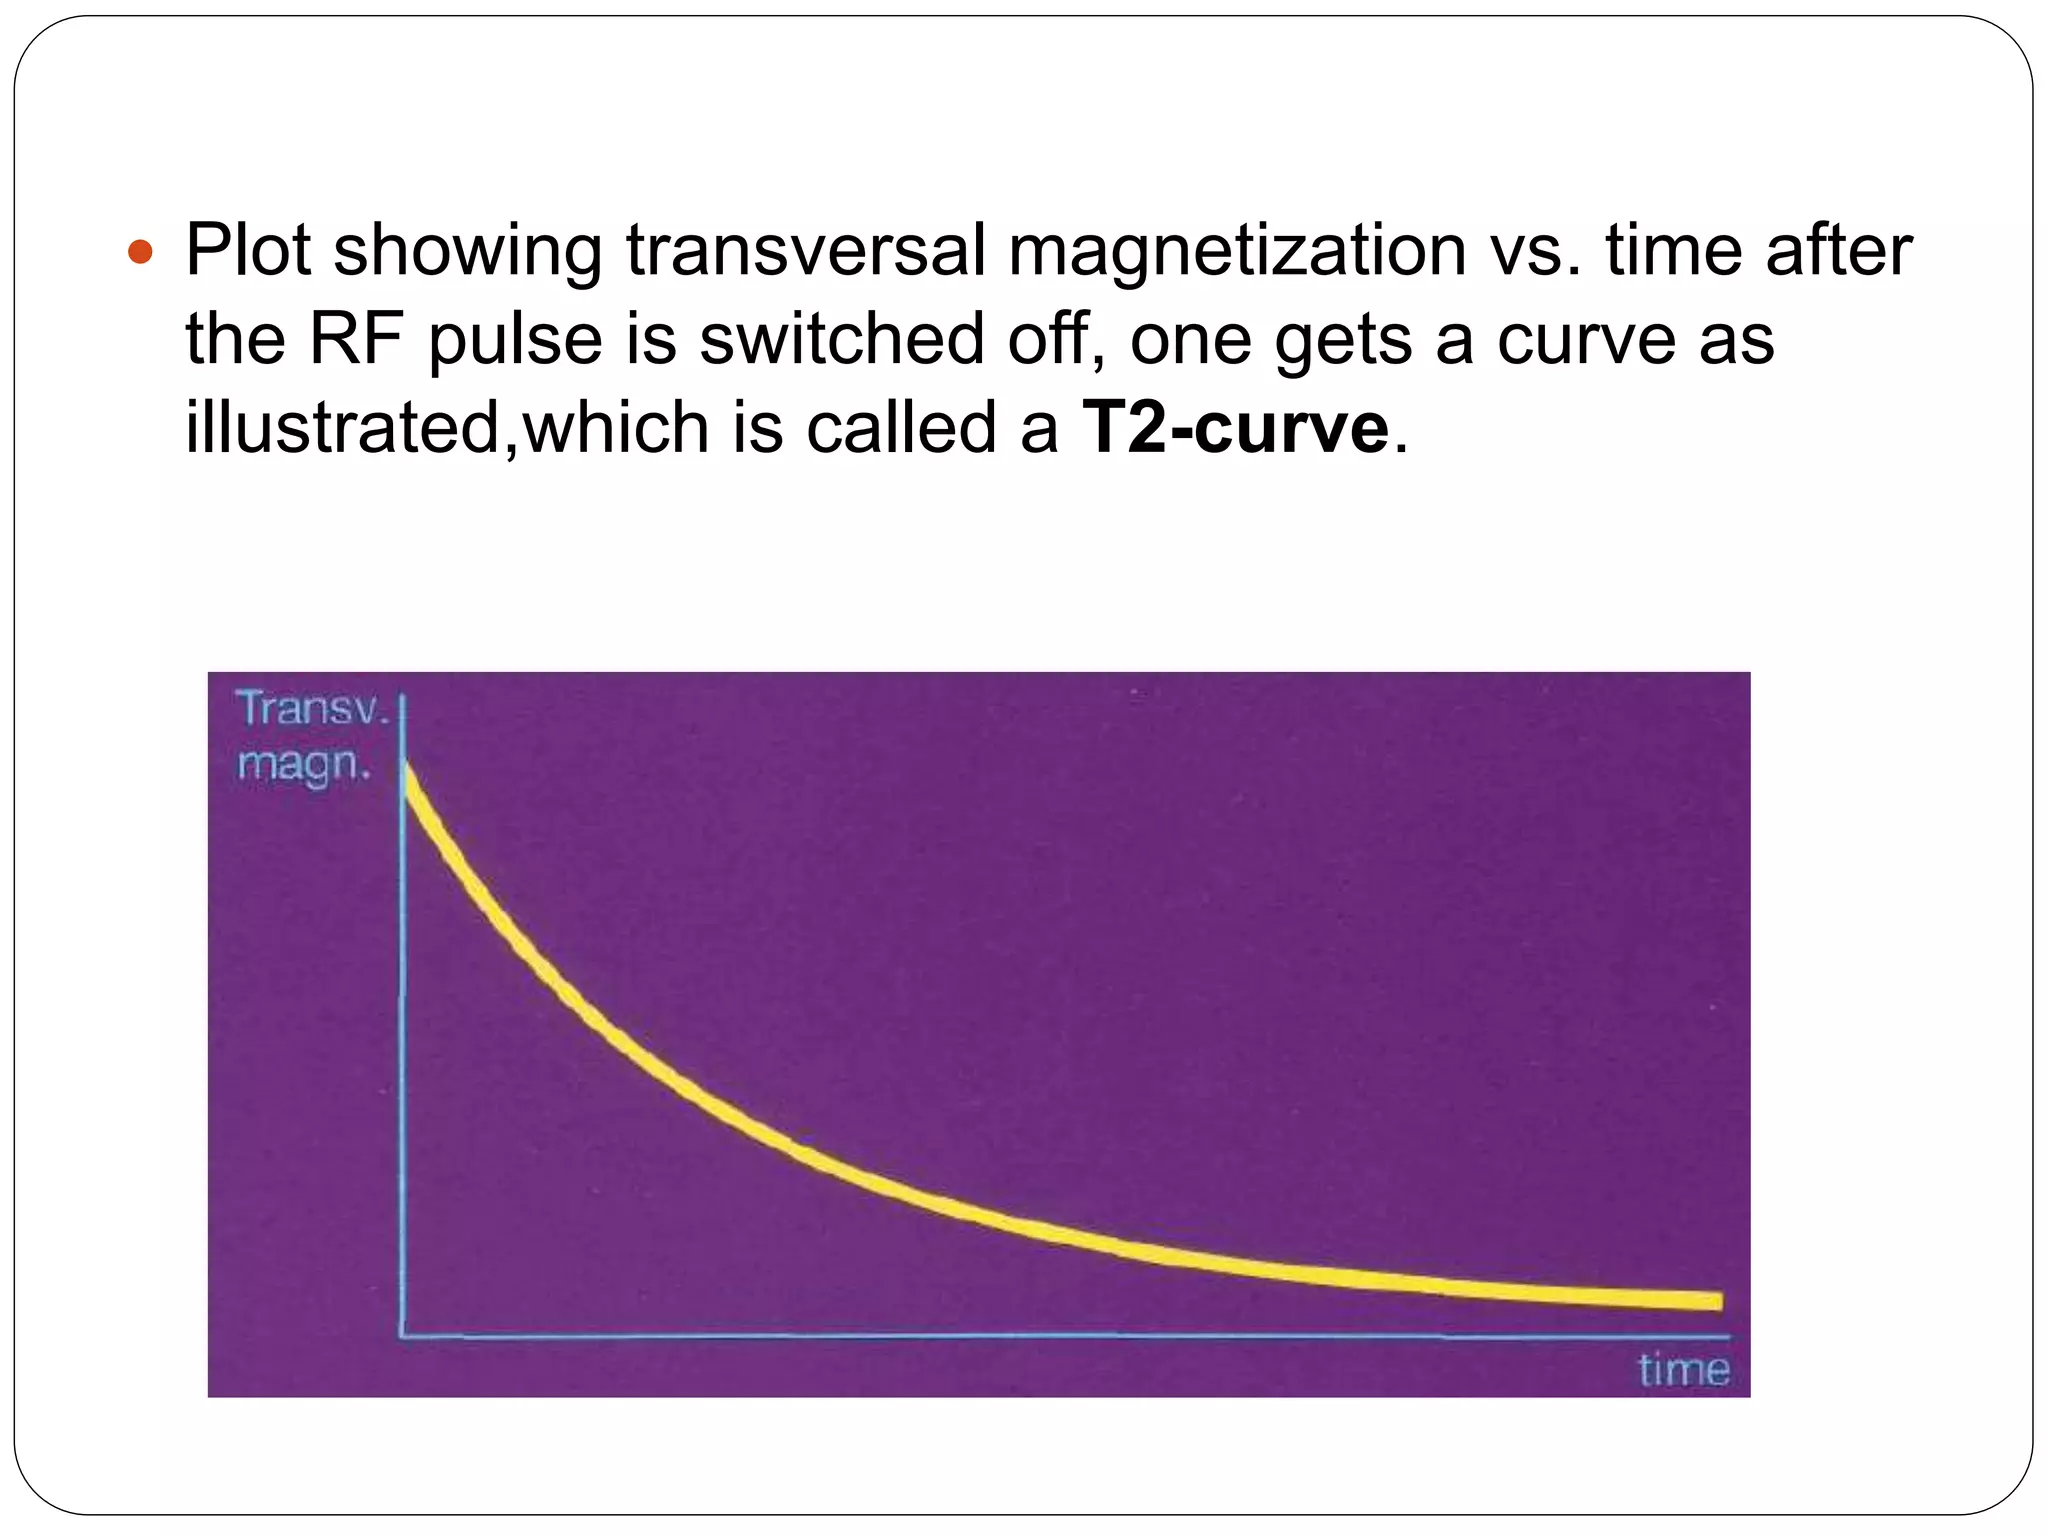
Discusses longitudinal (T1) and transversal (T2) relaxation, their meanings, and their implications in MRI signal representation.
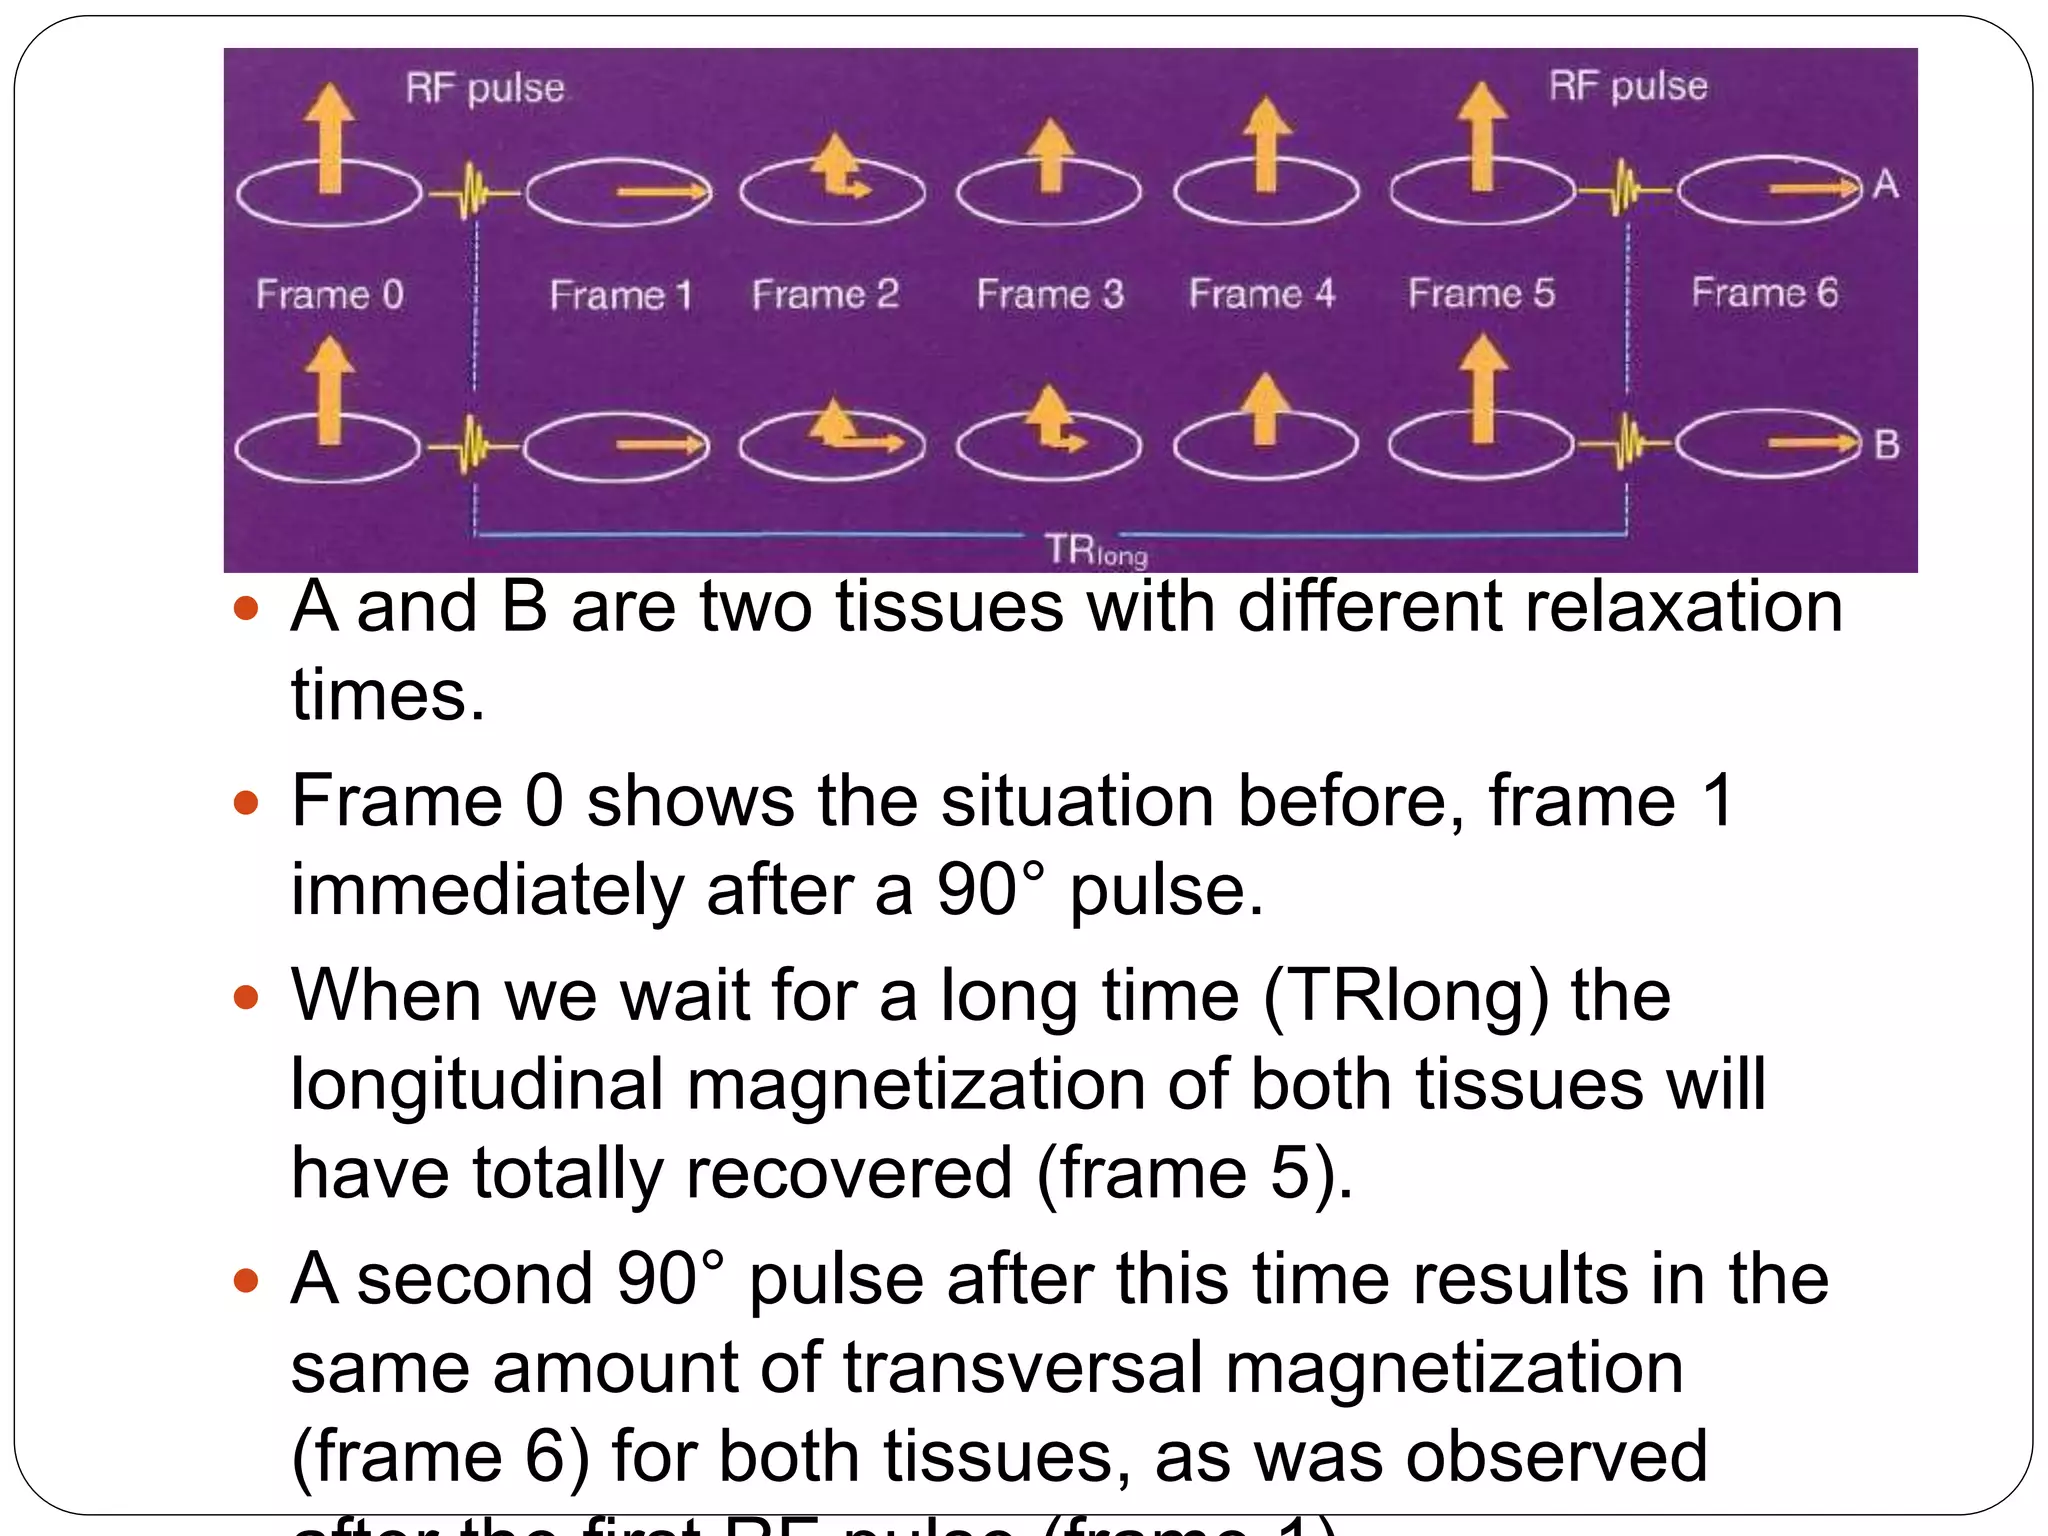
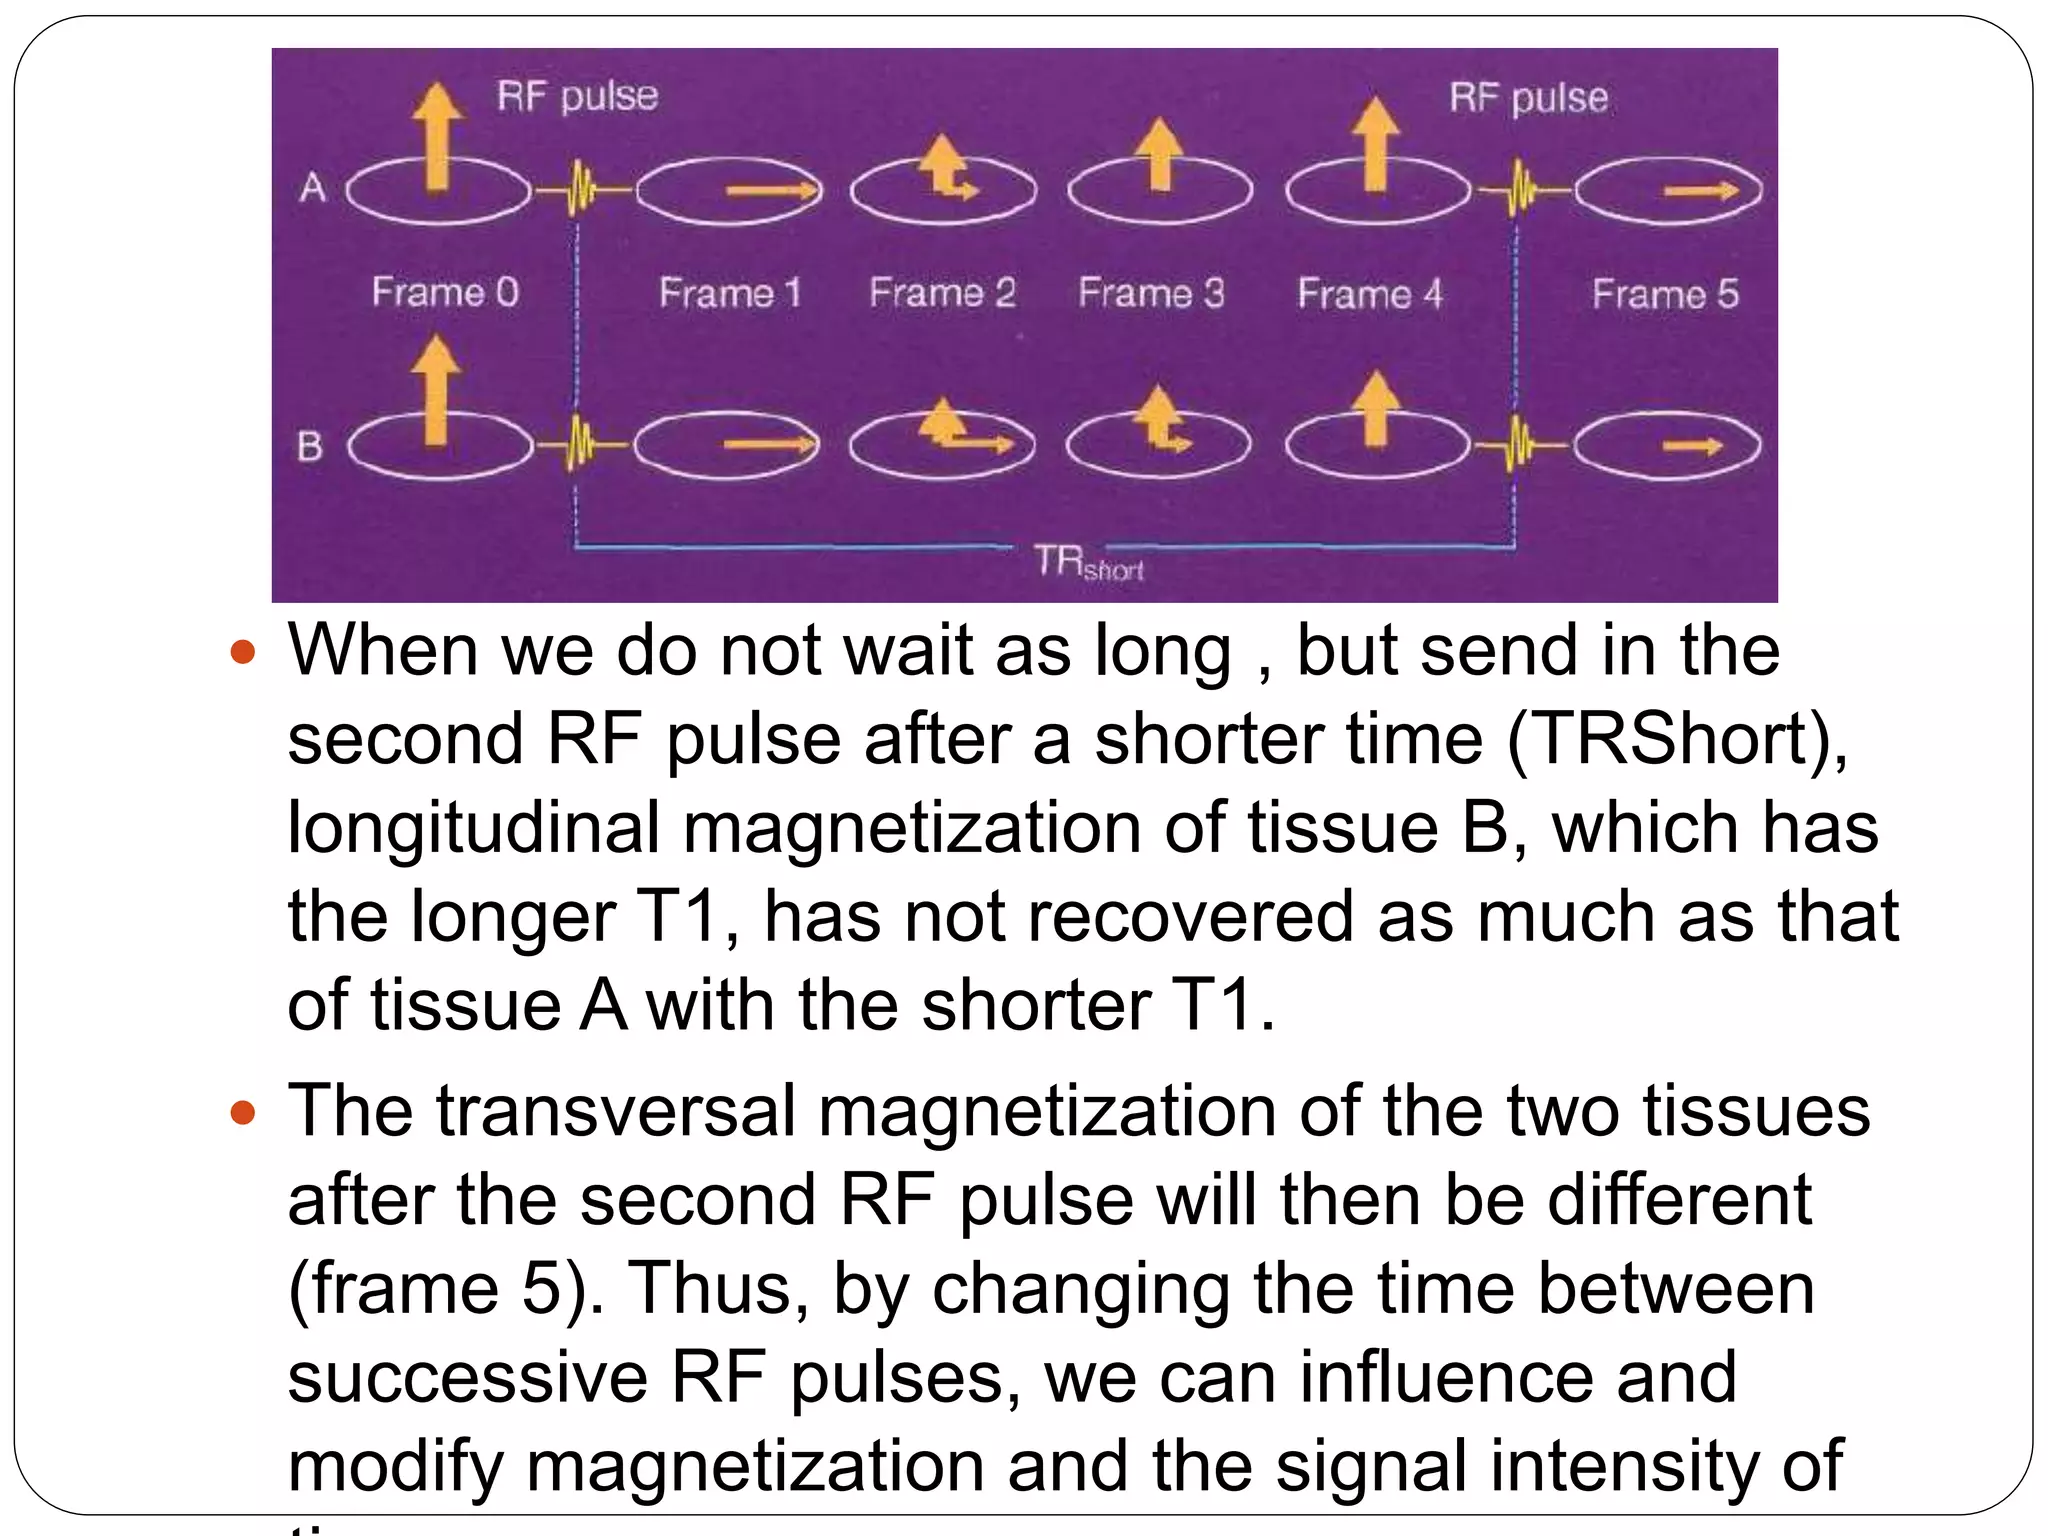
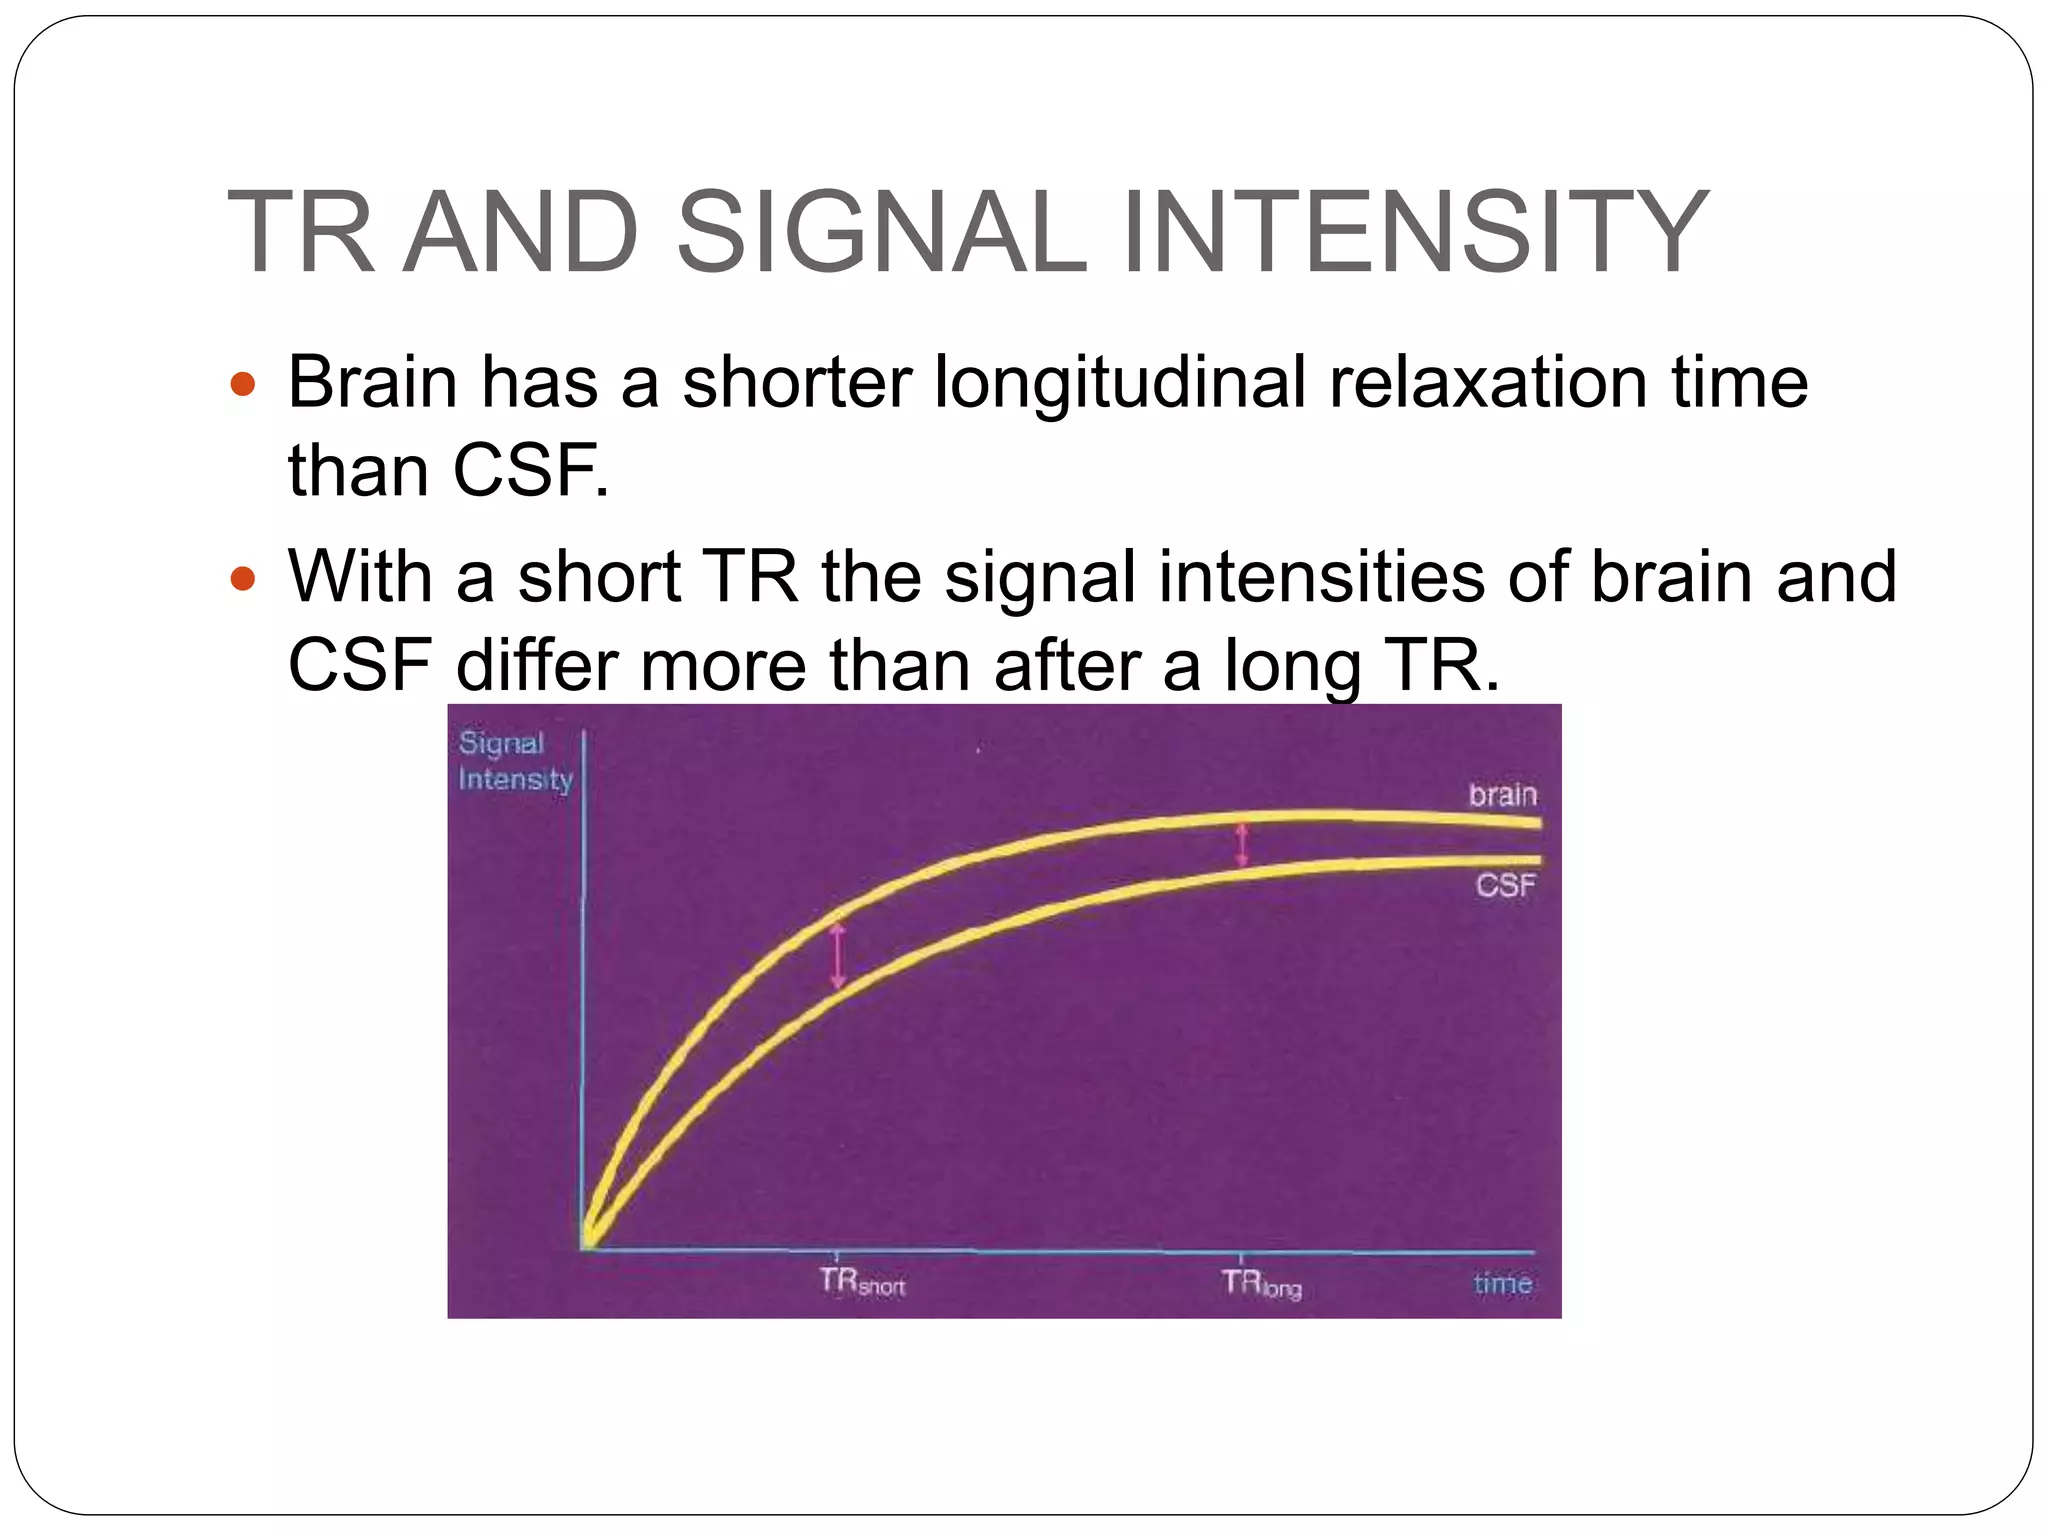
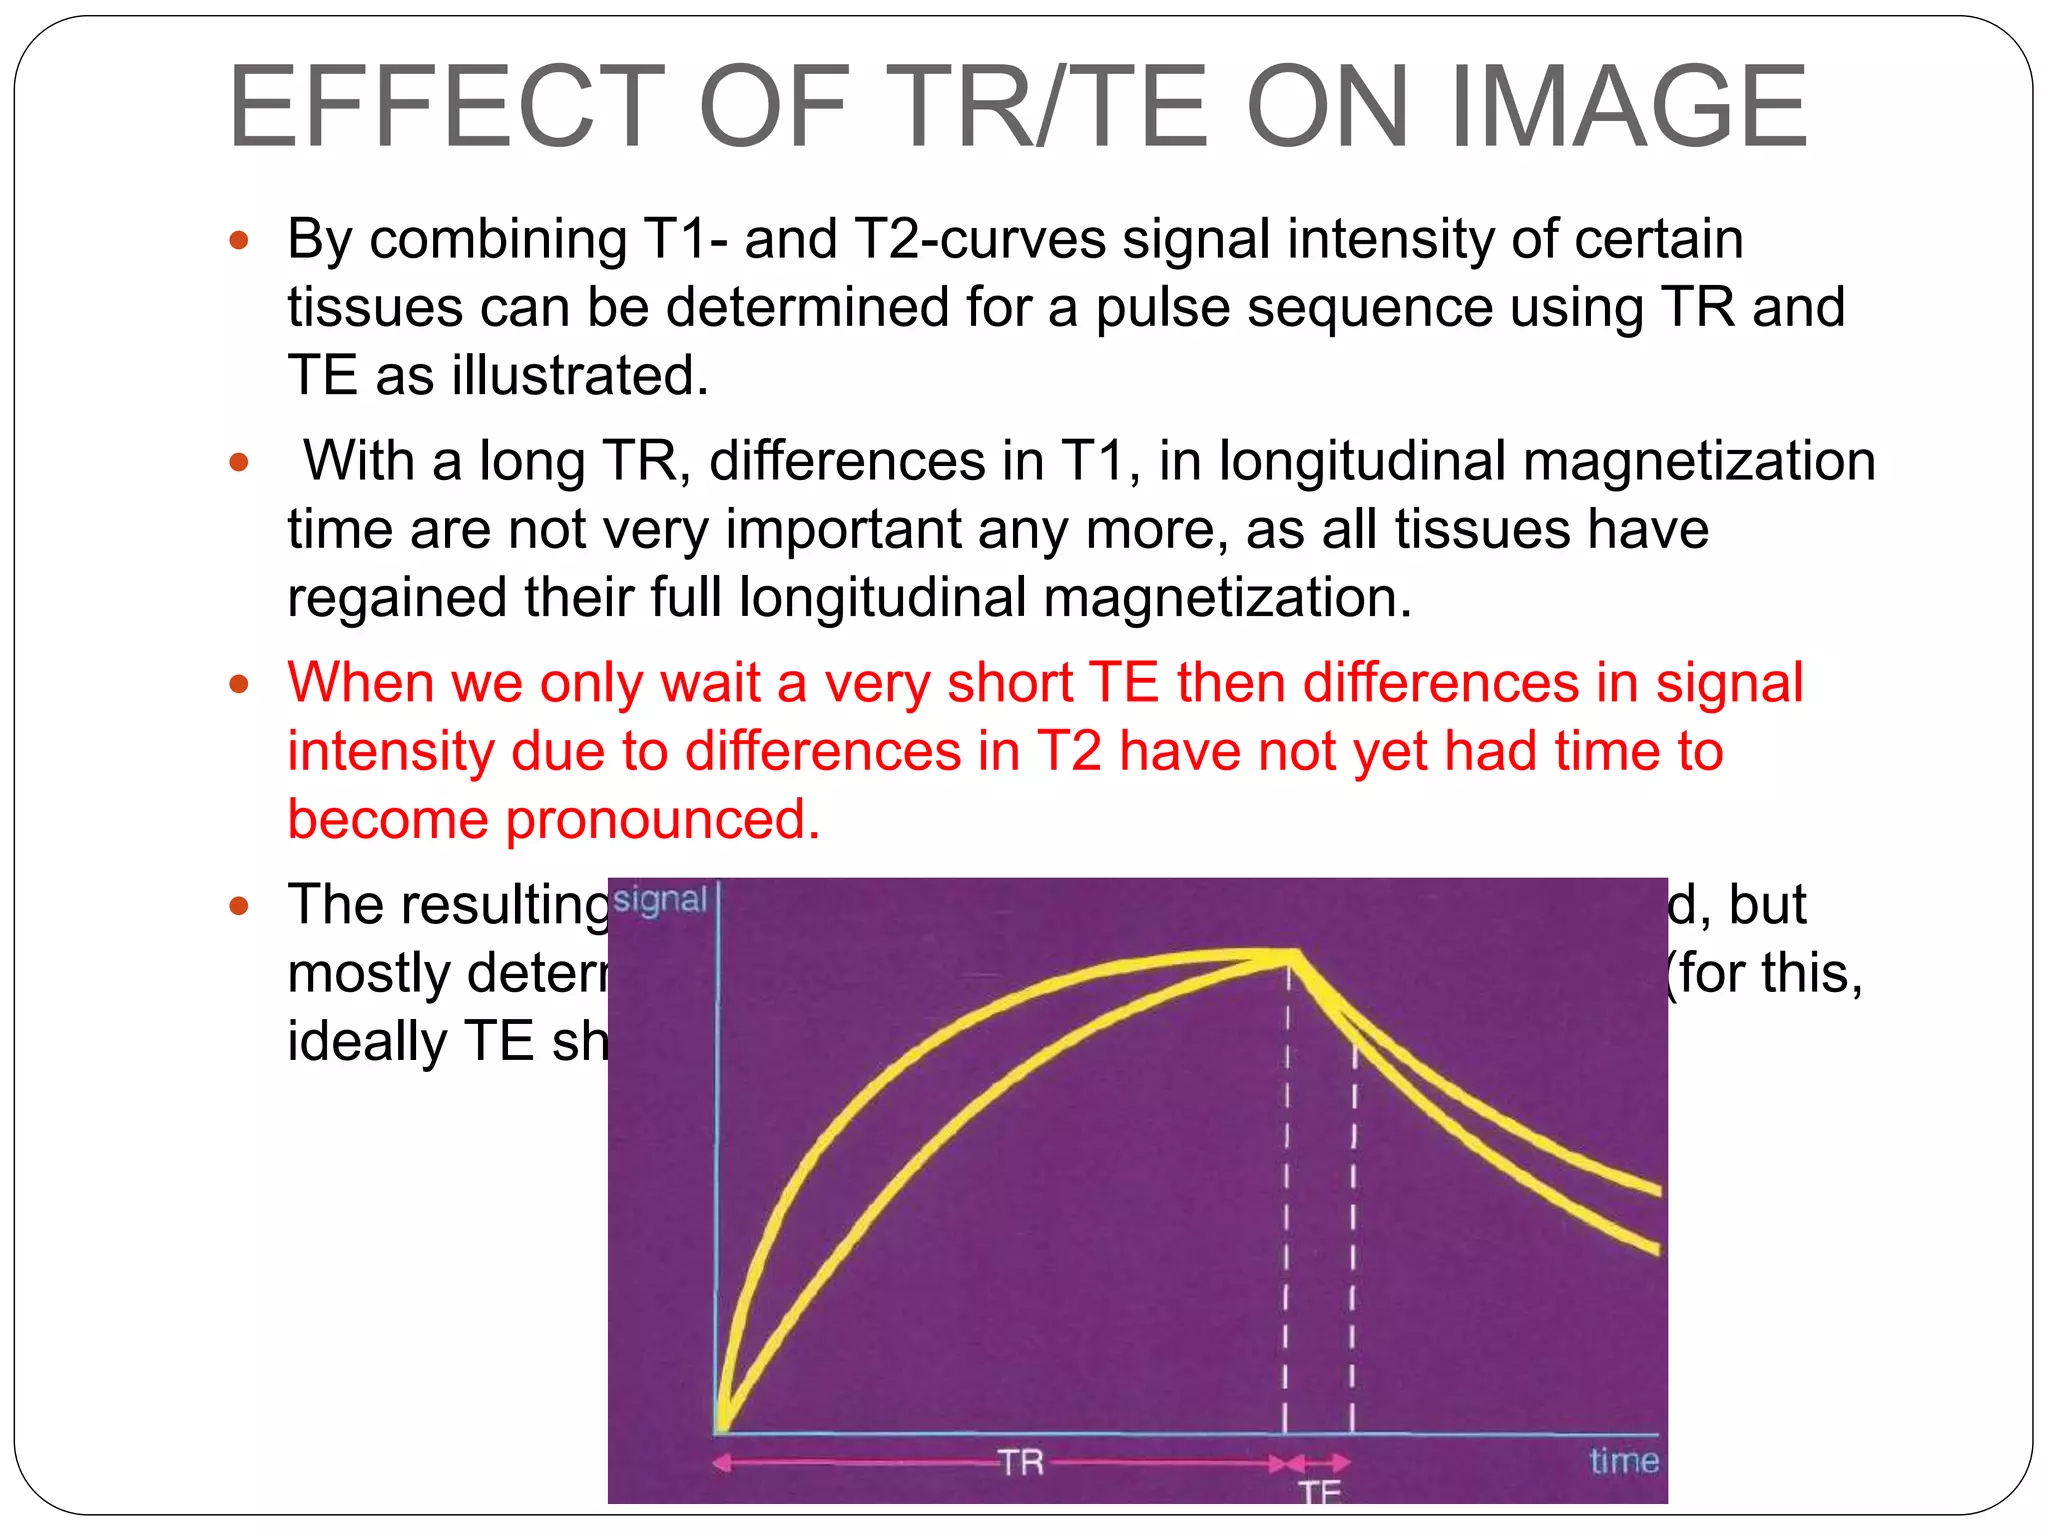
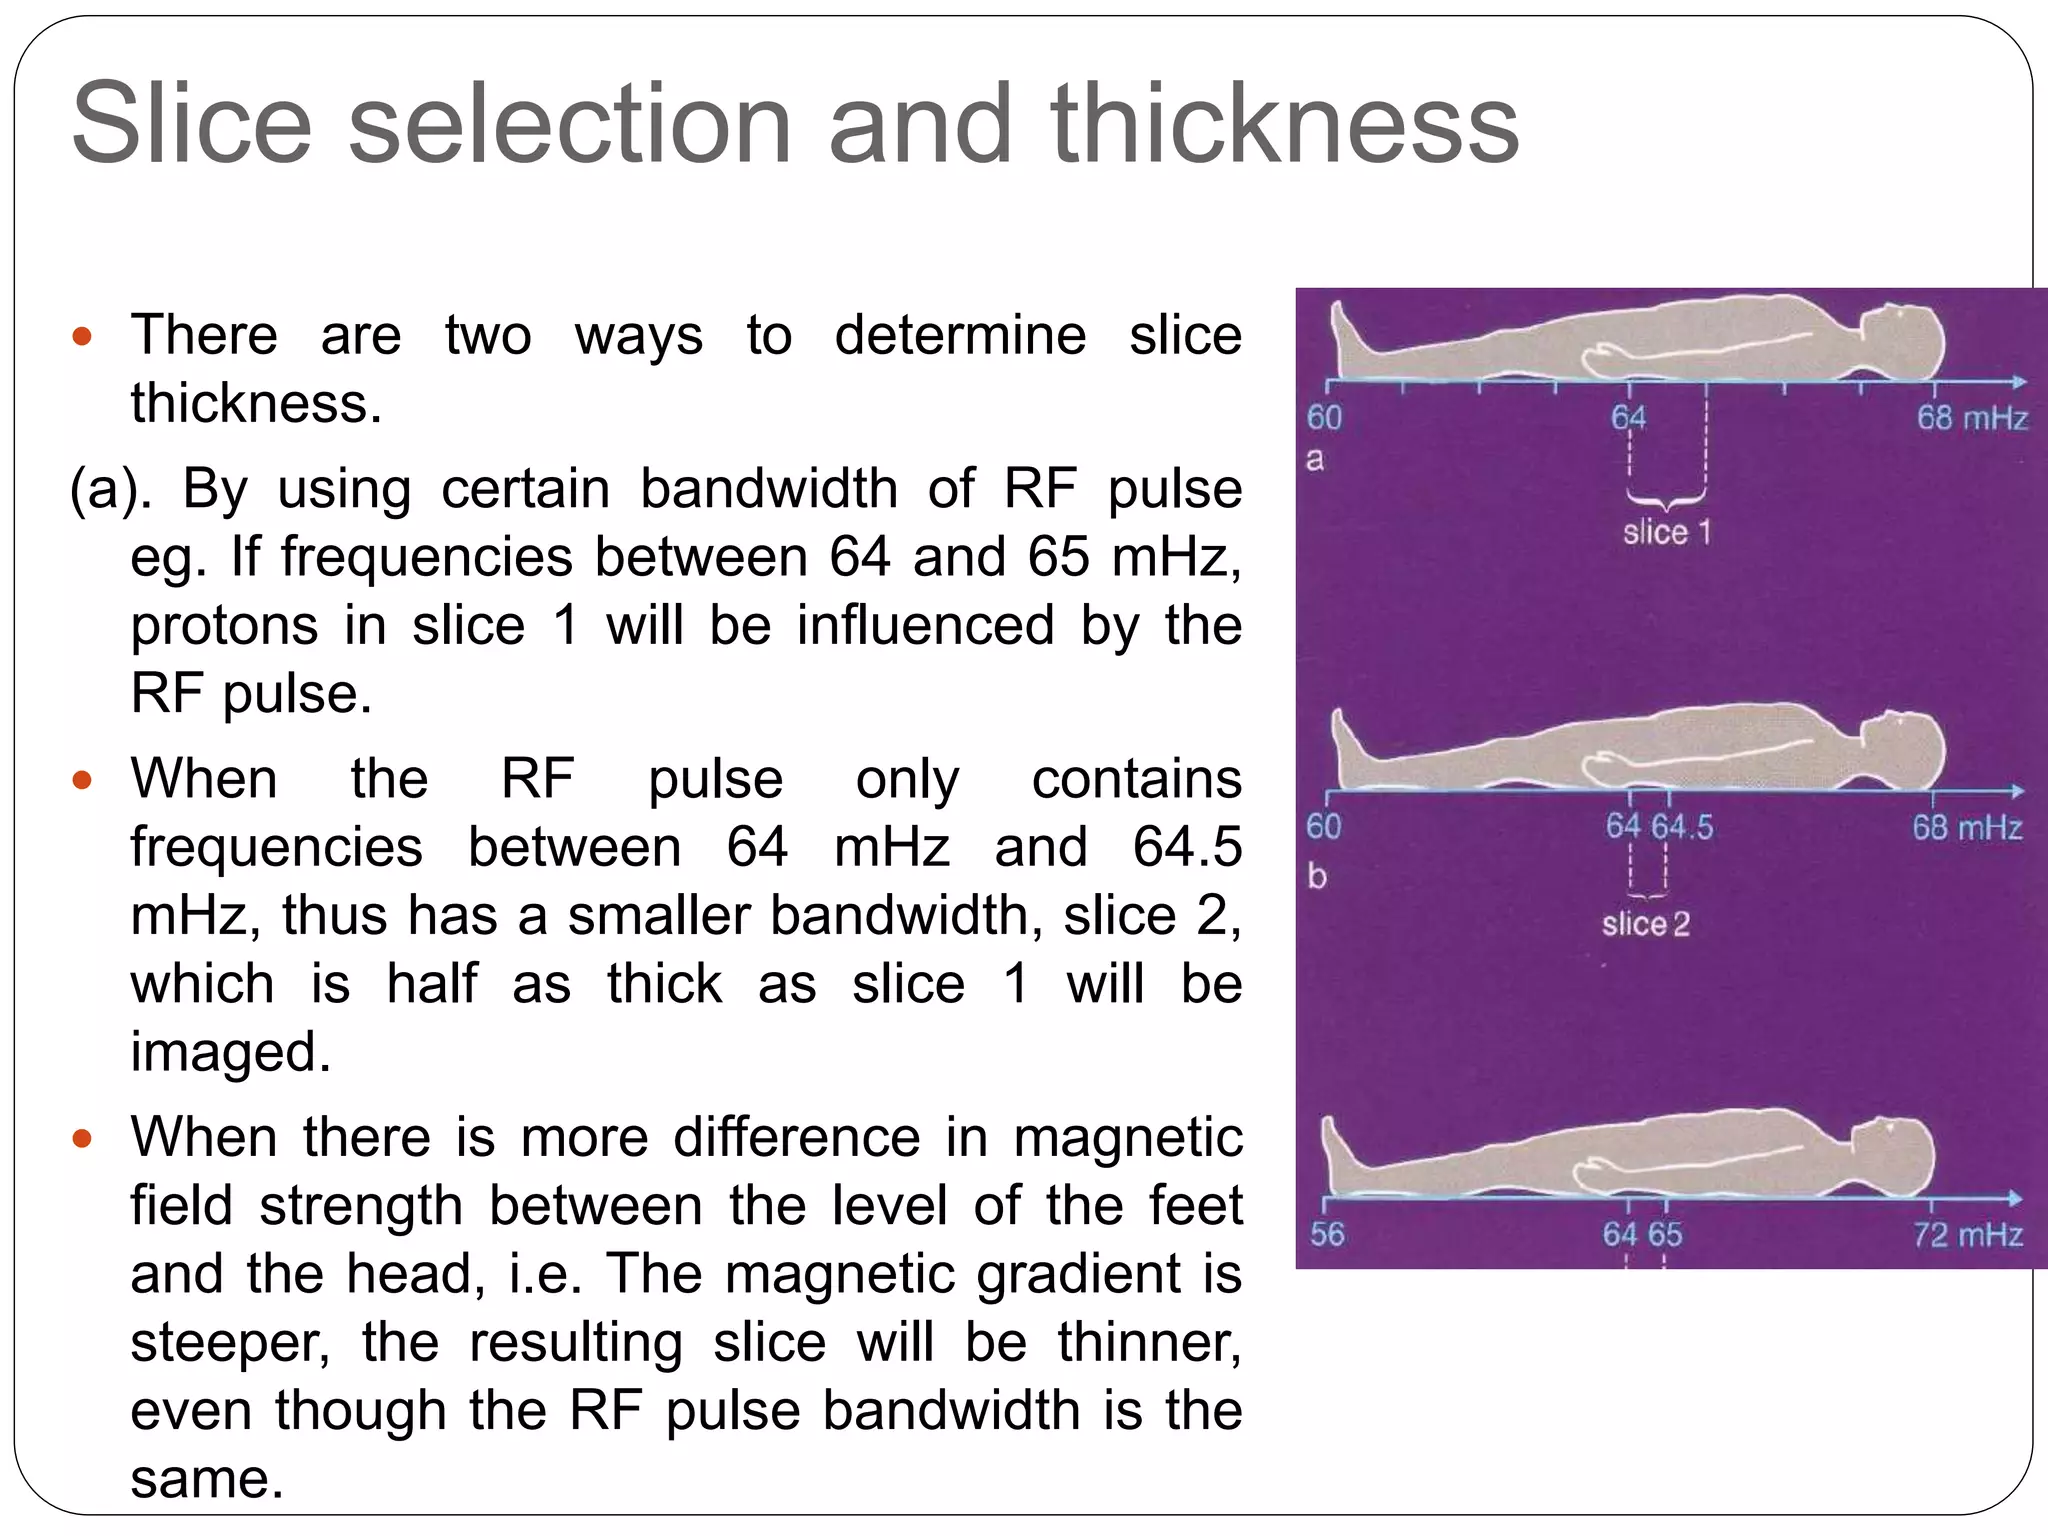
Explains TE and TR timings in MRI, how they affect signal intensity across different tissues with varying relaxation times.
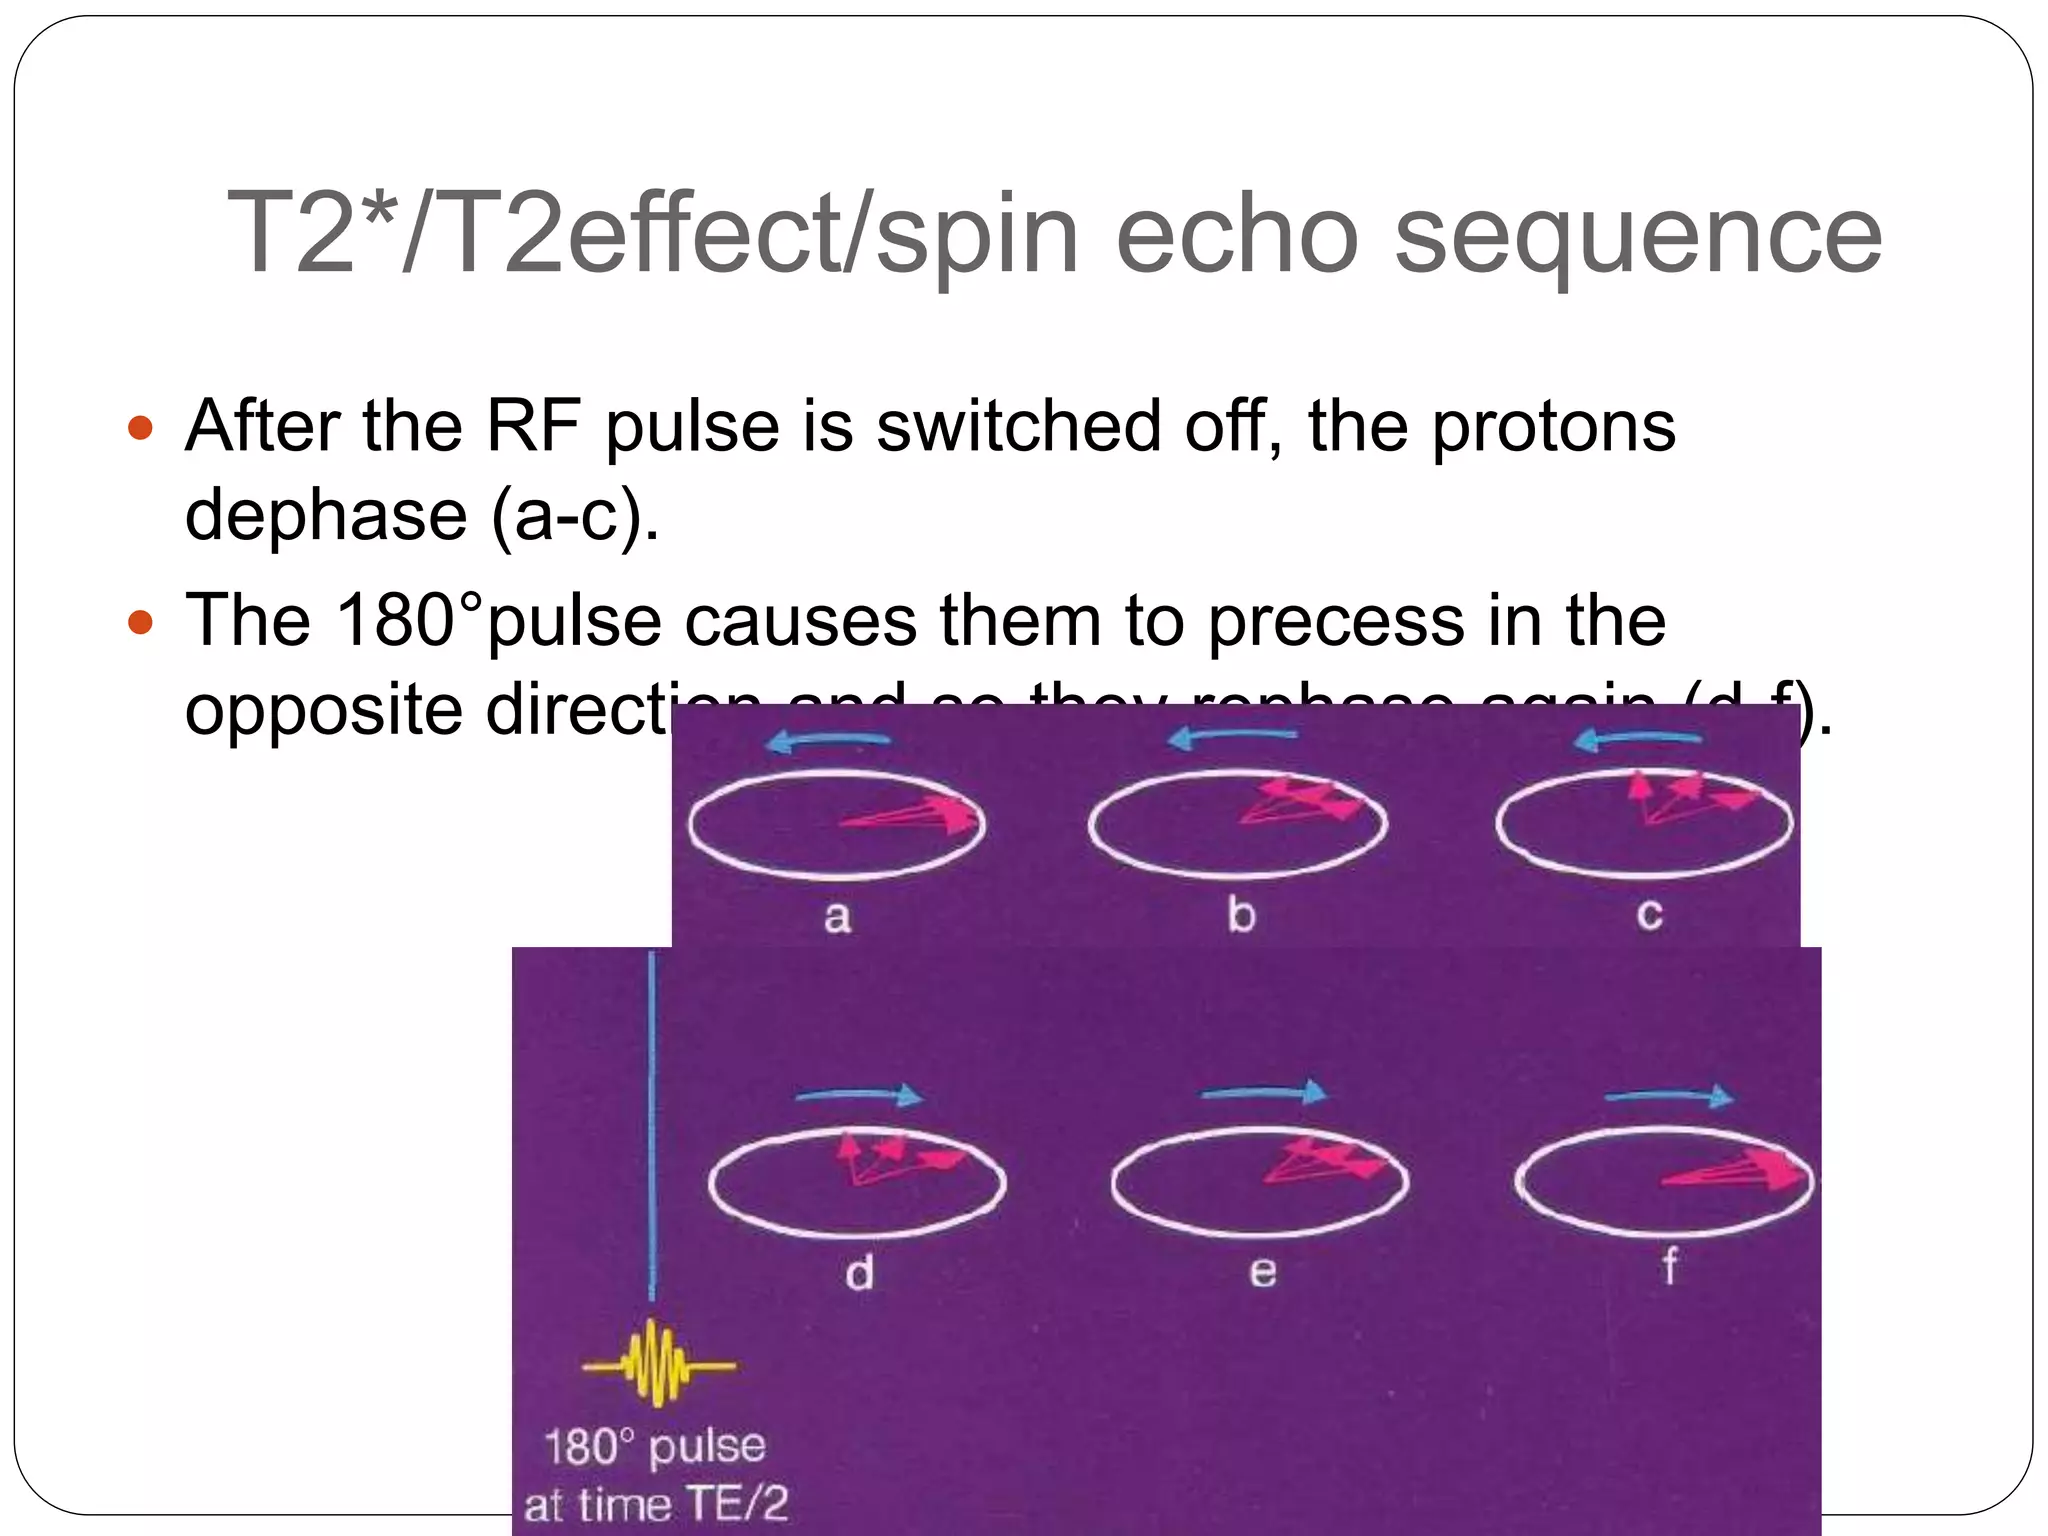
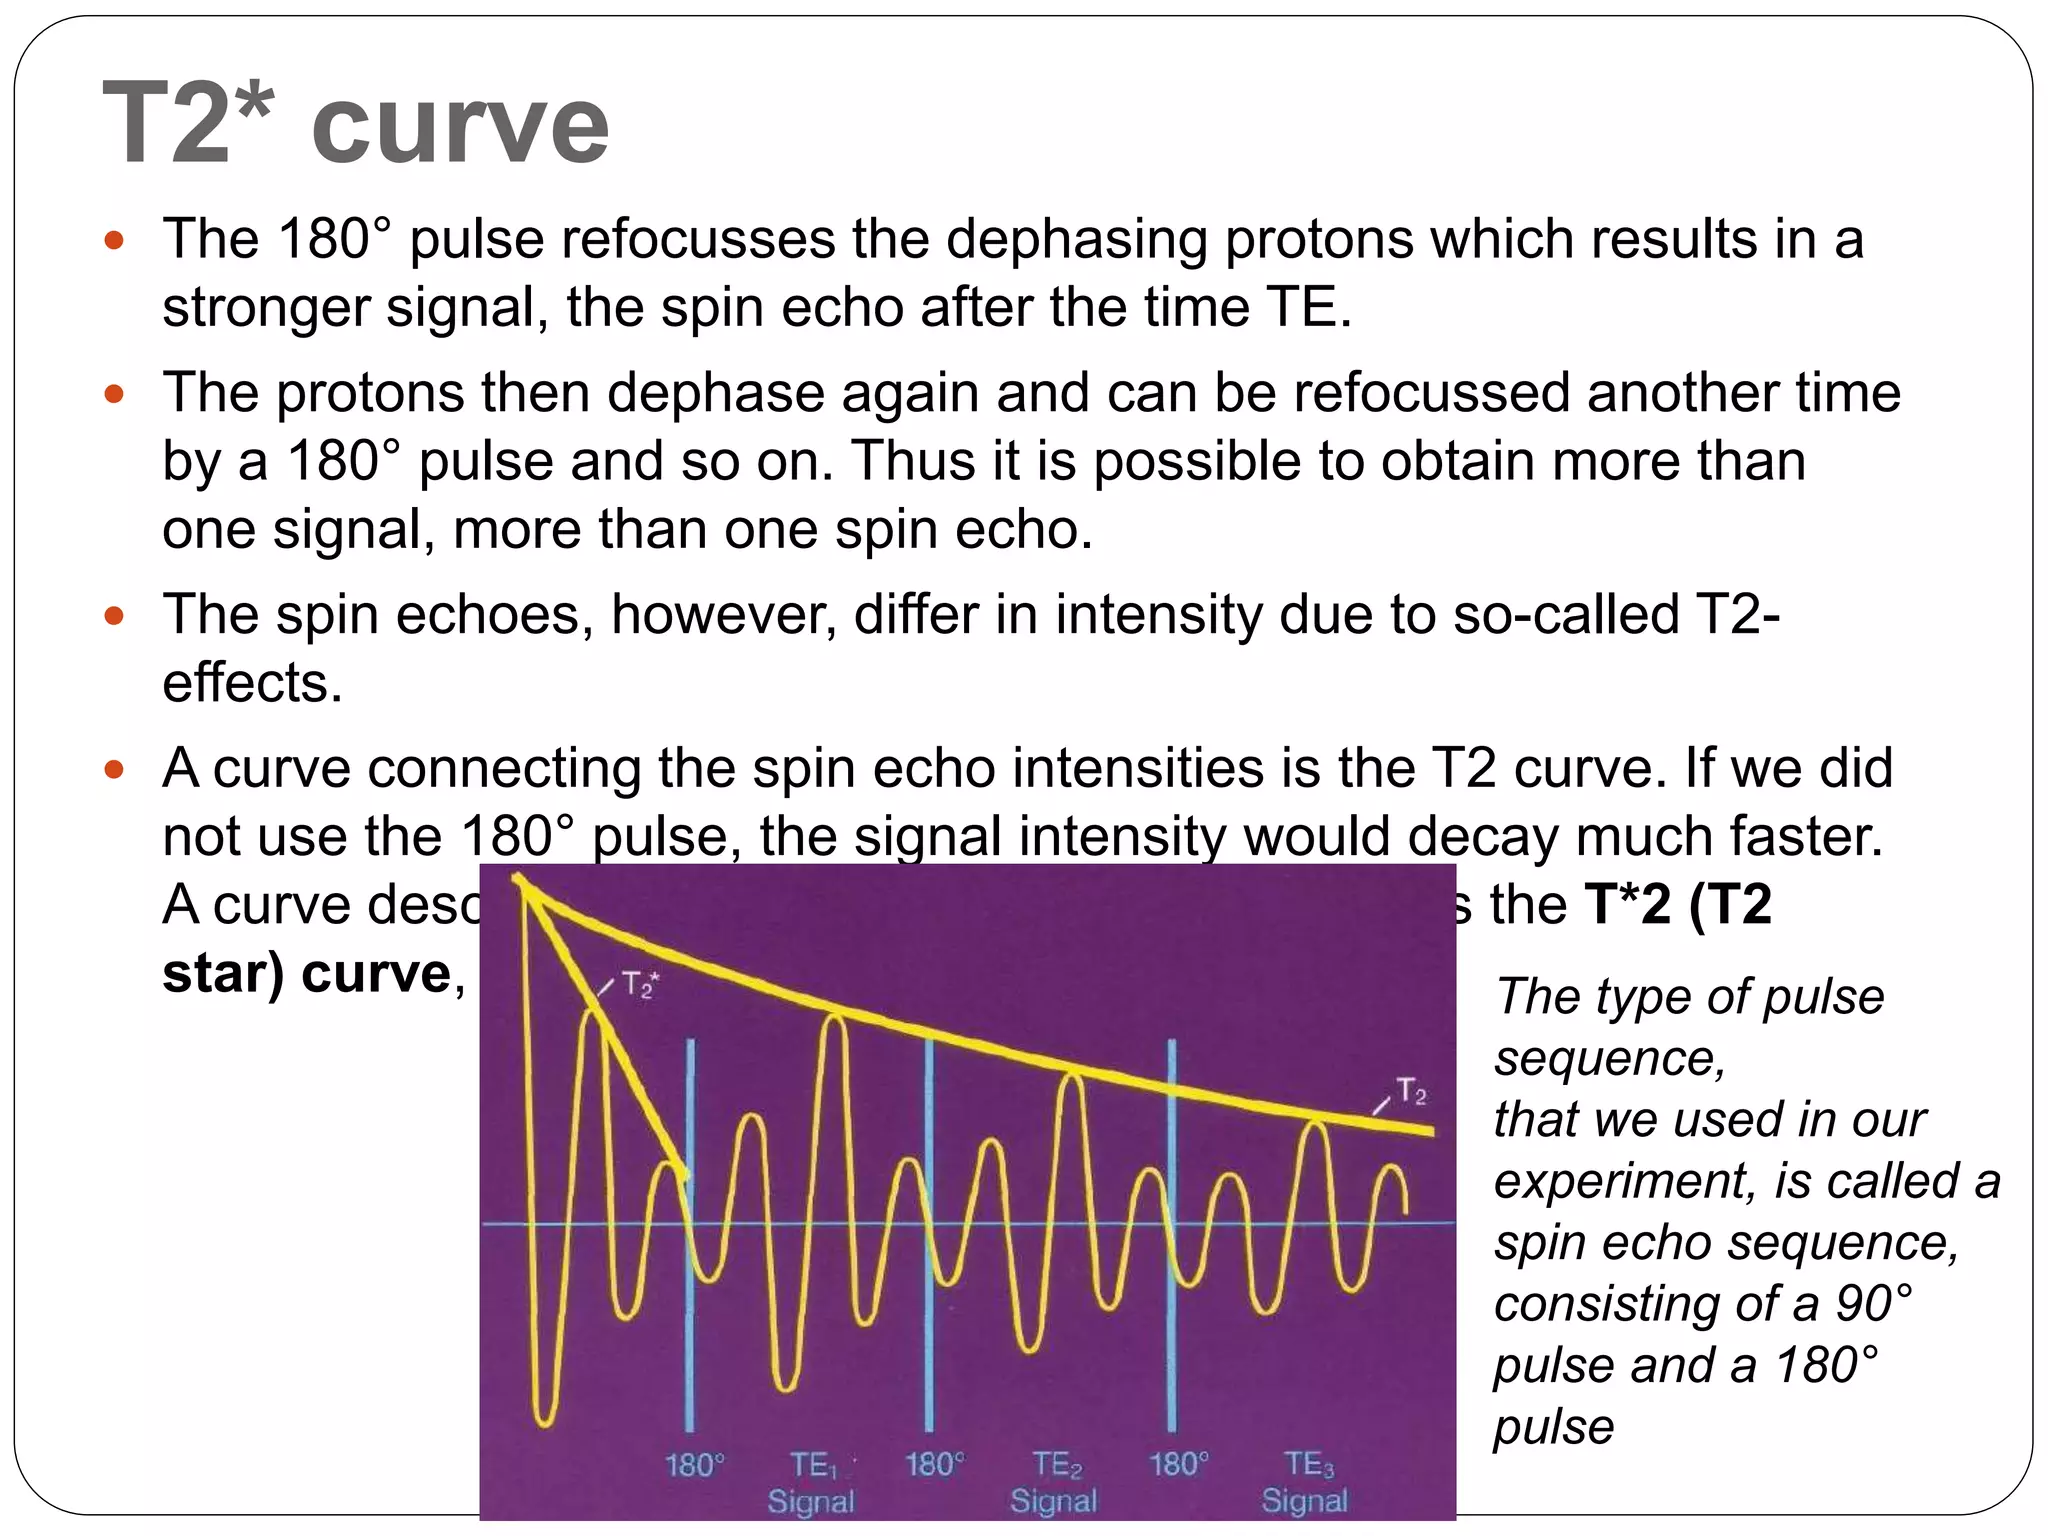
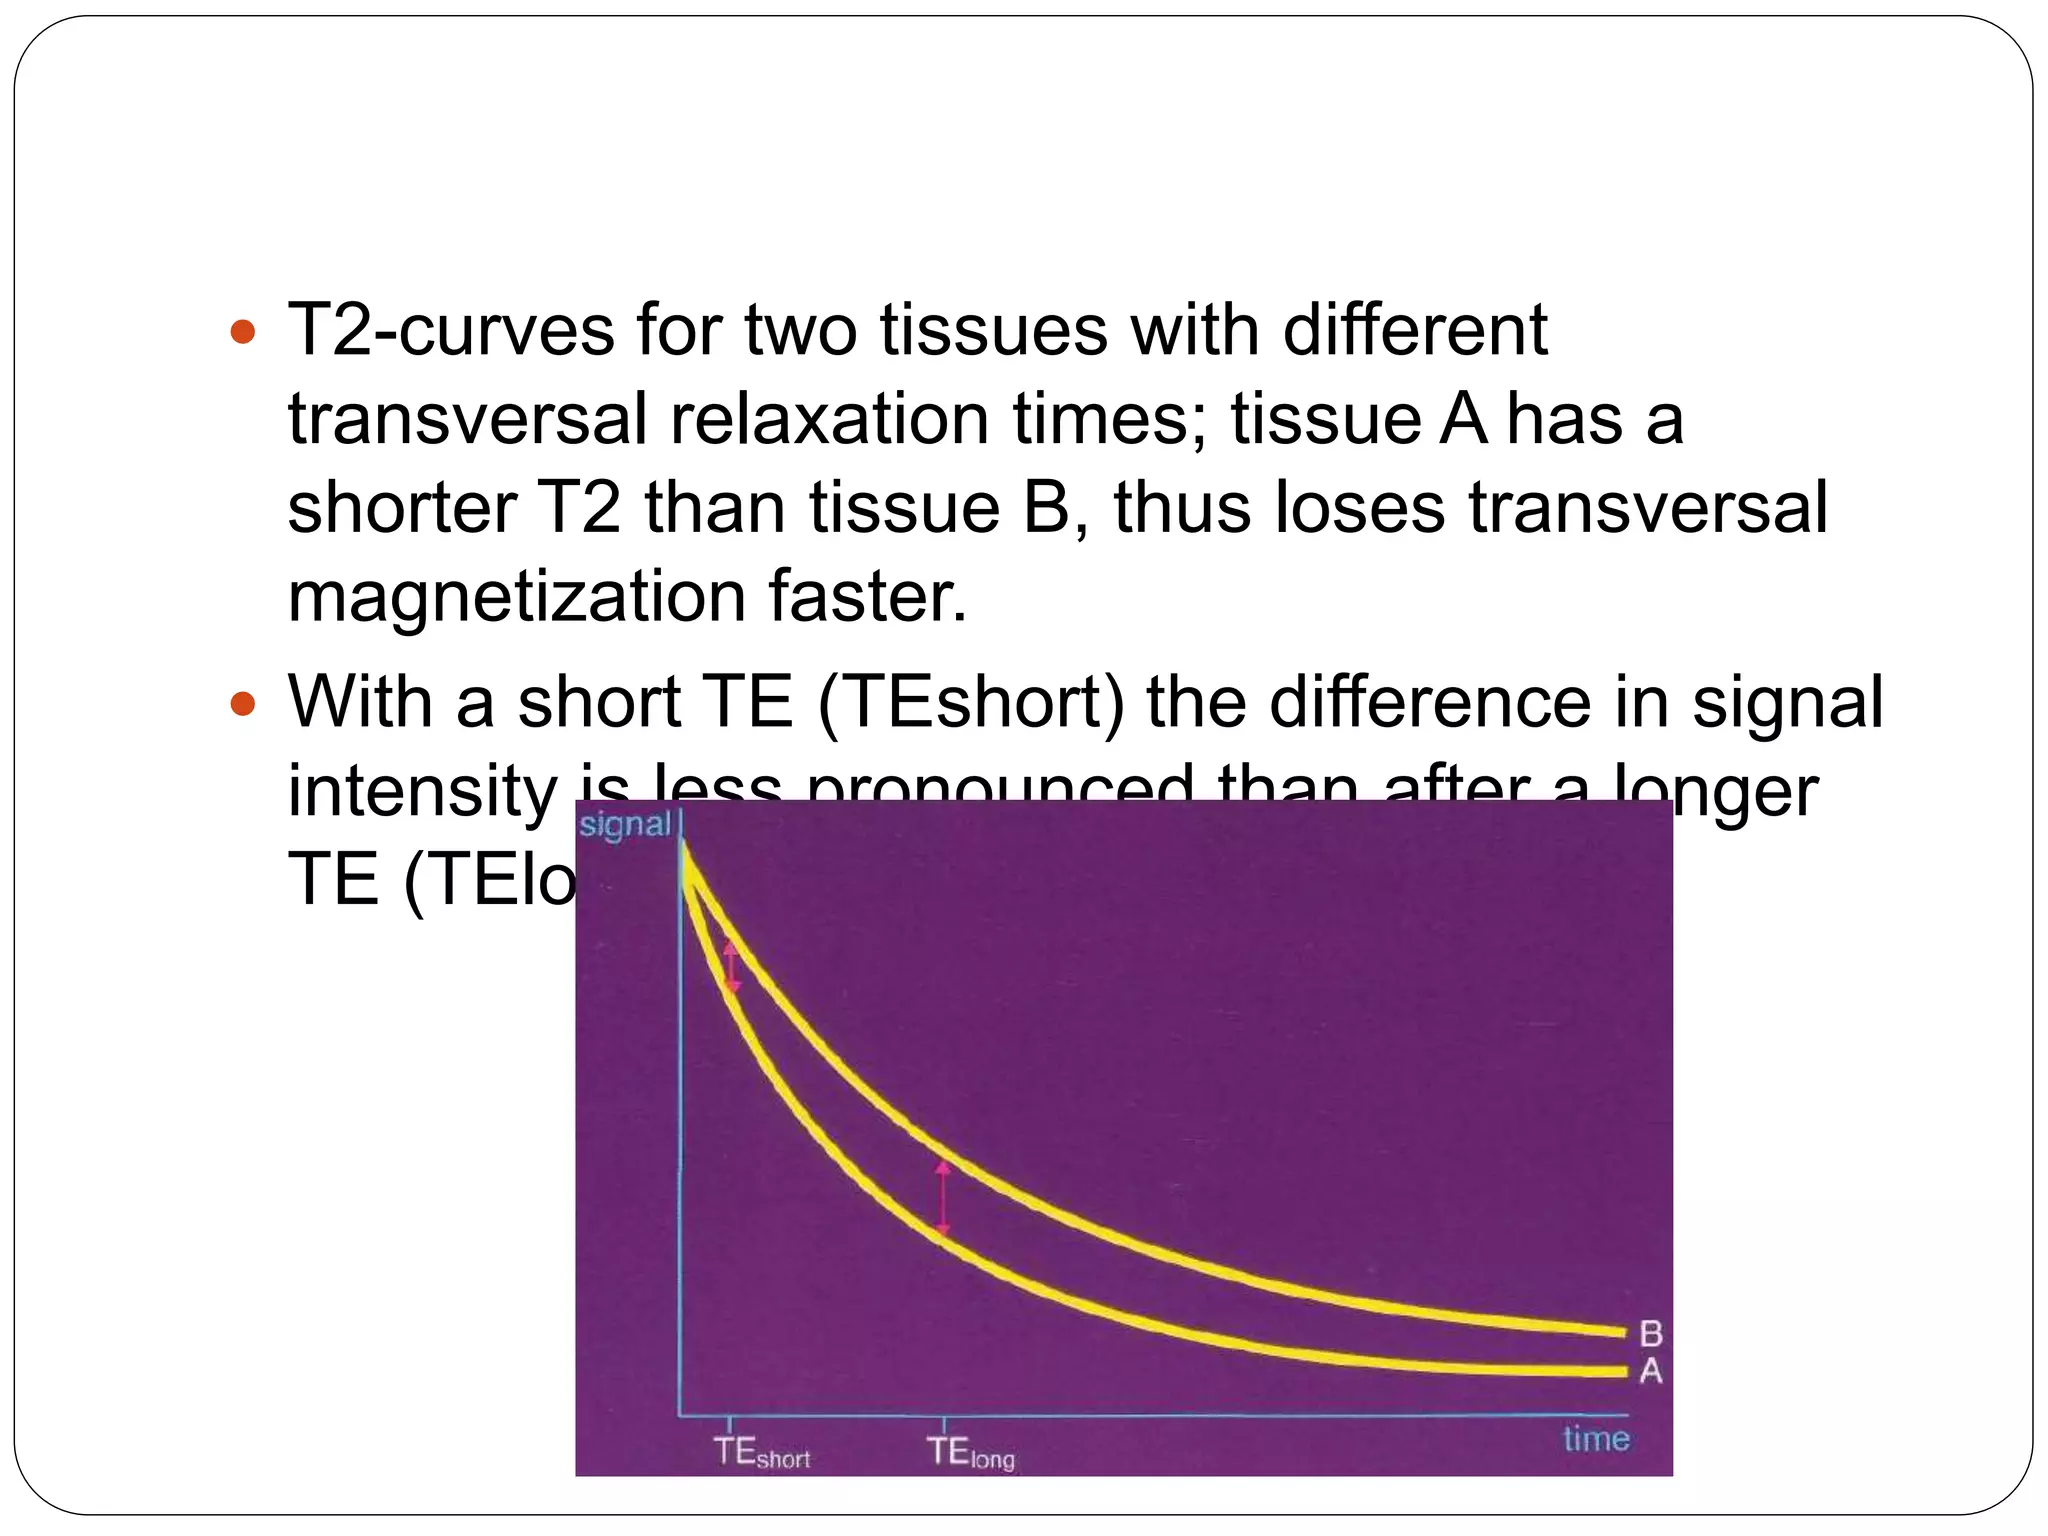
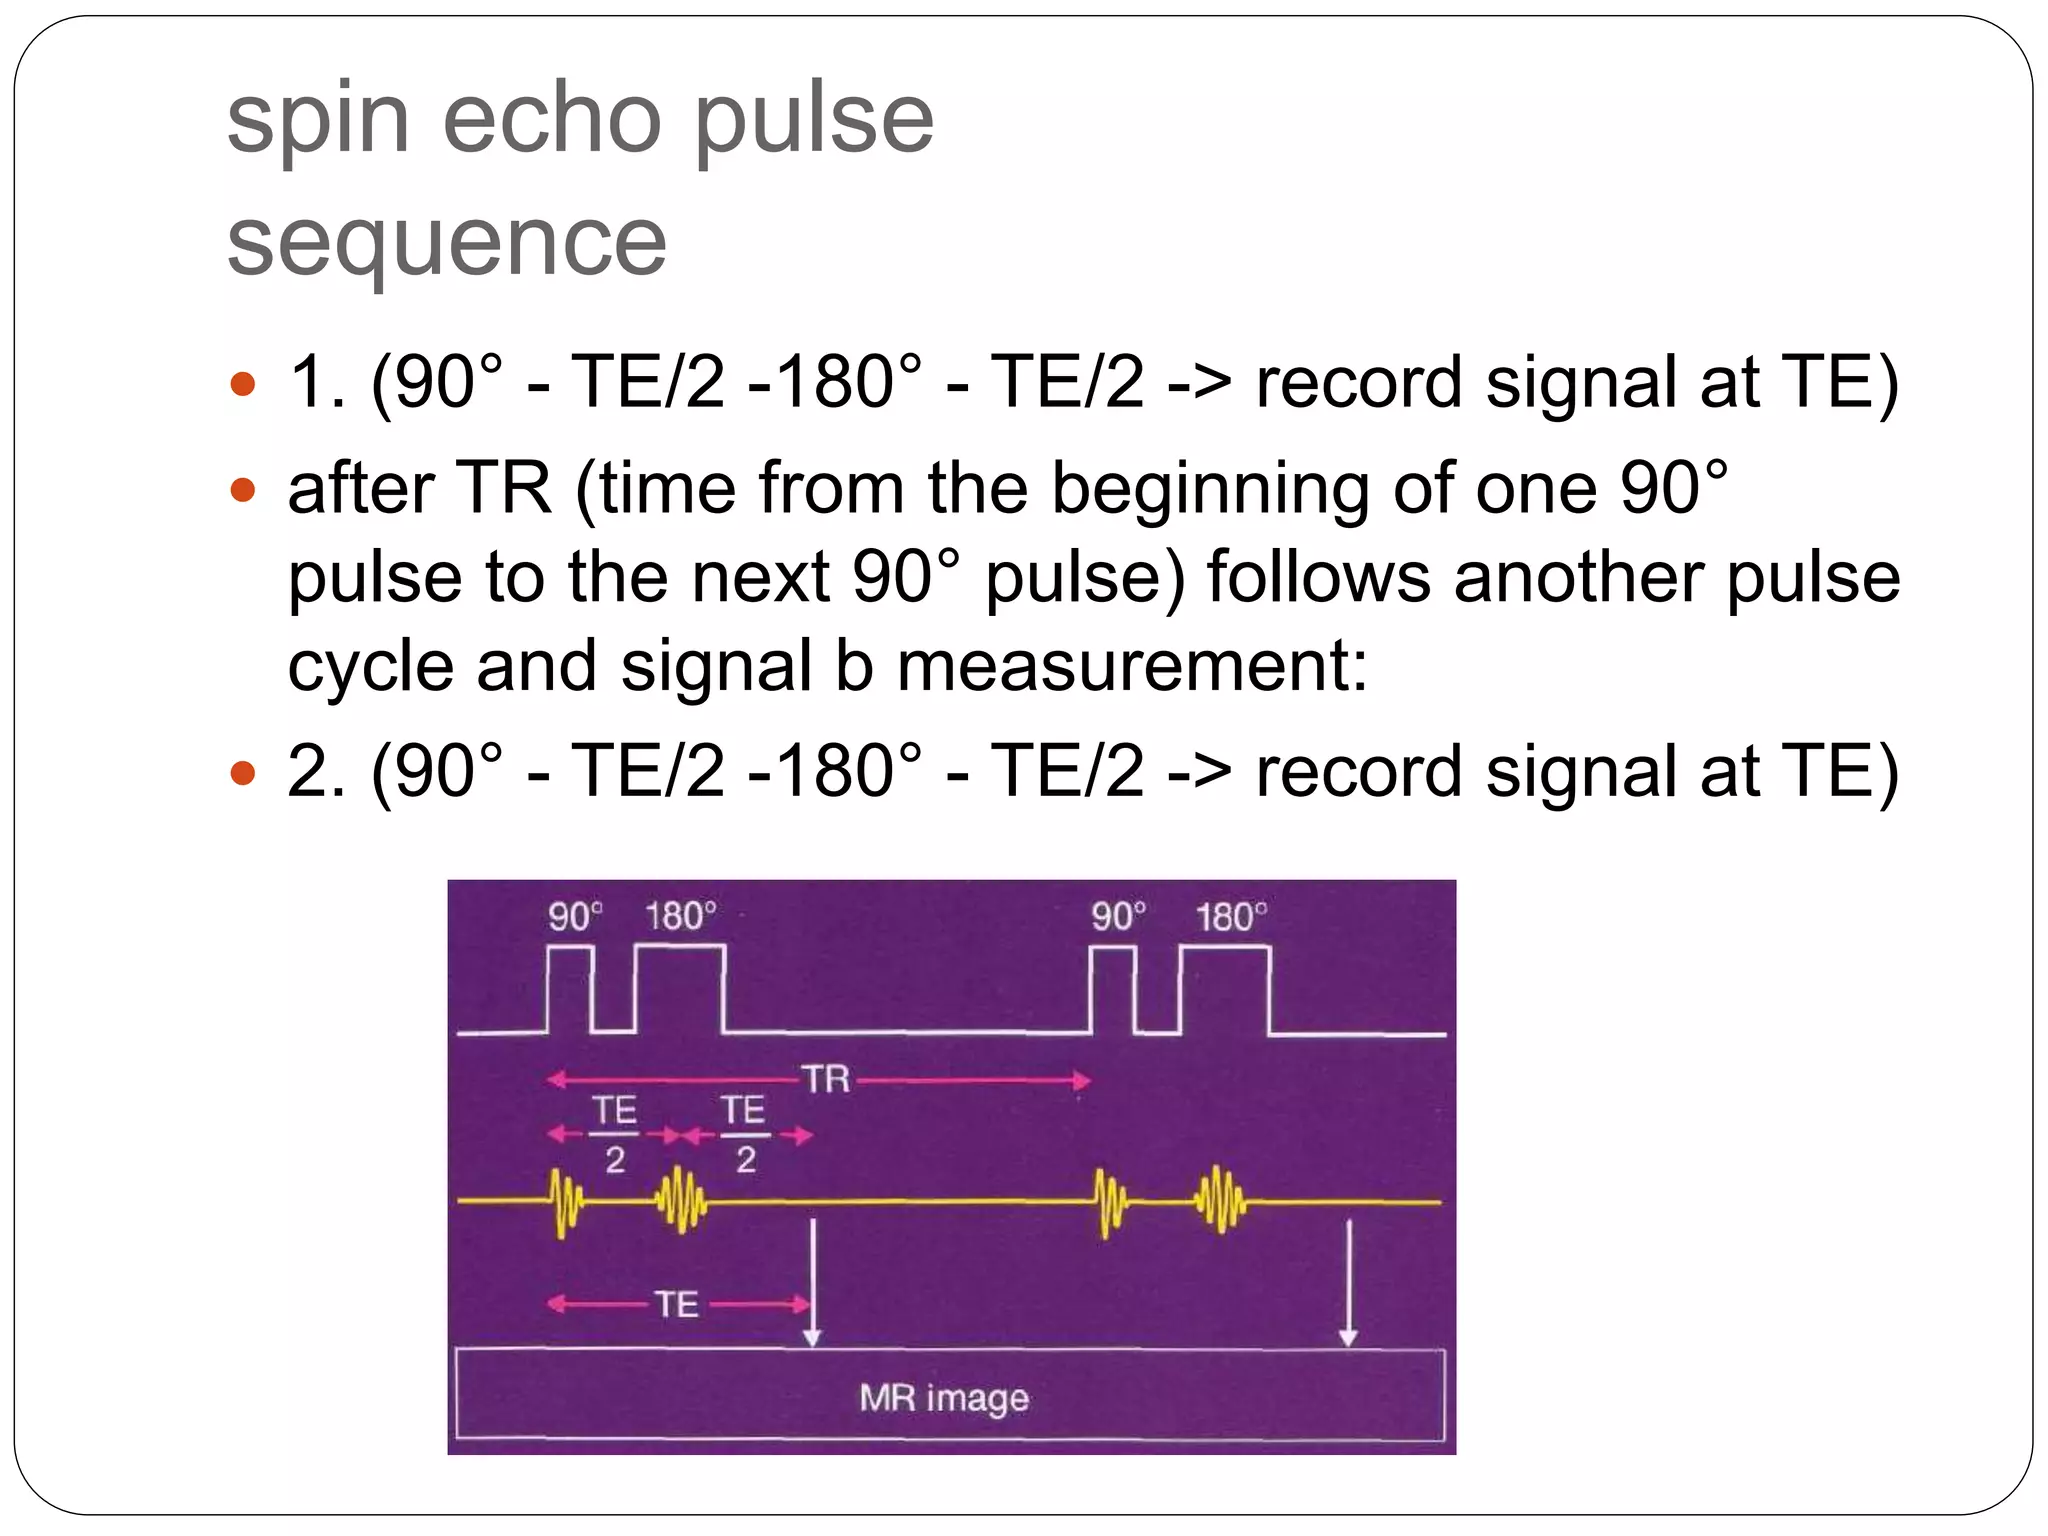
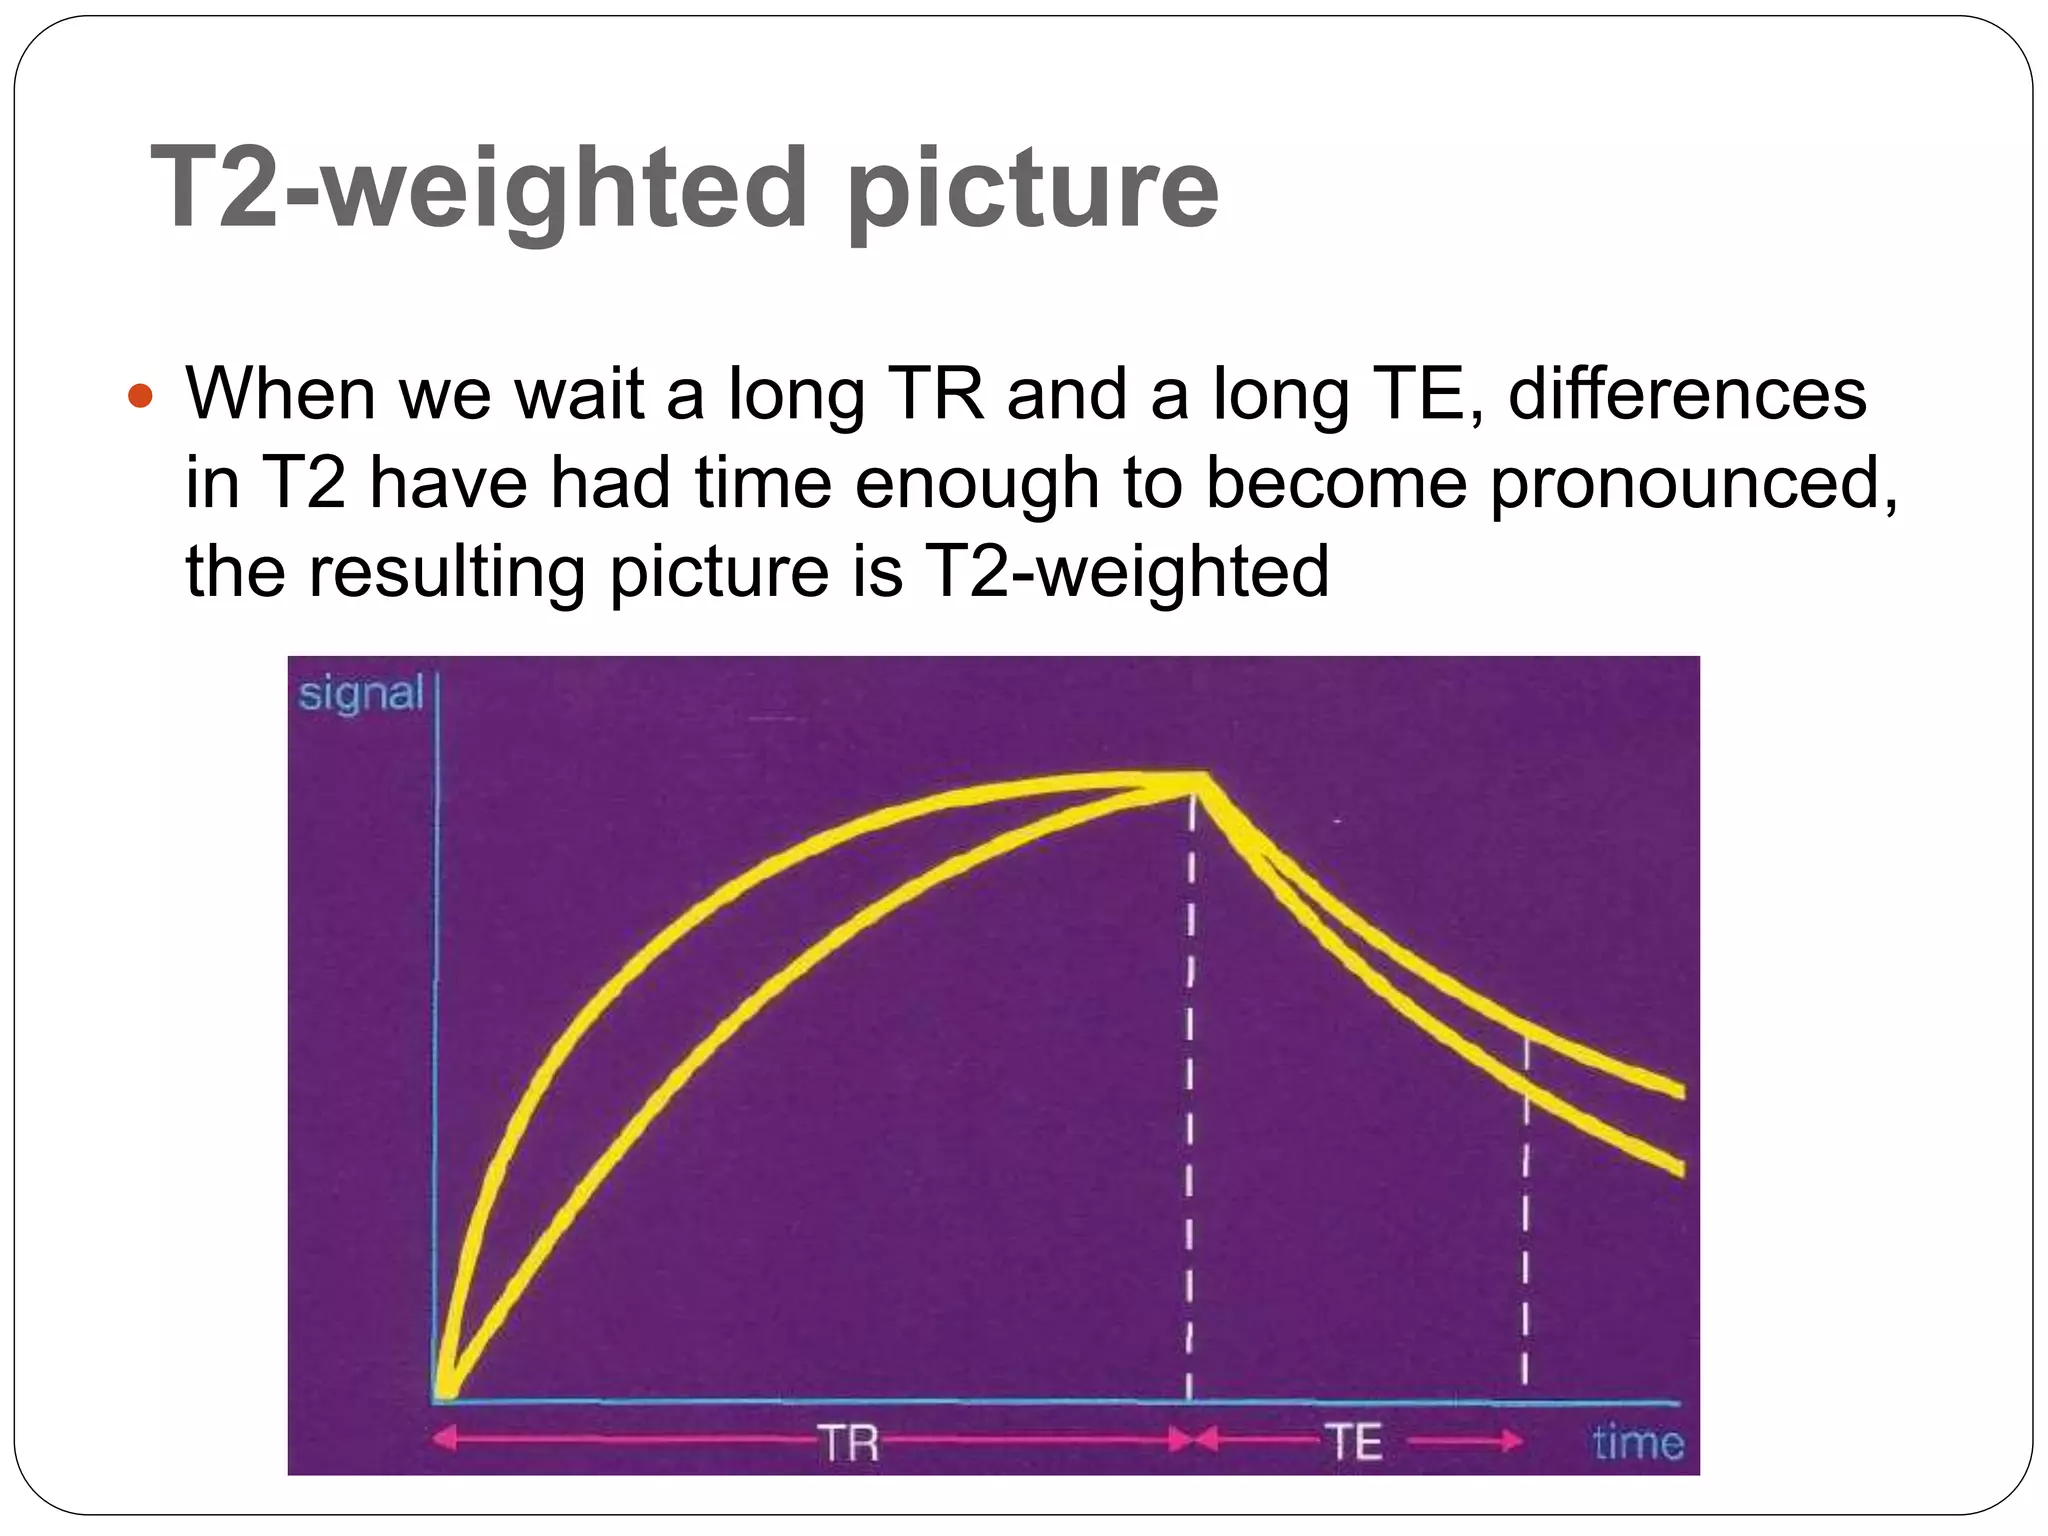
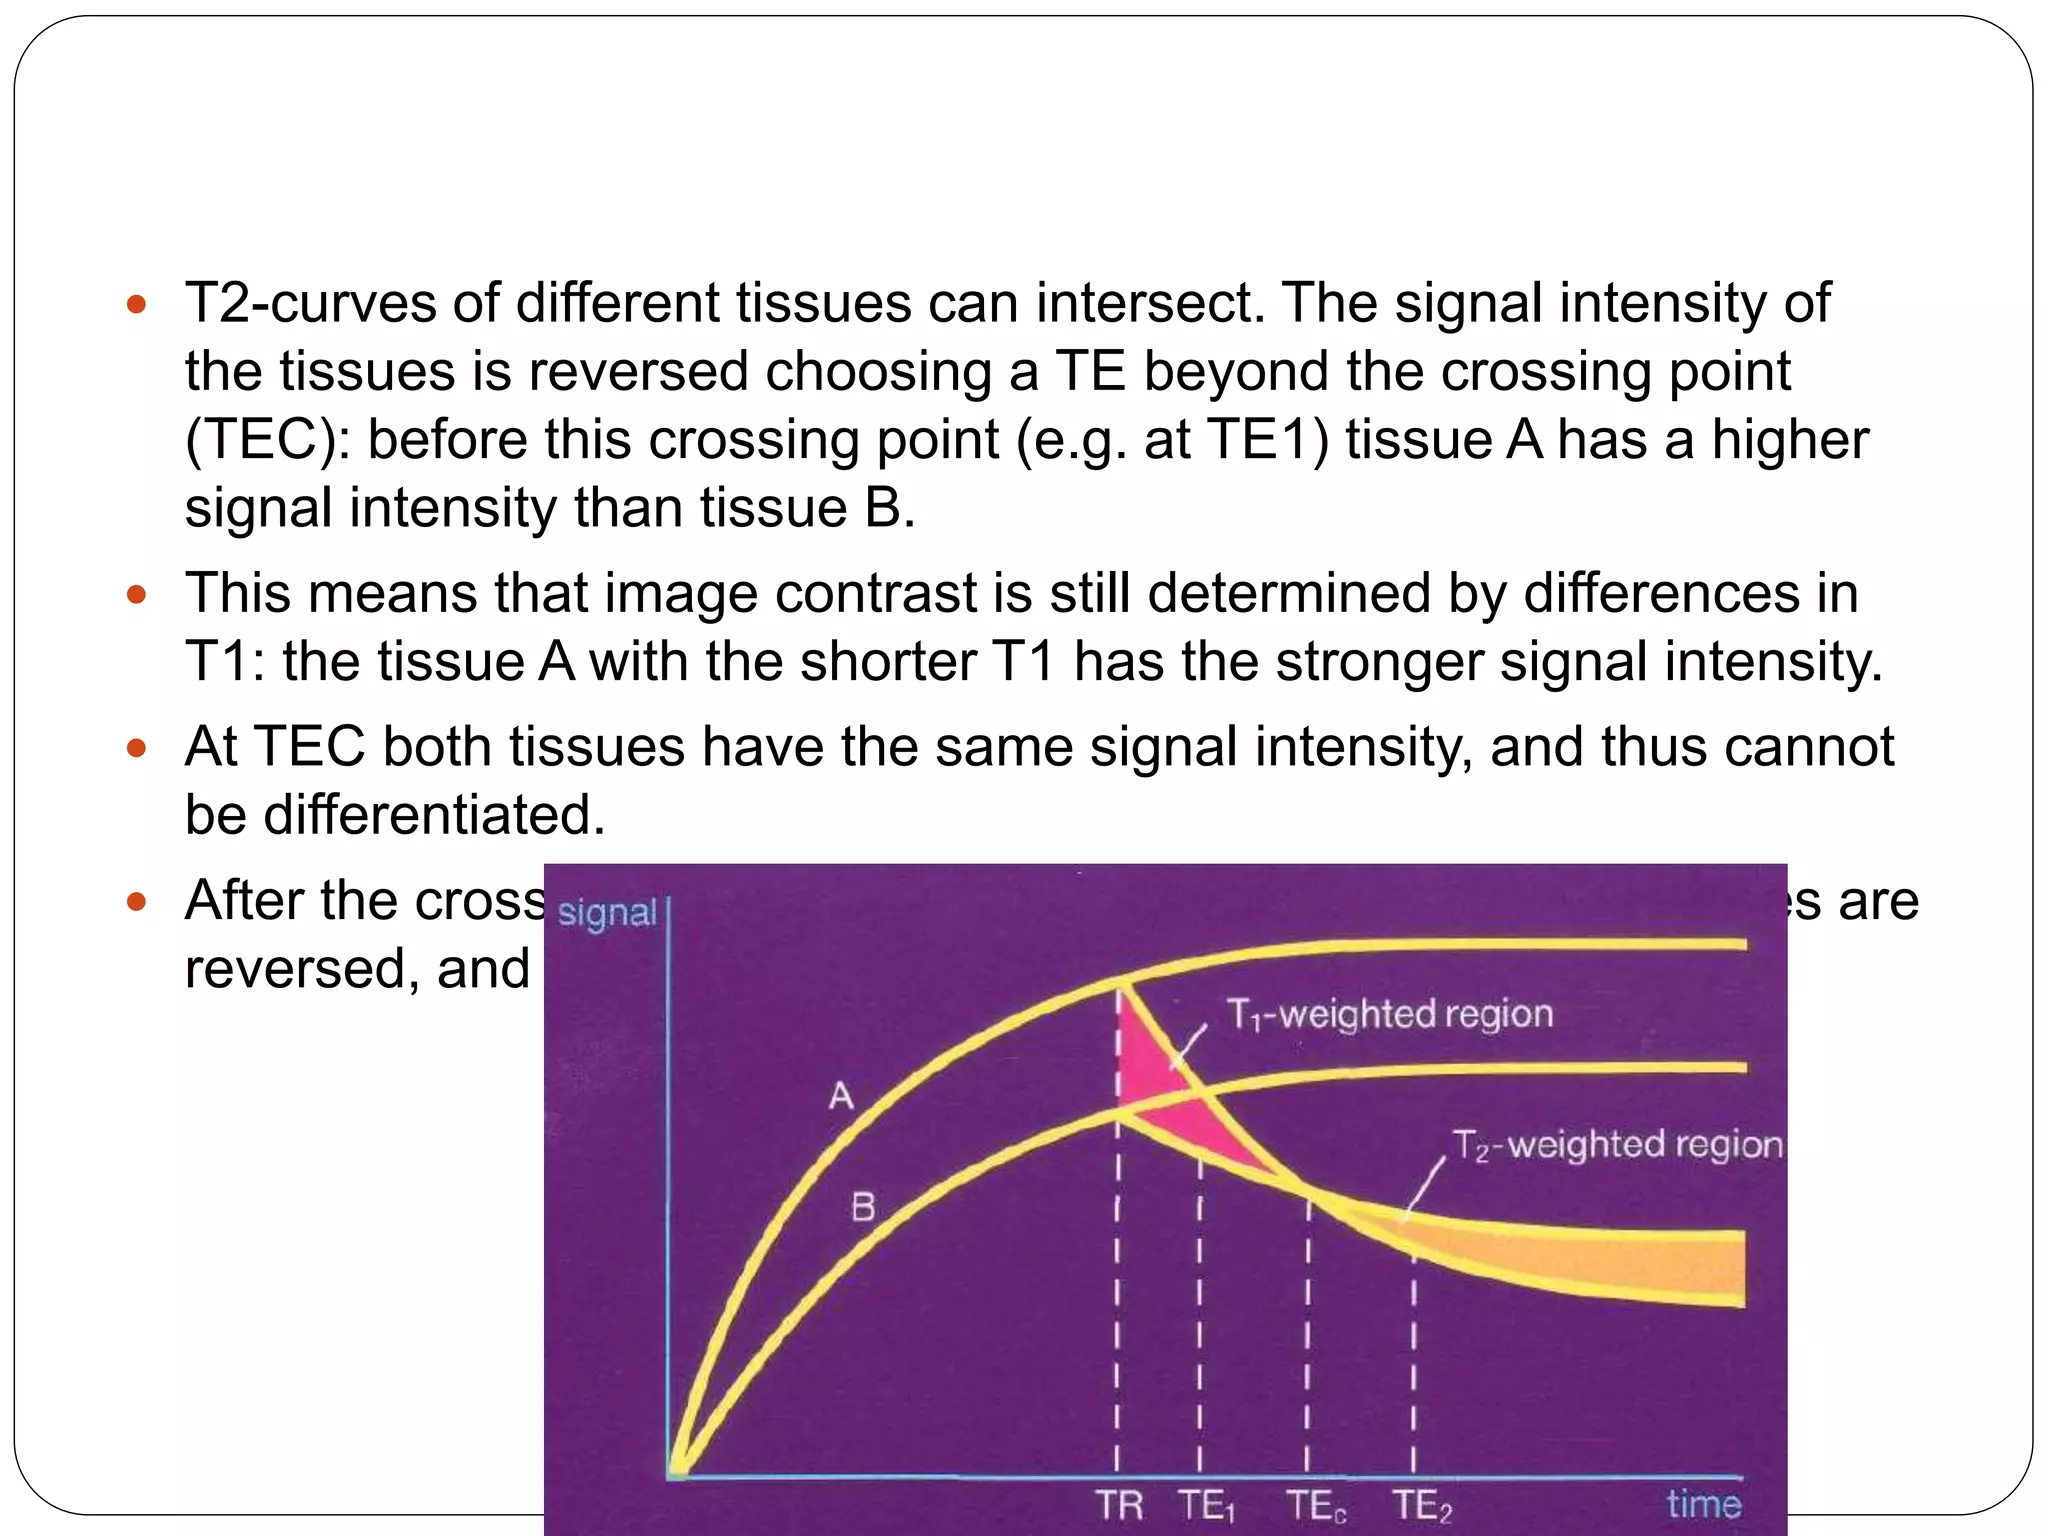
Discussion on T2-weighted images, emphasizing spin echo sequences and the significance of T2 curves in different tissues.
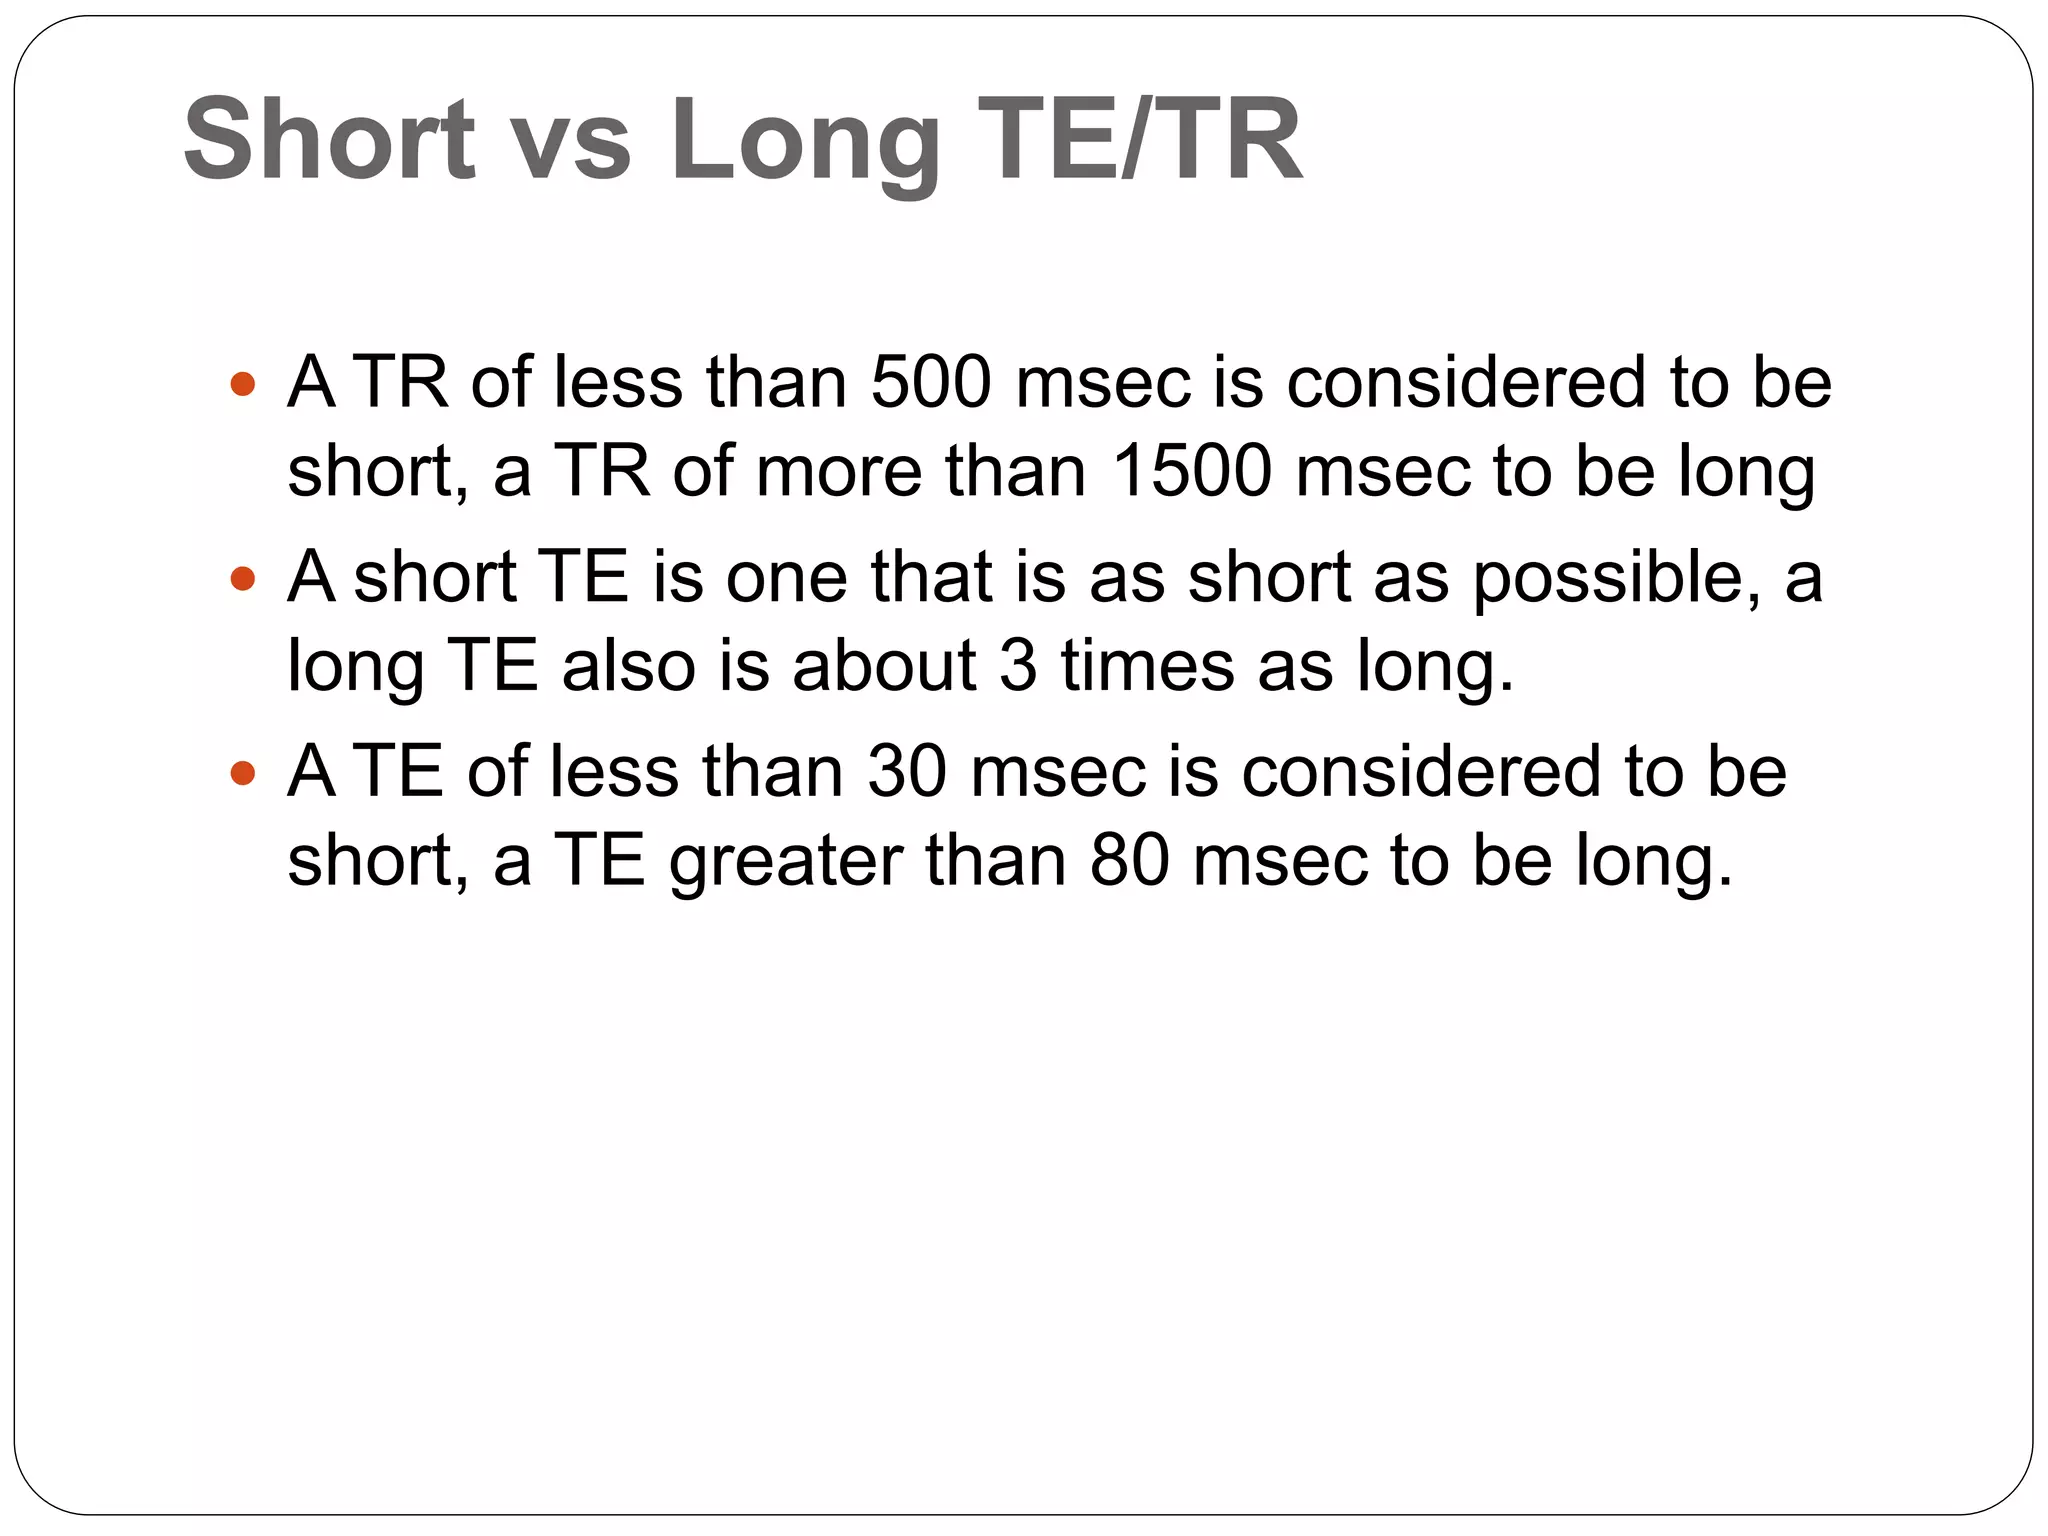
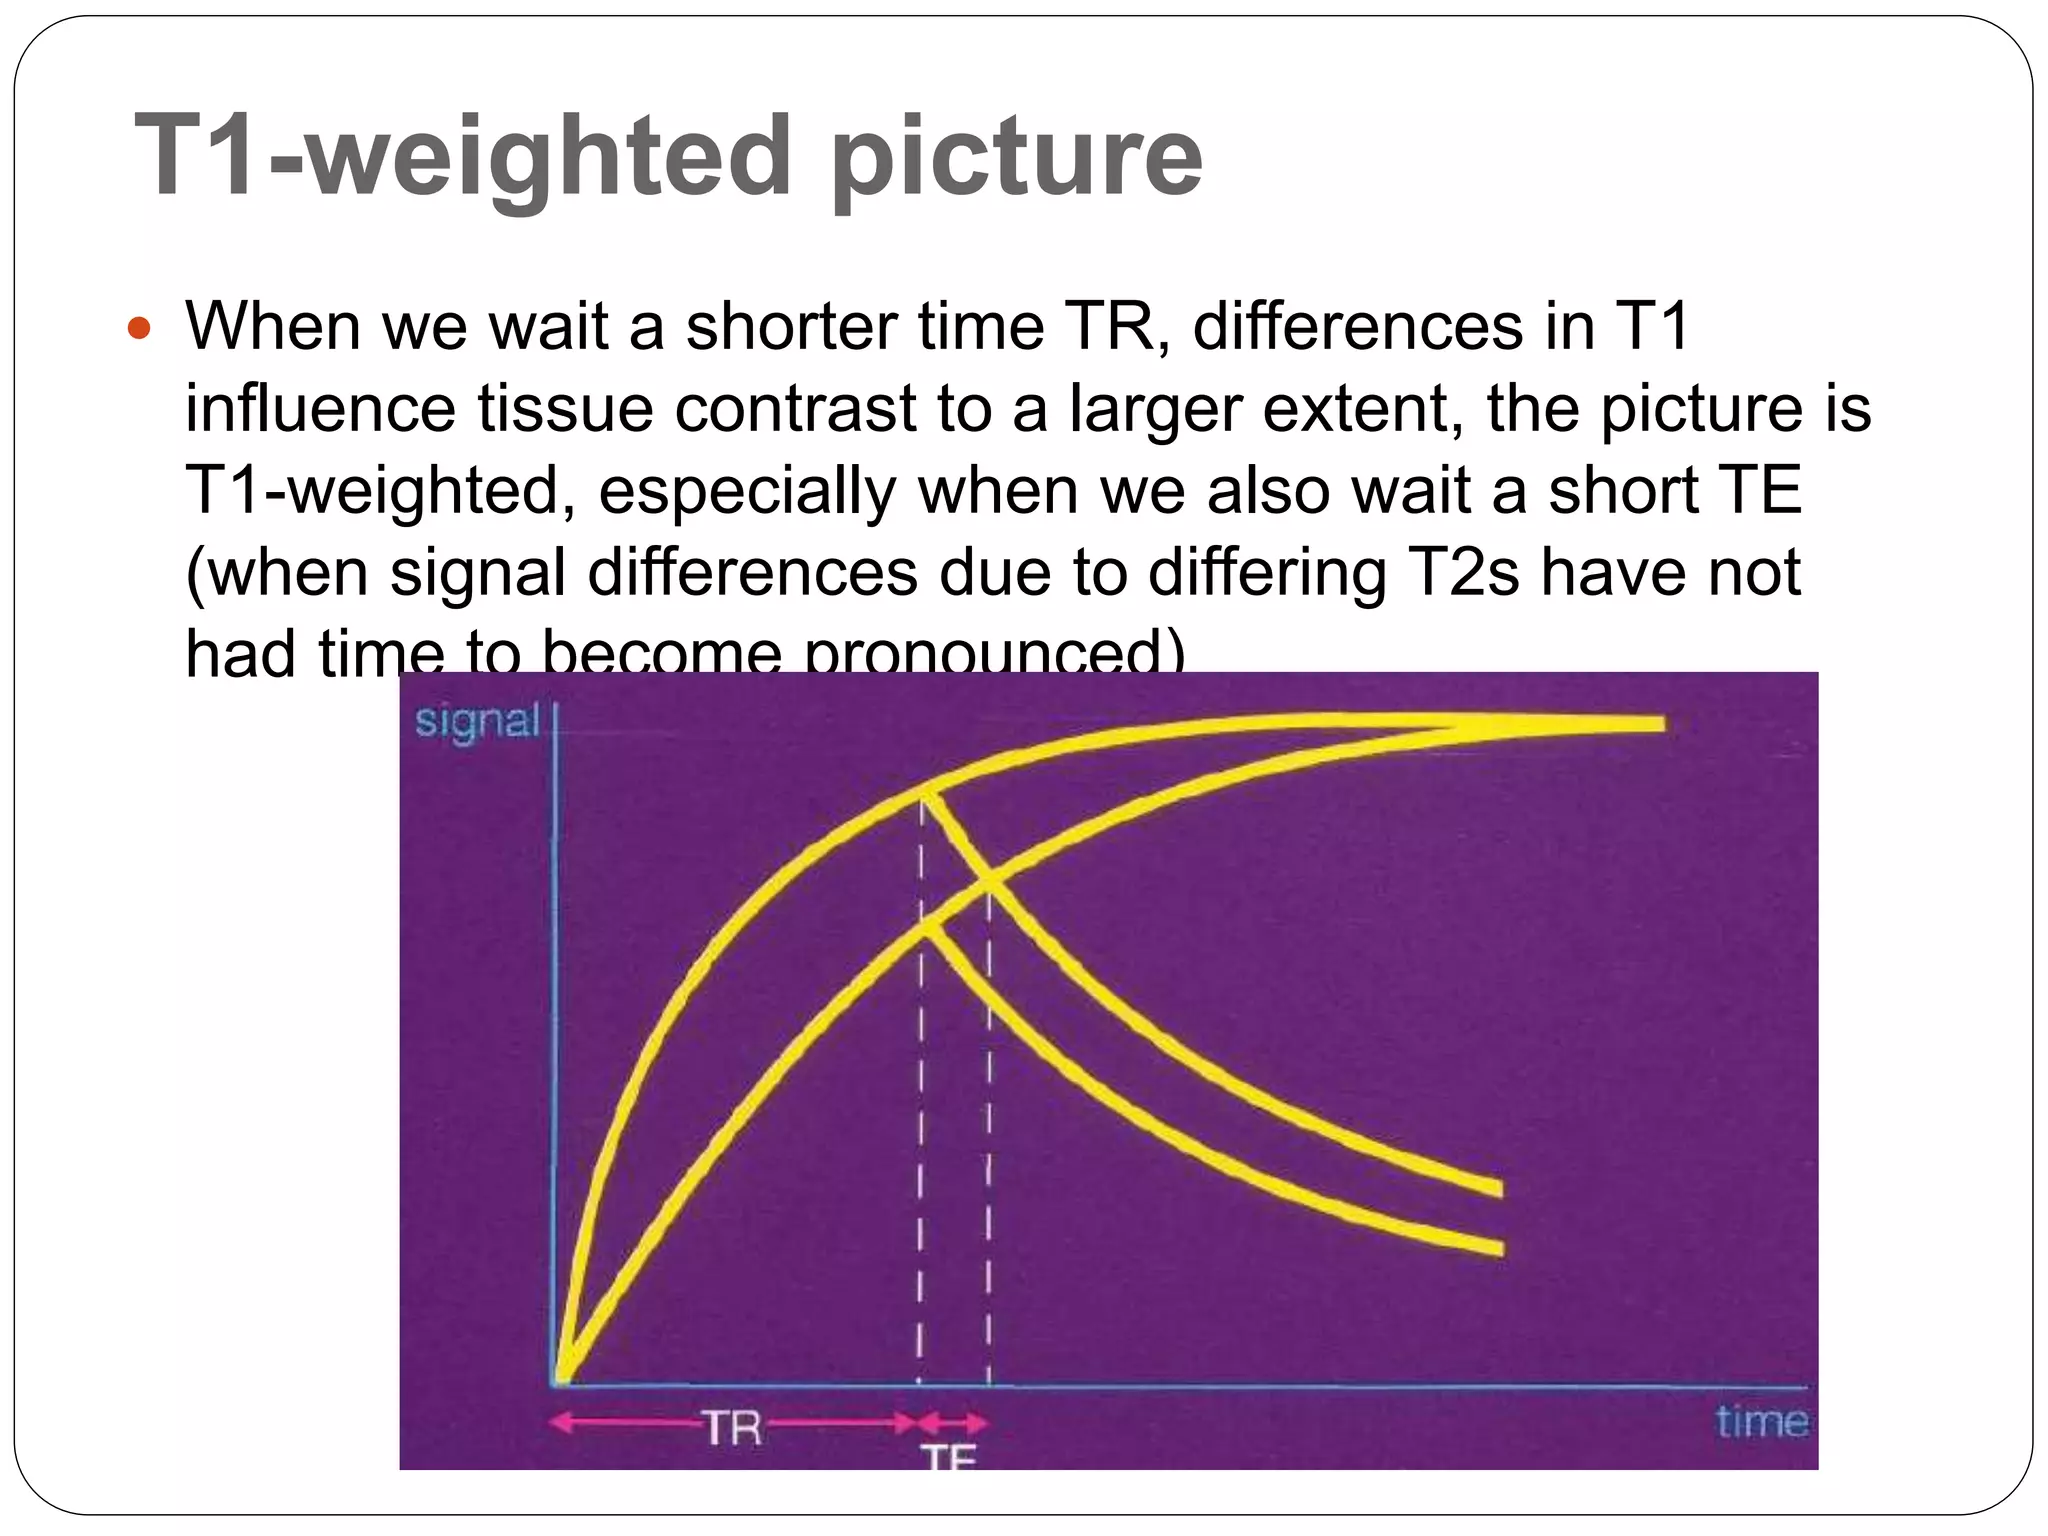
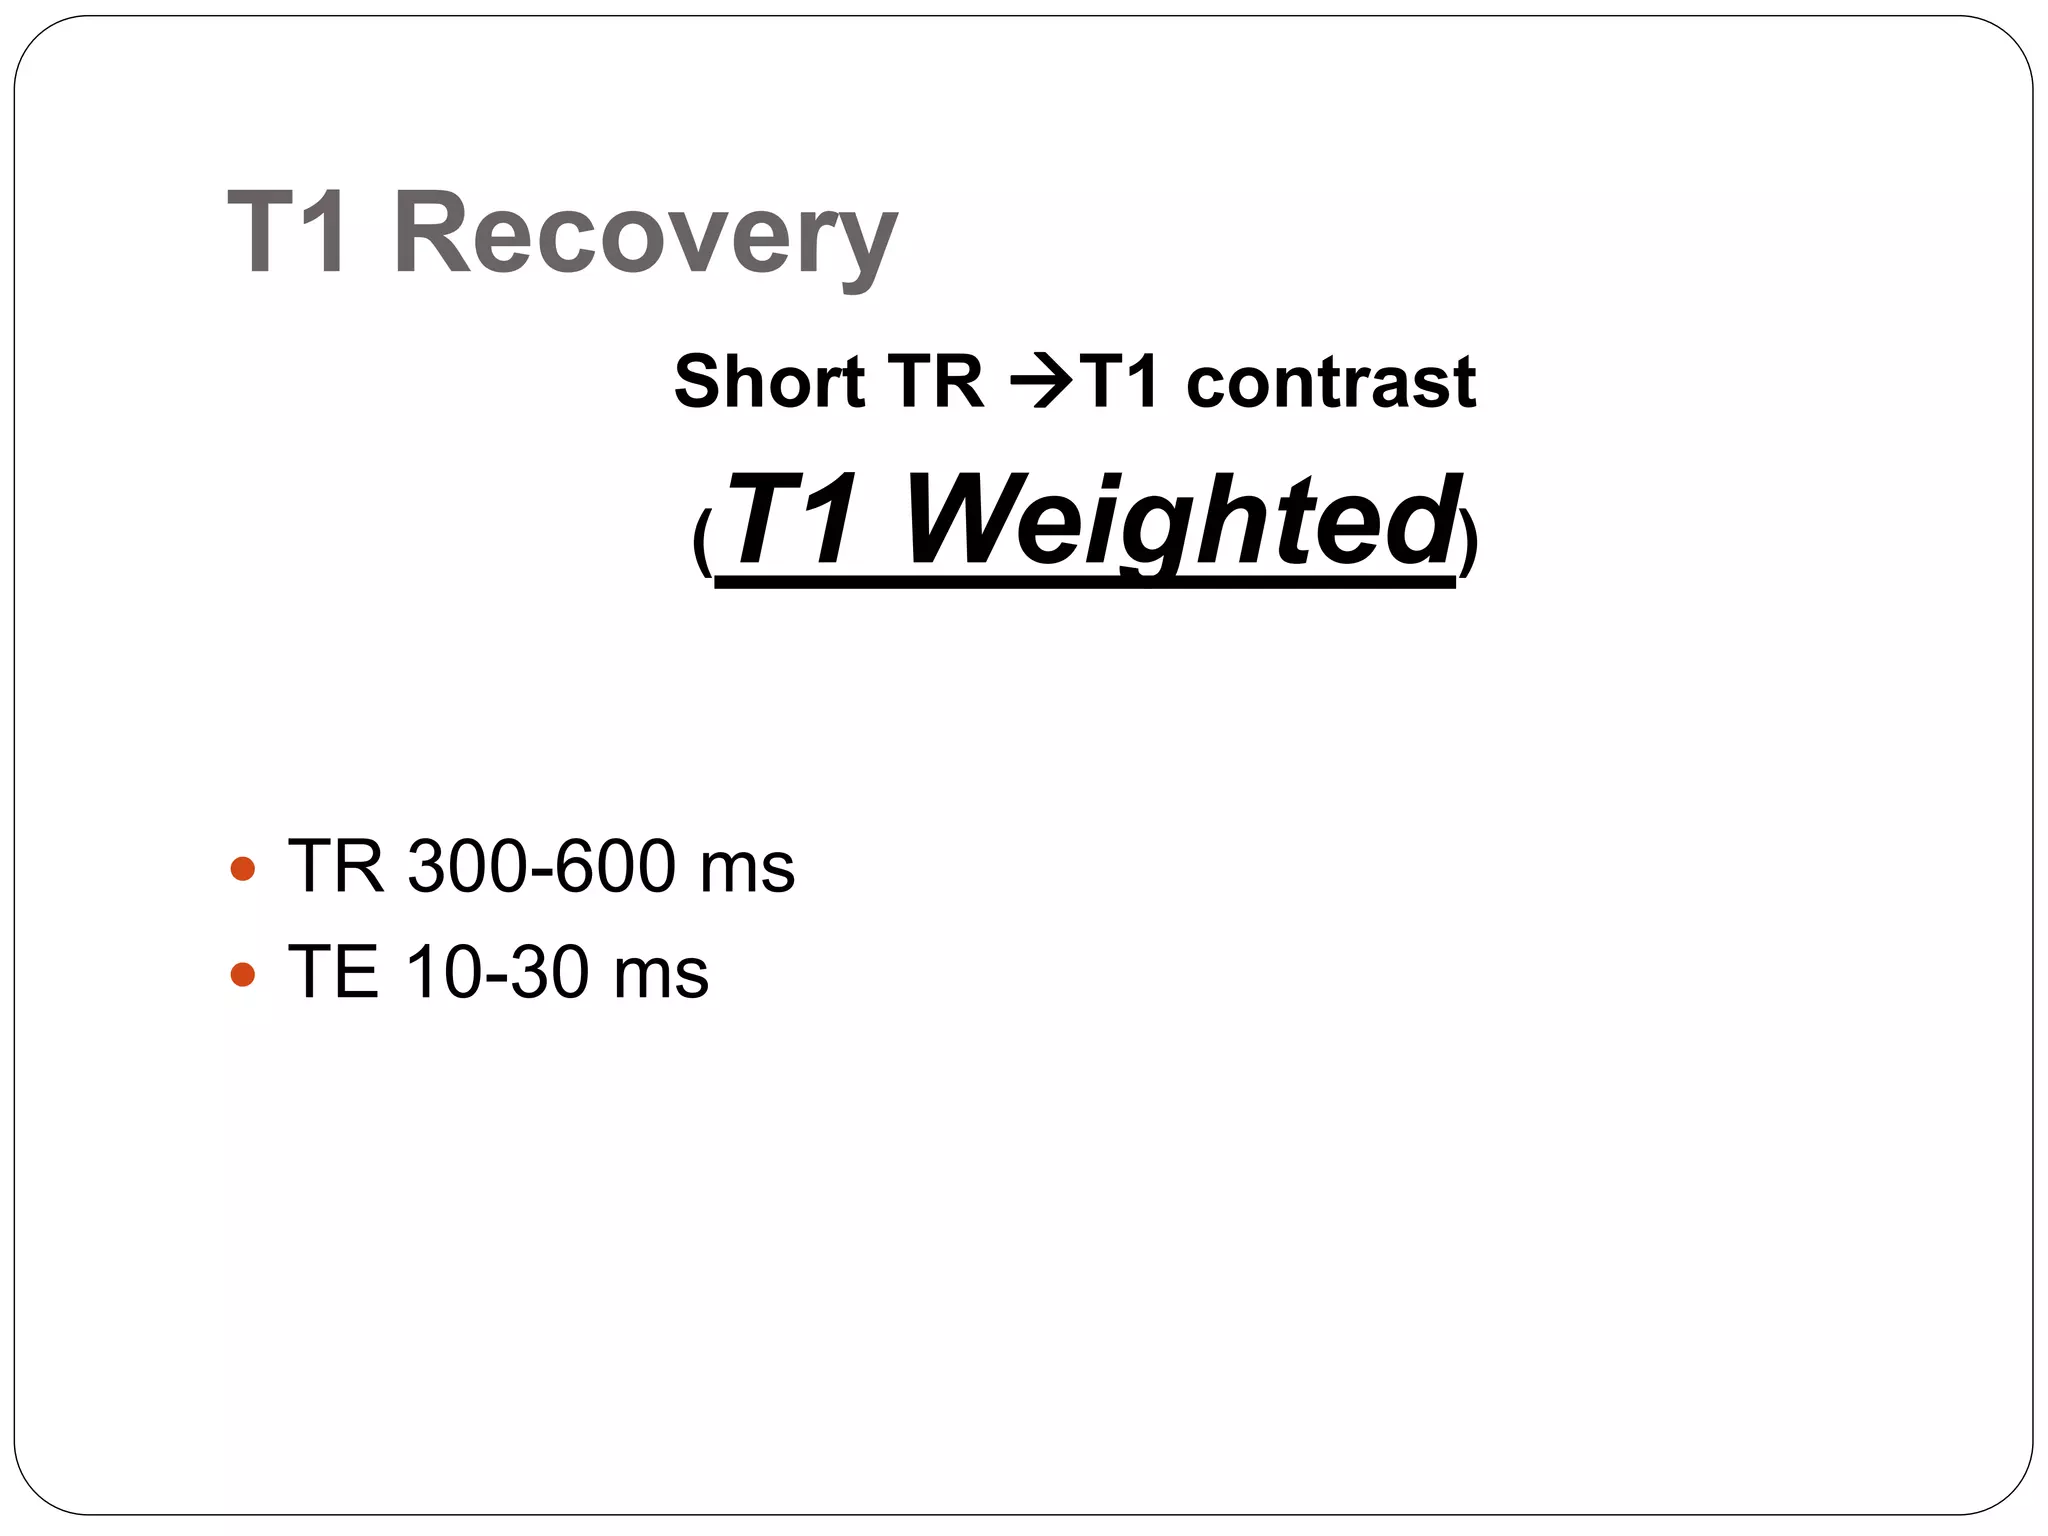
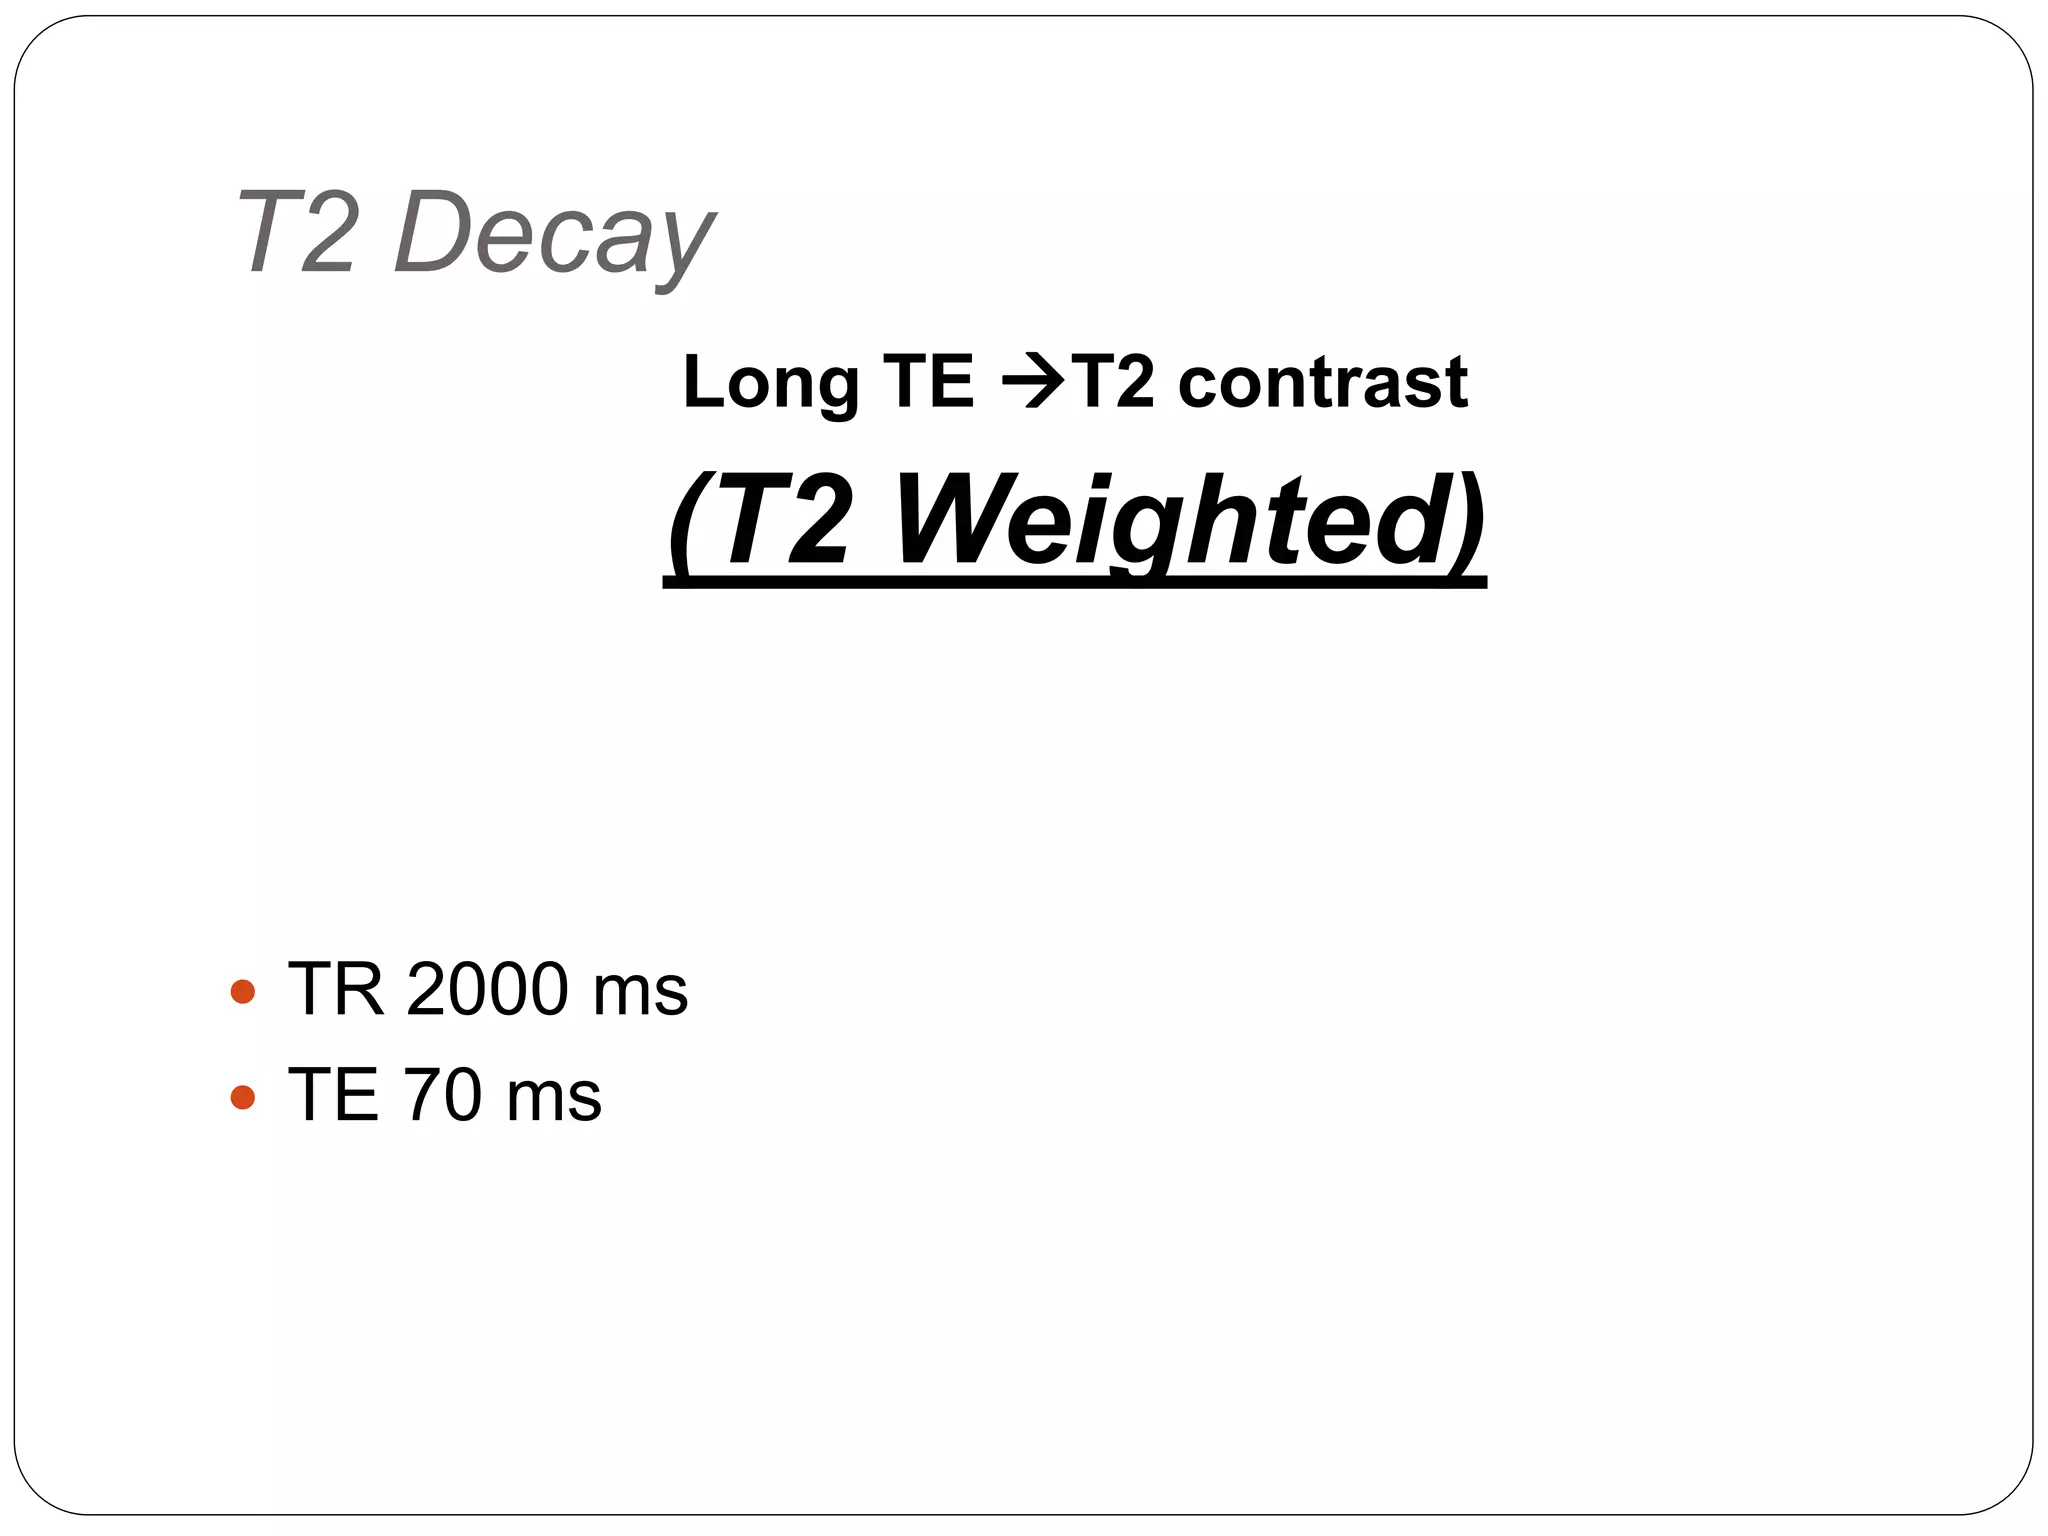
Definitions of short vs long TR/TE, effects on T1-weighted and T2-weighted imaging contrasts, including tissue appearance.
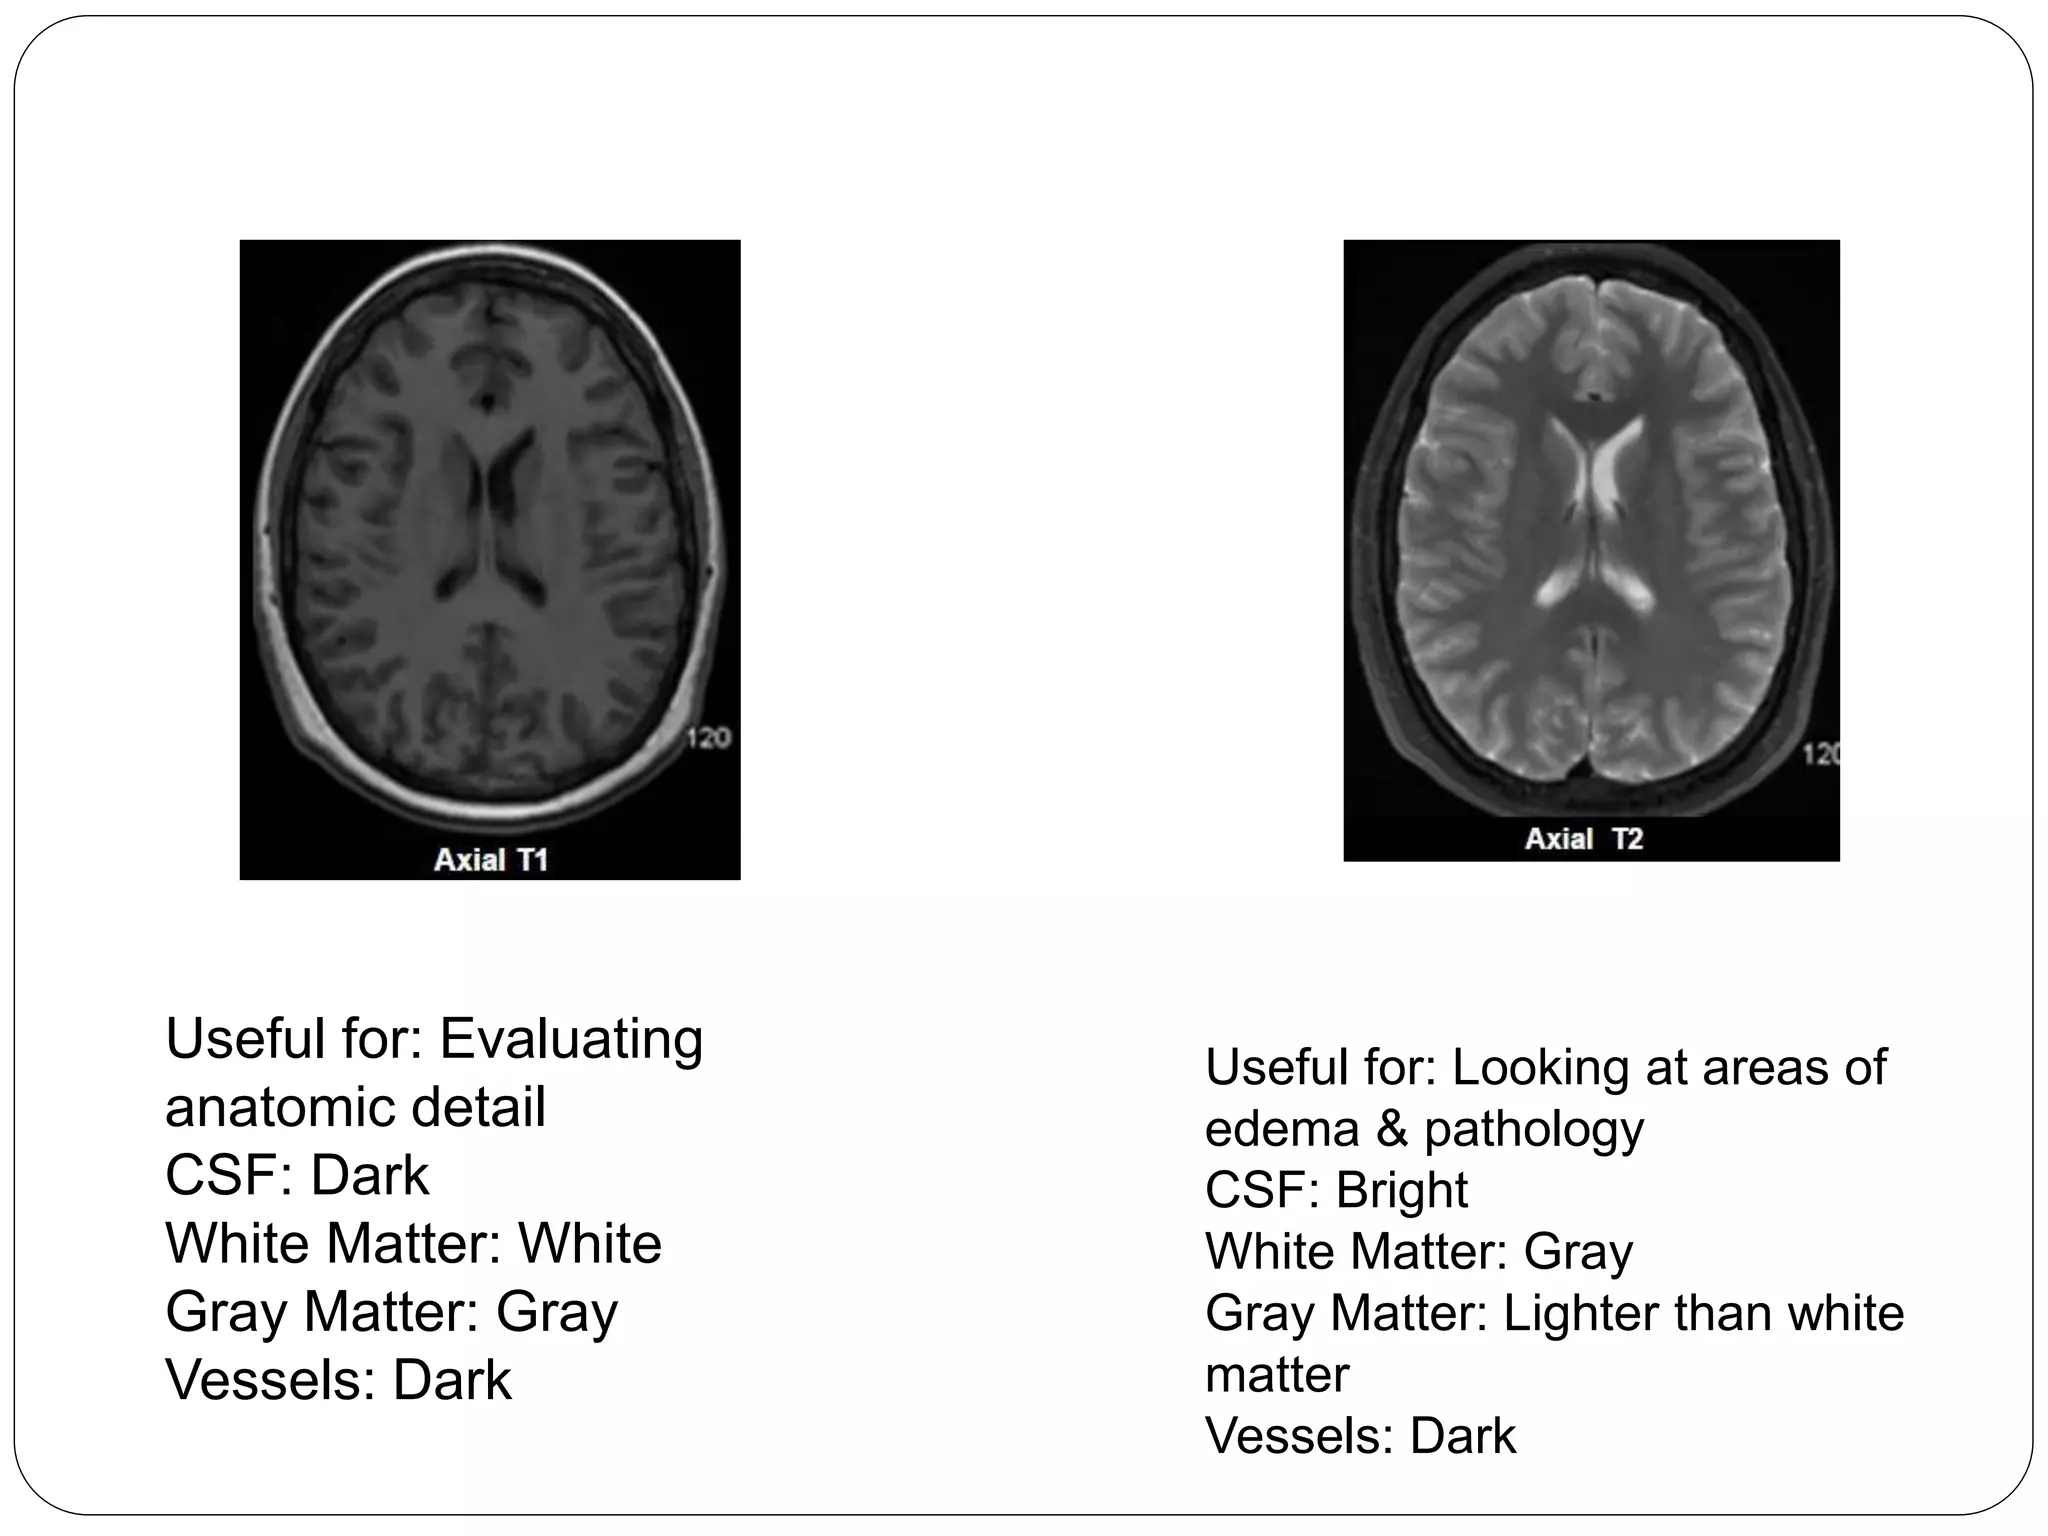
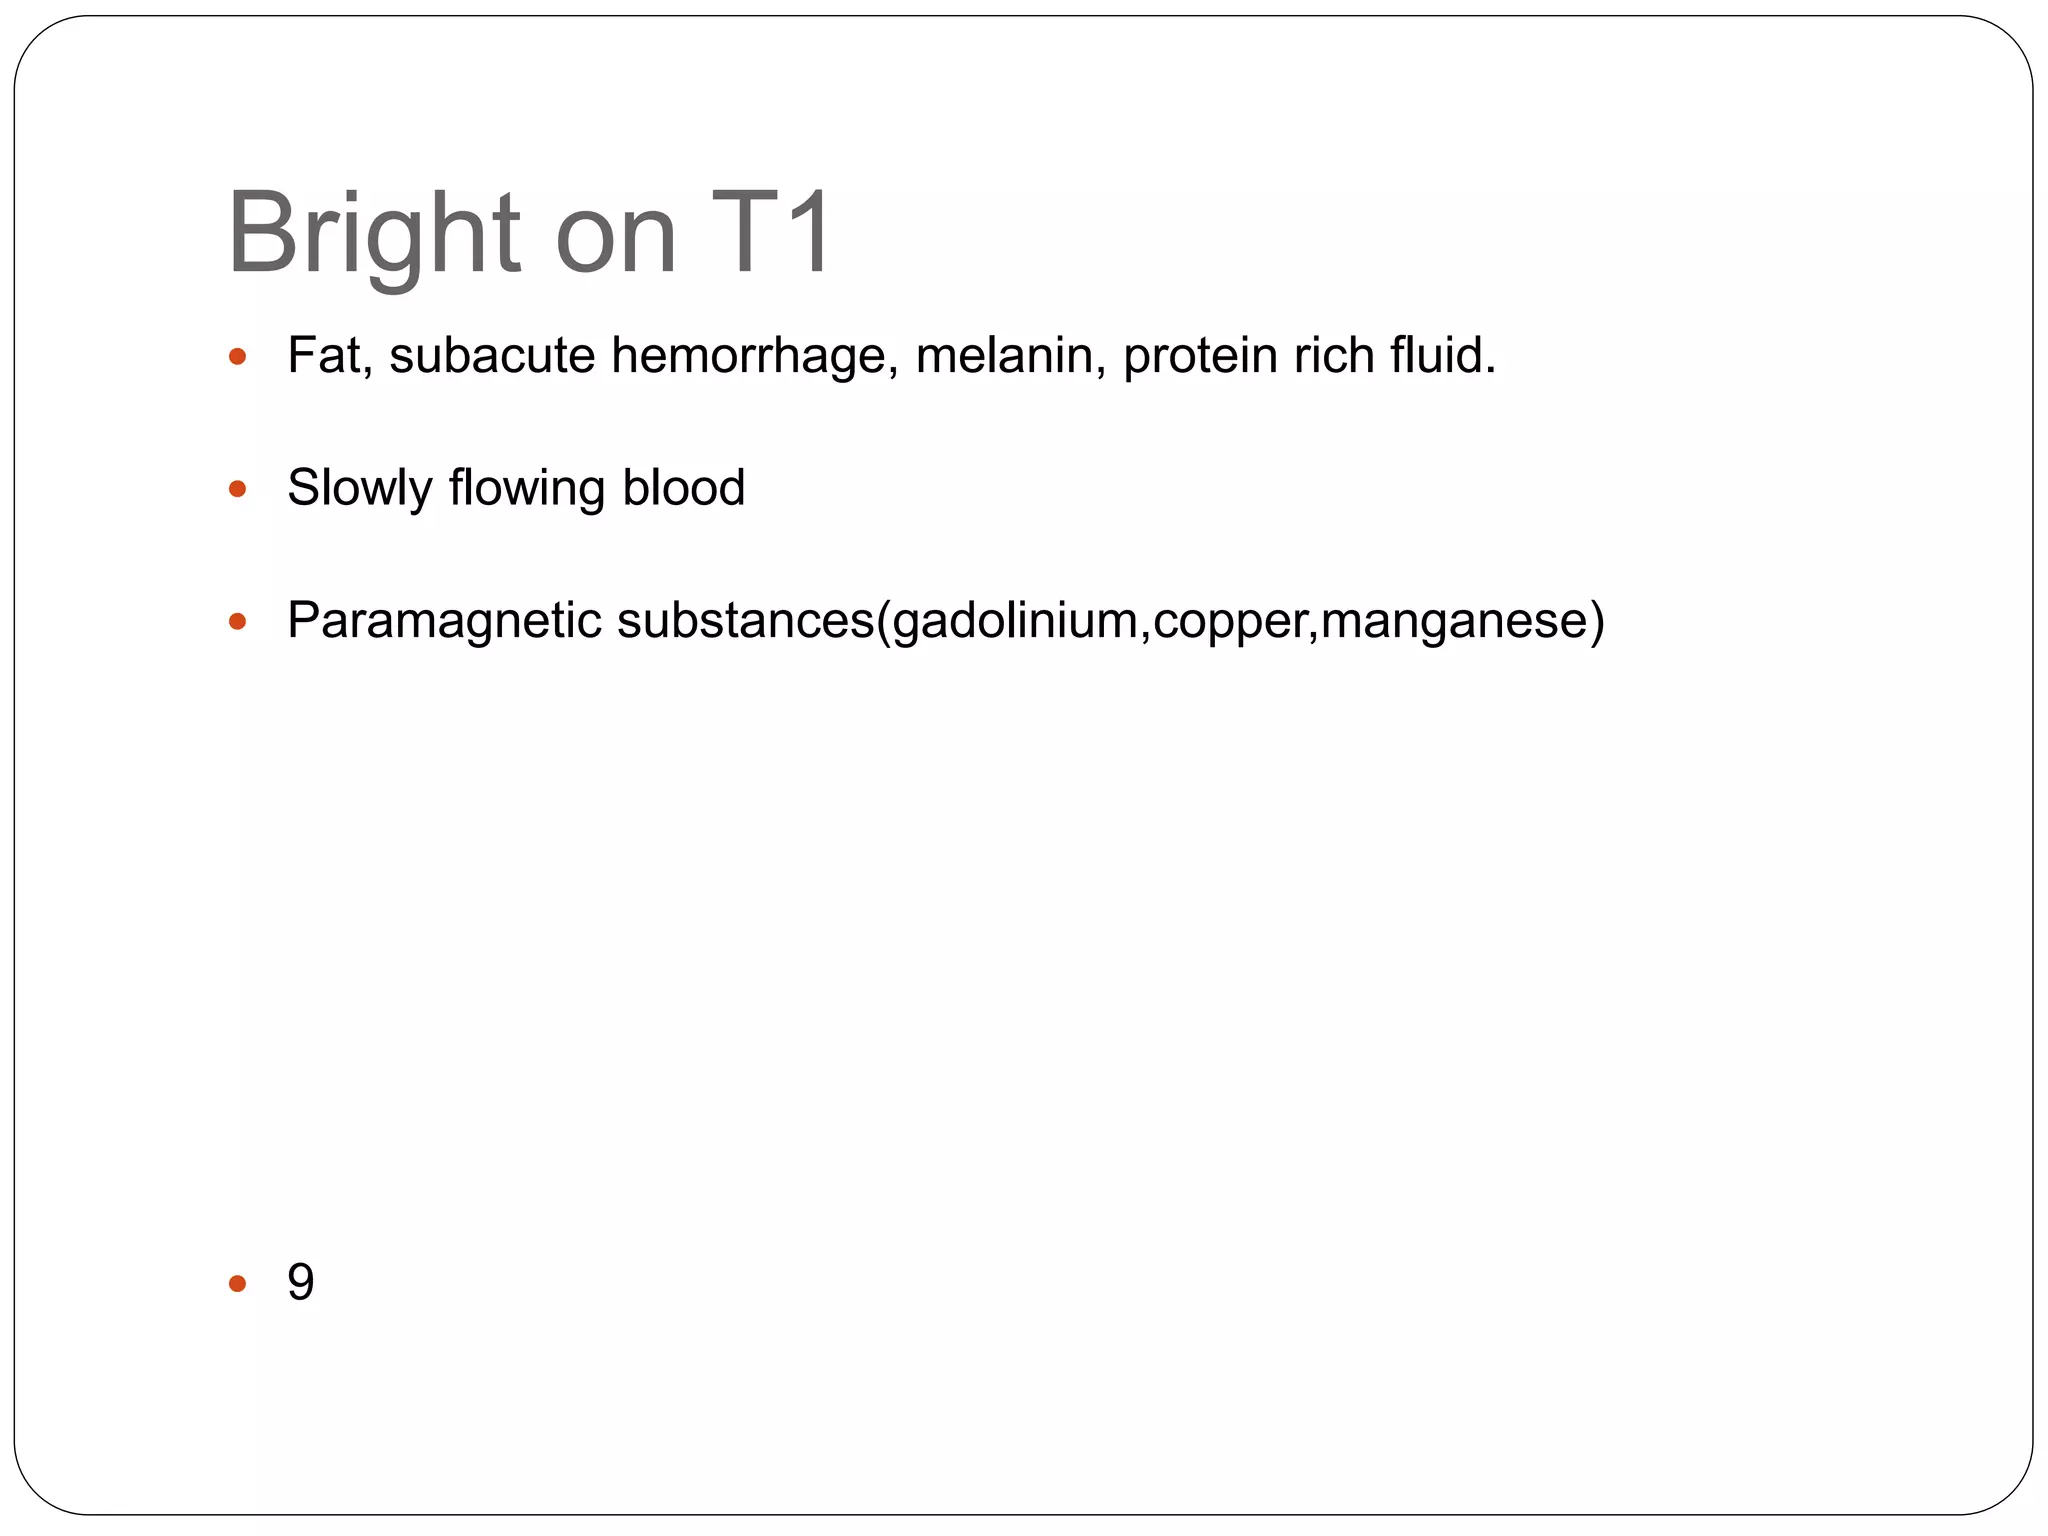
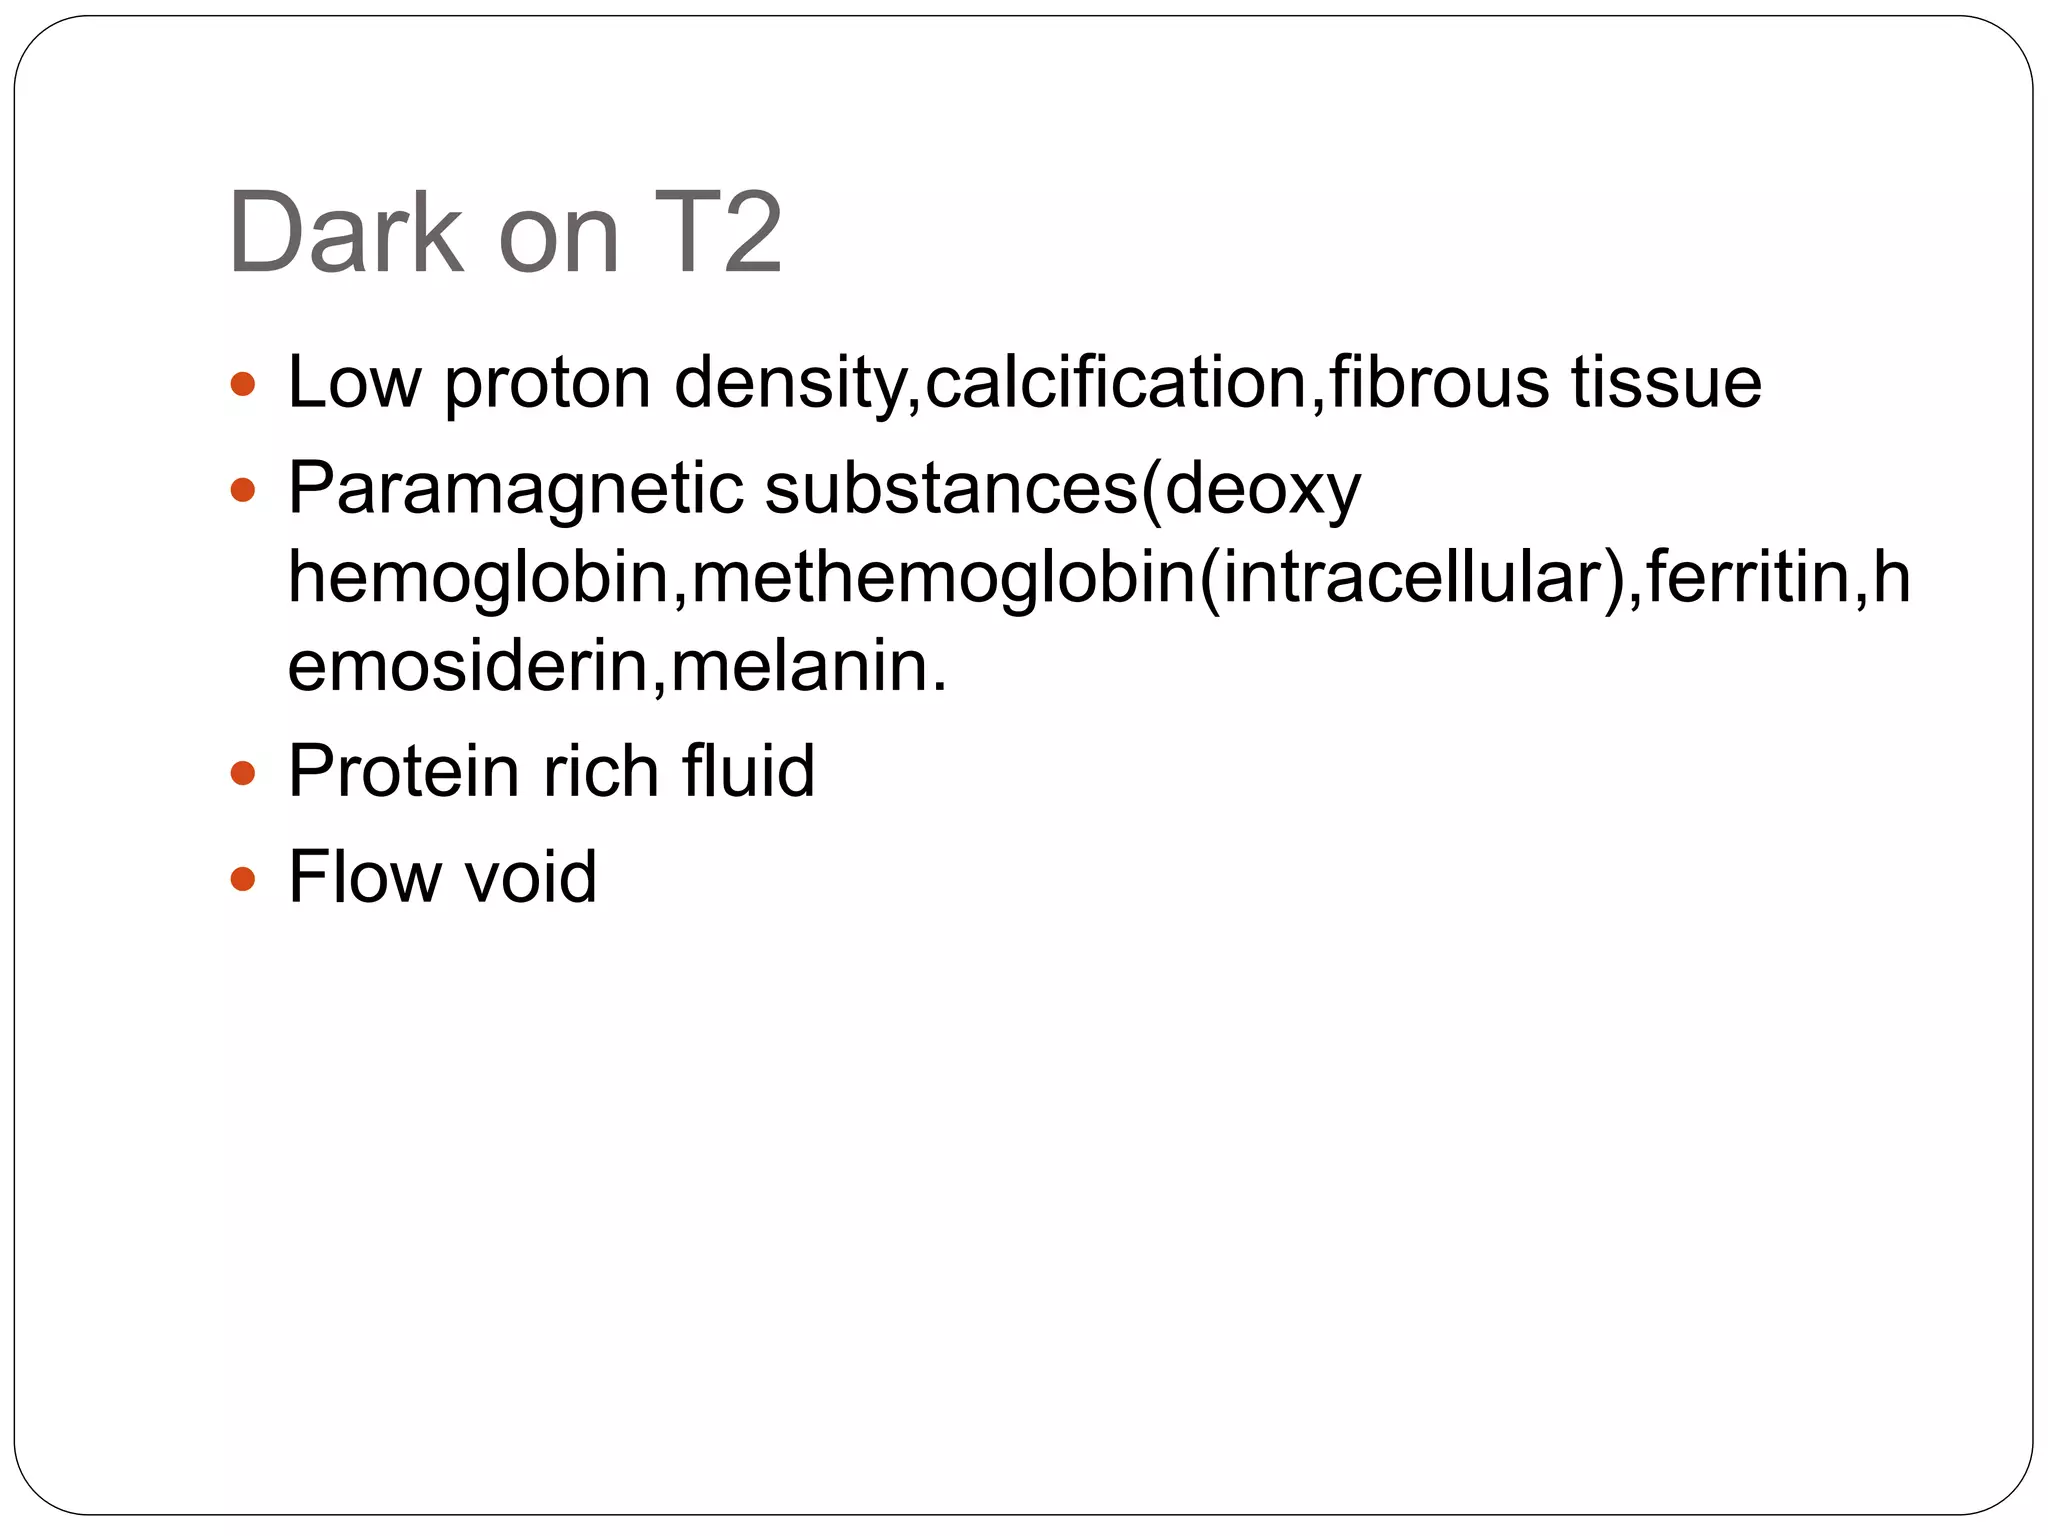
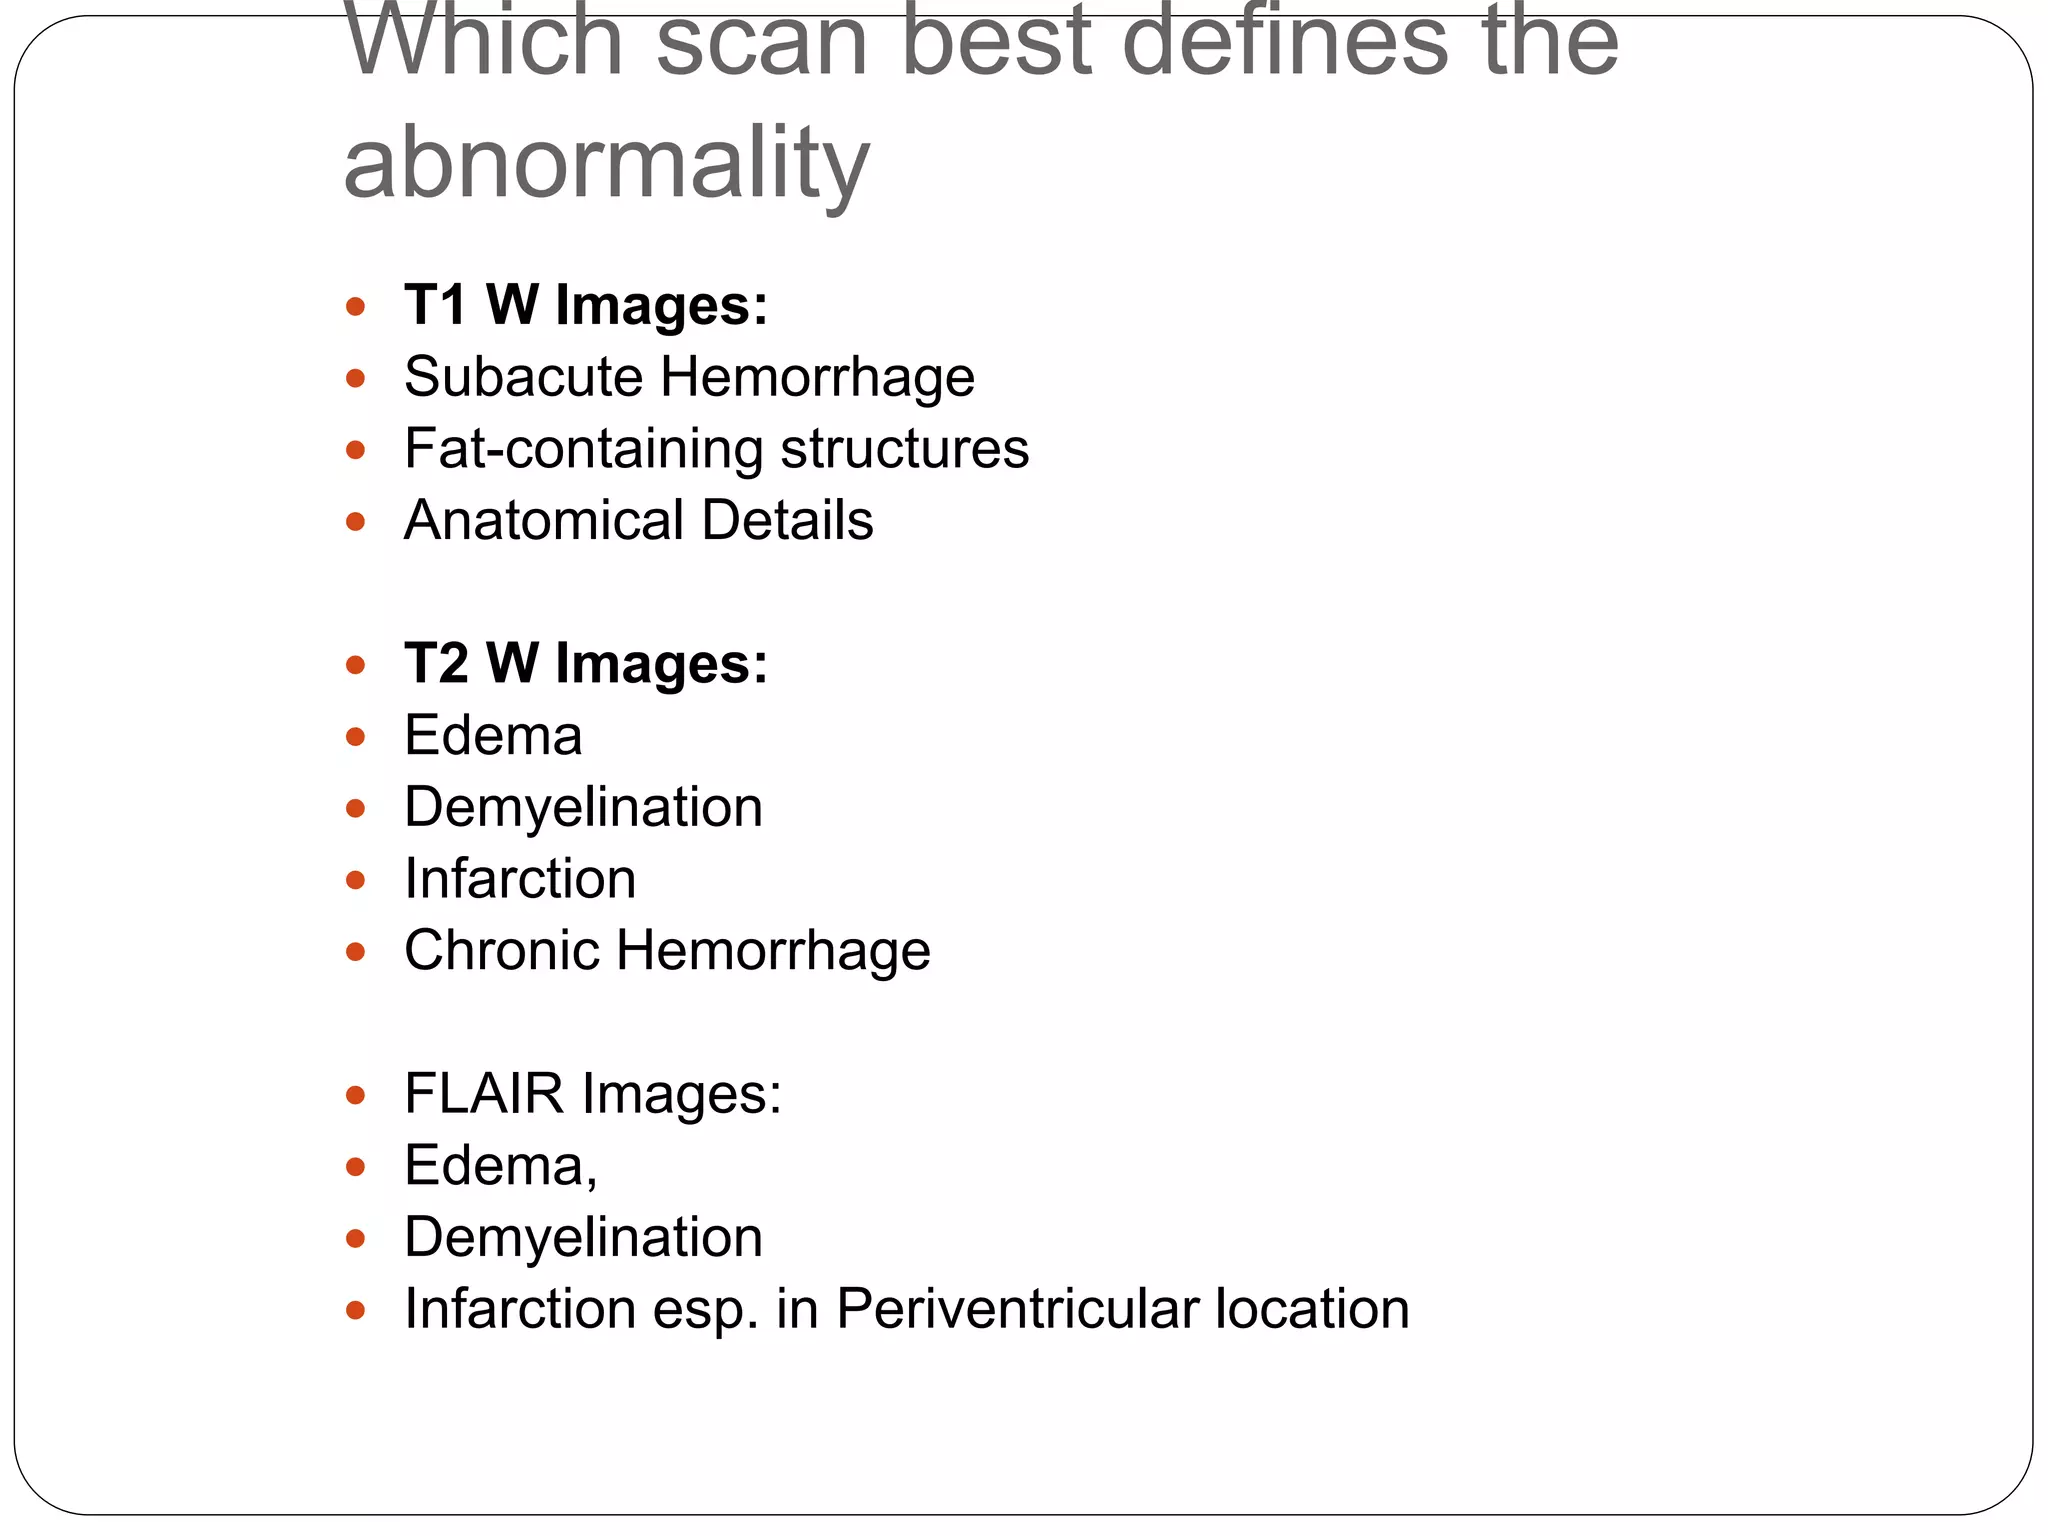
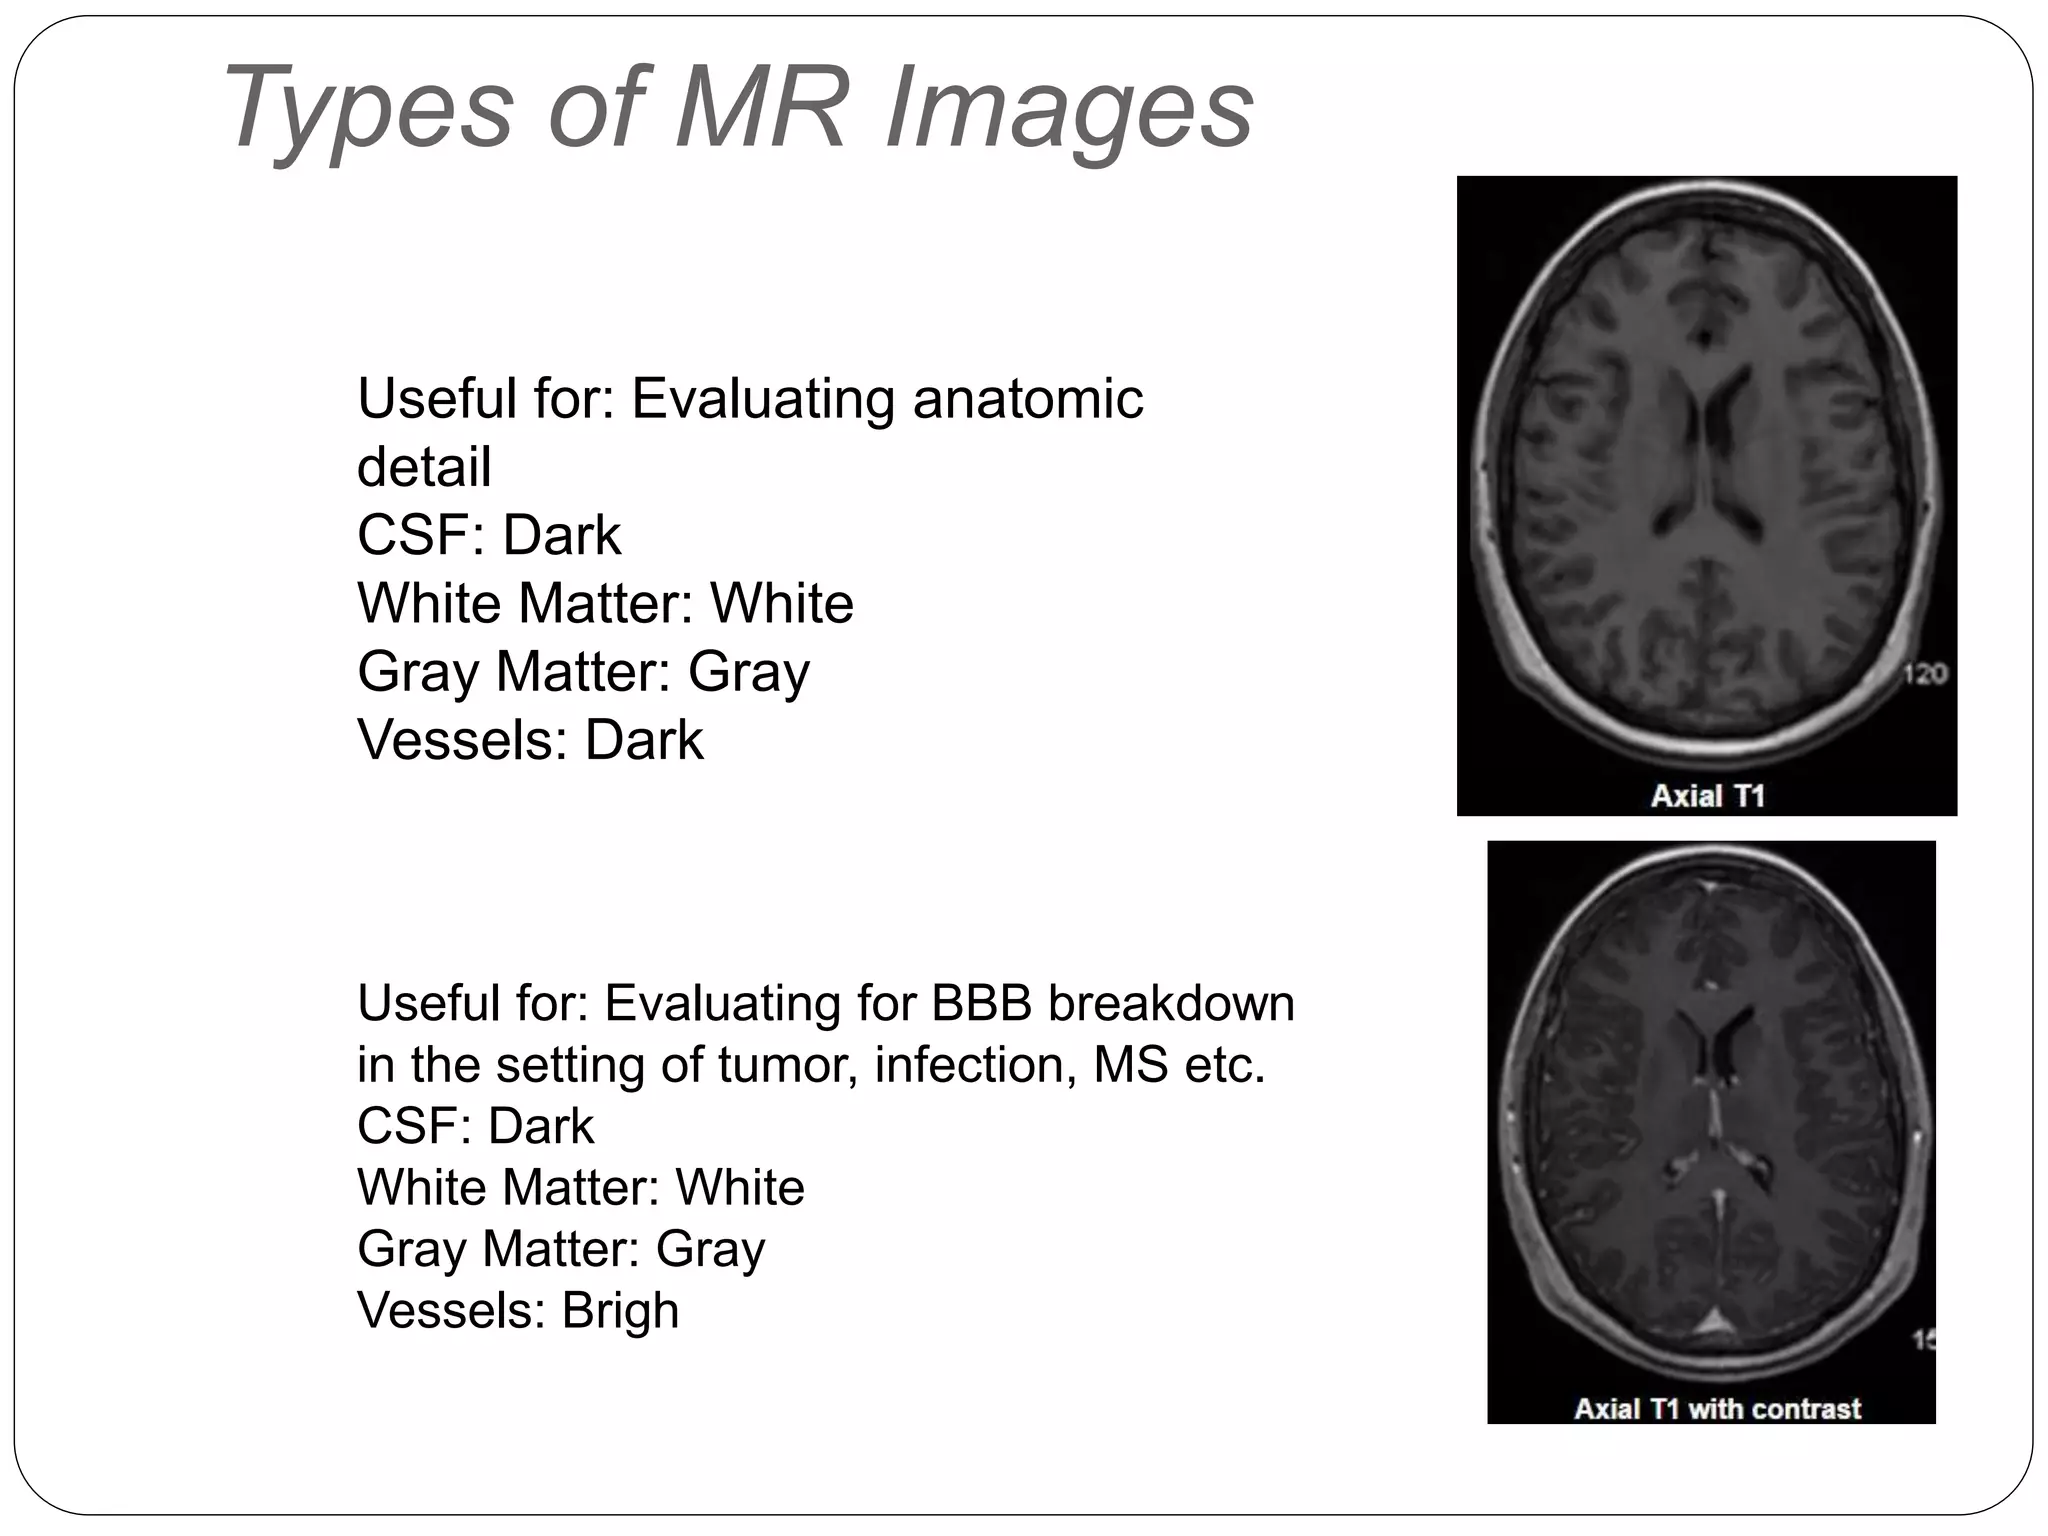
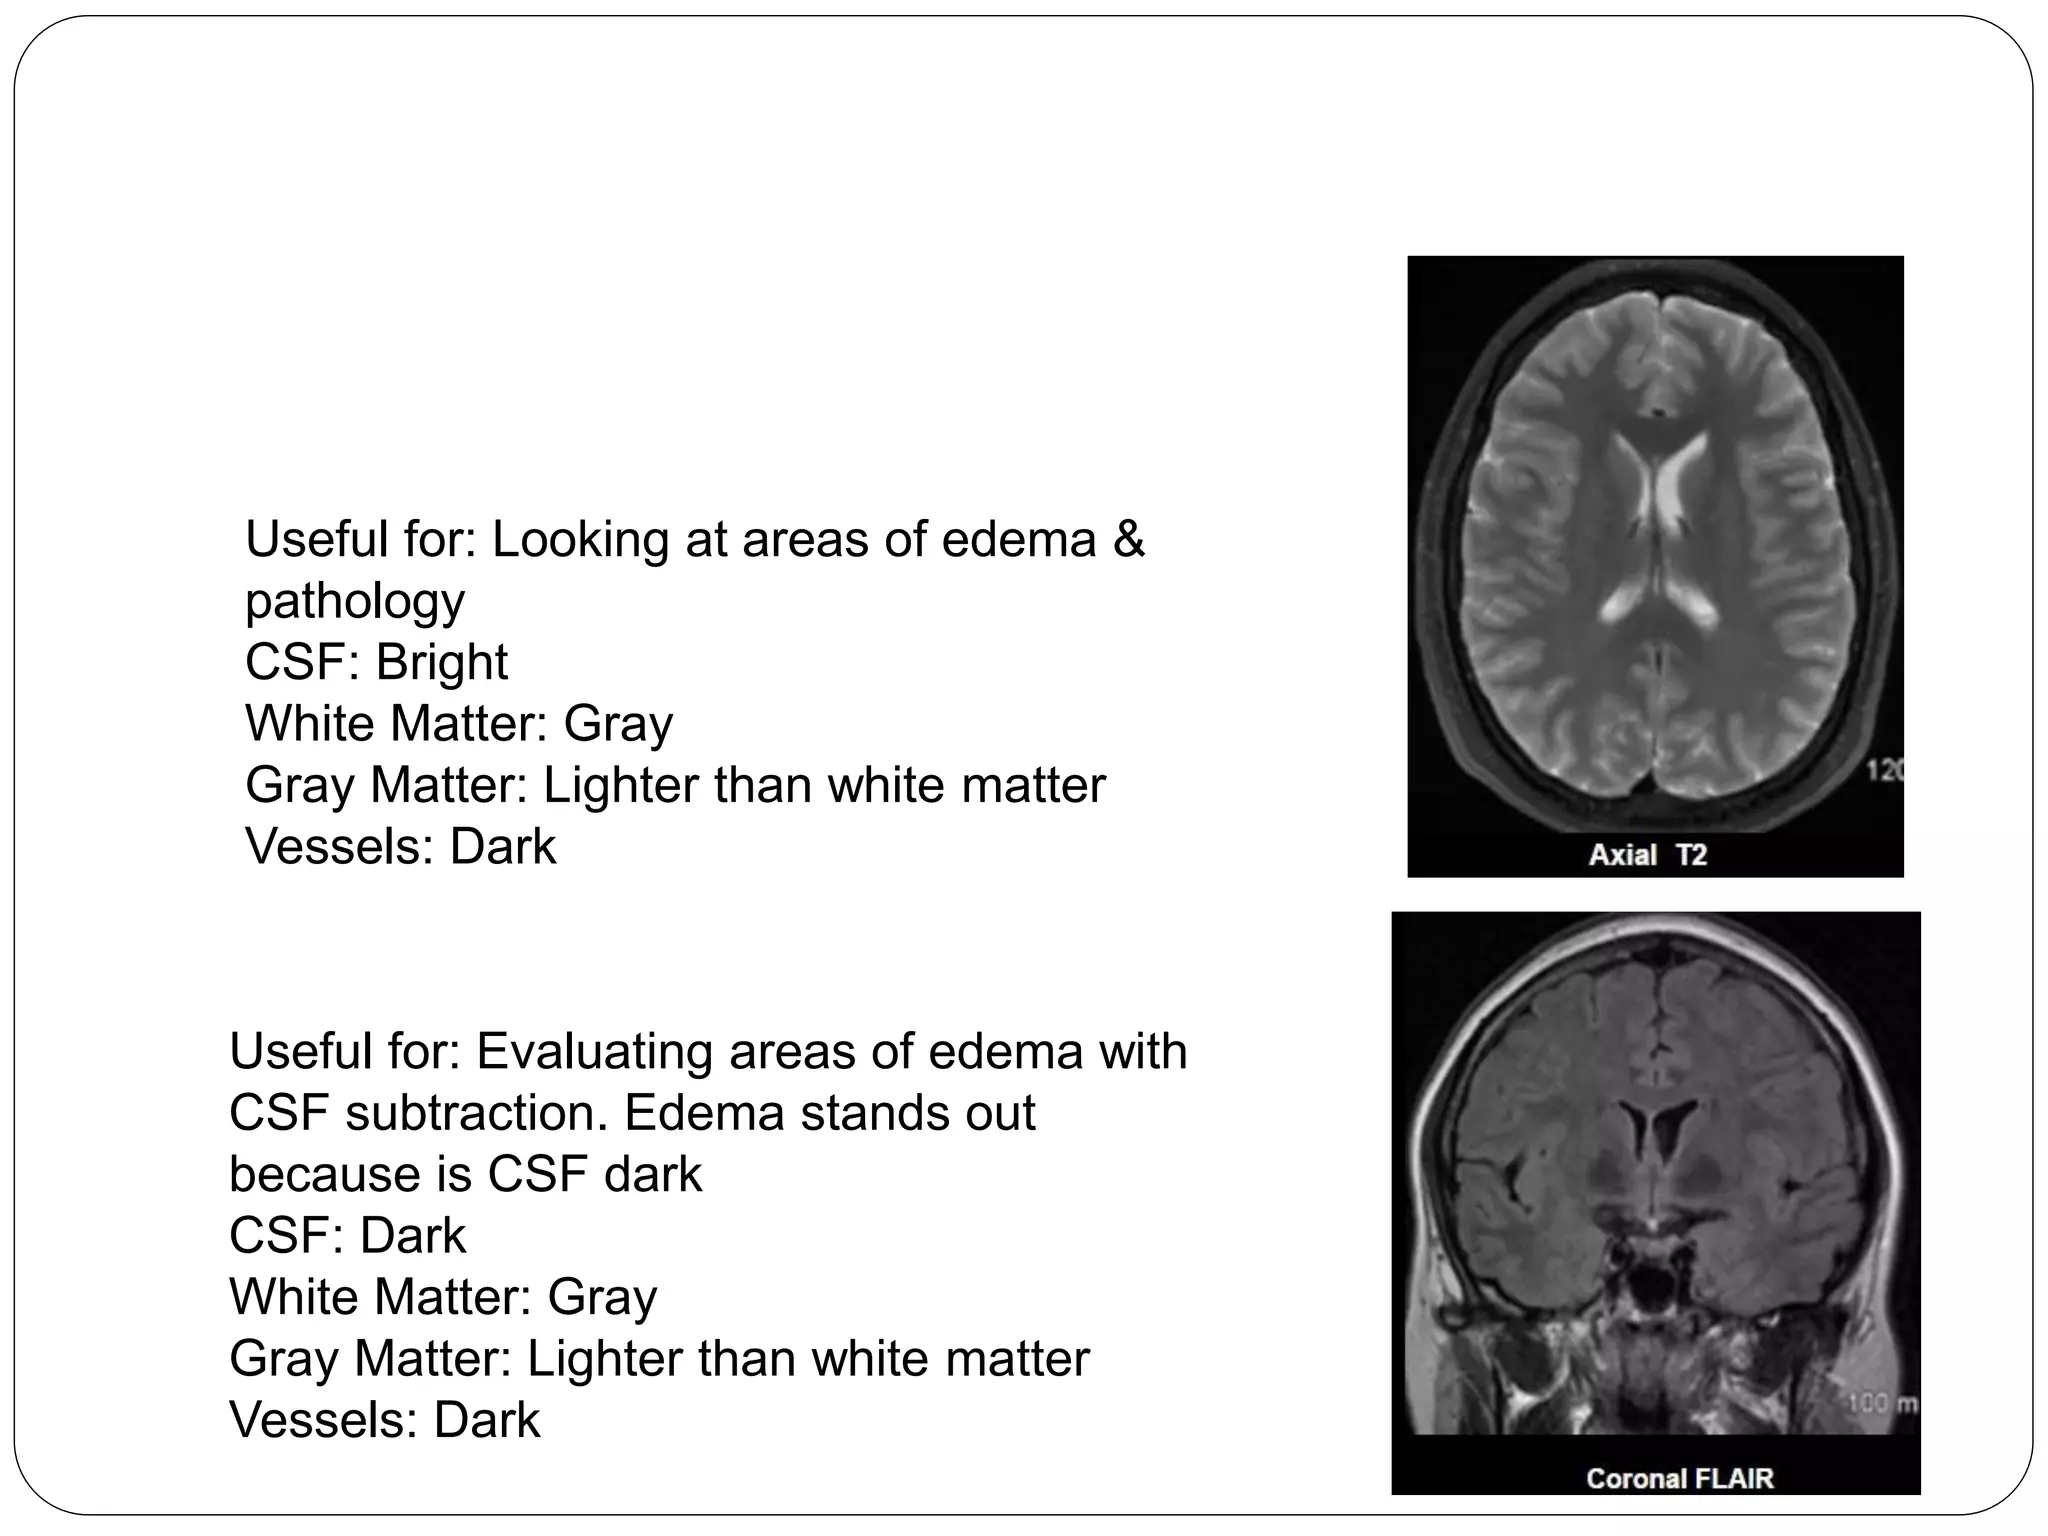
Details on bright/dark appearances for various tissues in T1 and T2-weighted images, facilitating the diagnosis of conditions.
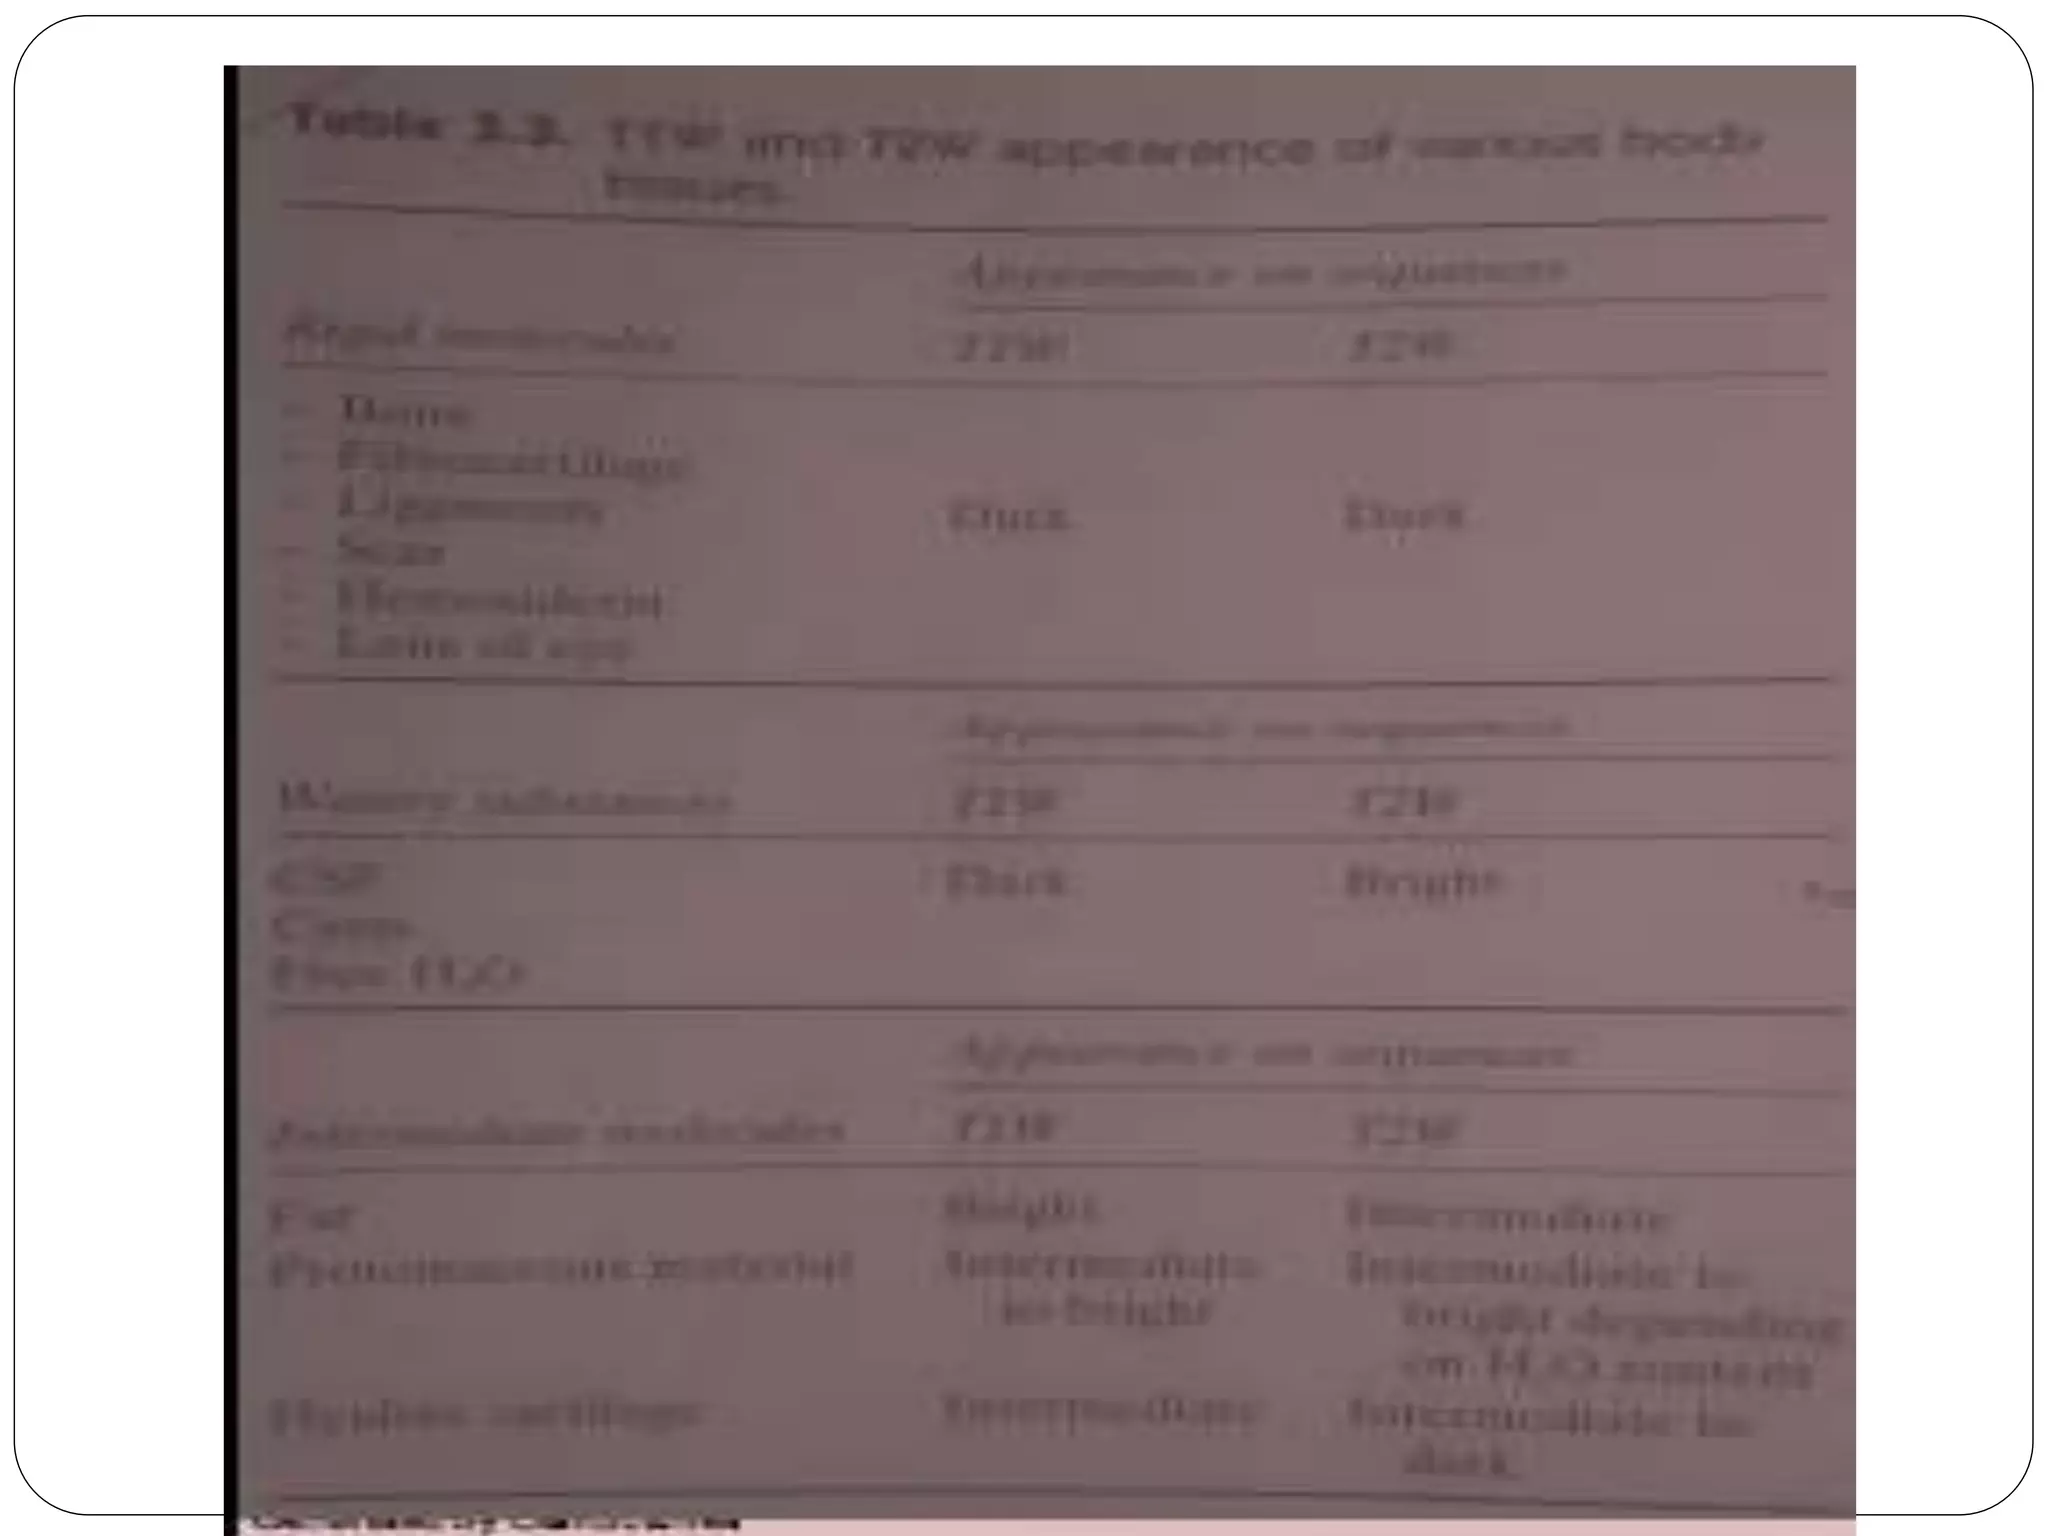
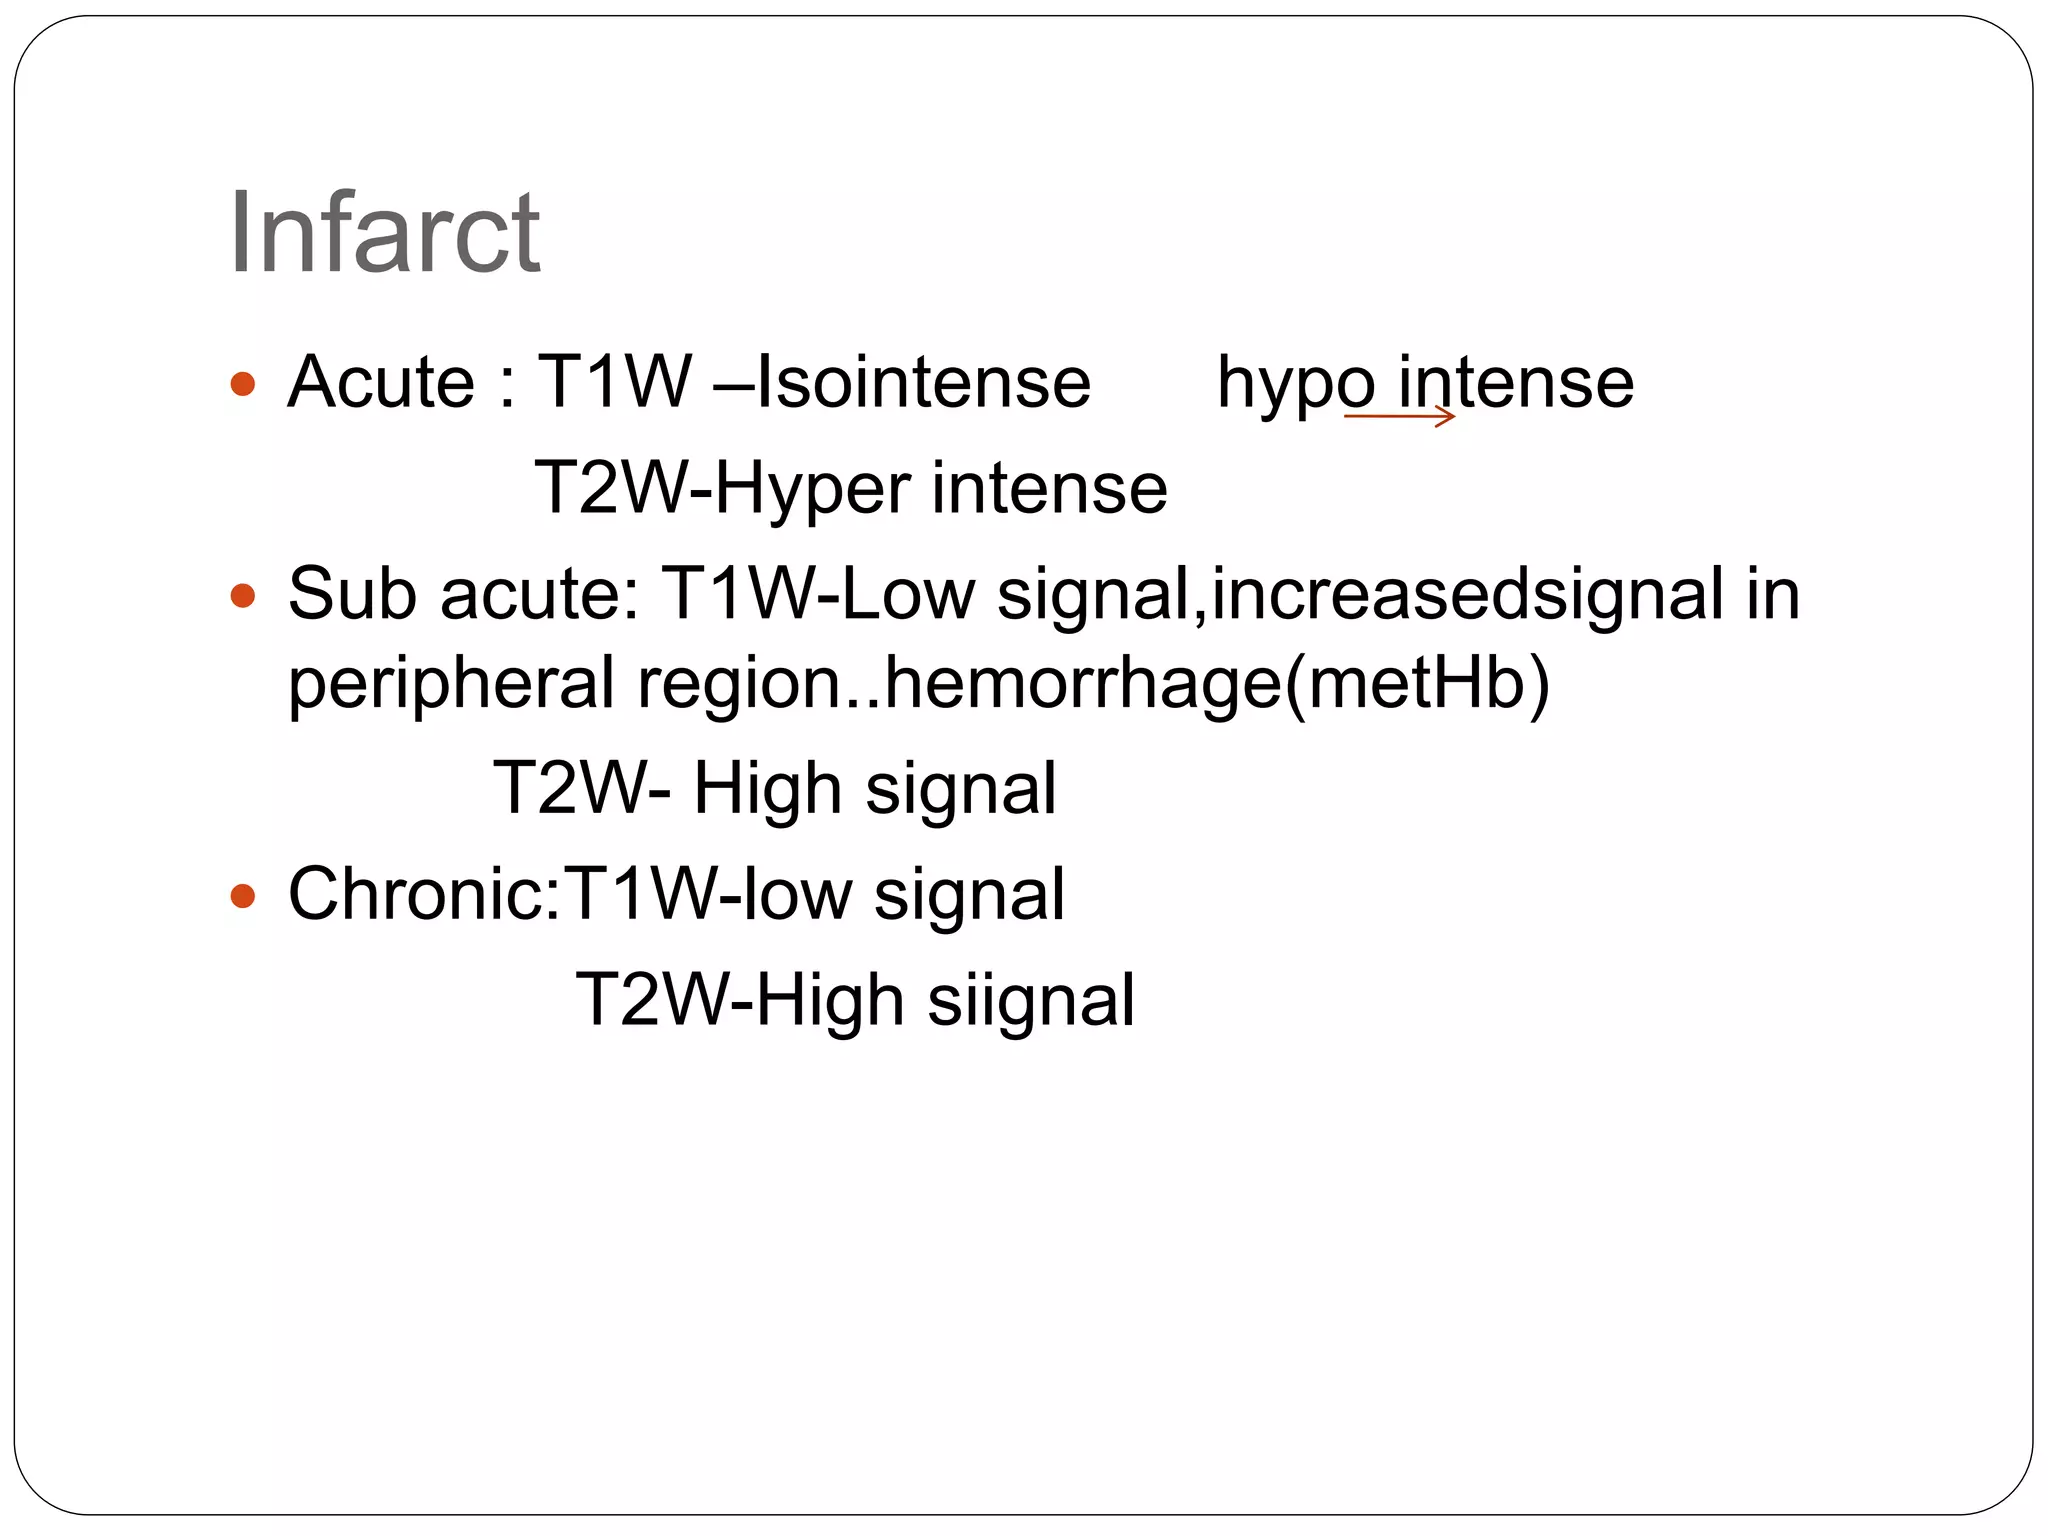
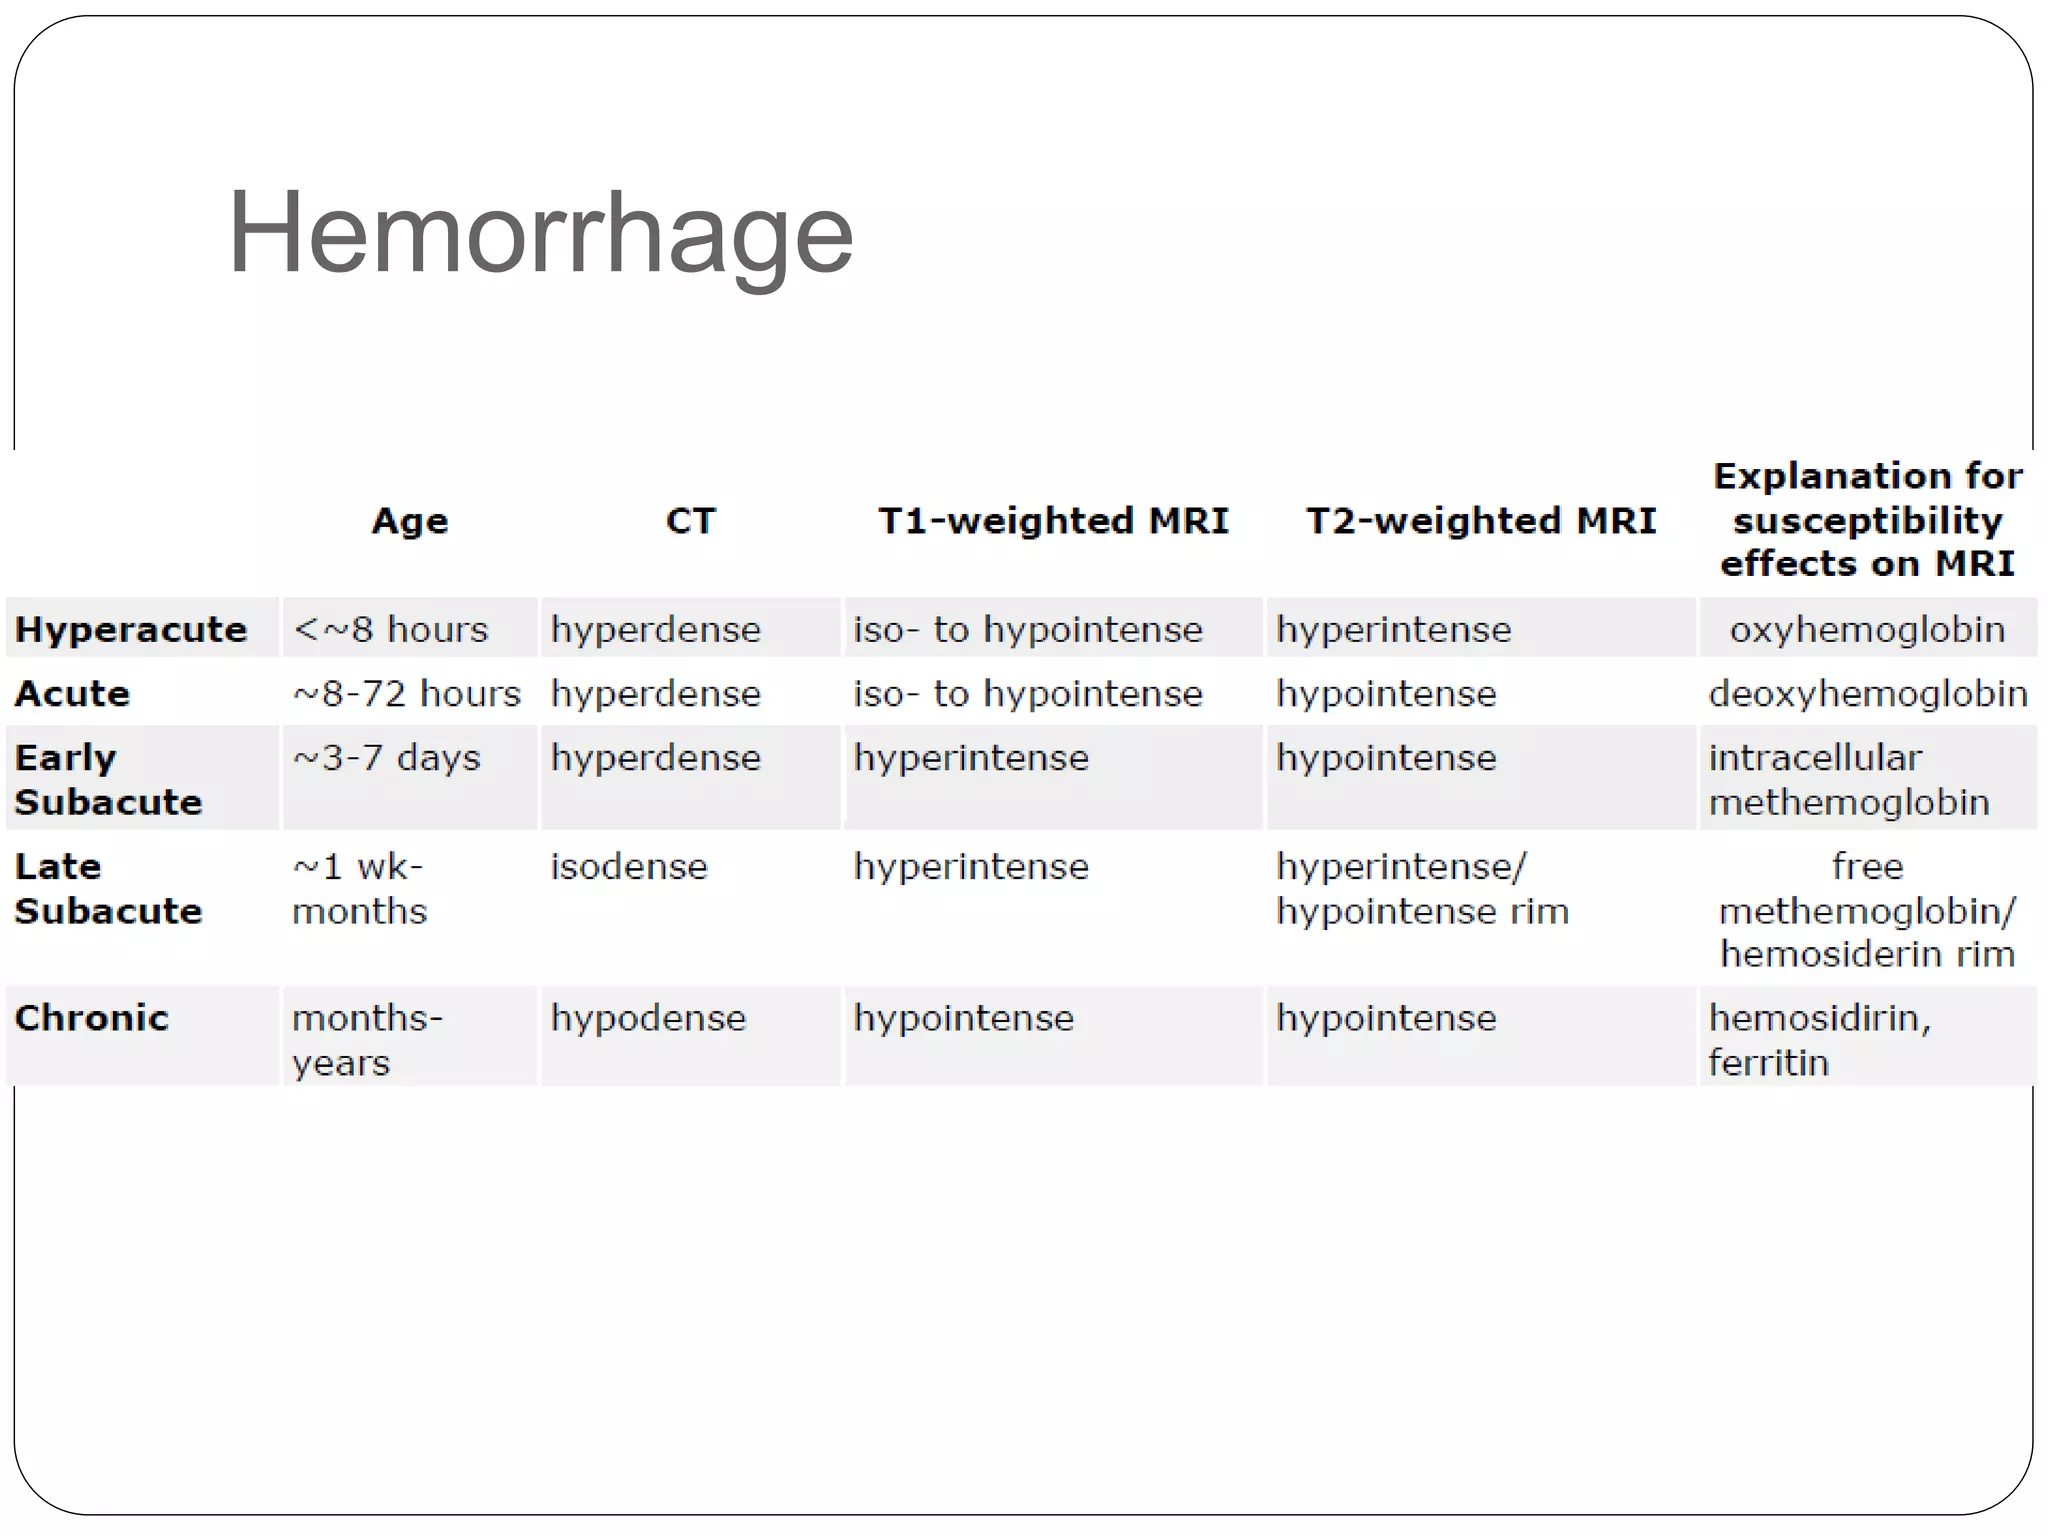
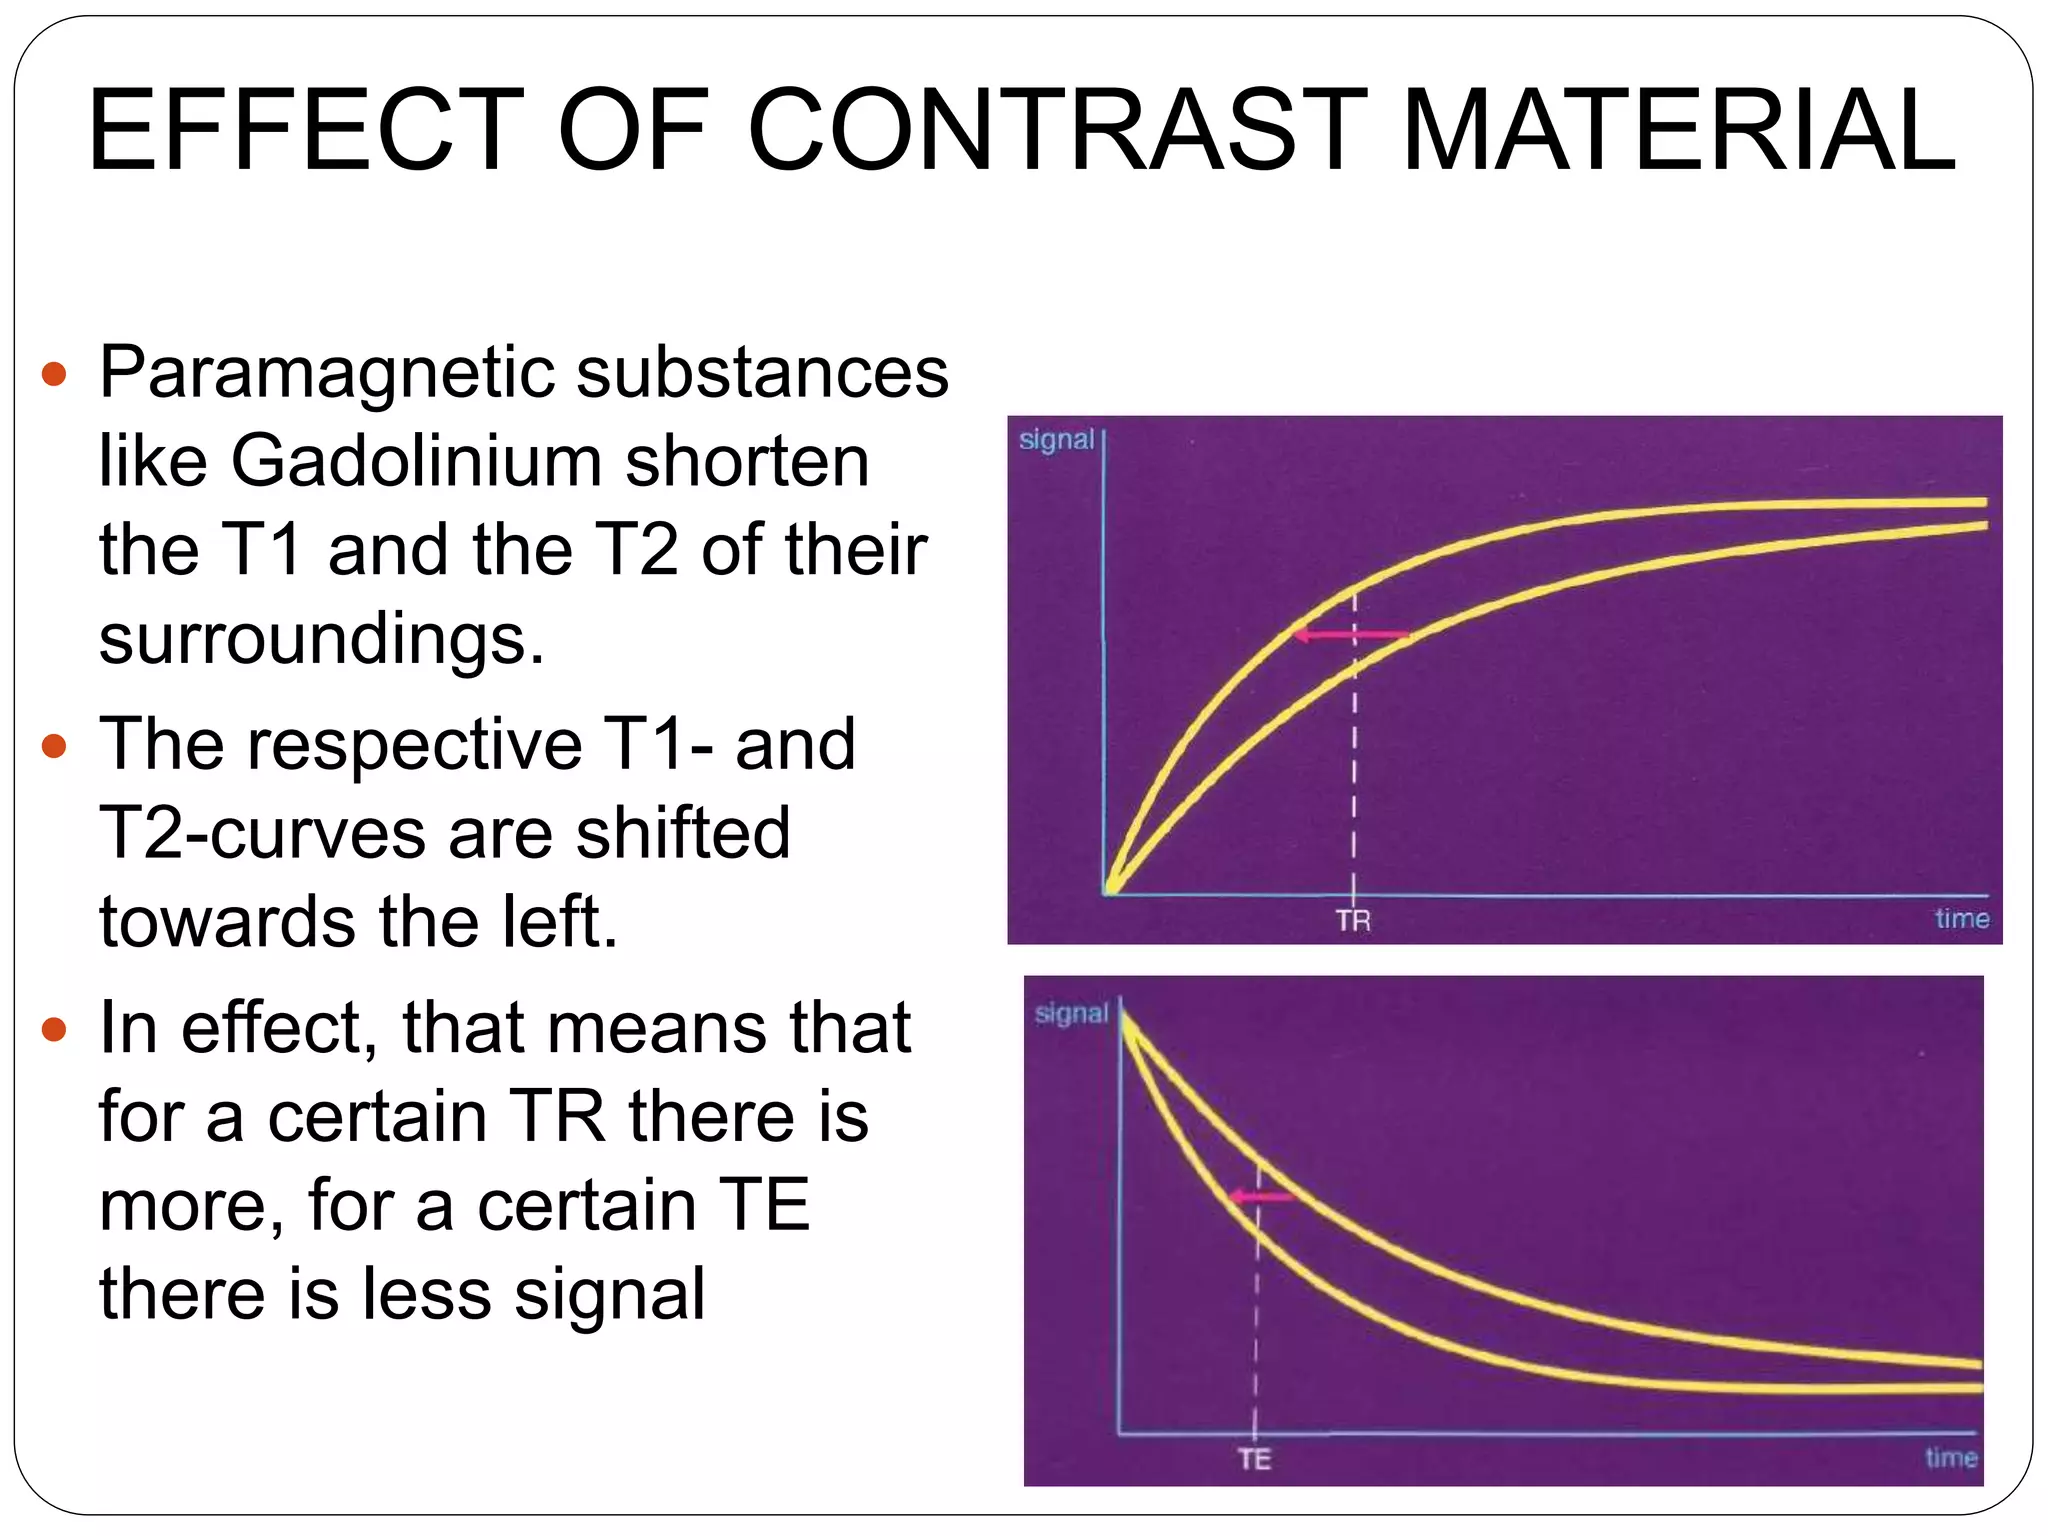
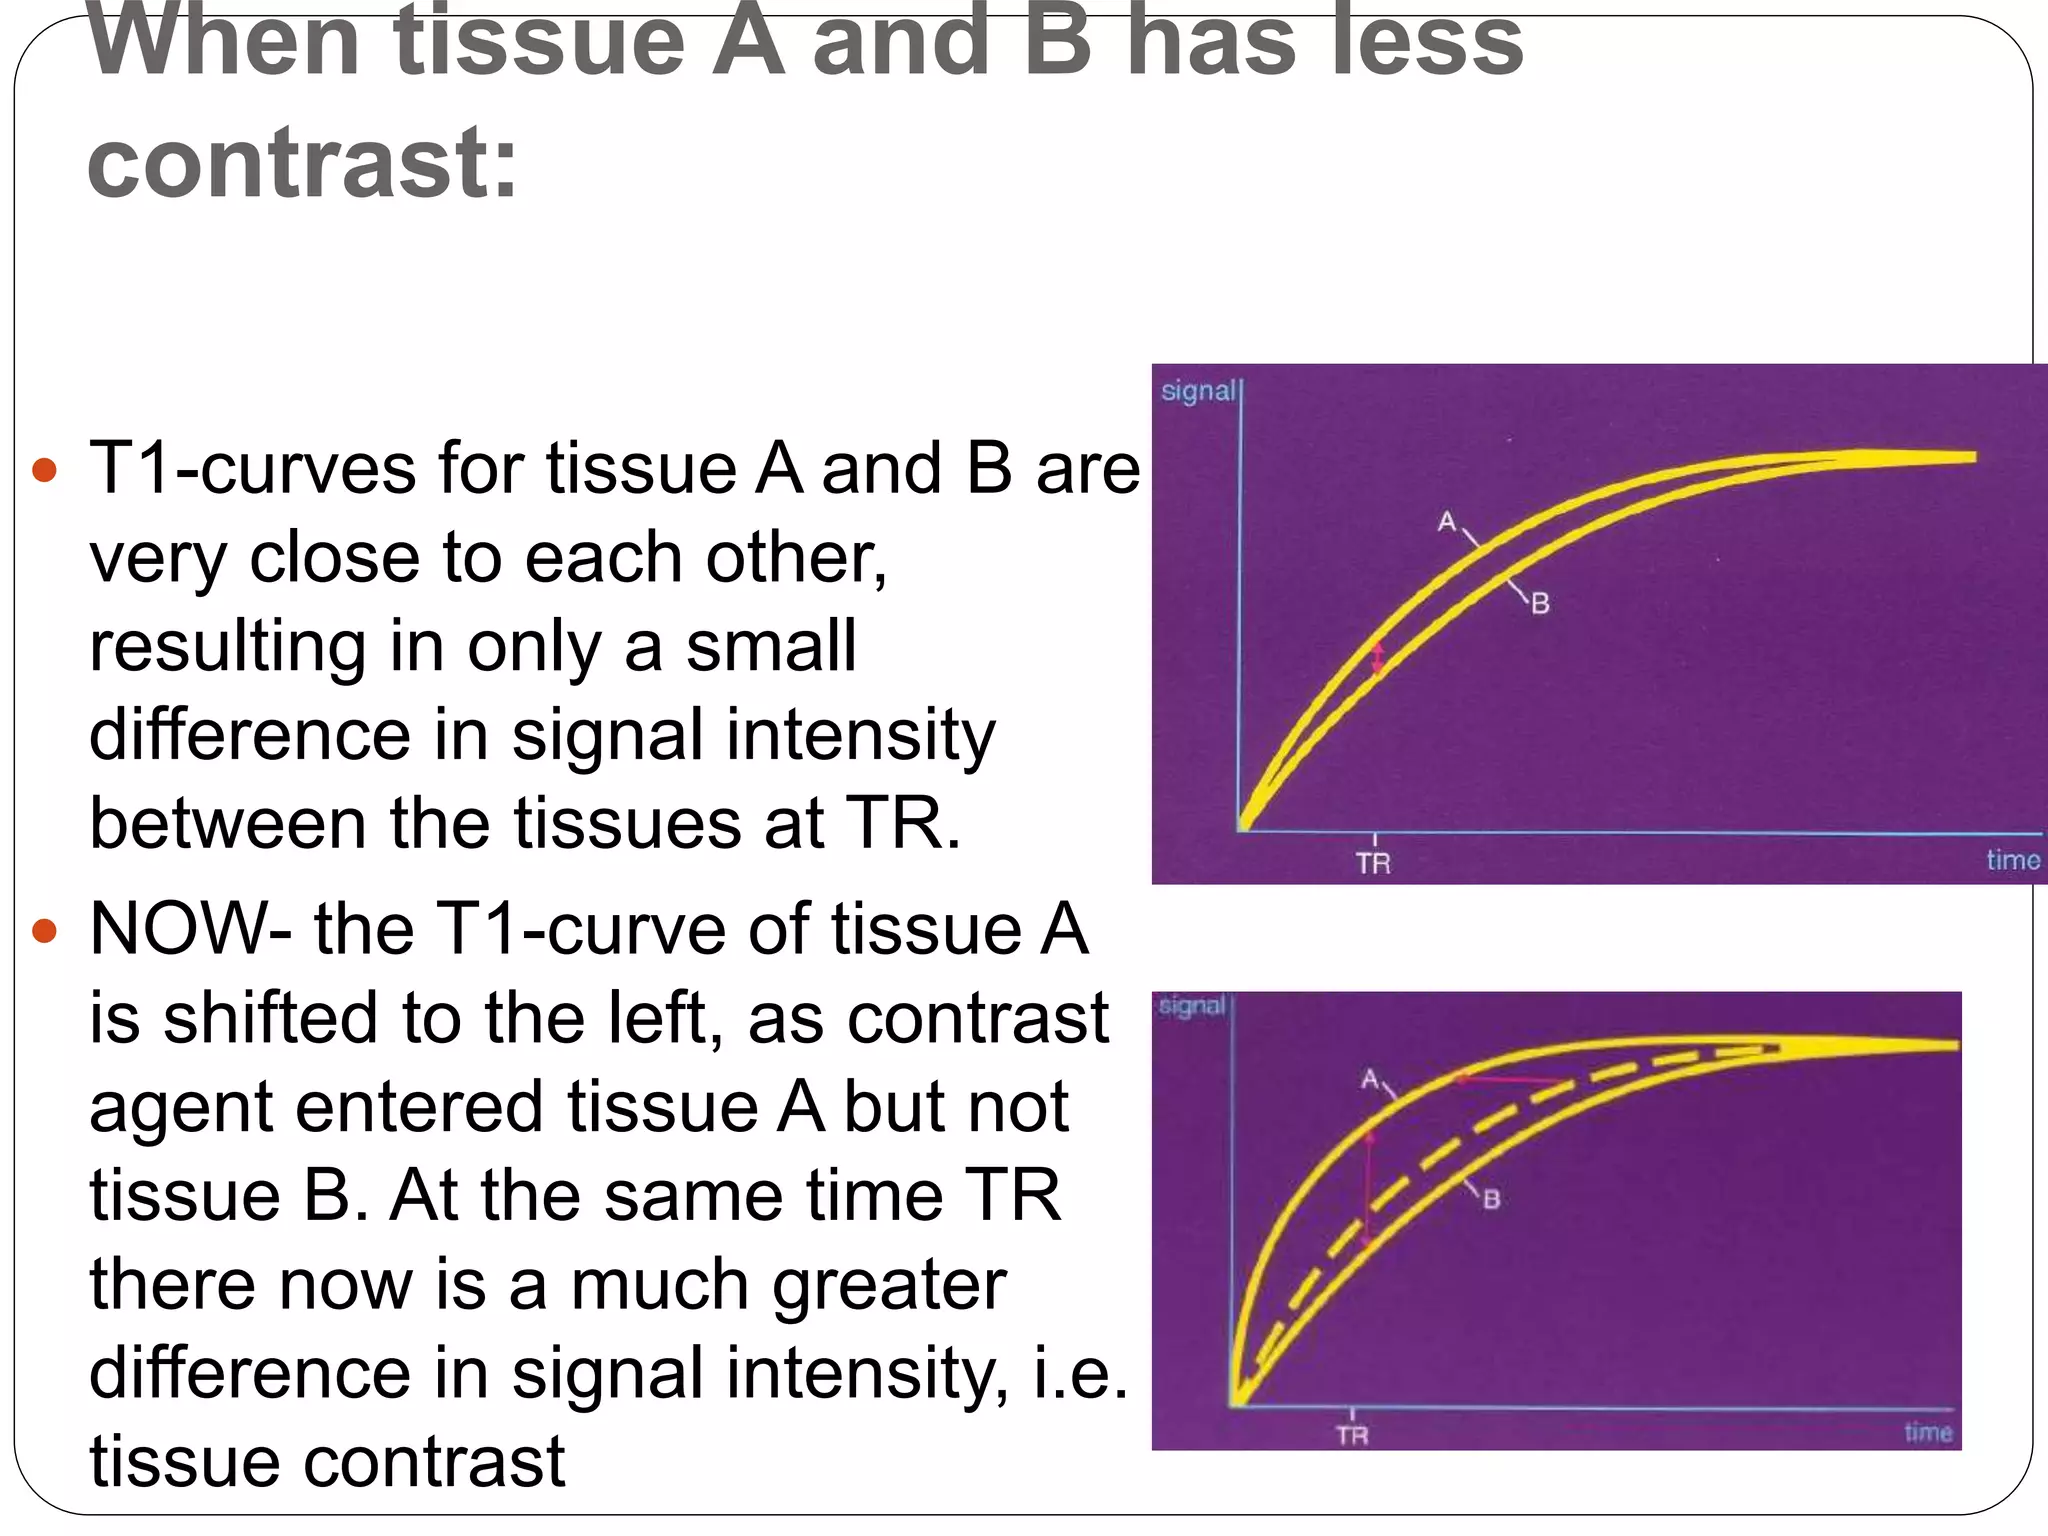
Differentiating various conditions using T1W and T2W images, including details about injury characteristics and contrast material effects.
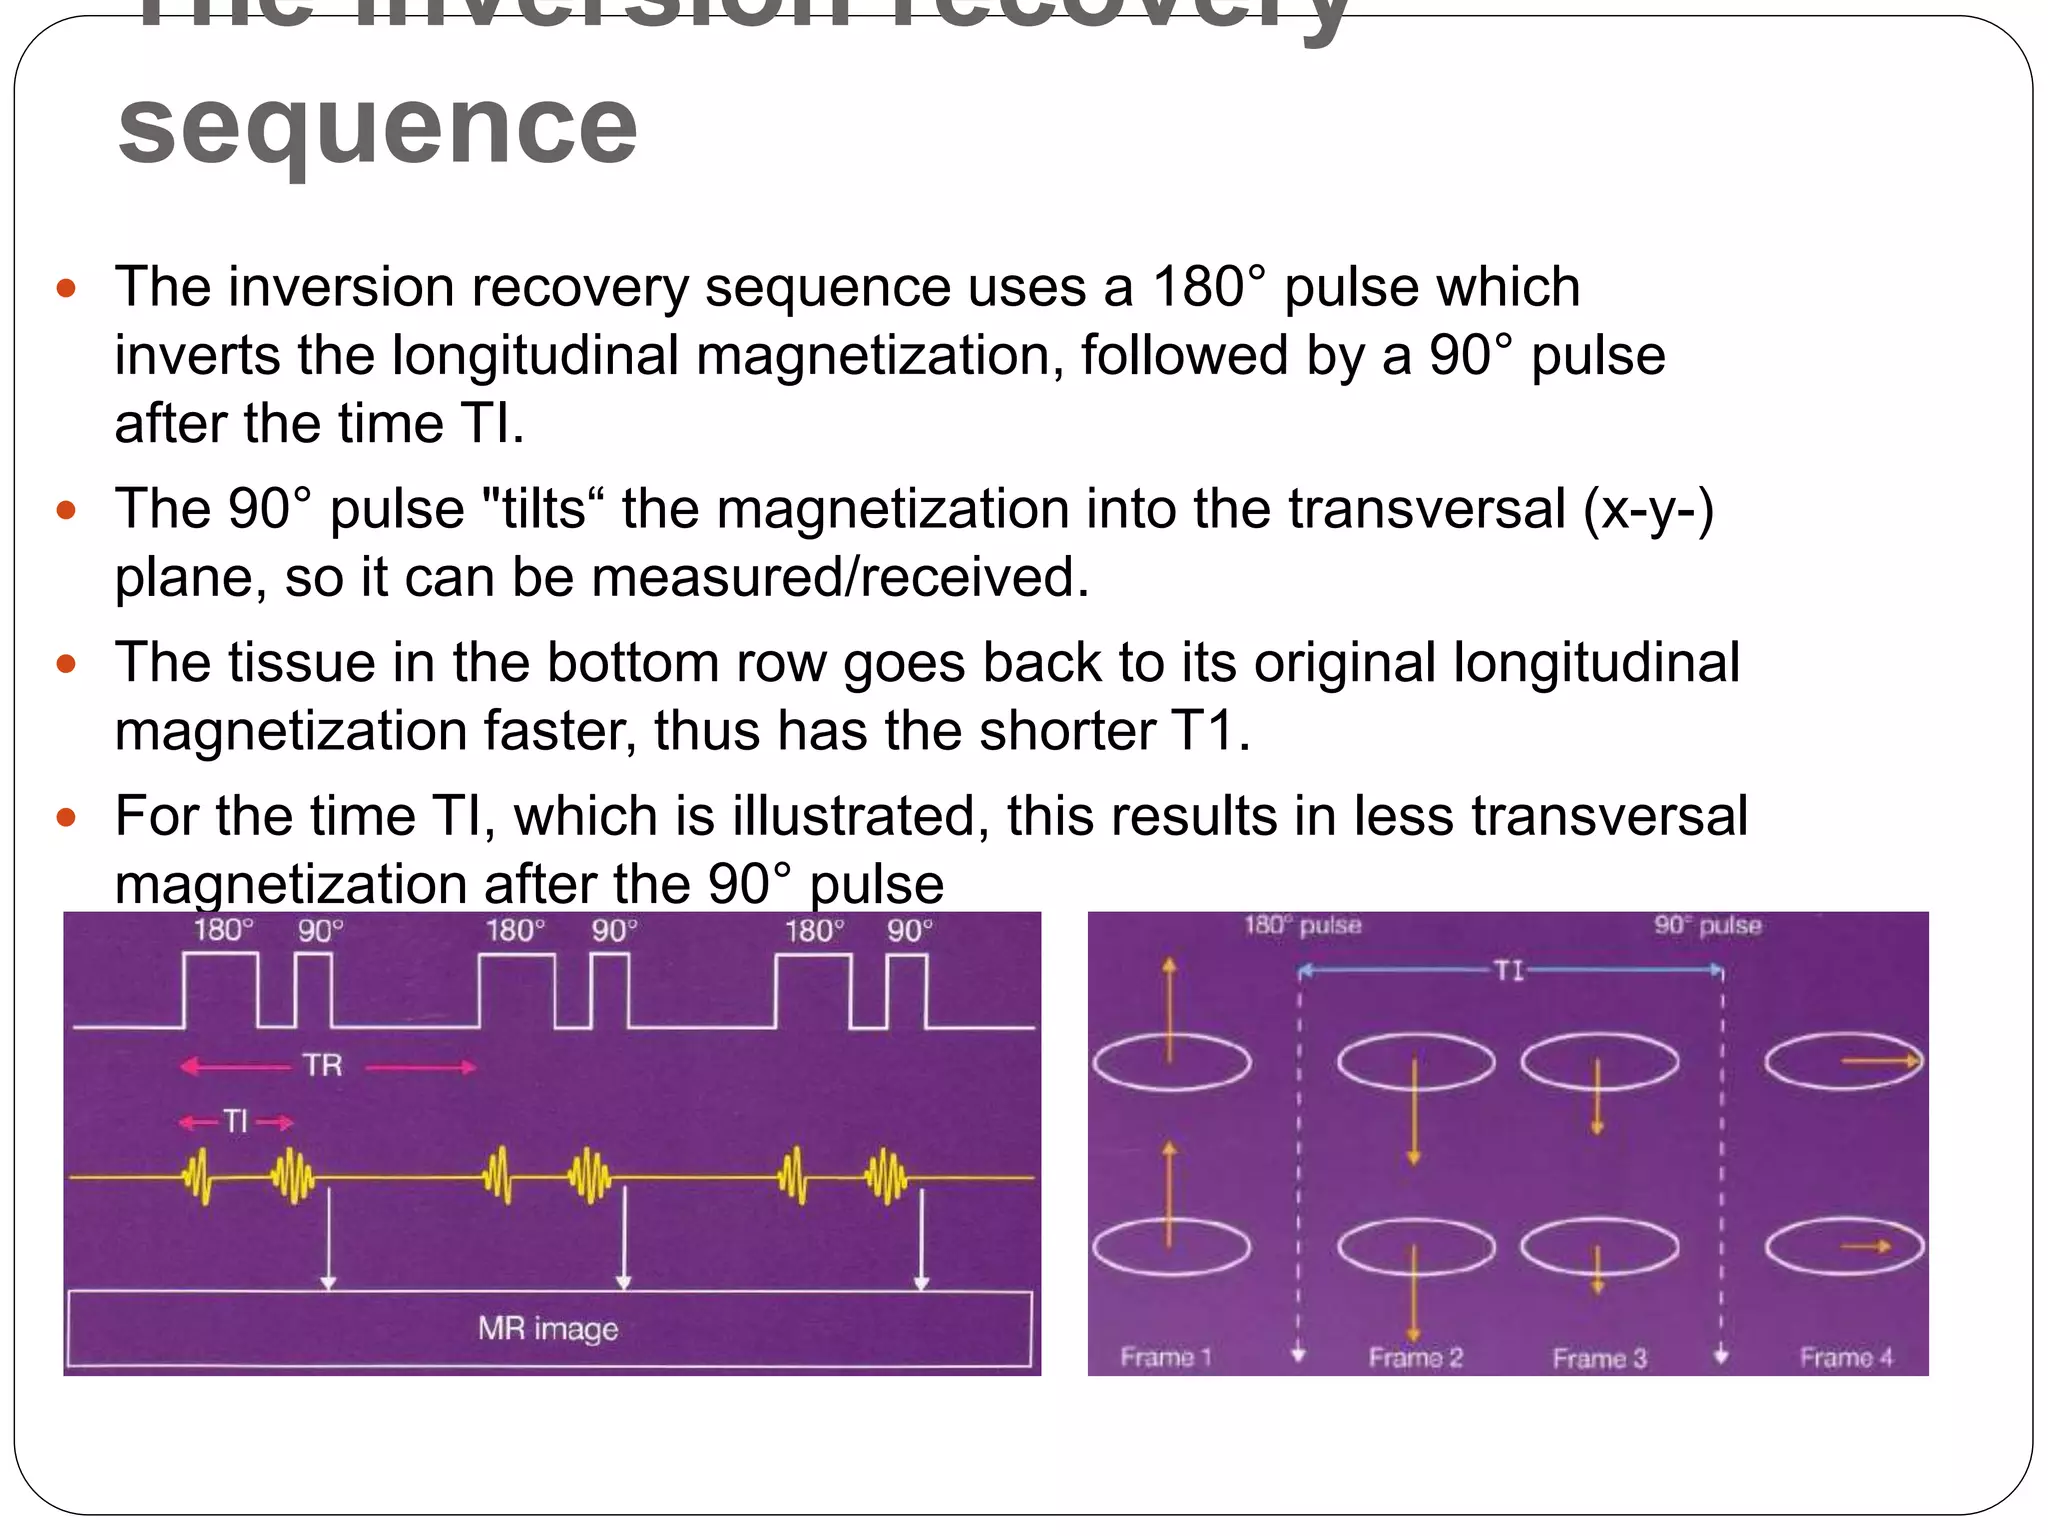
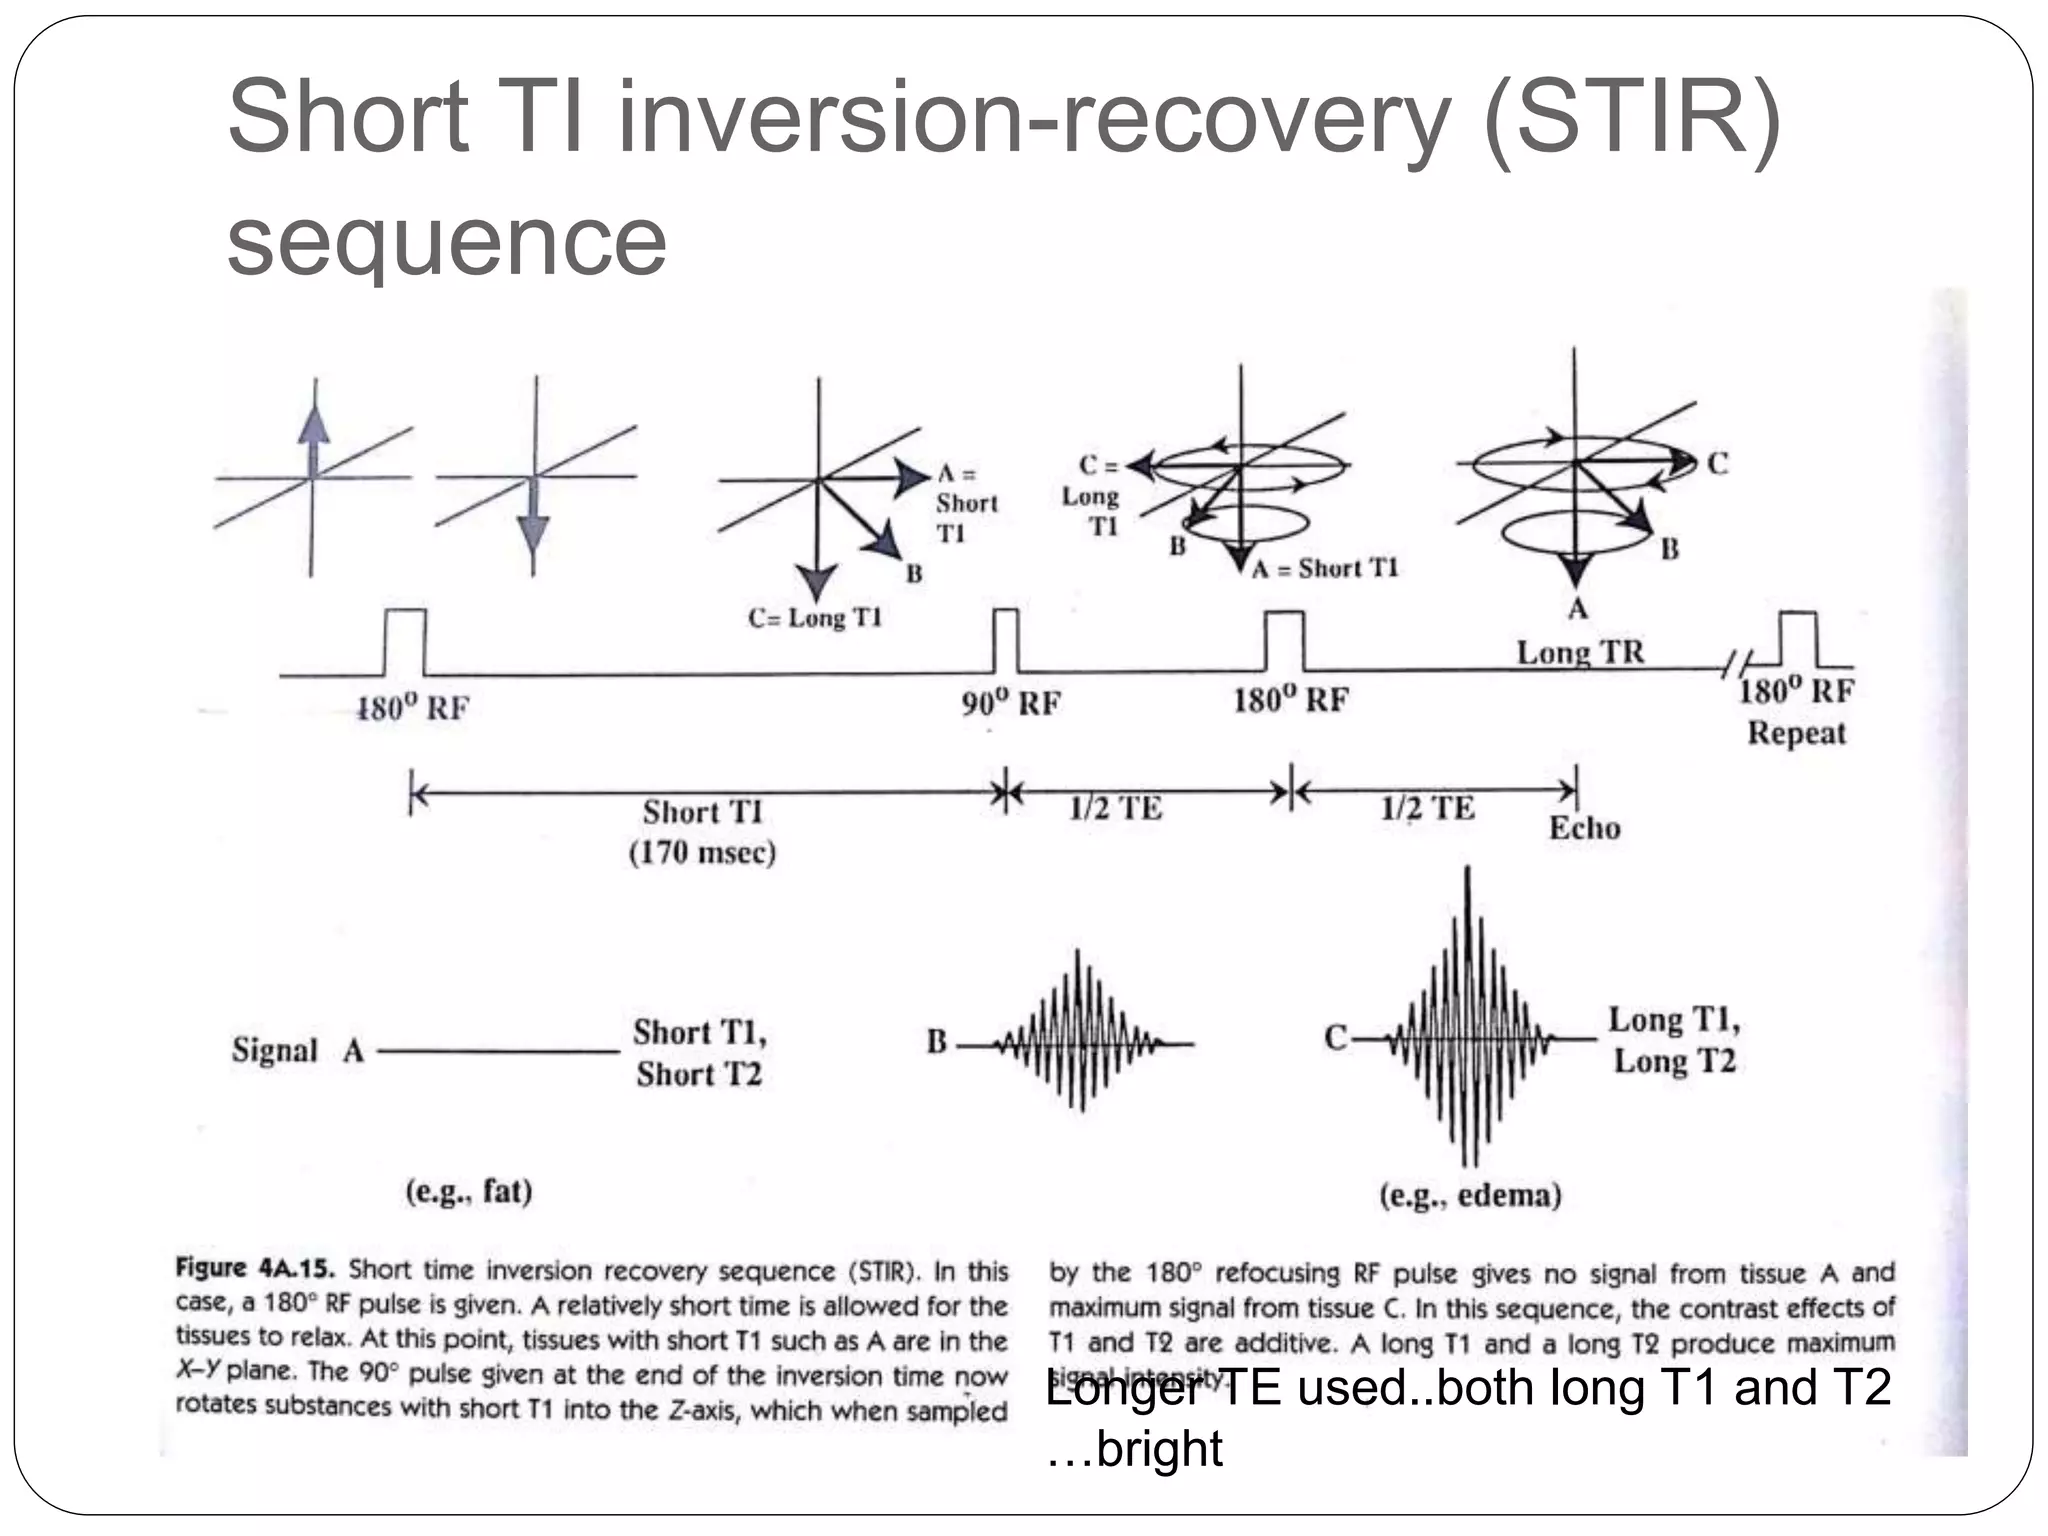
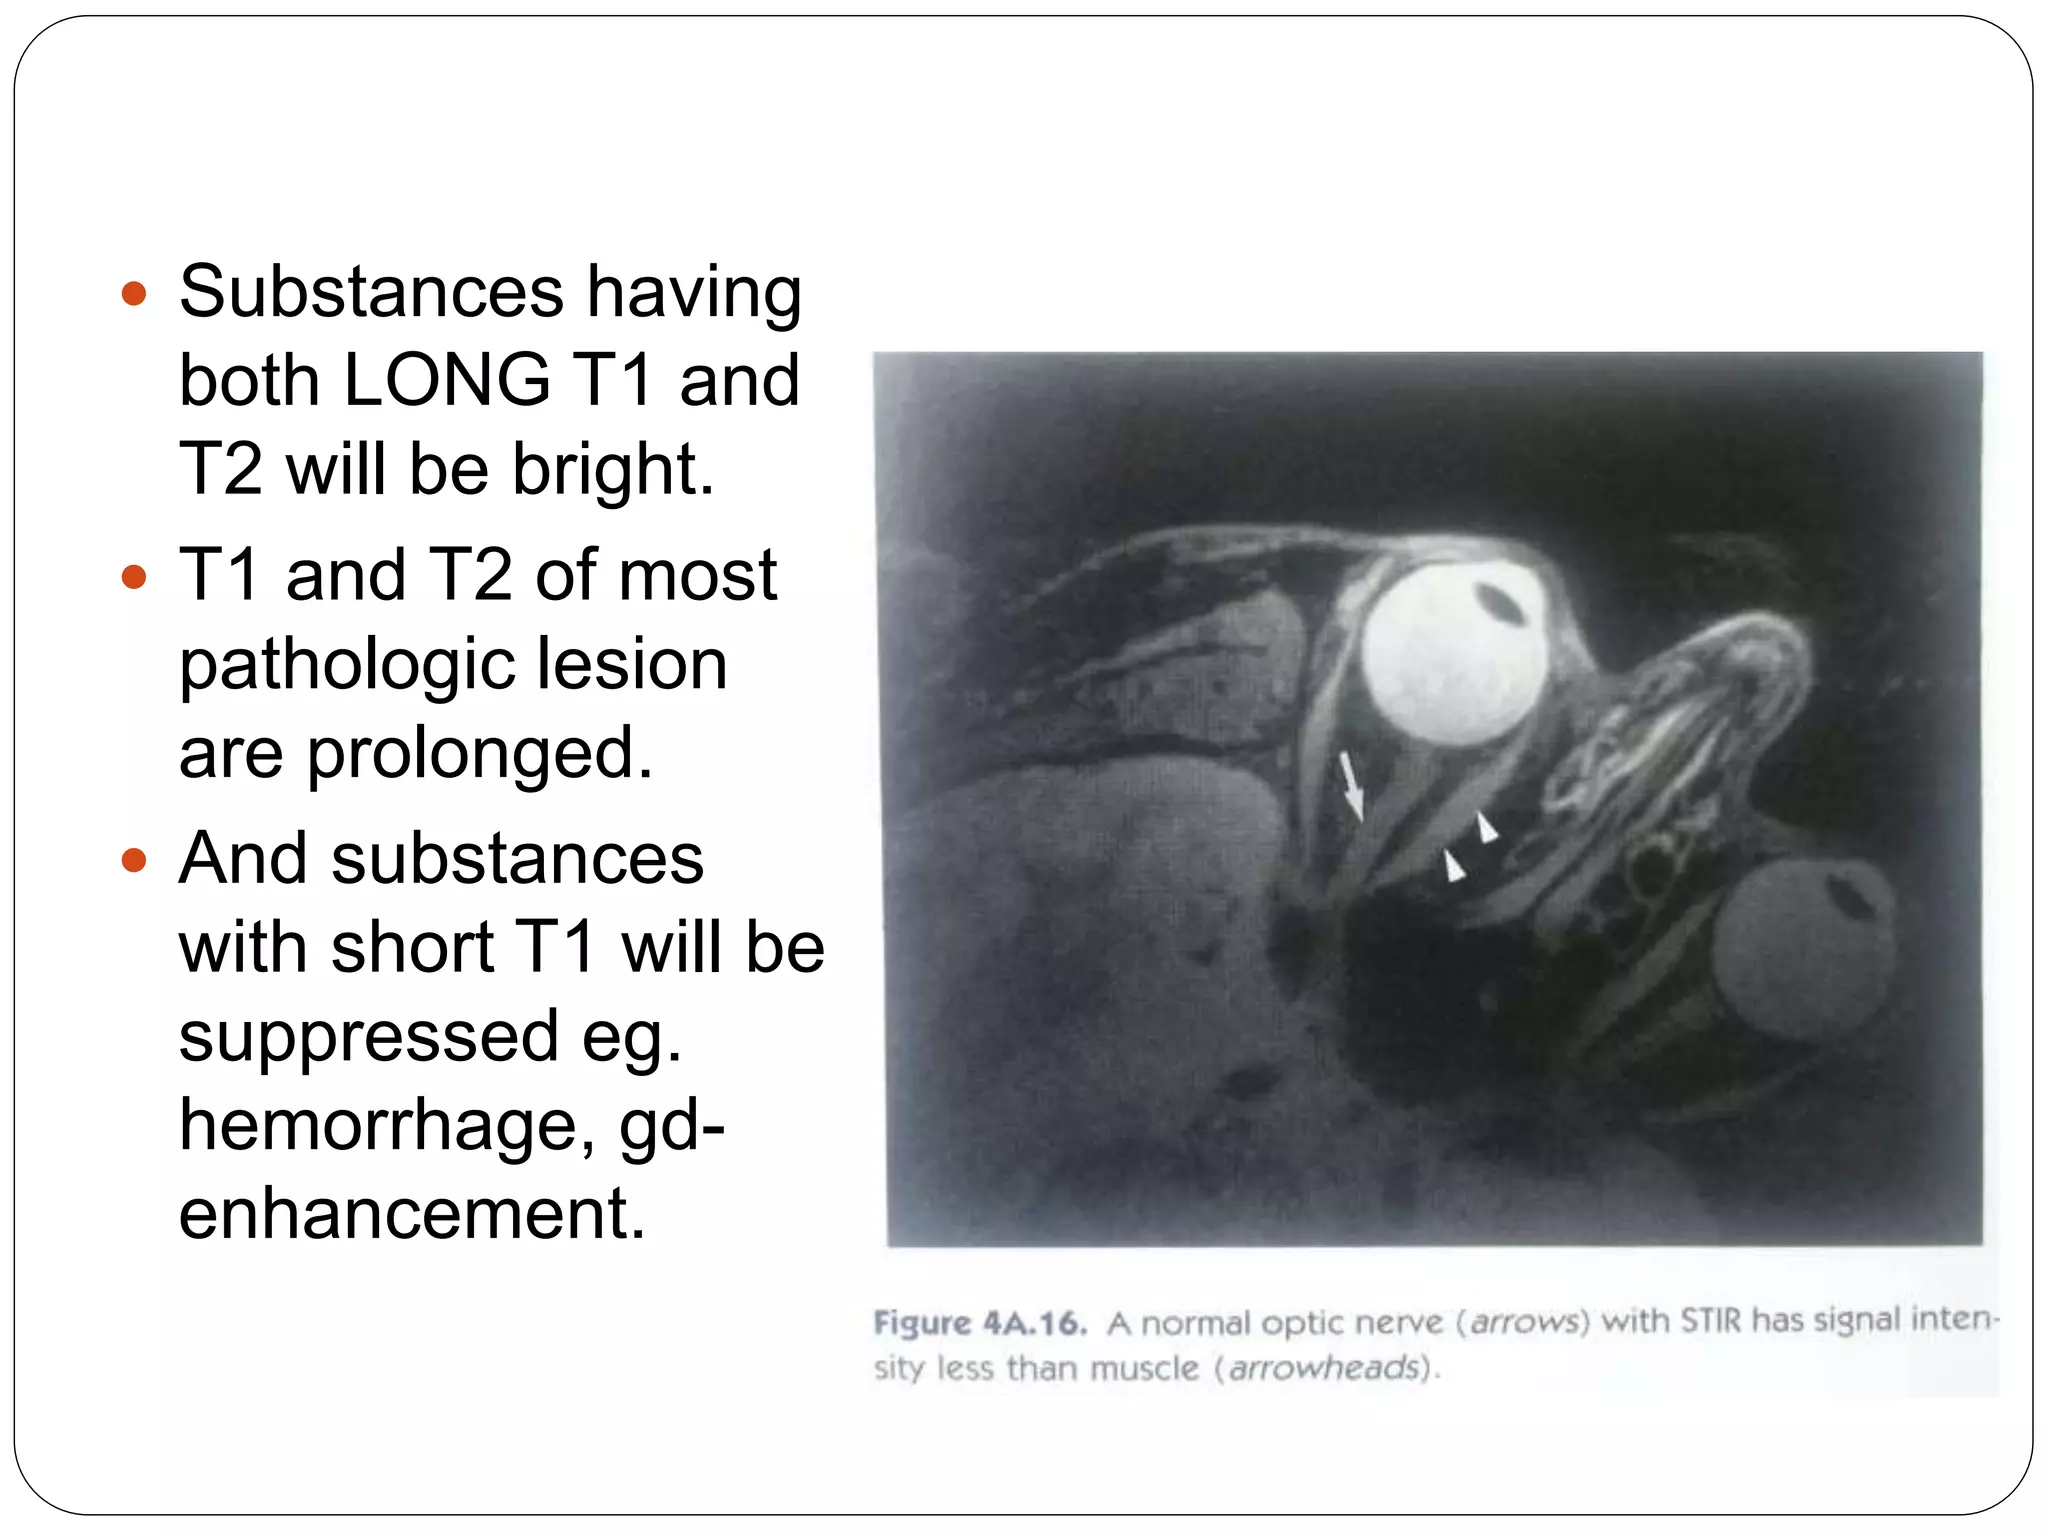
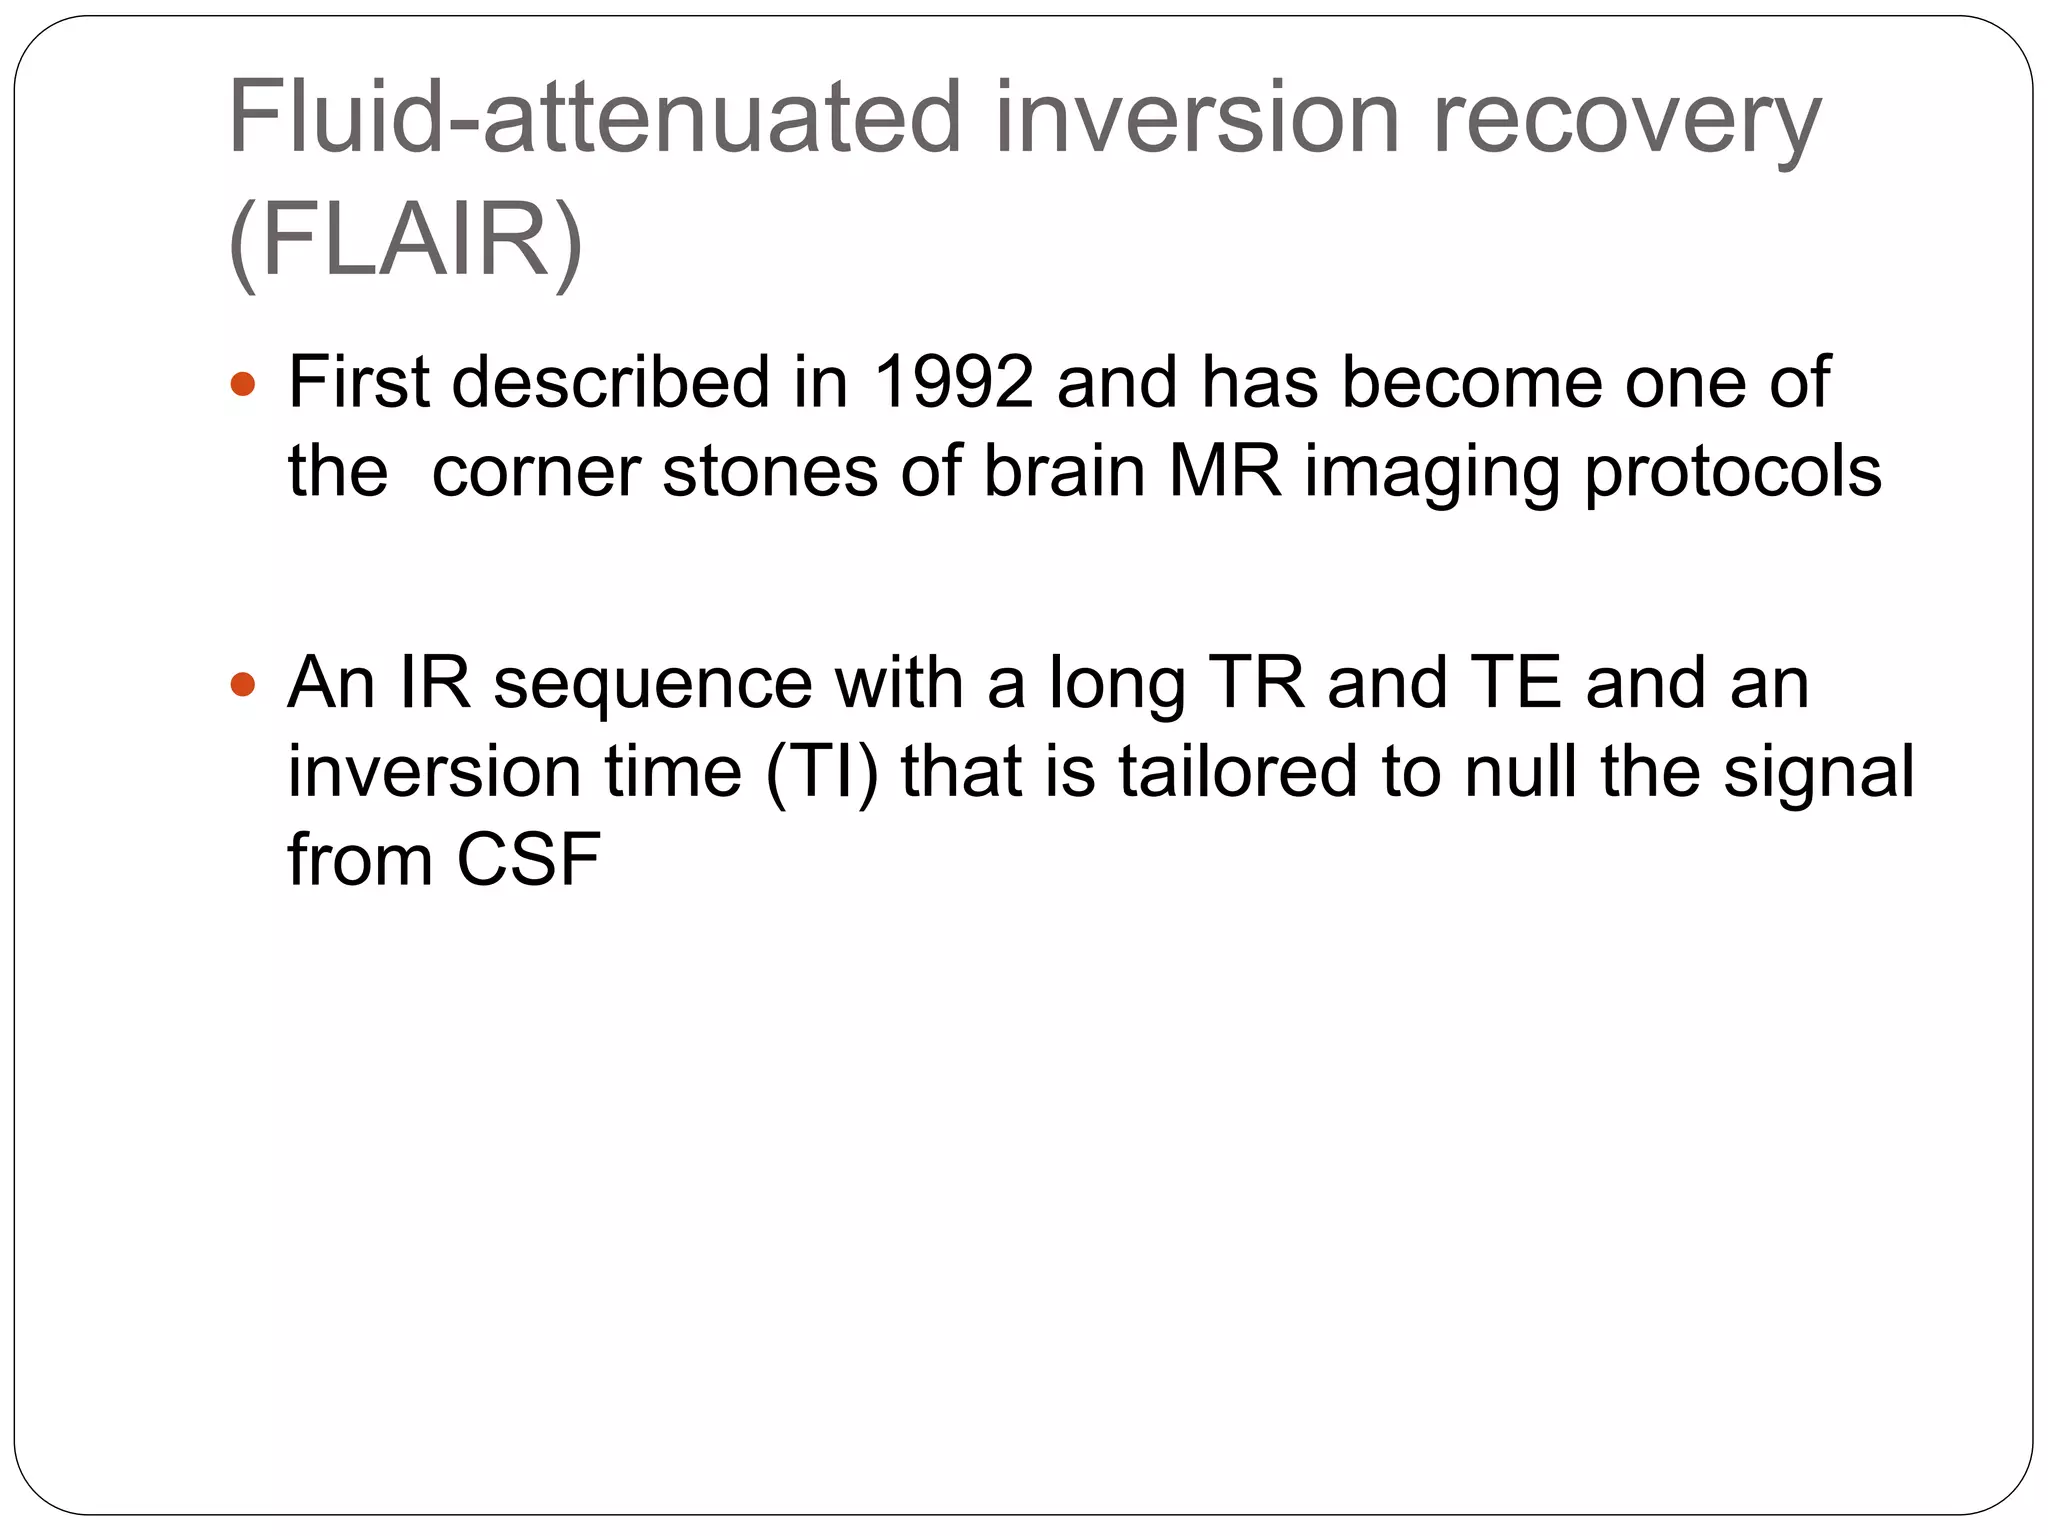
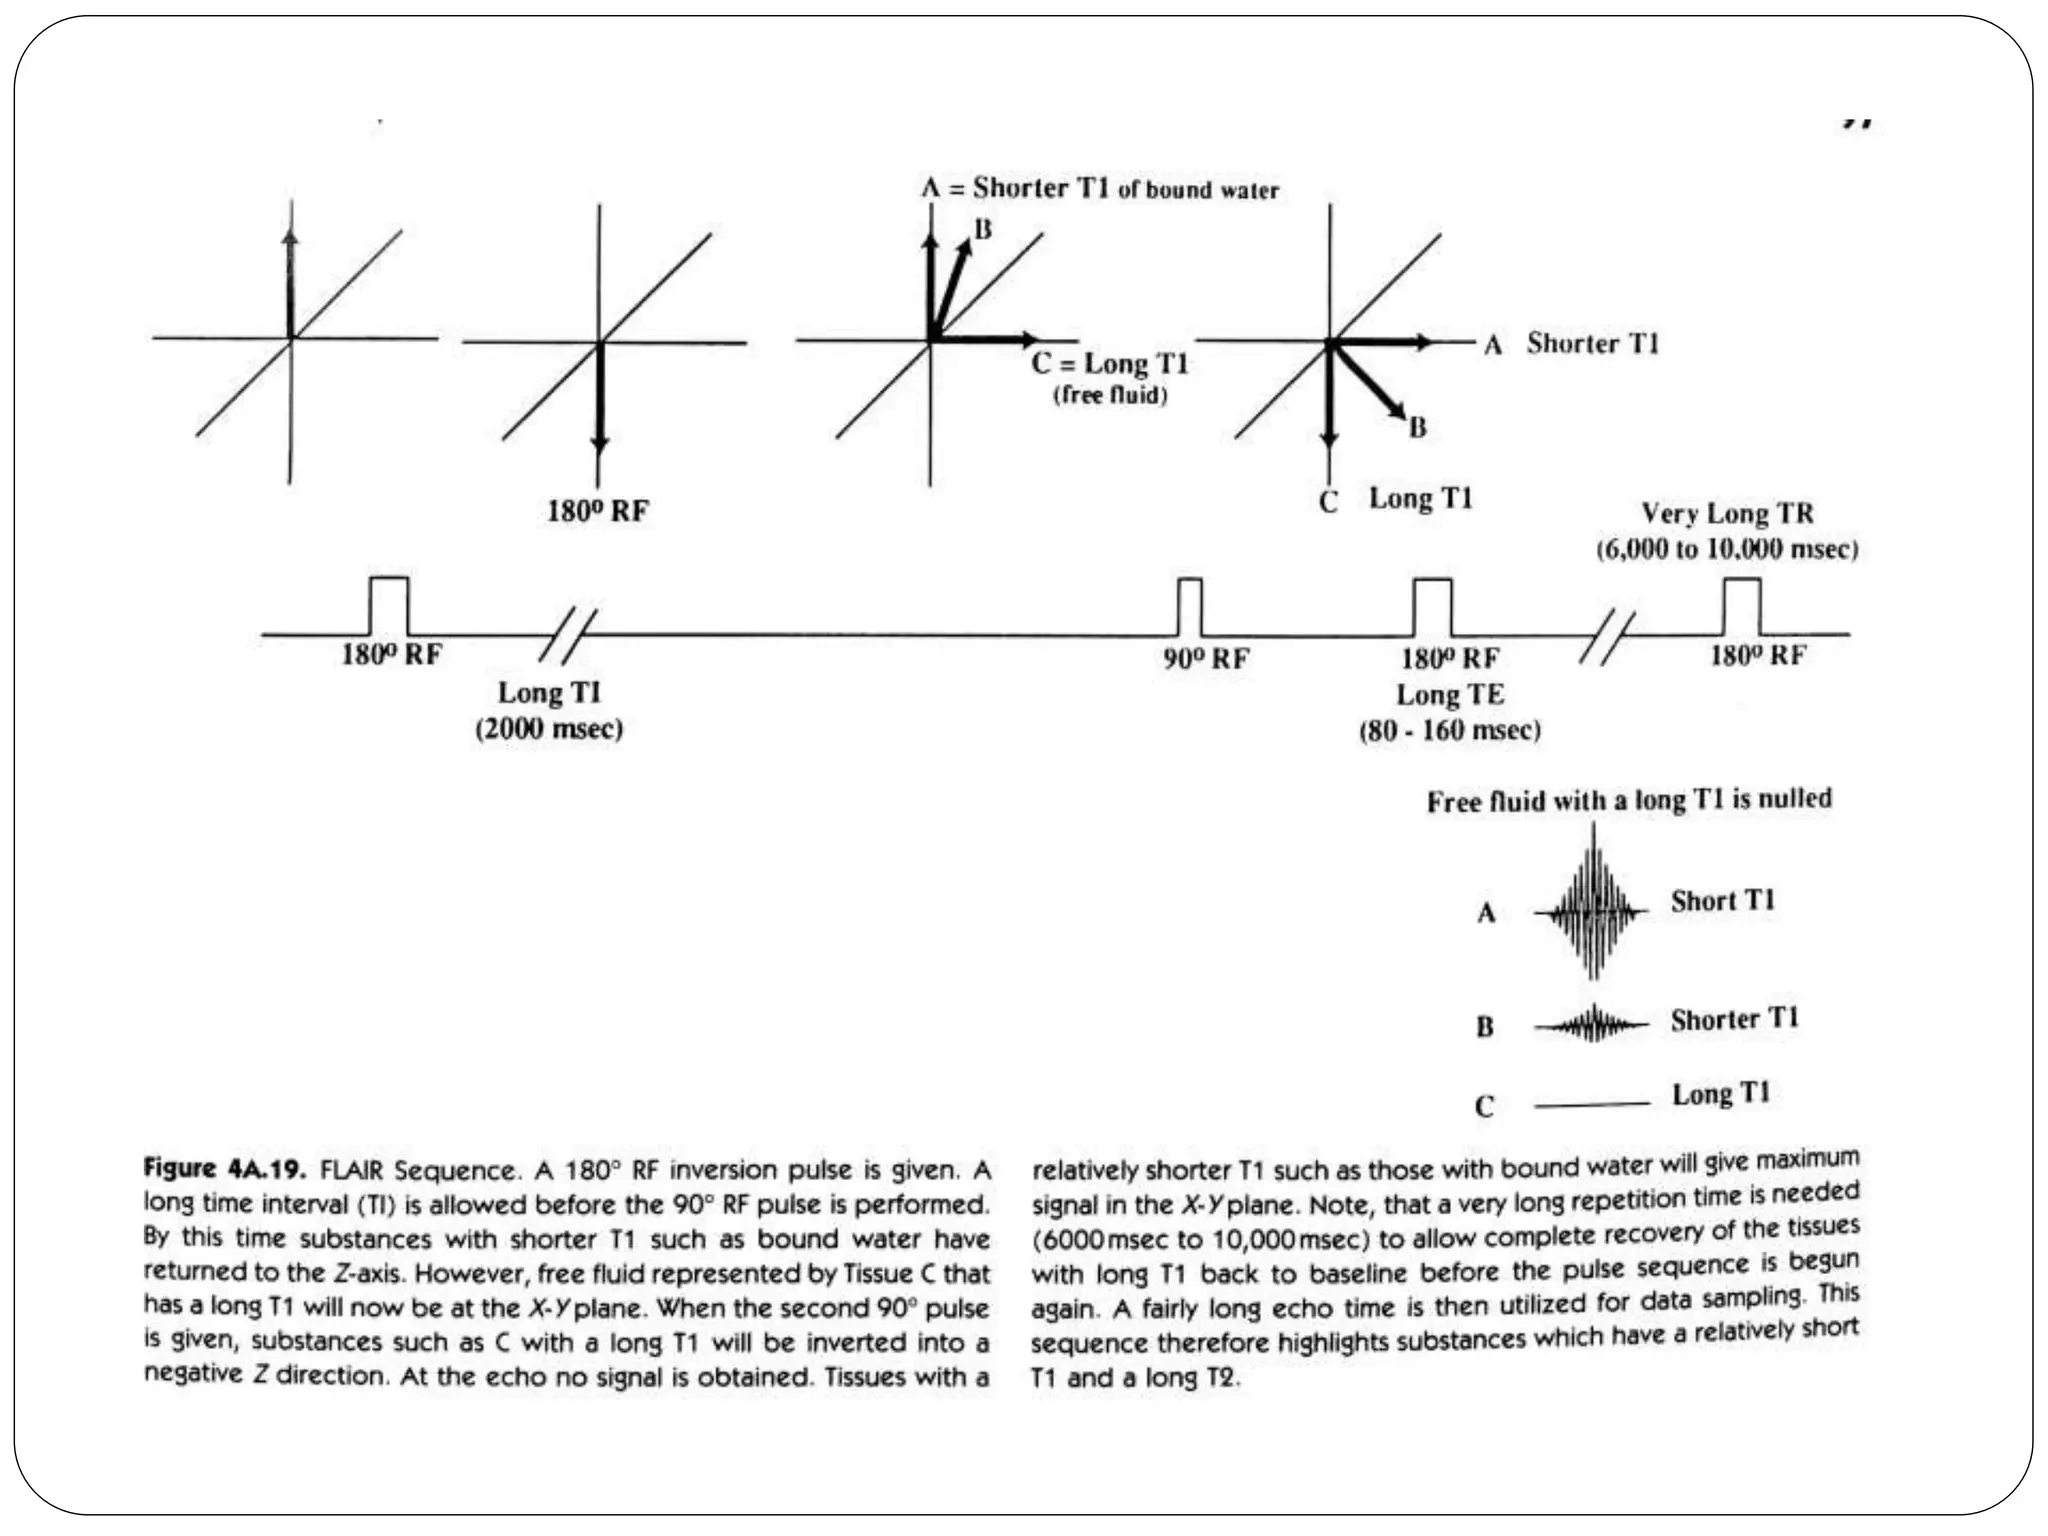
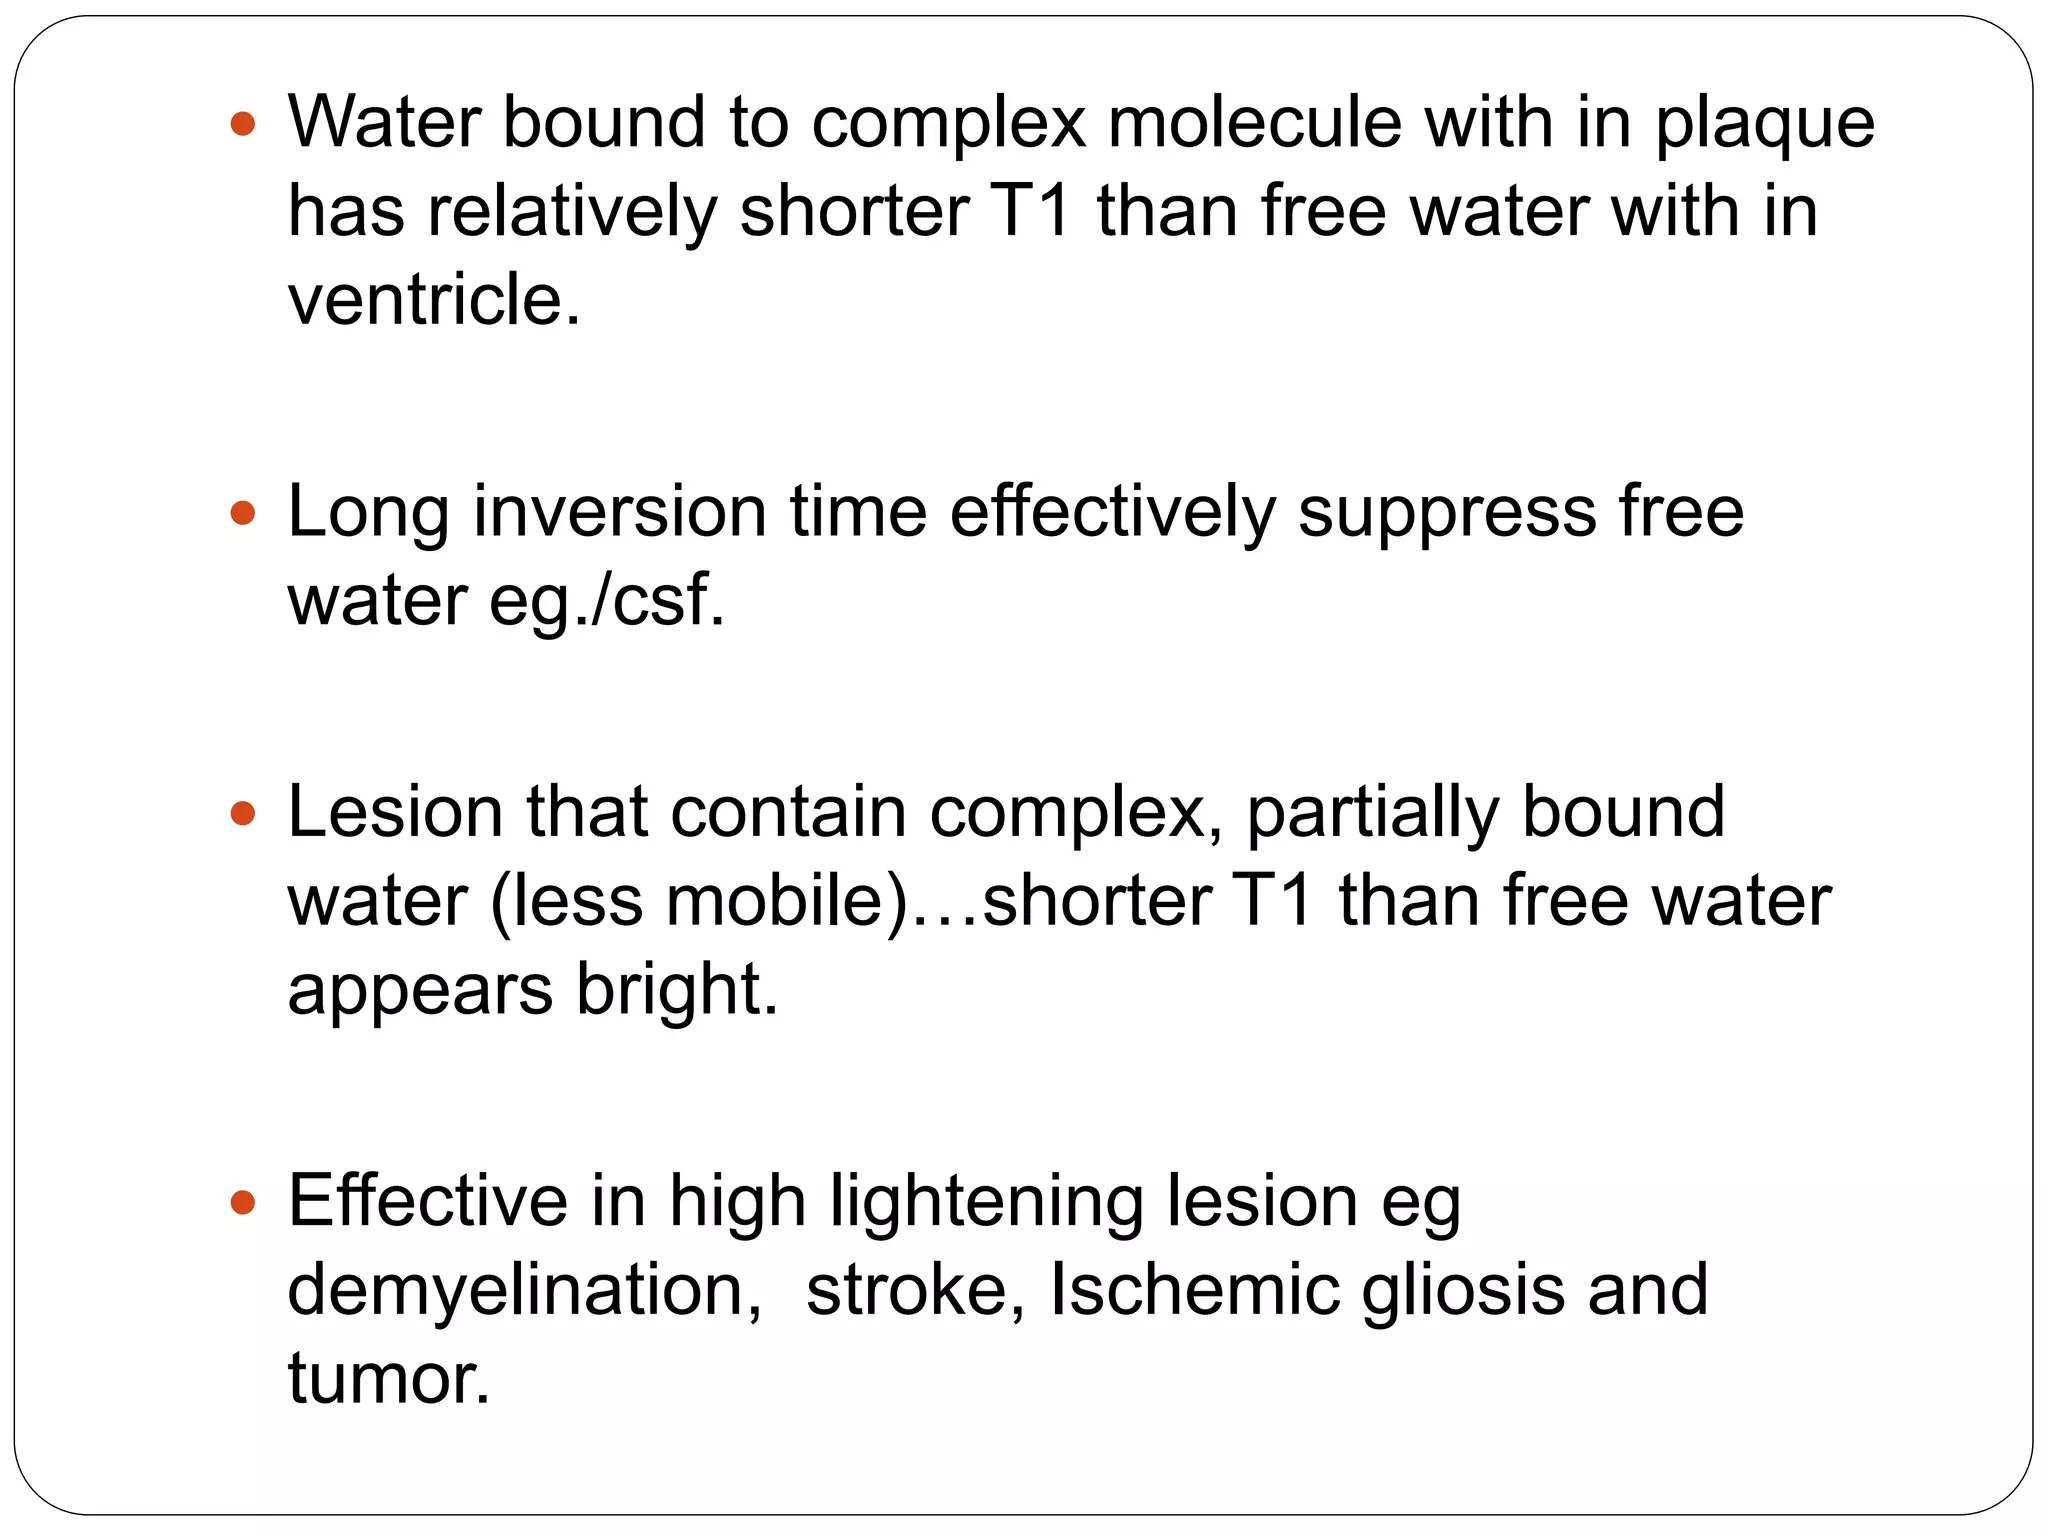
In-depth look at inversion recovery sequences, including STIR and FLAIR, and their applications in brain pathology.
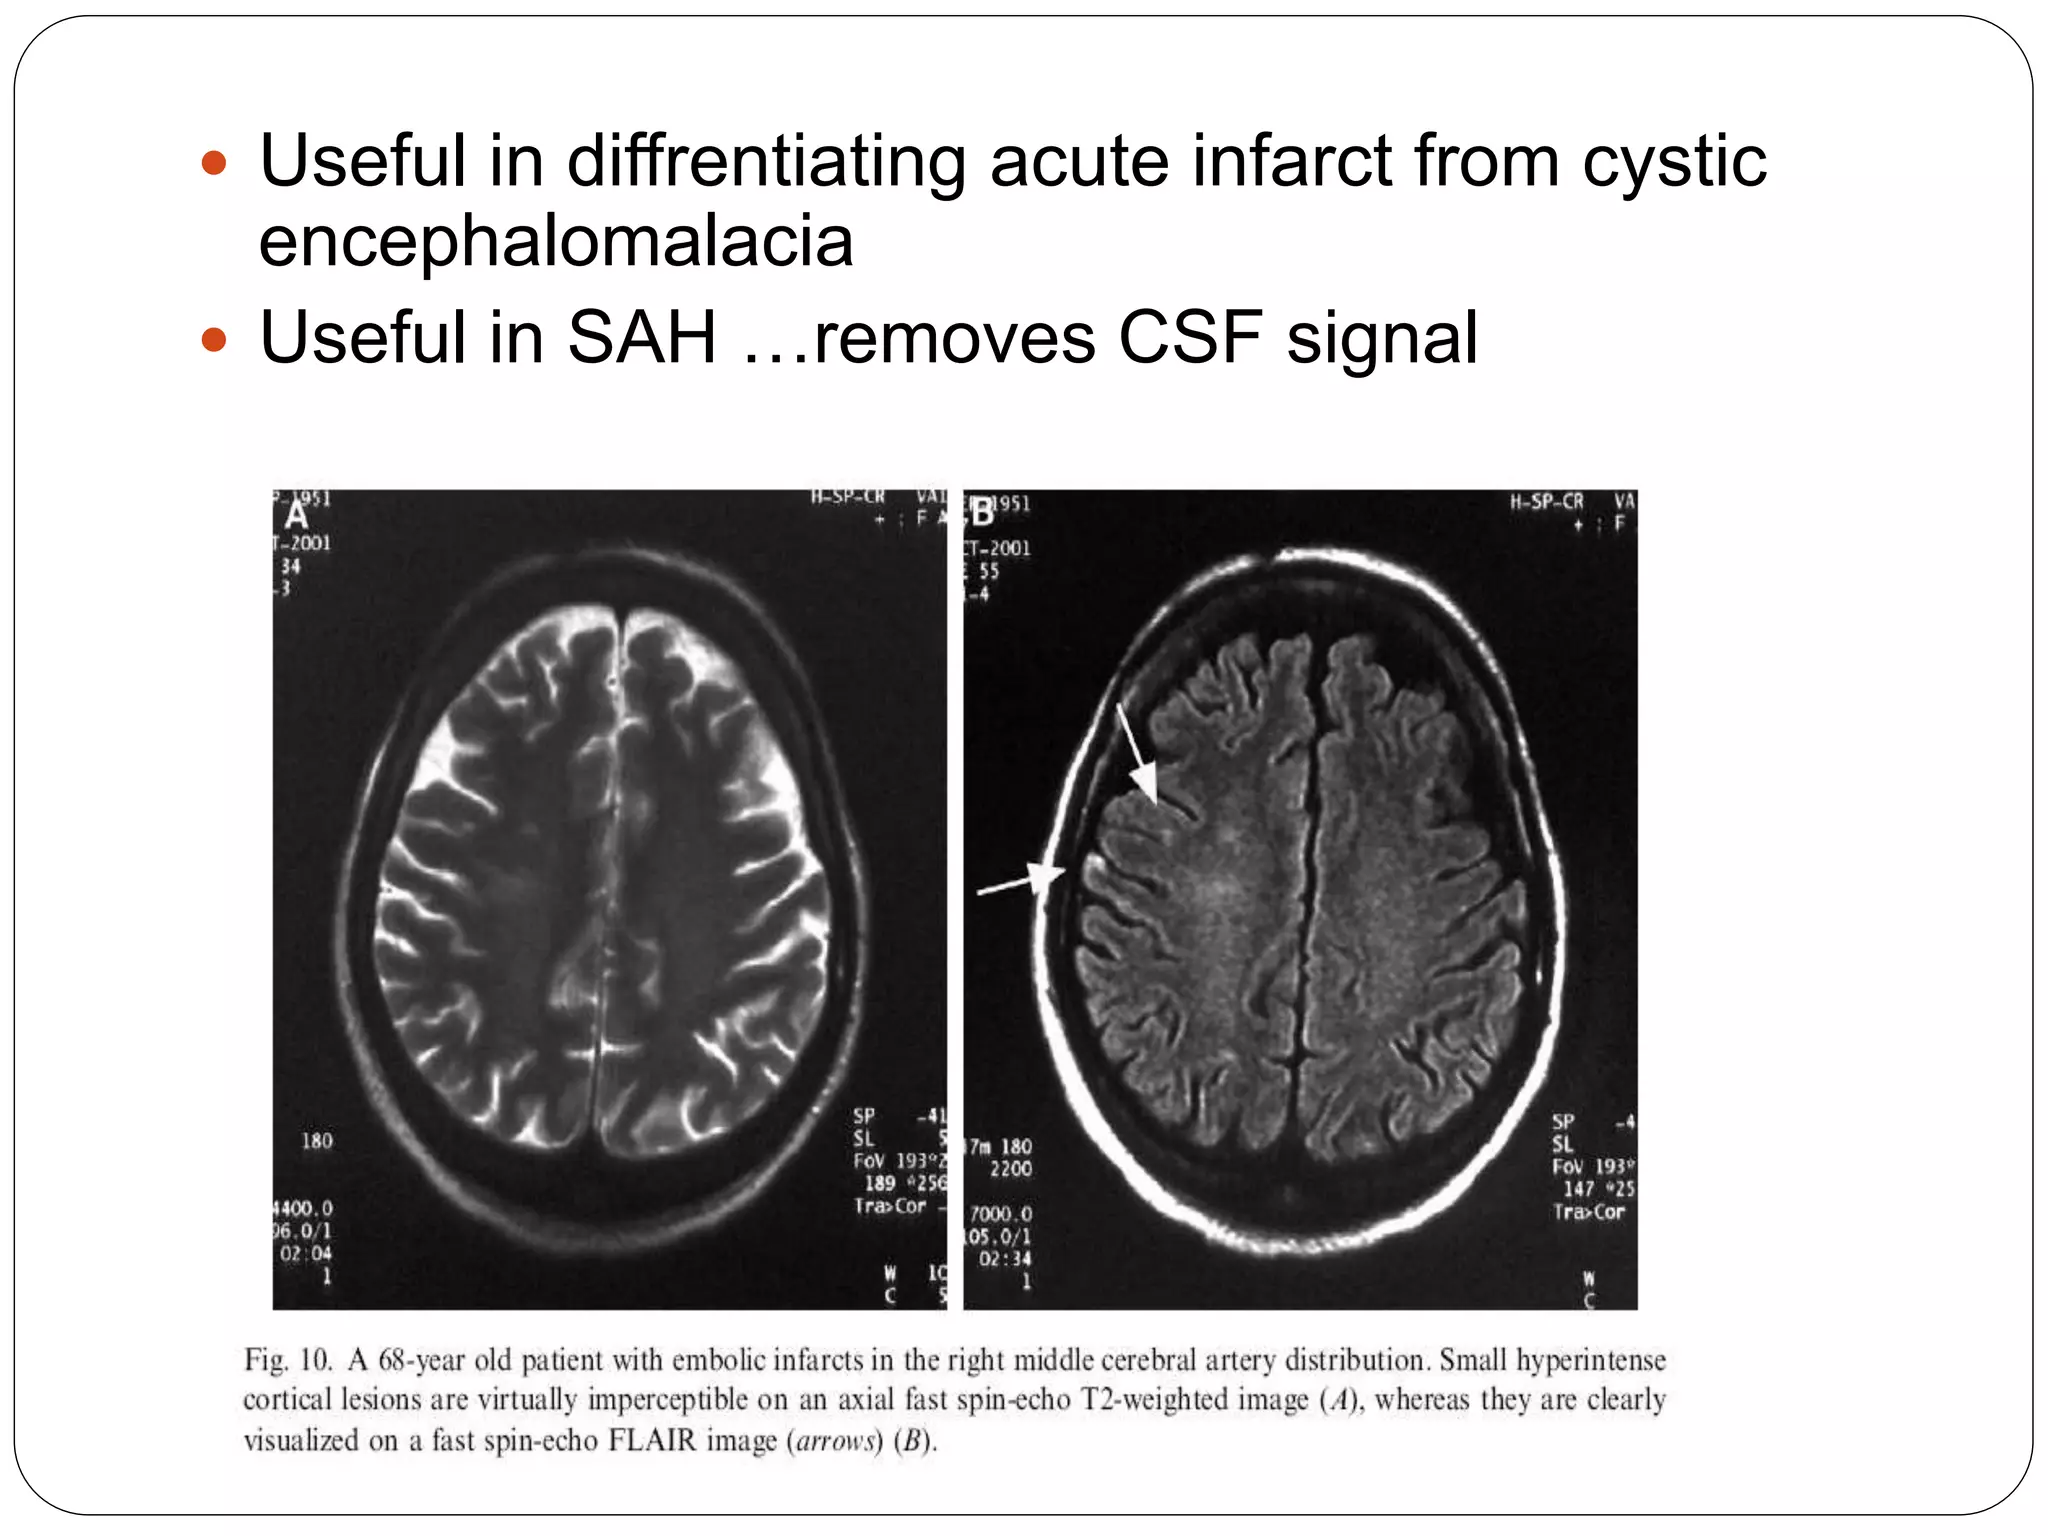
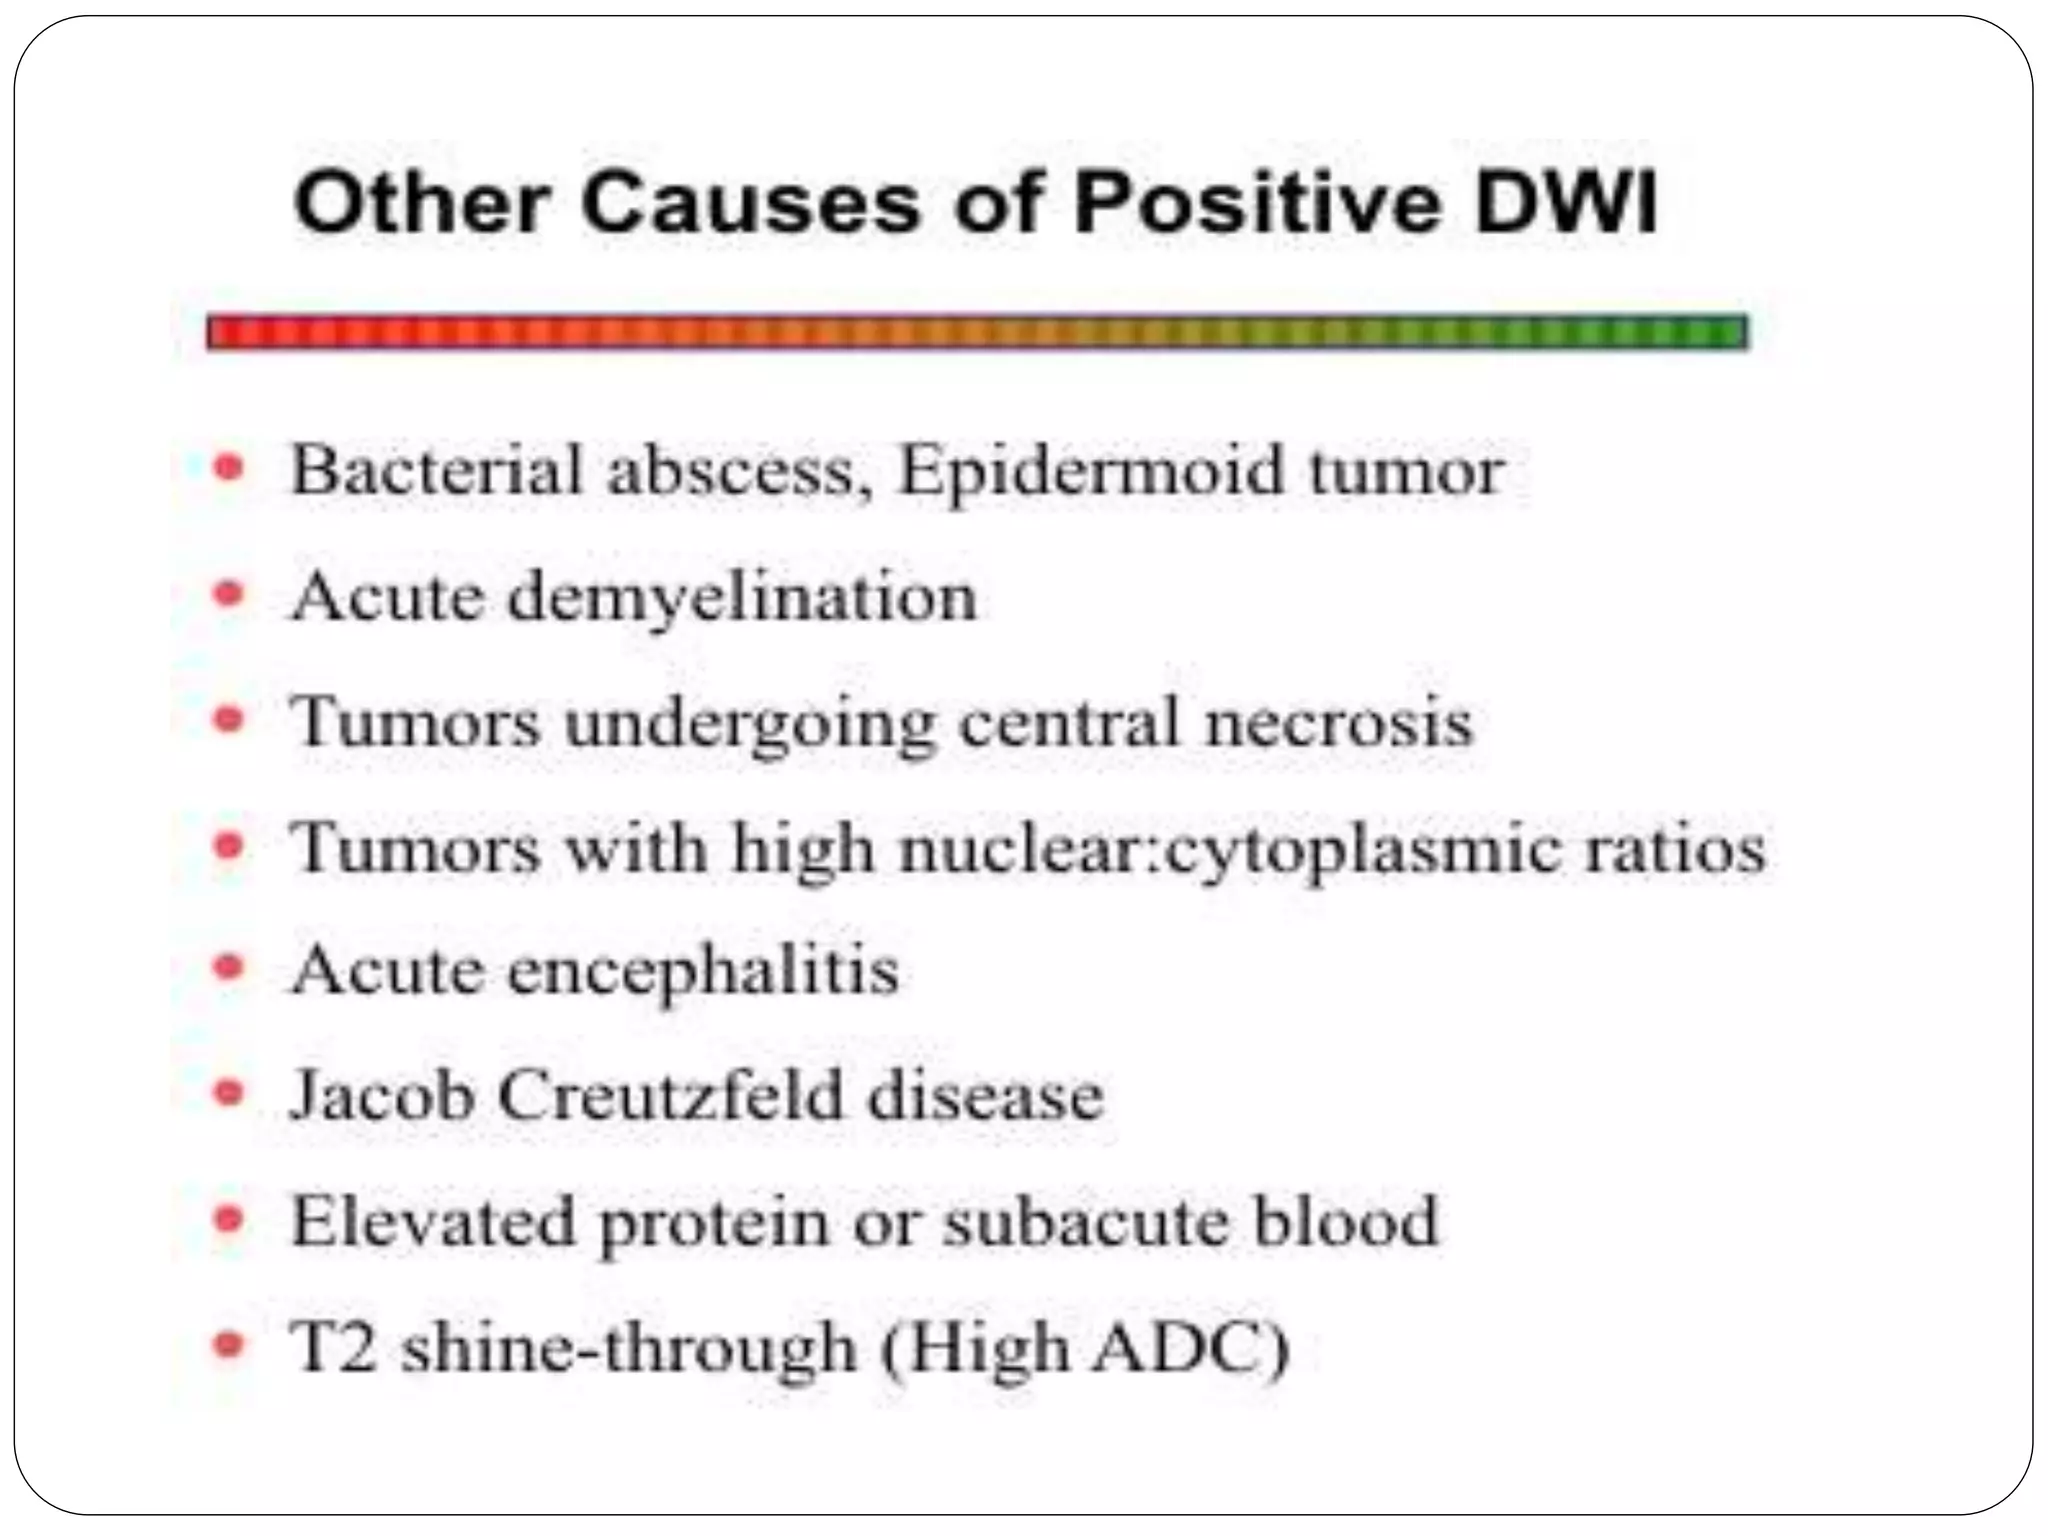
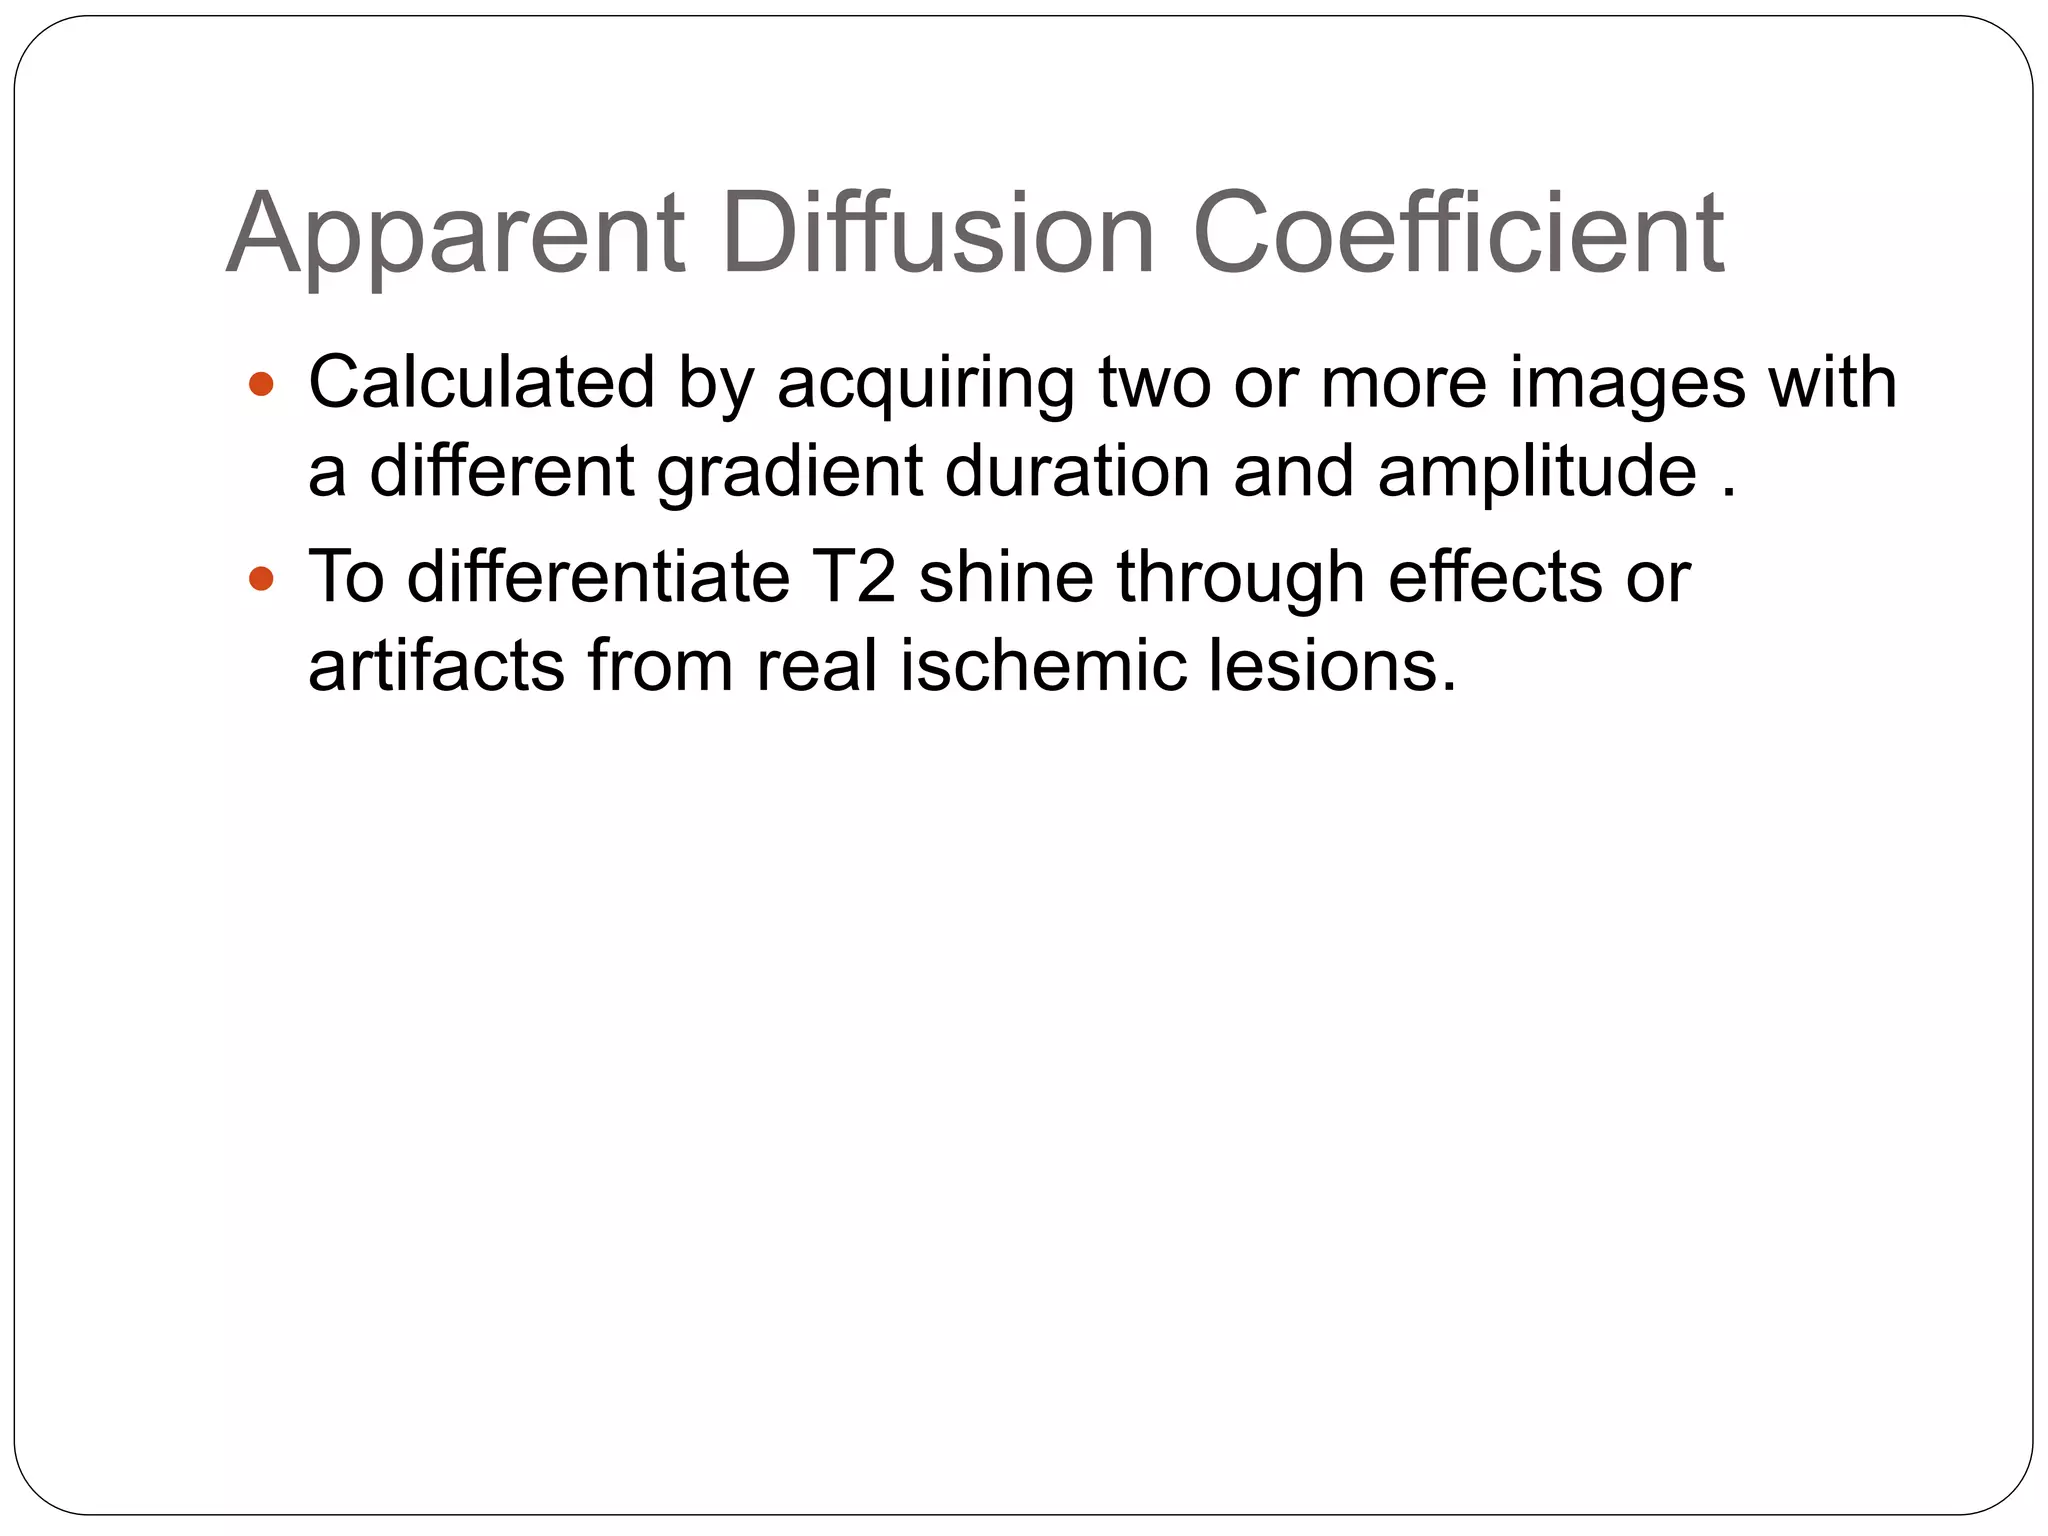
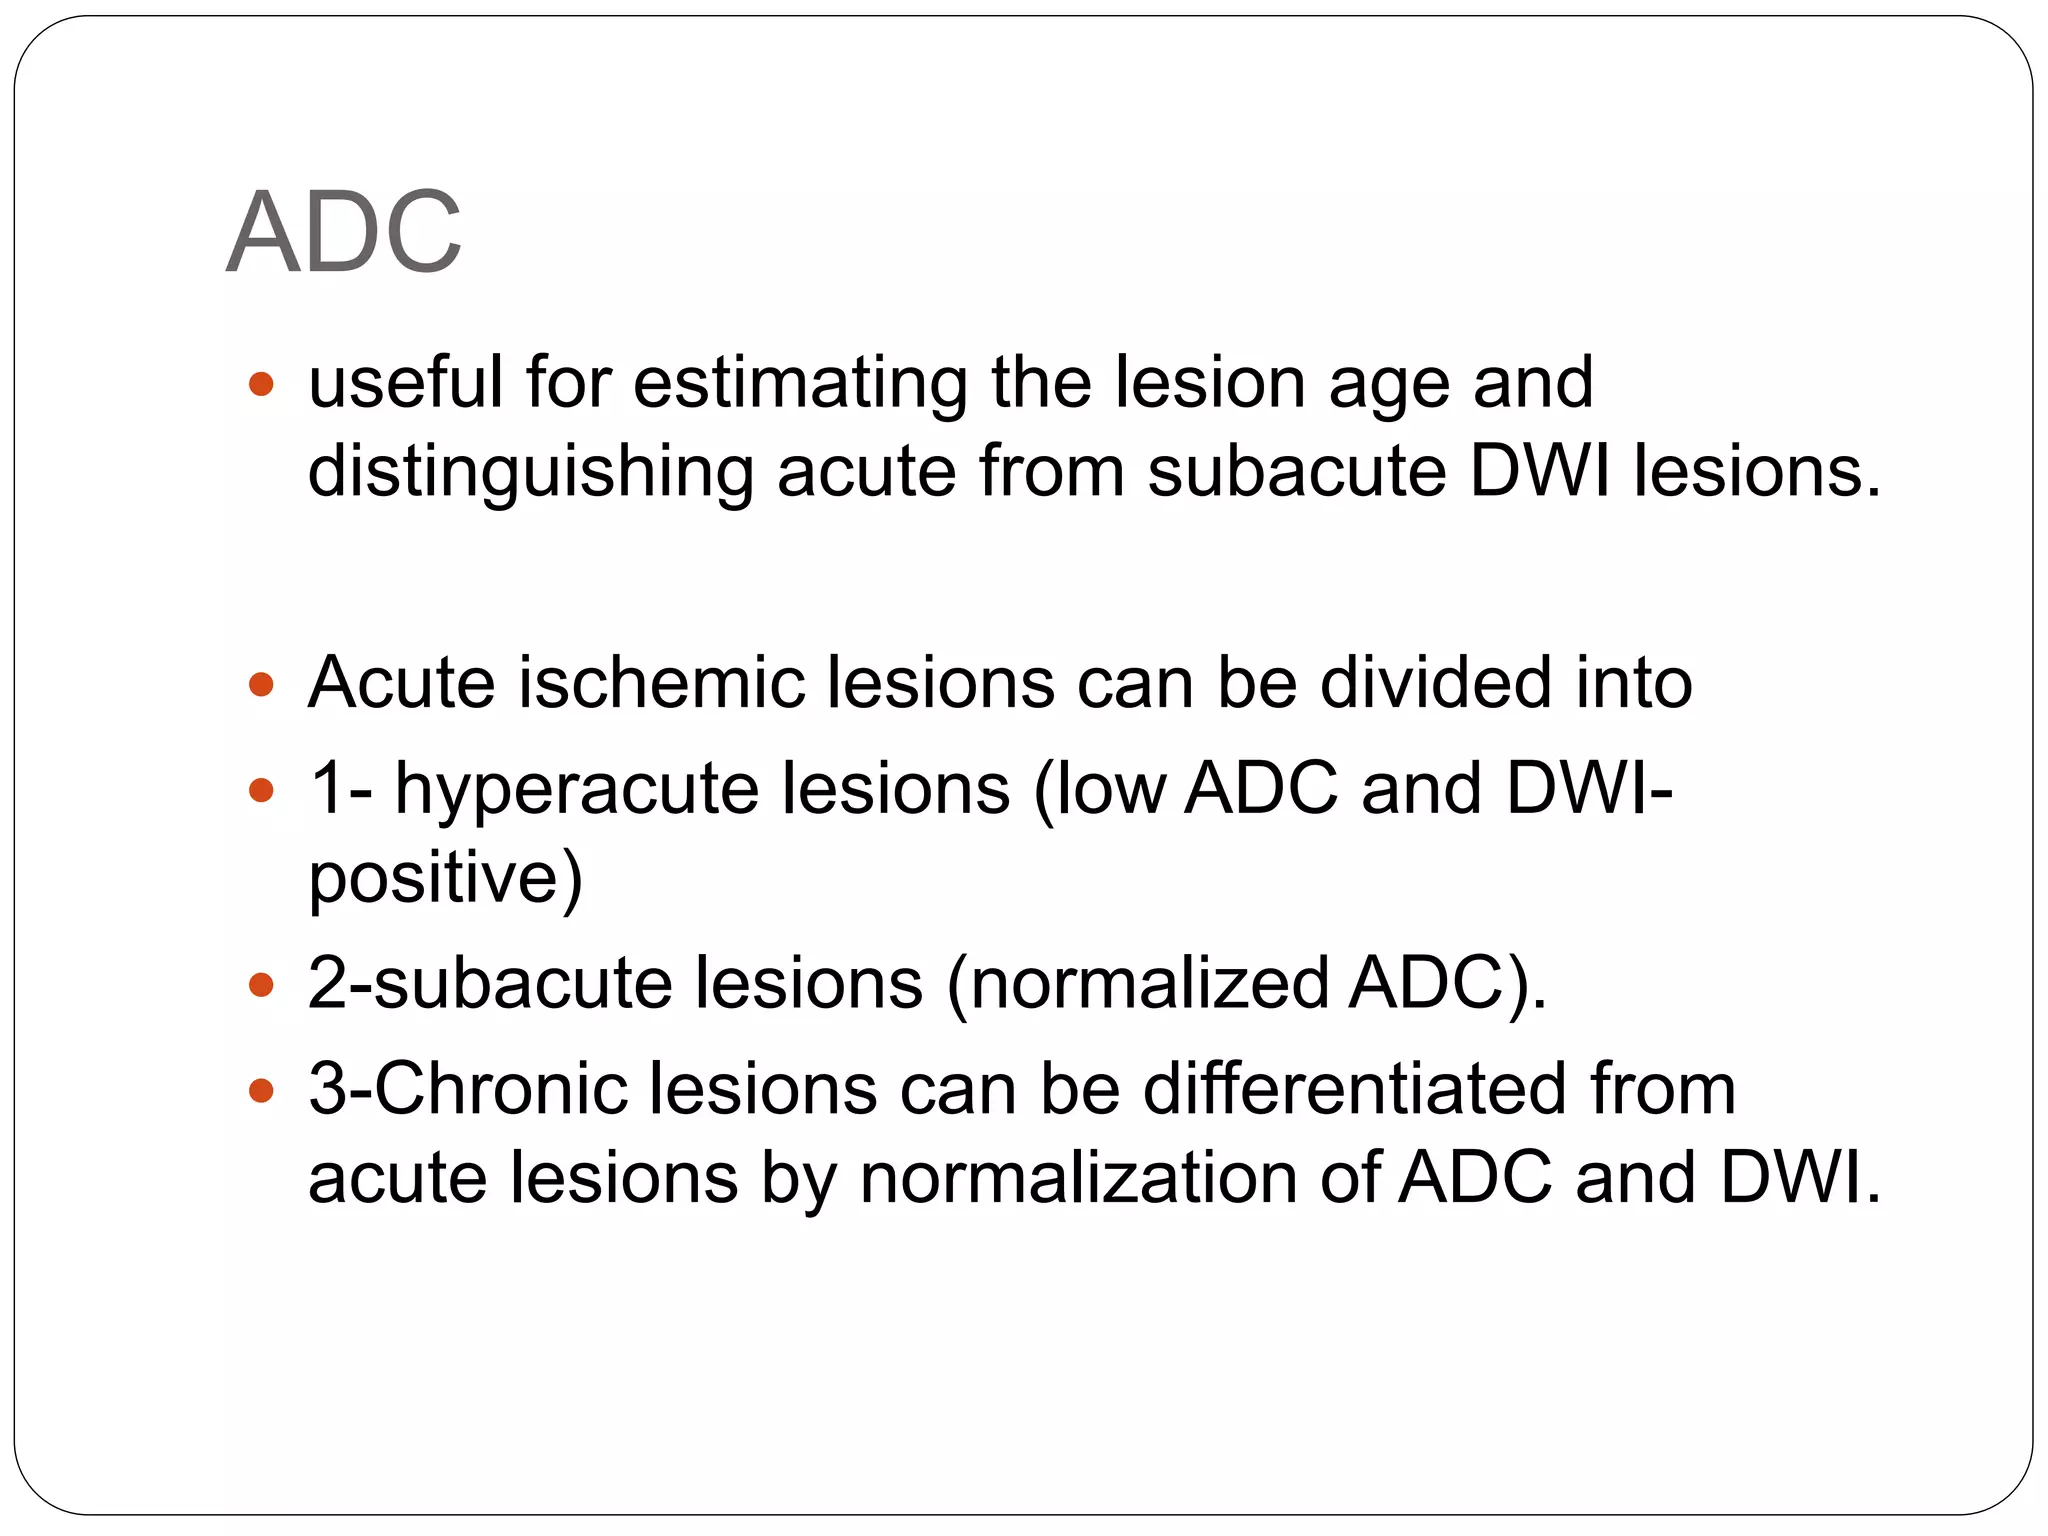
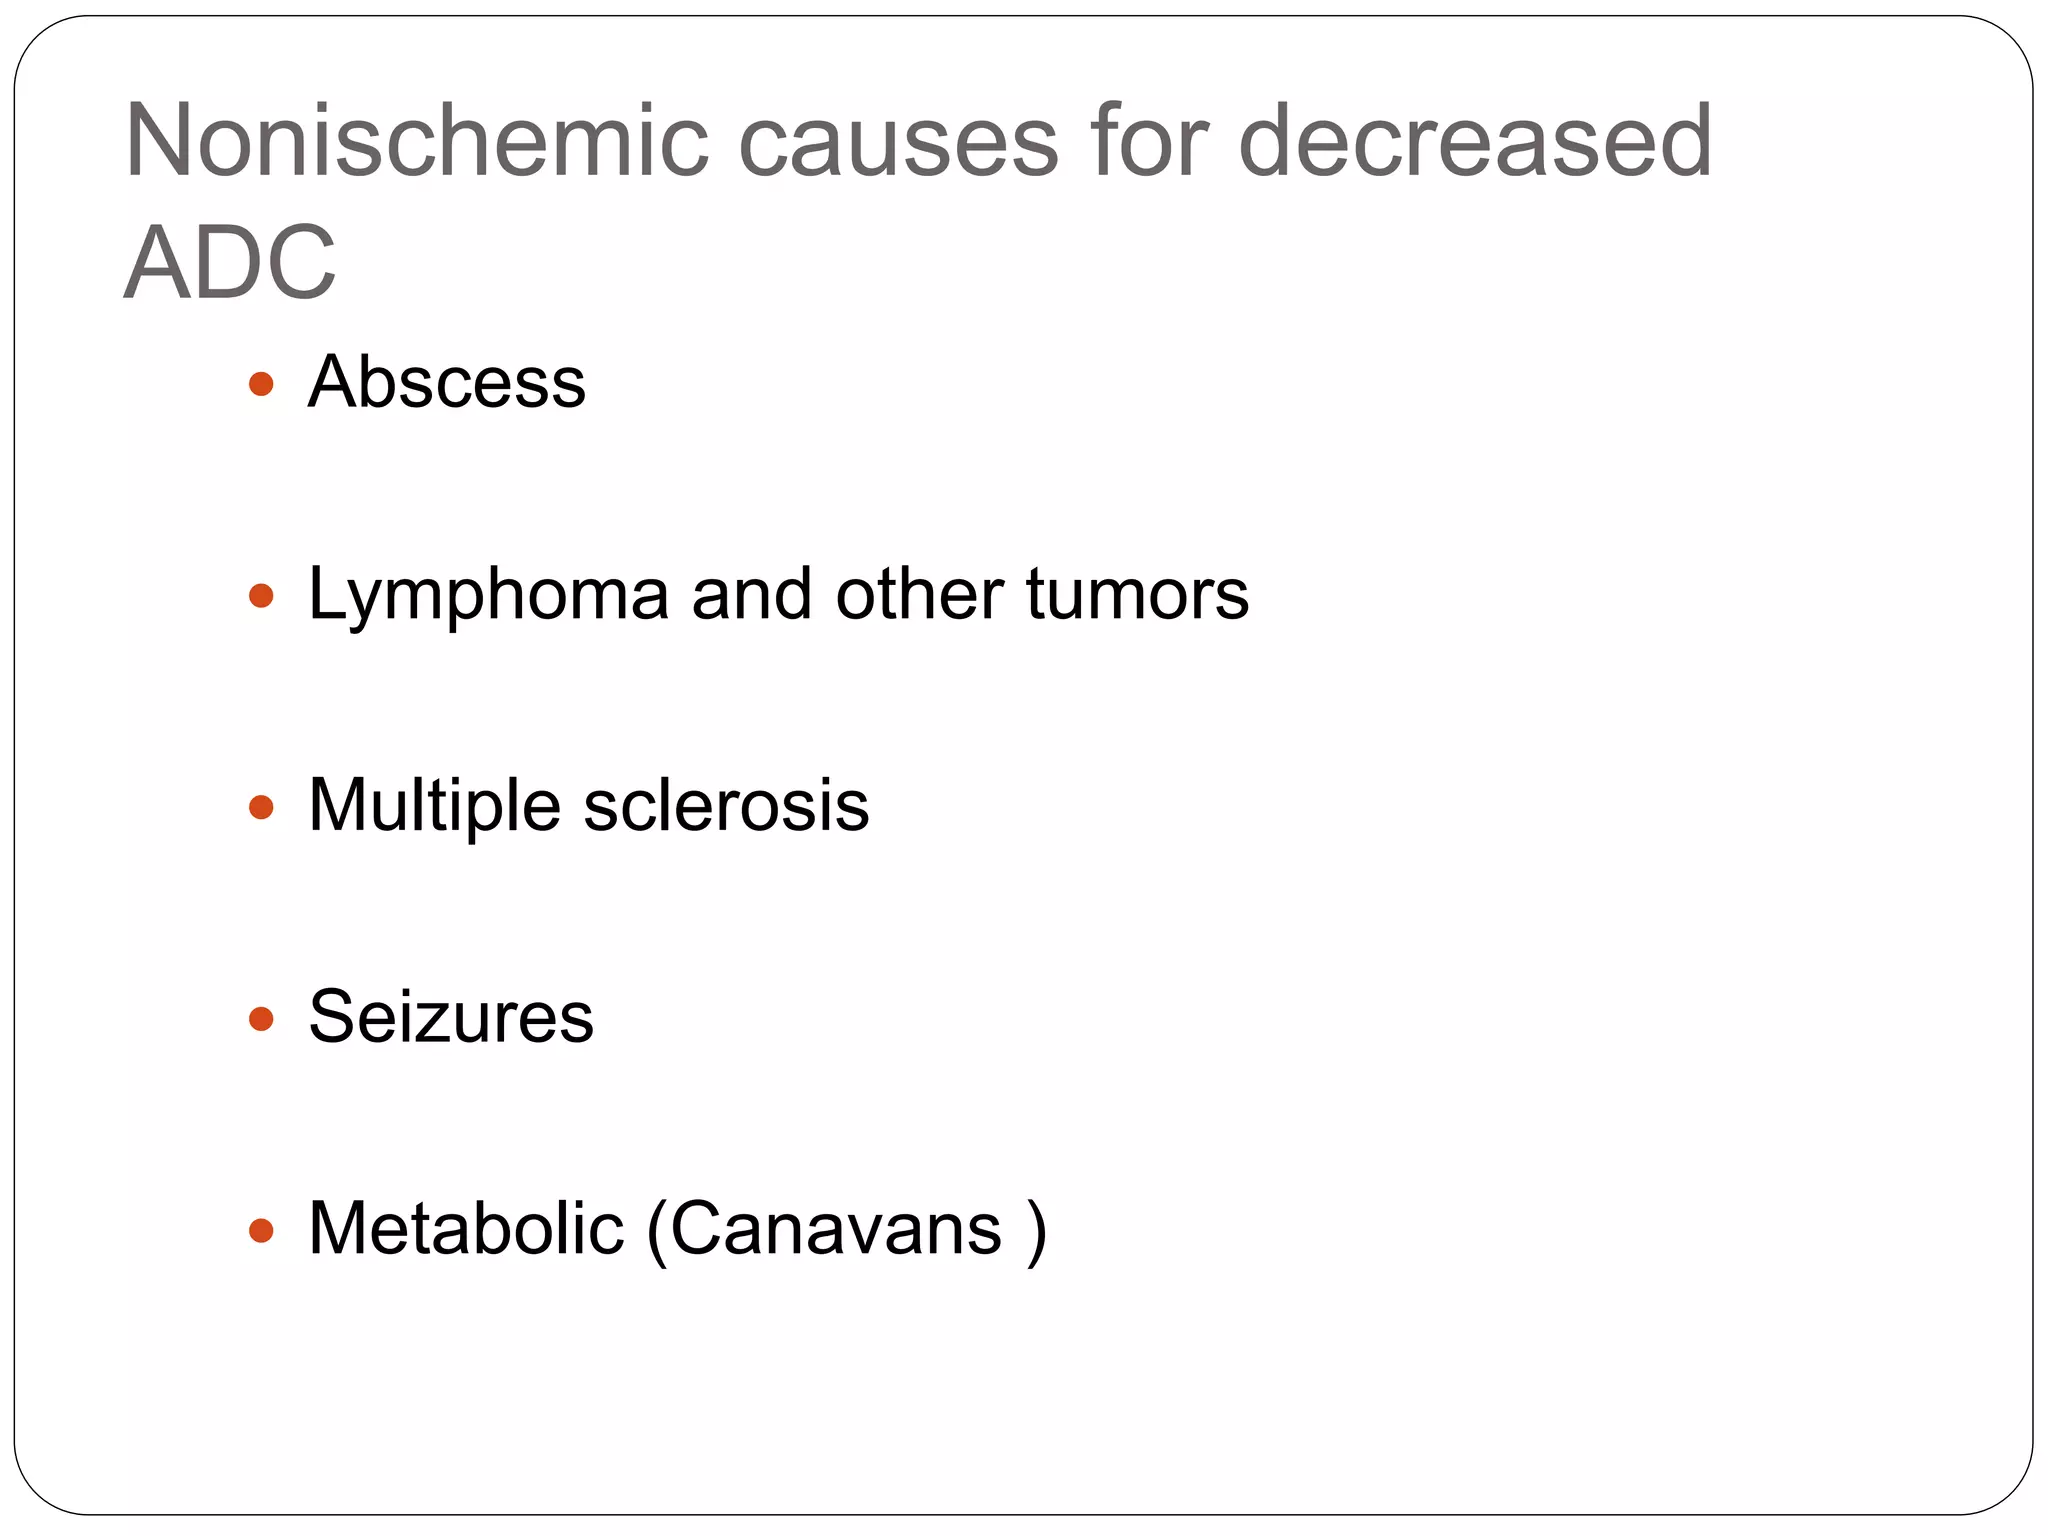
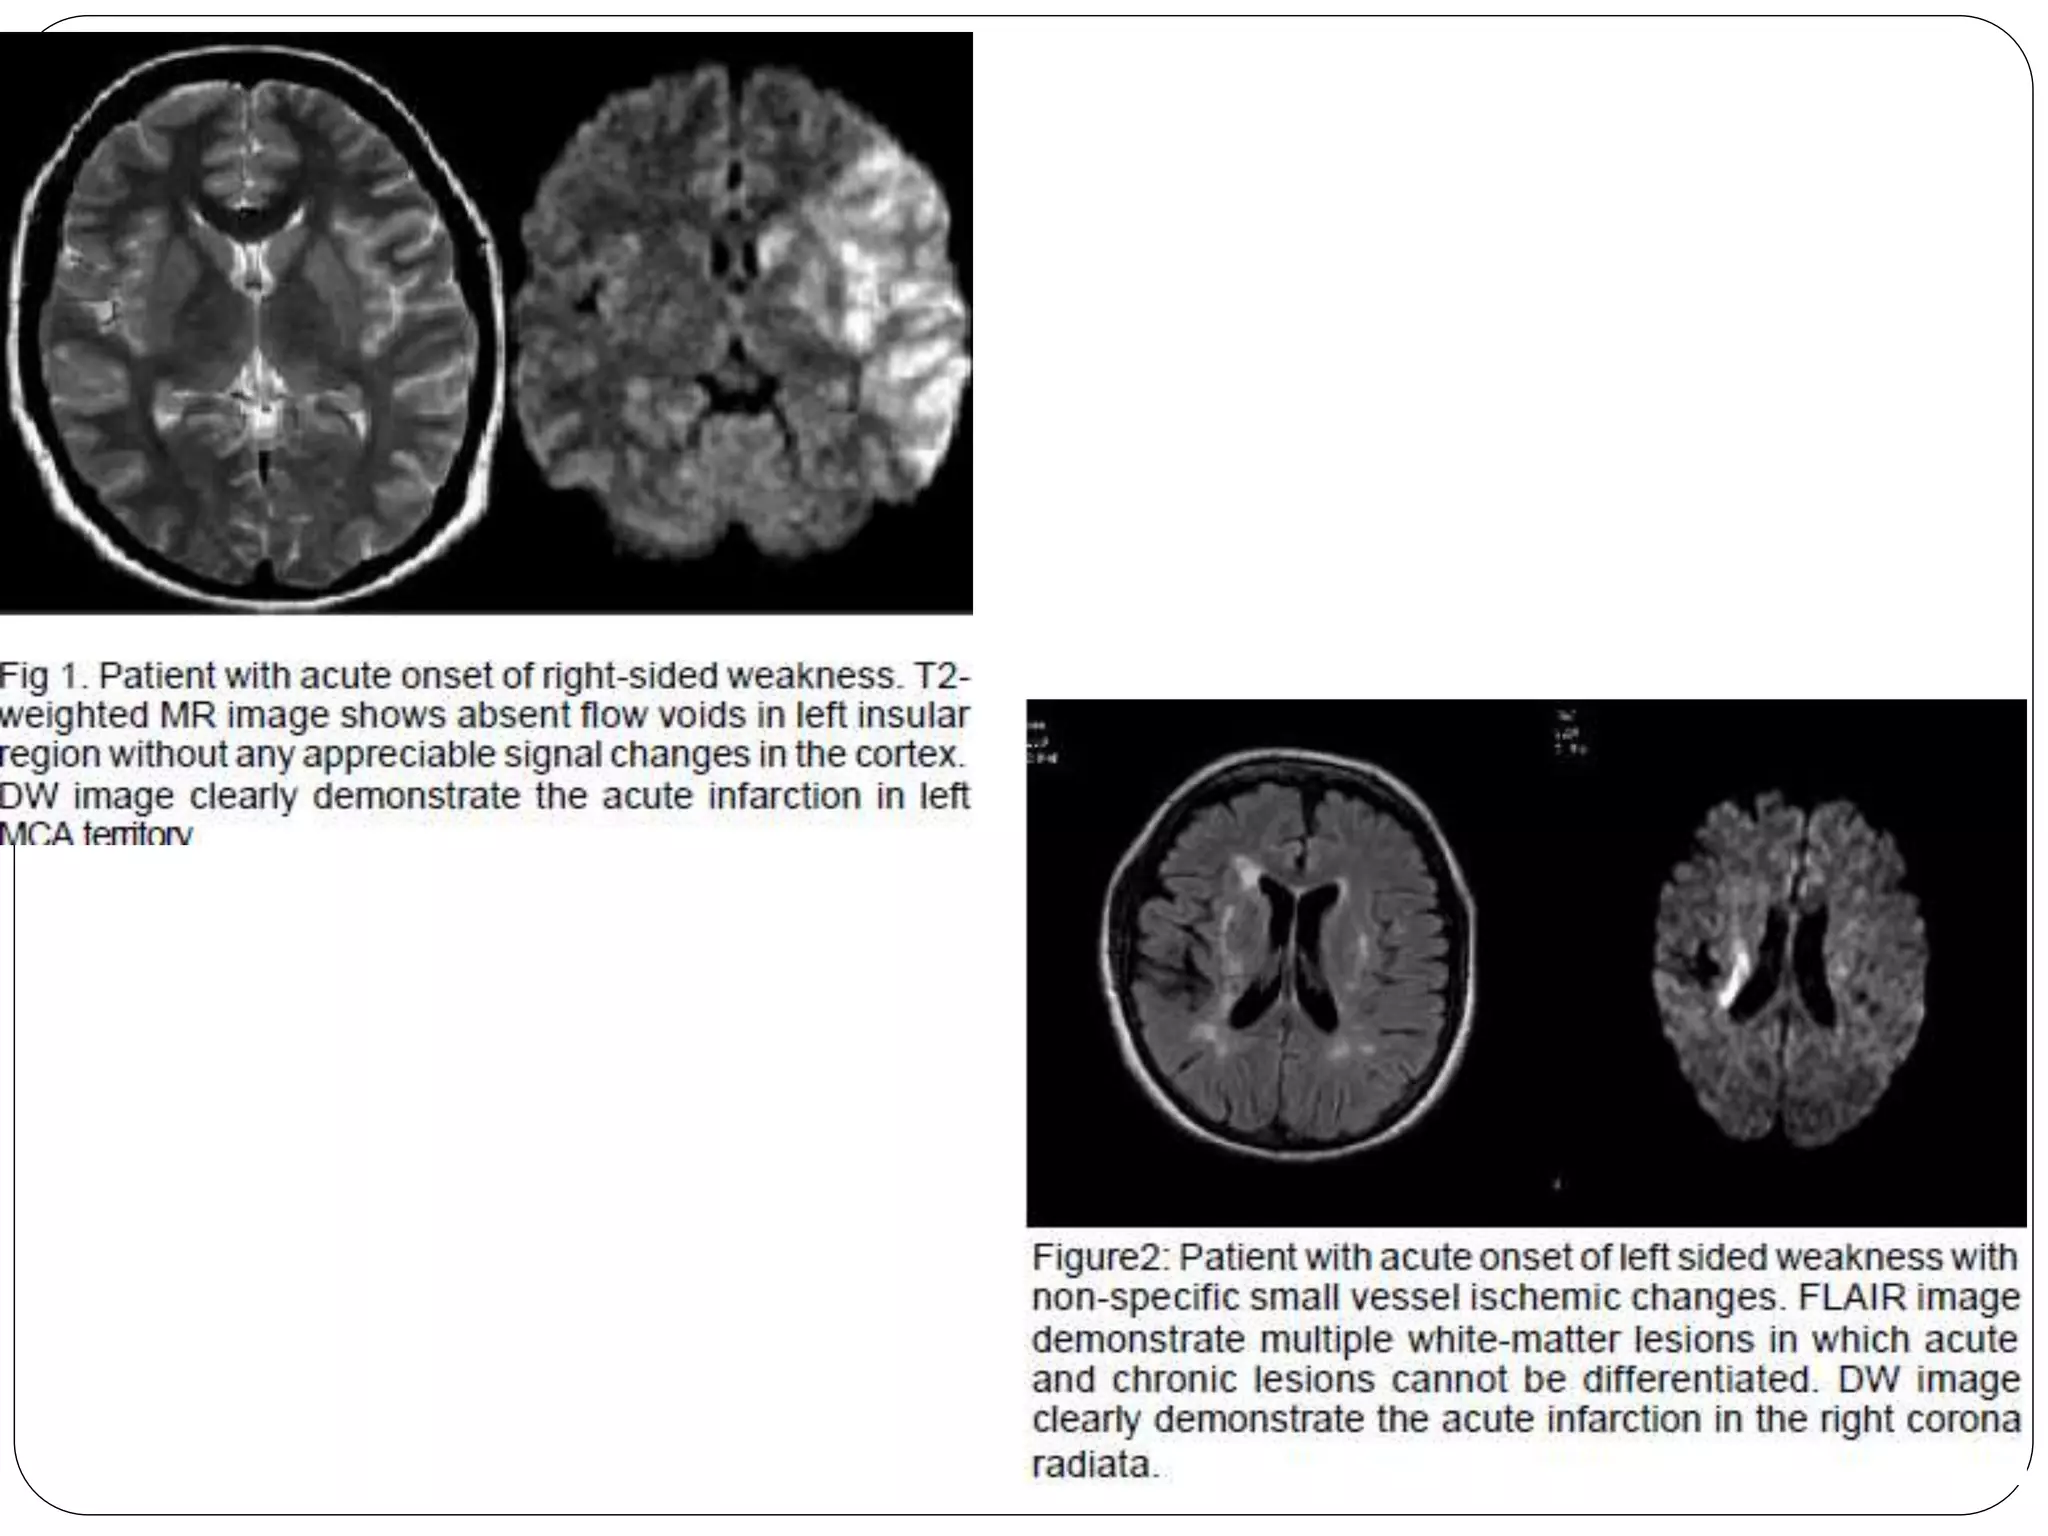
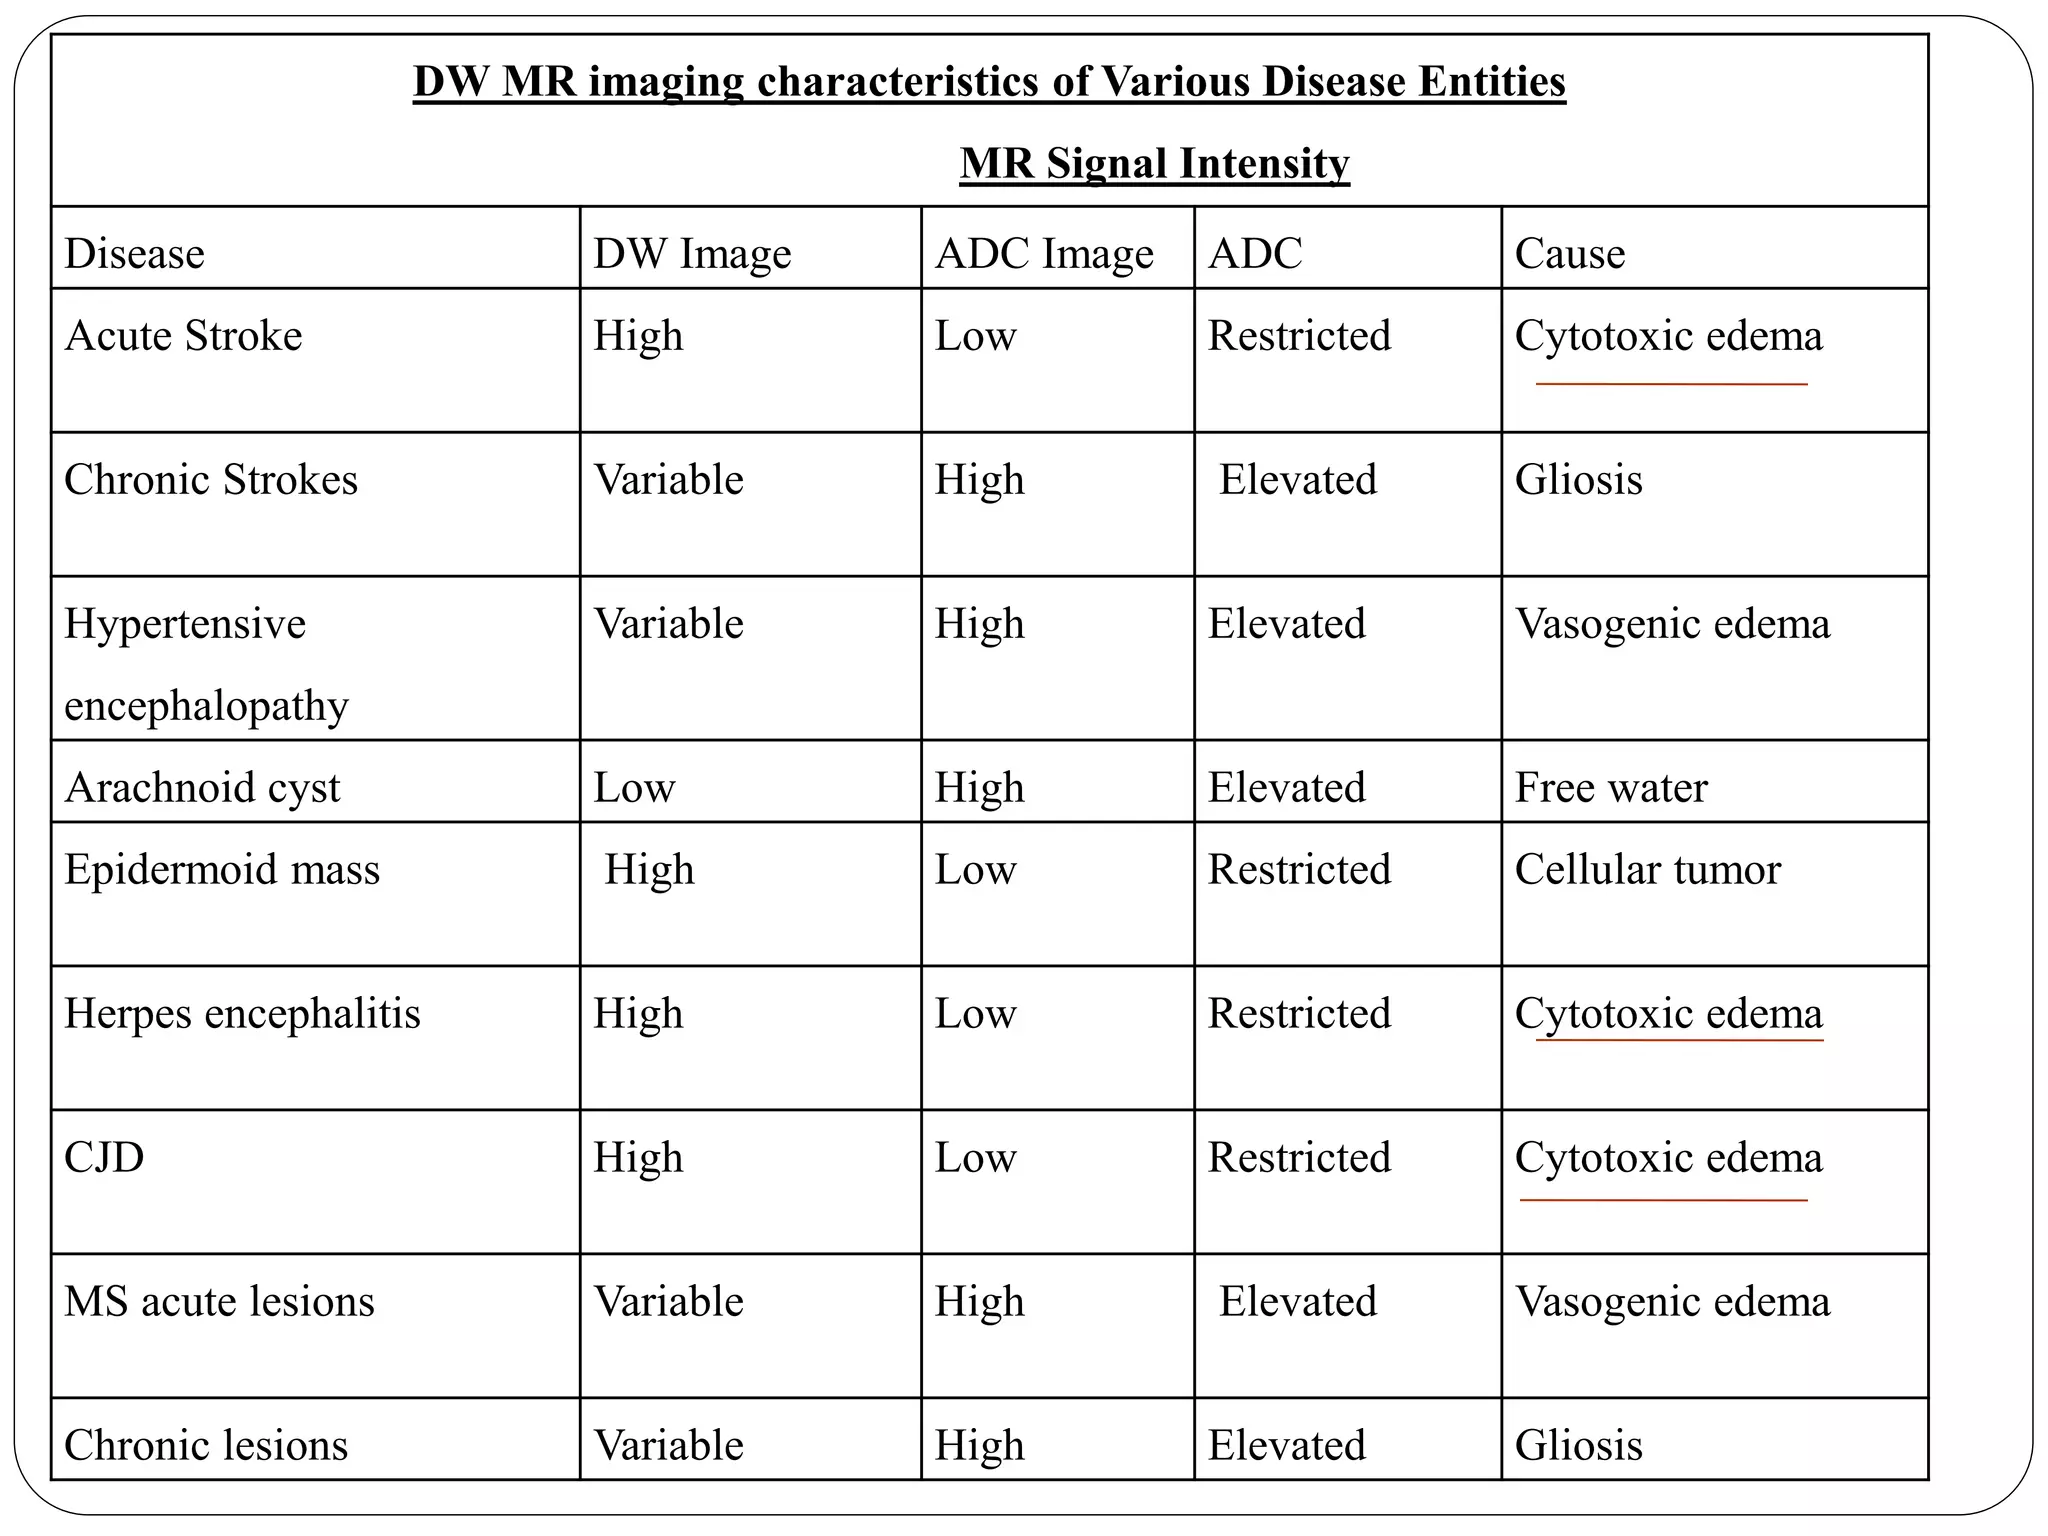
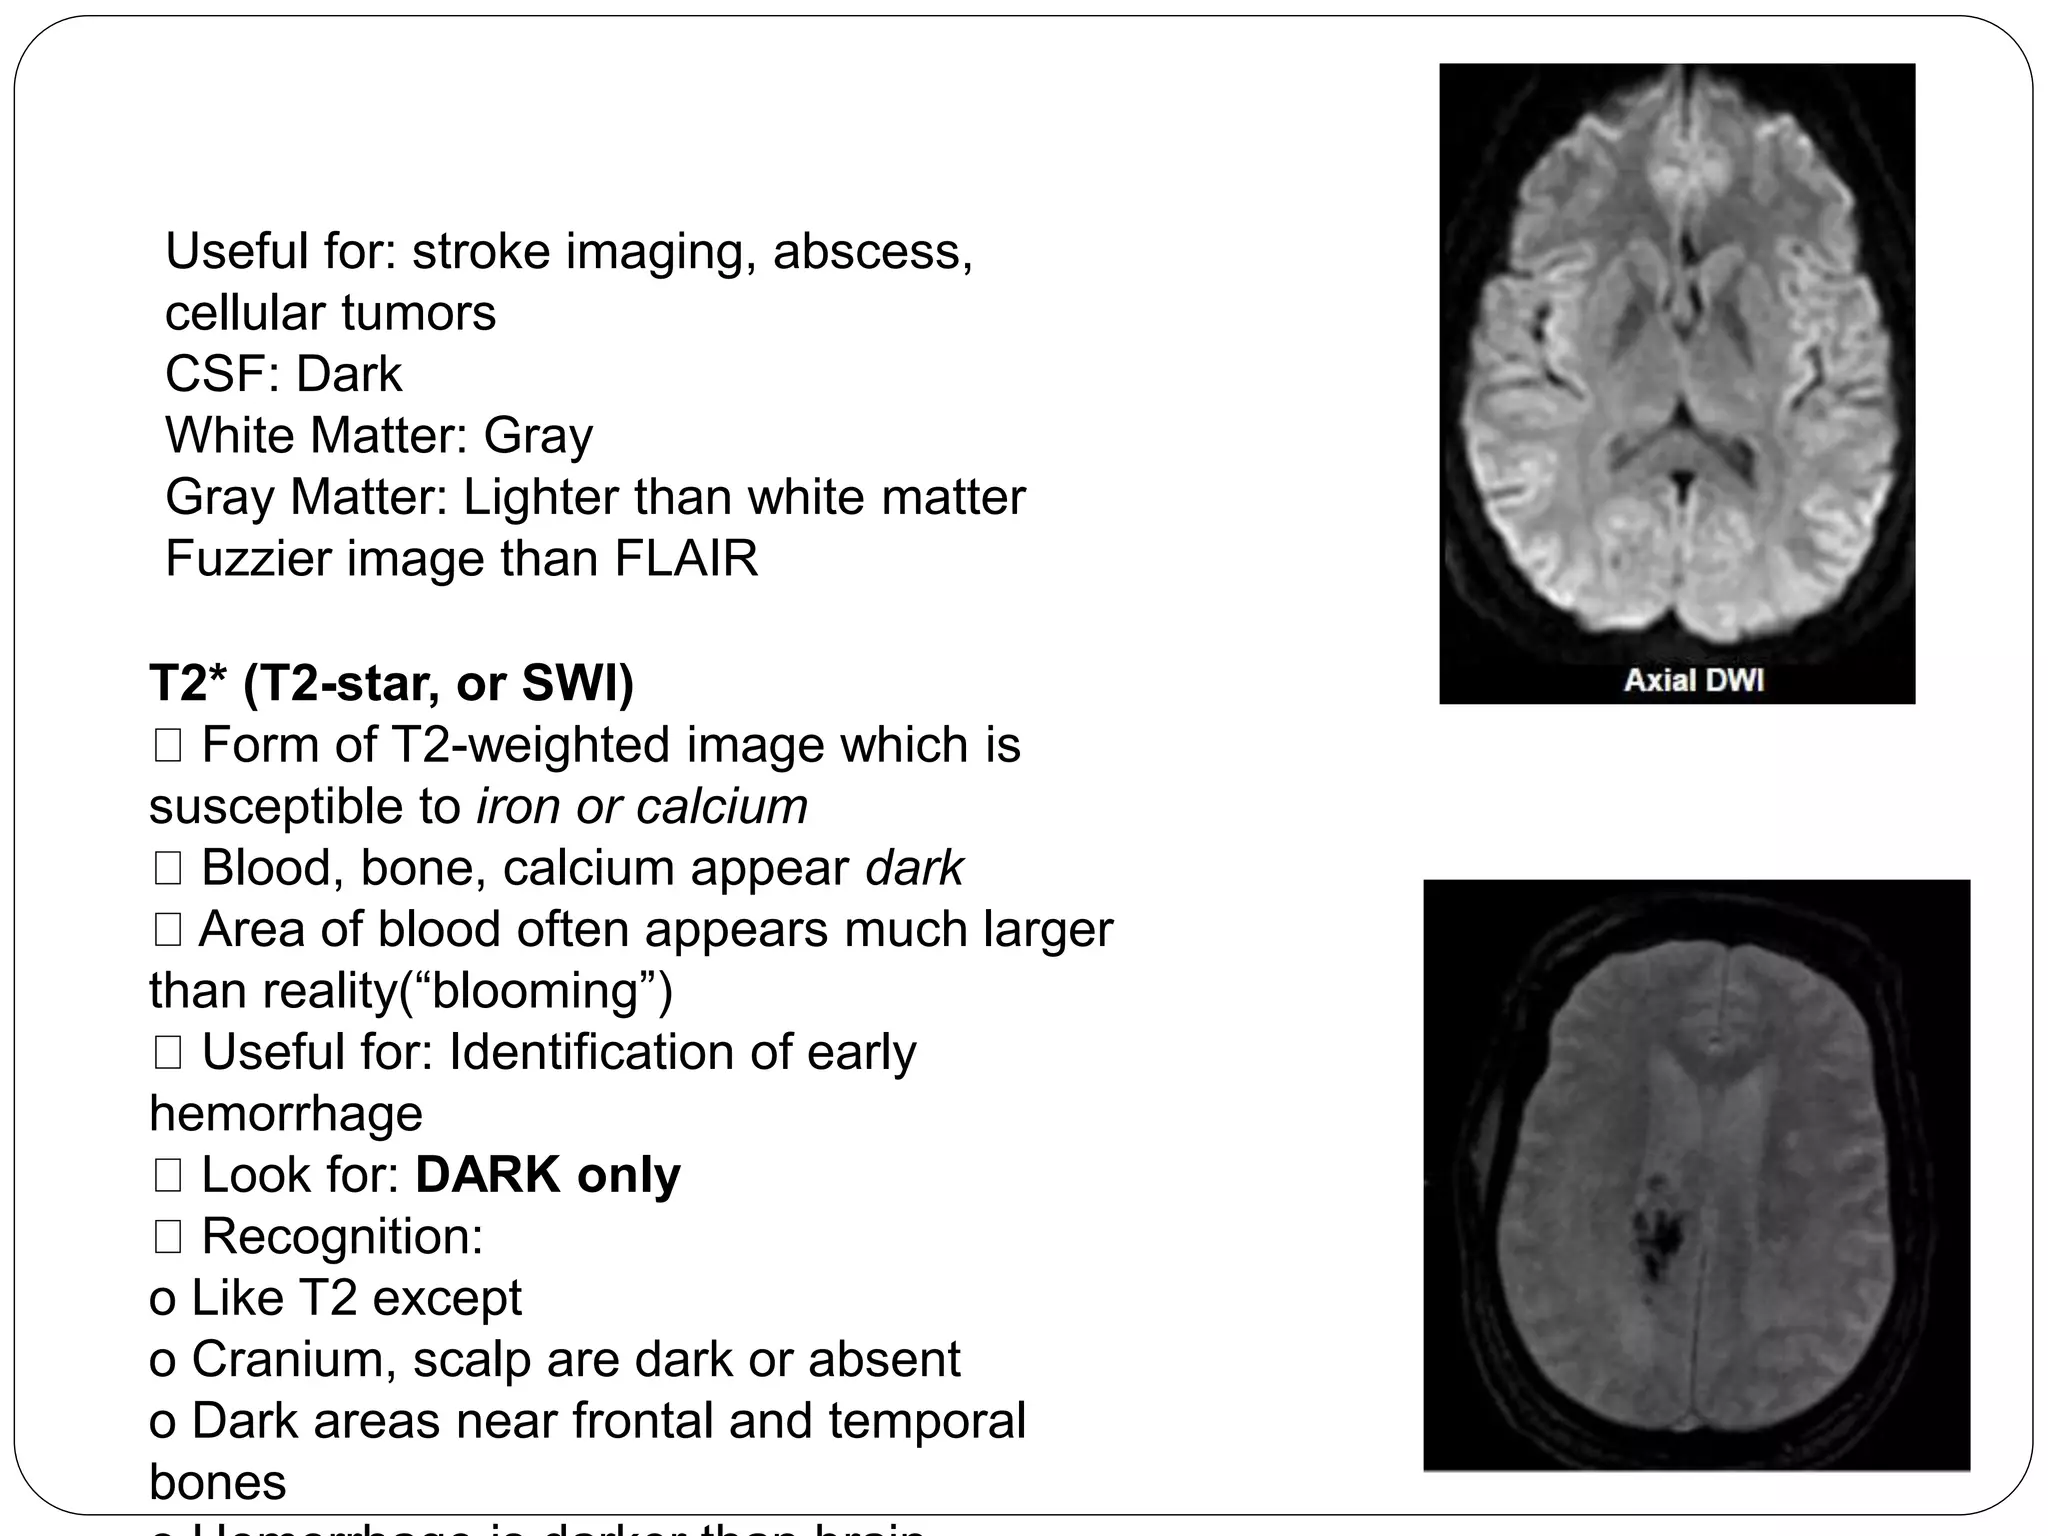
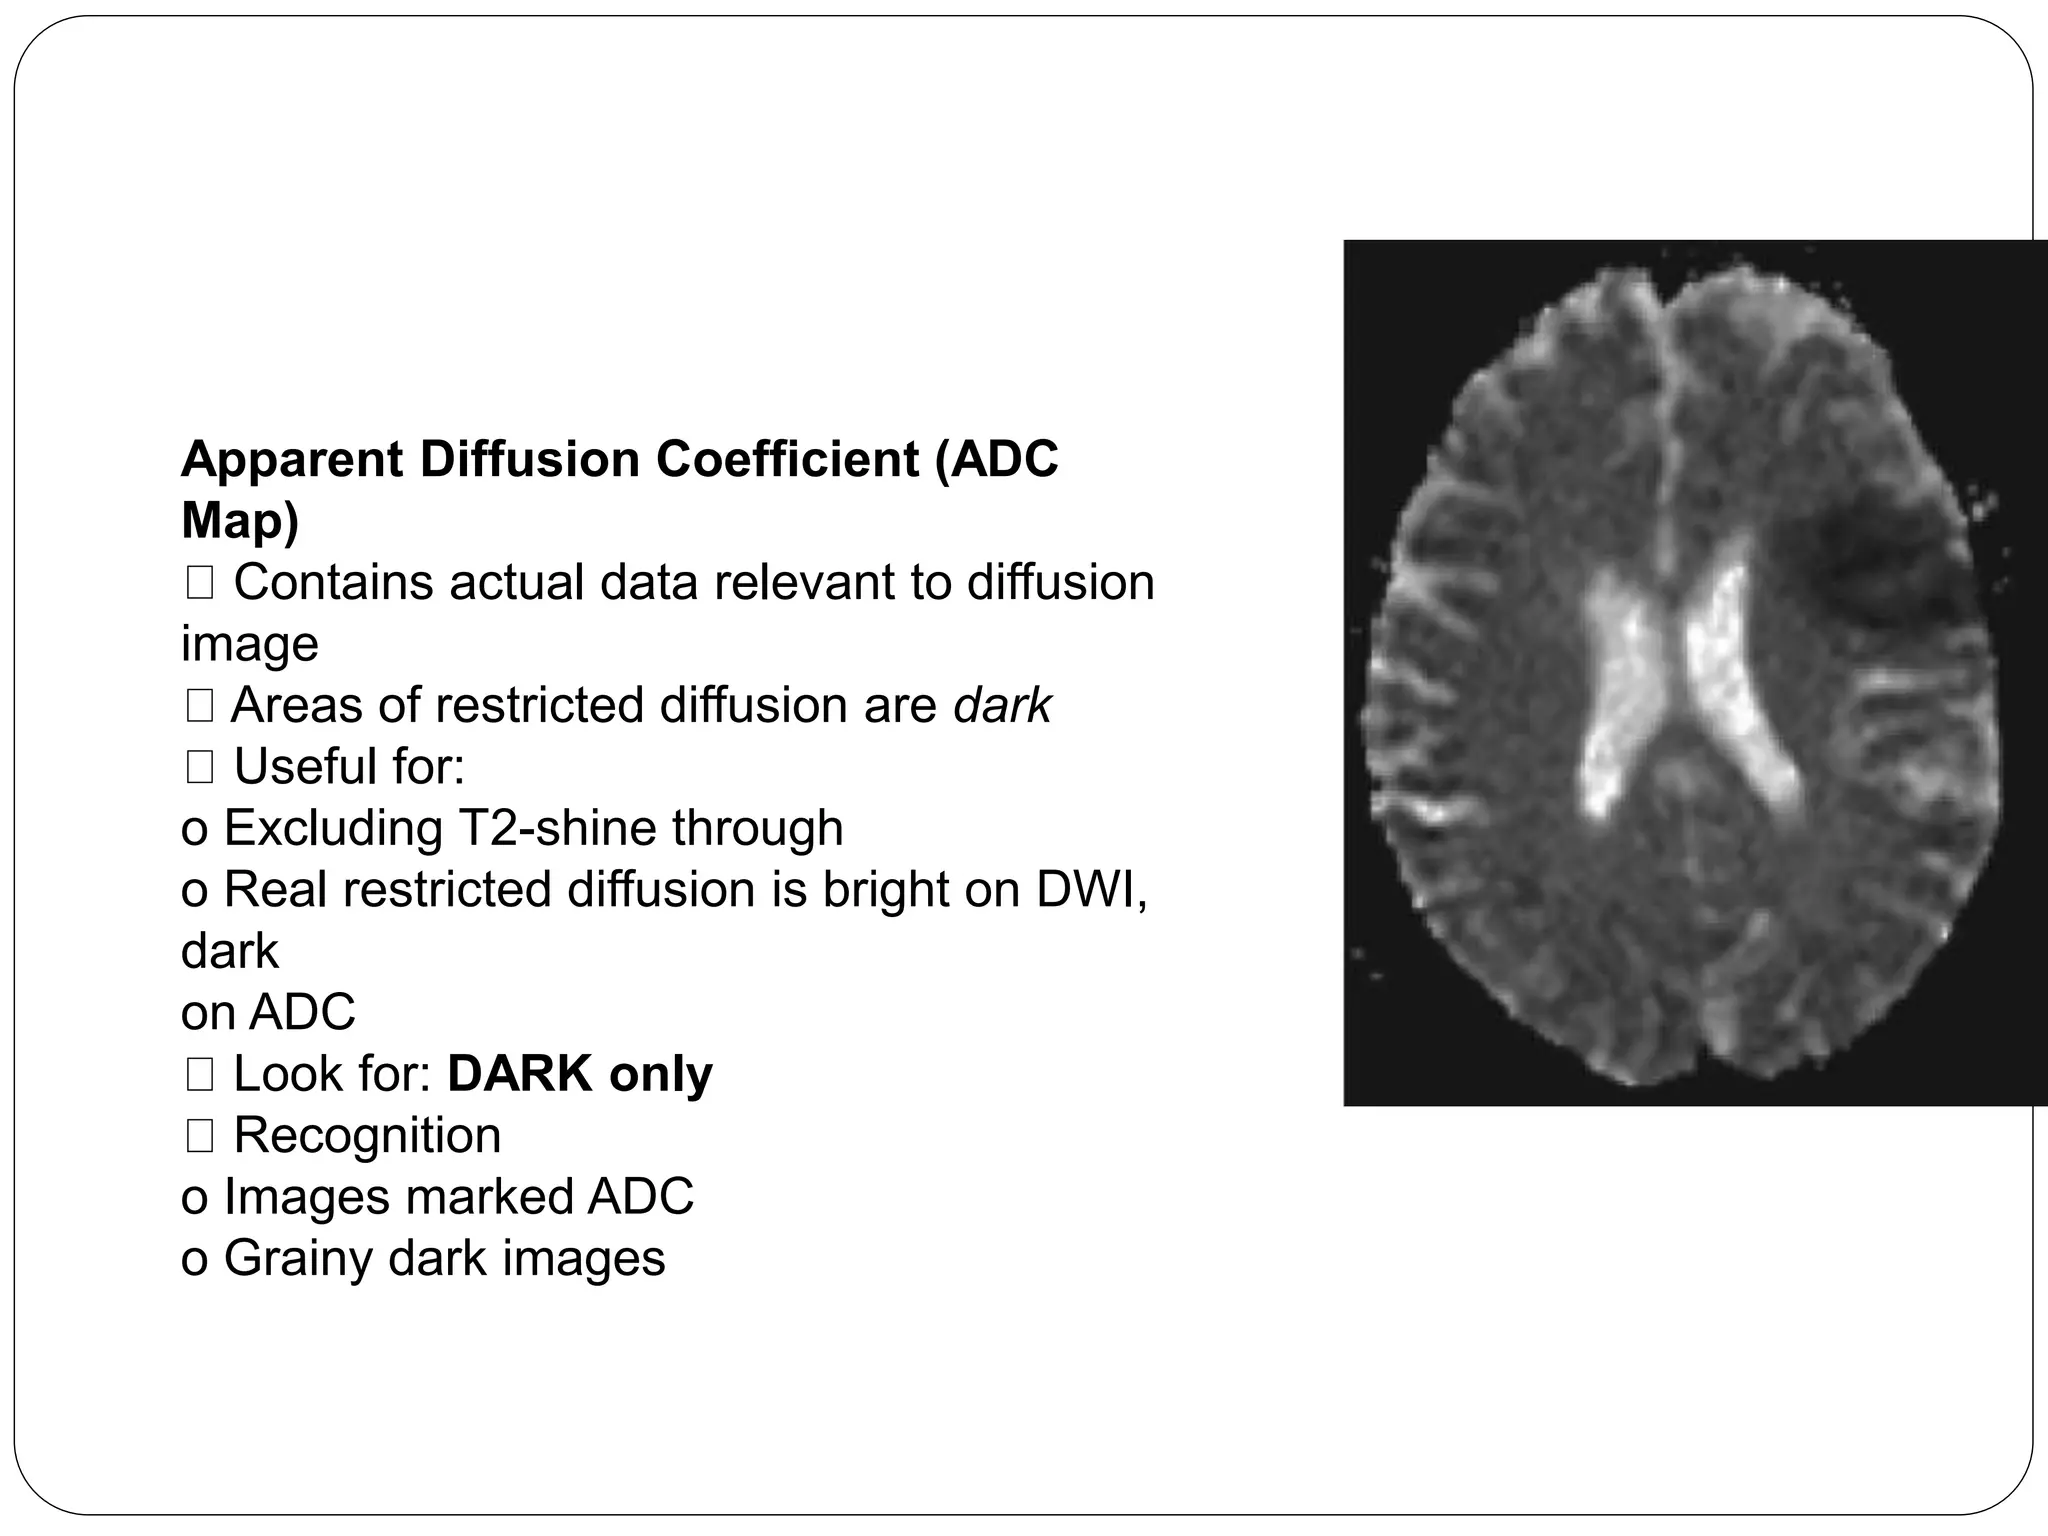
Explains diffusion-weighted MRI, ADC metrics, and their relevance for assessing acute stroke and differentiating lesions.
Evaluation metrics for stroke using DW imaging, significance of ADC in differentiating between acute and chronic lesions.
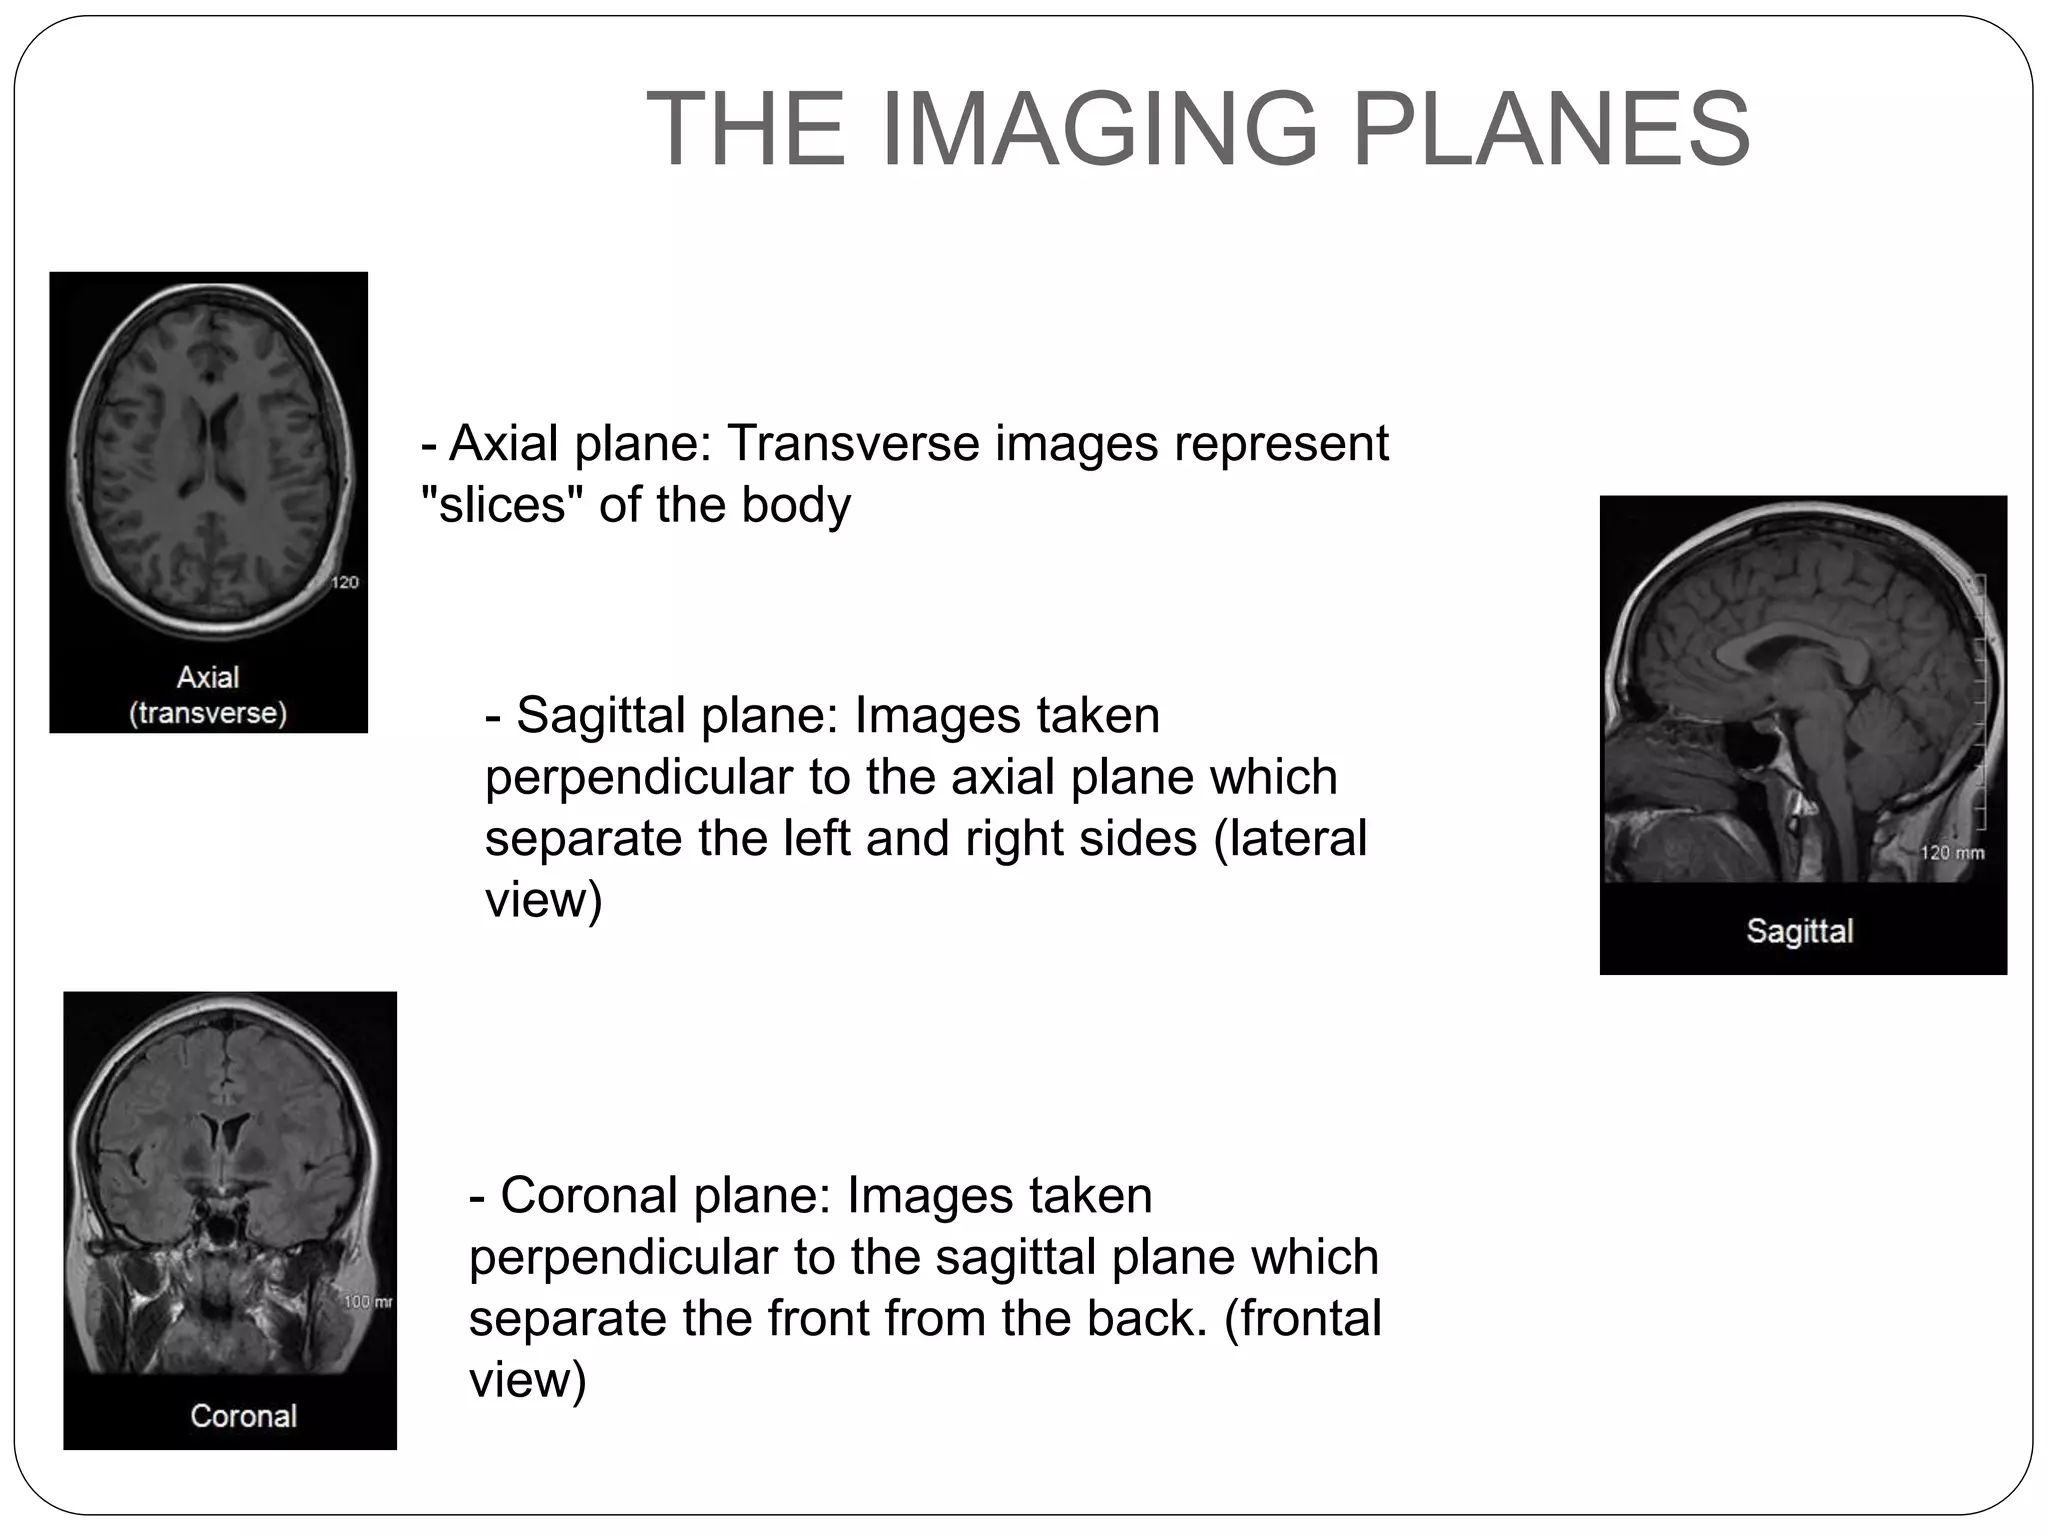
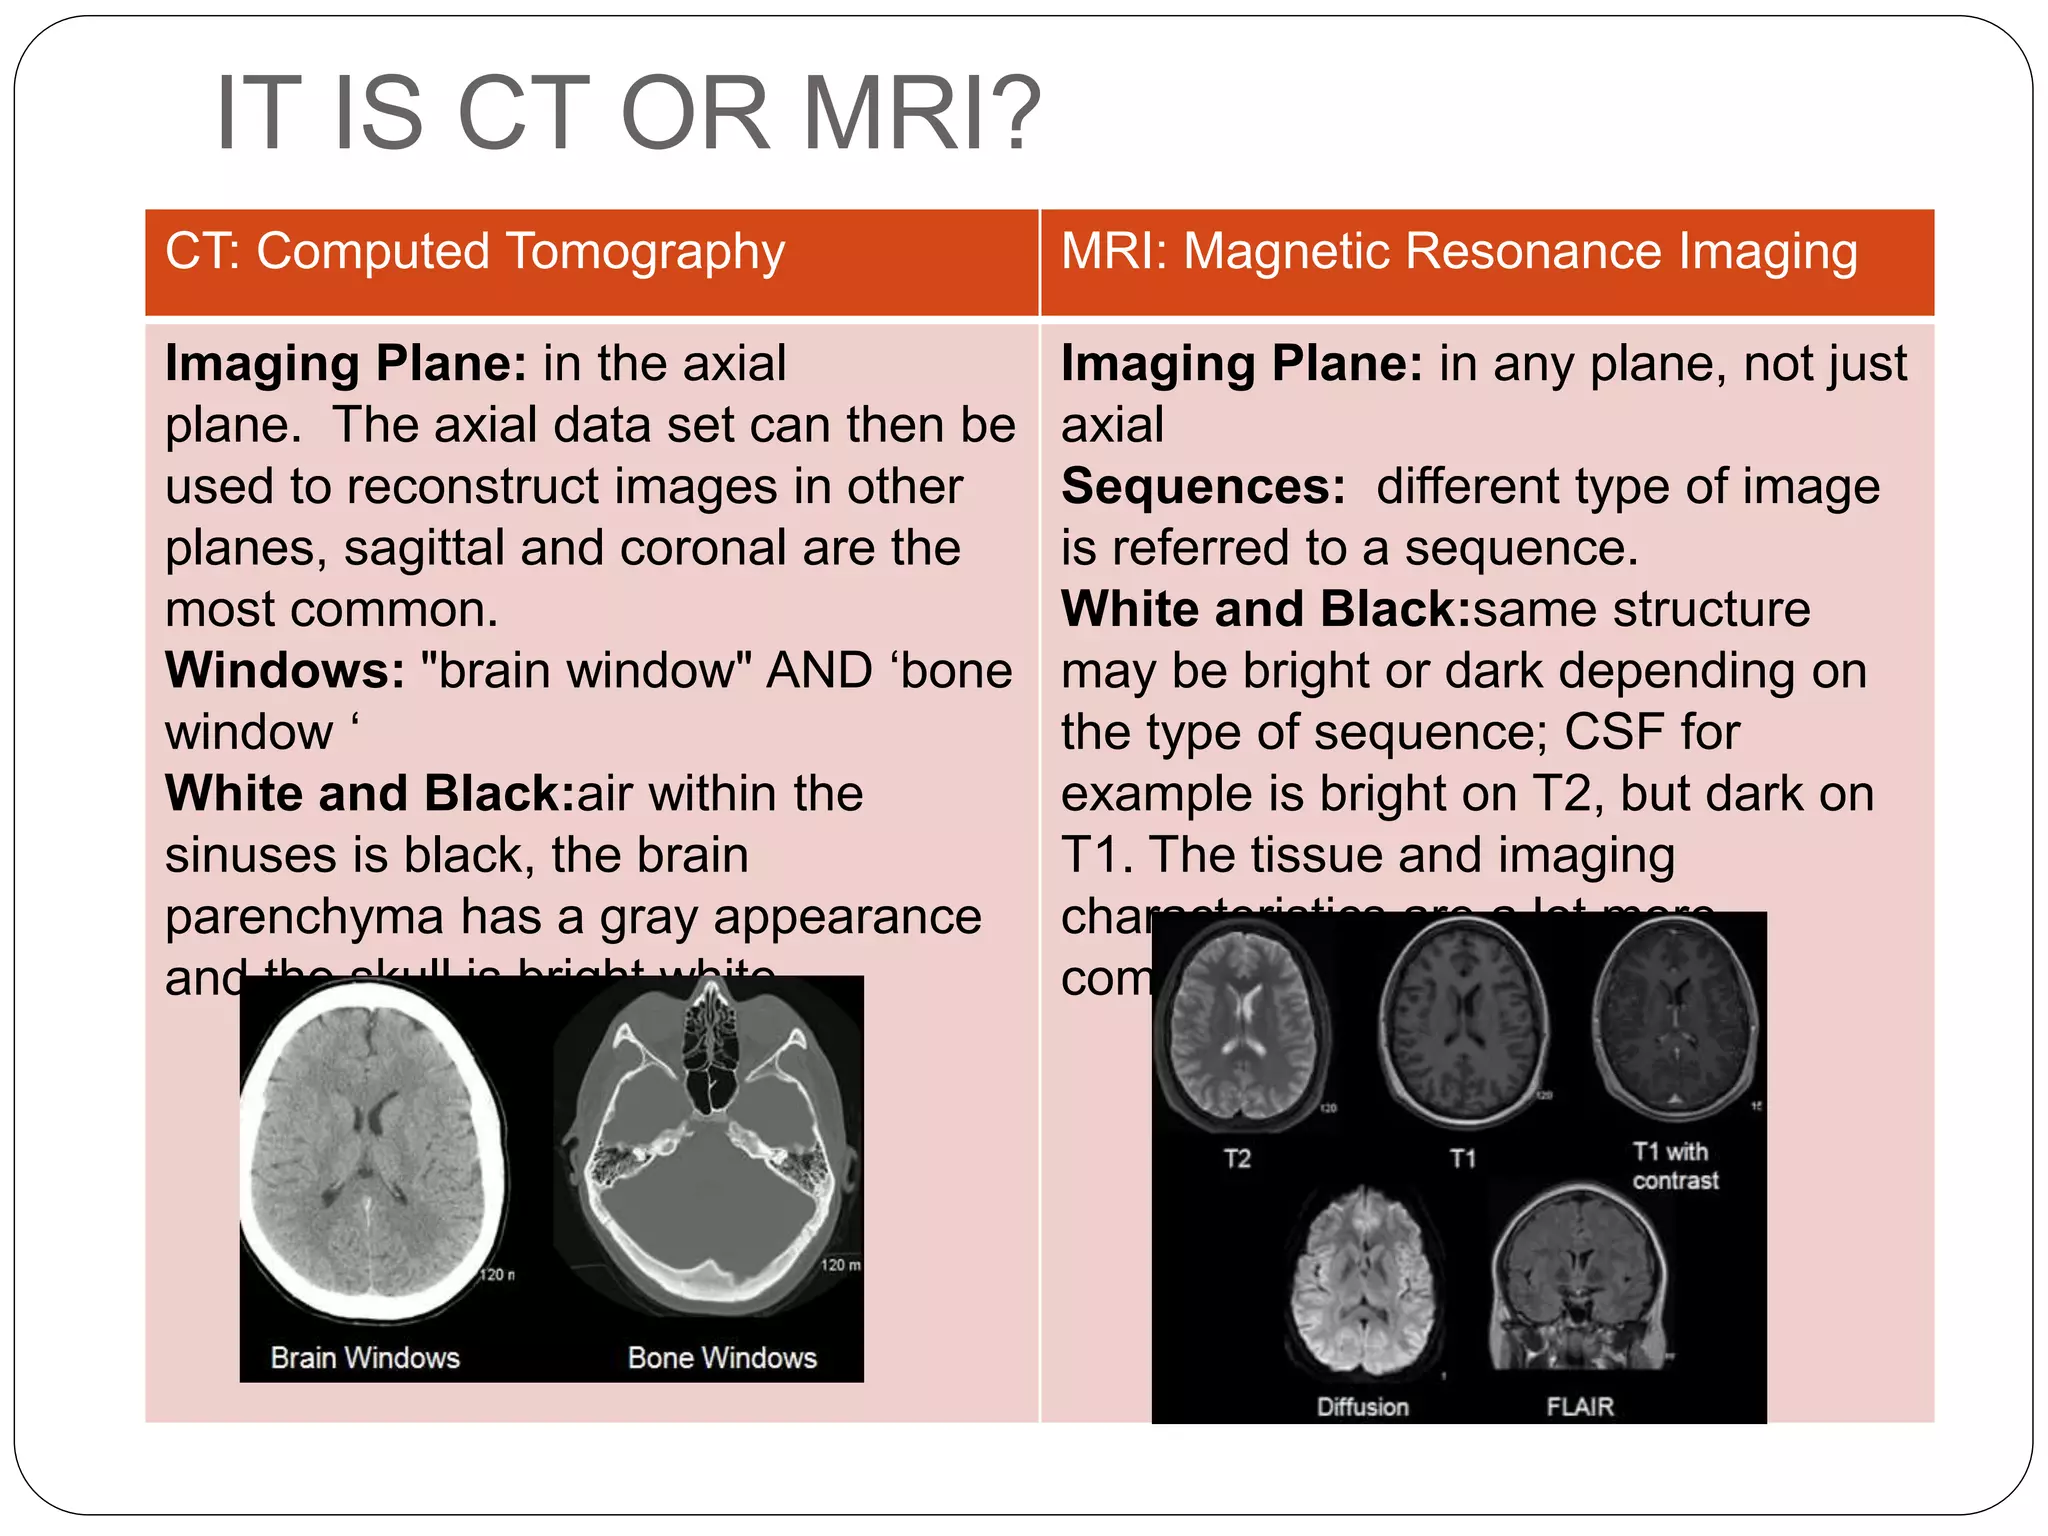
Description of MRI imaging planes, how to interpret MR images regarding hyperintensity and isointensity, and CT vs MRI differences.
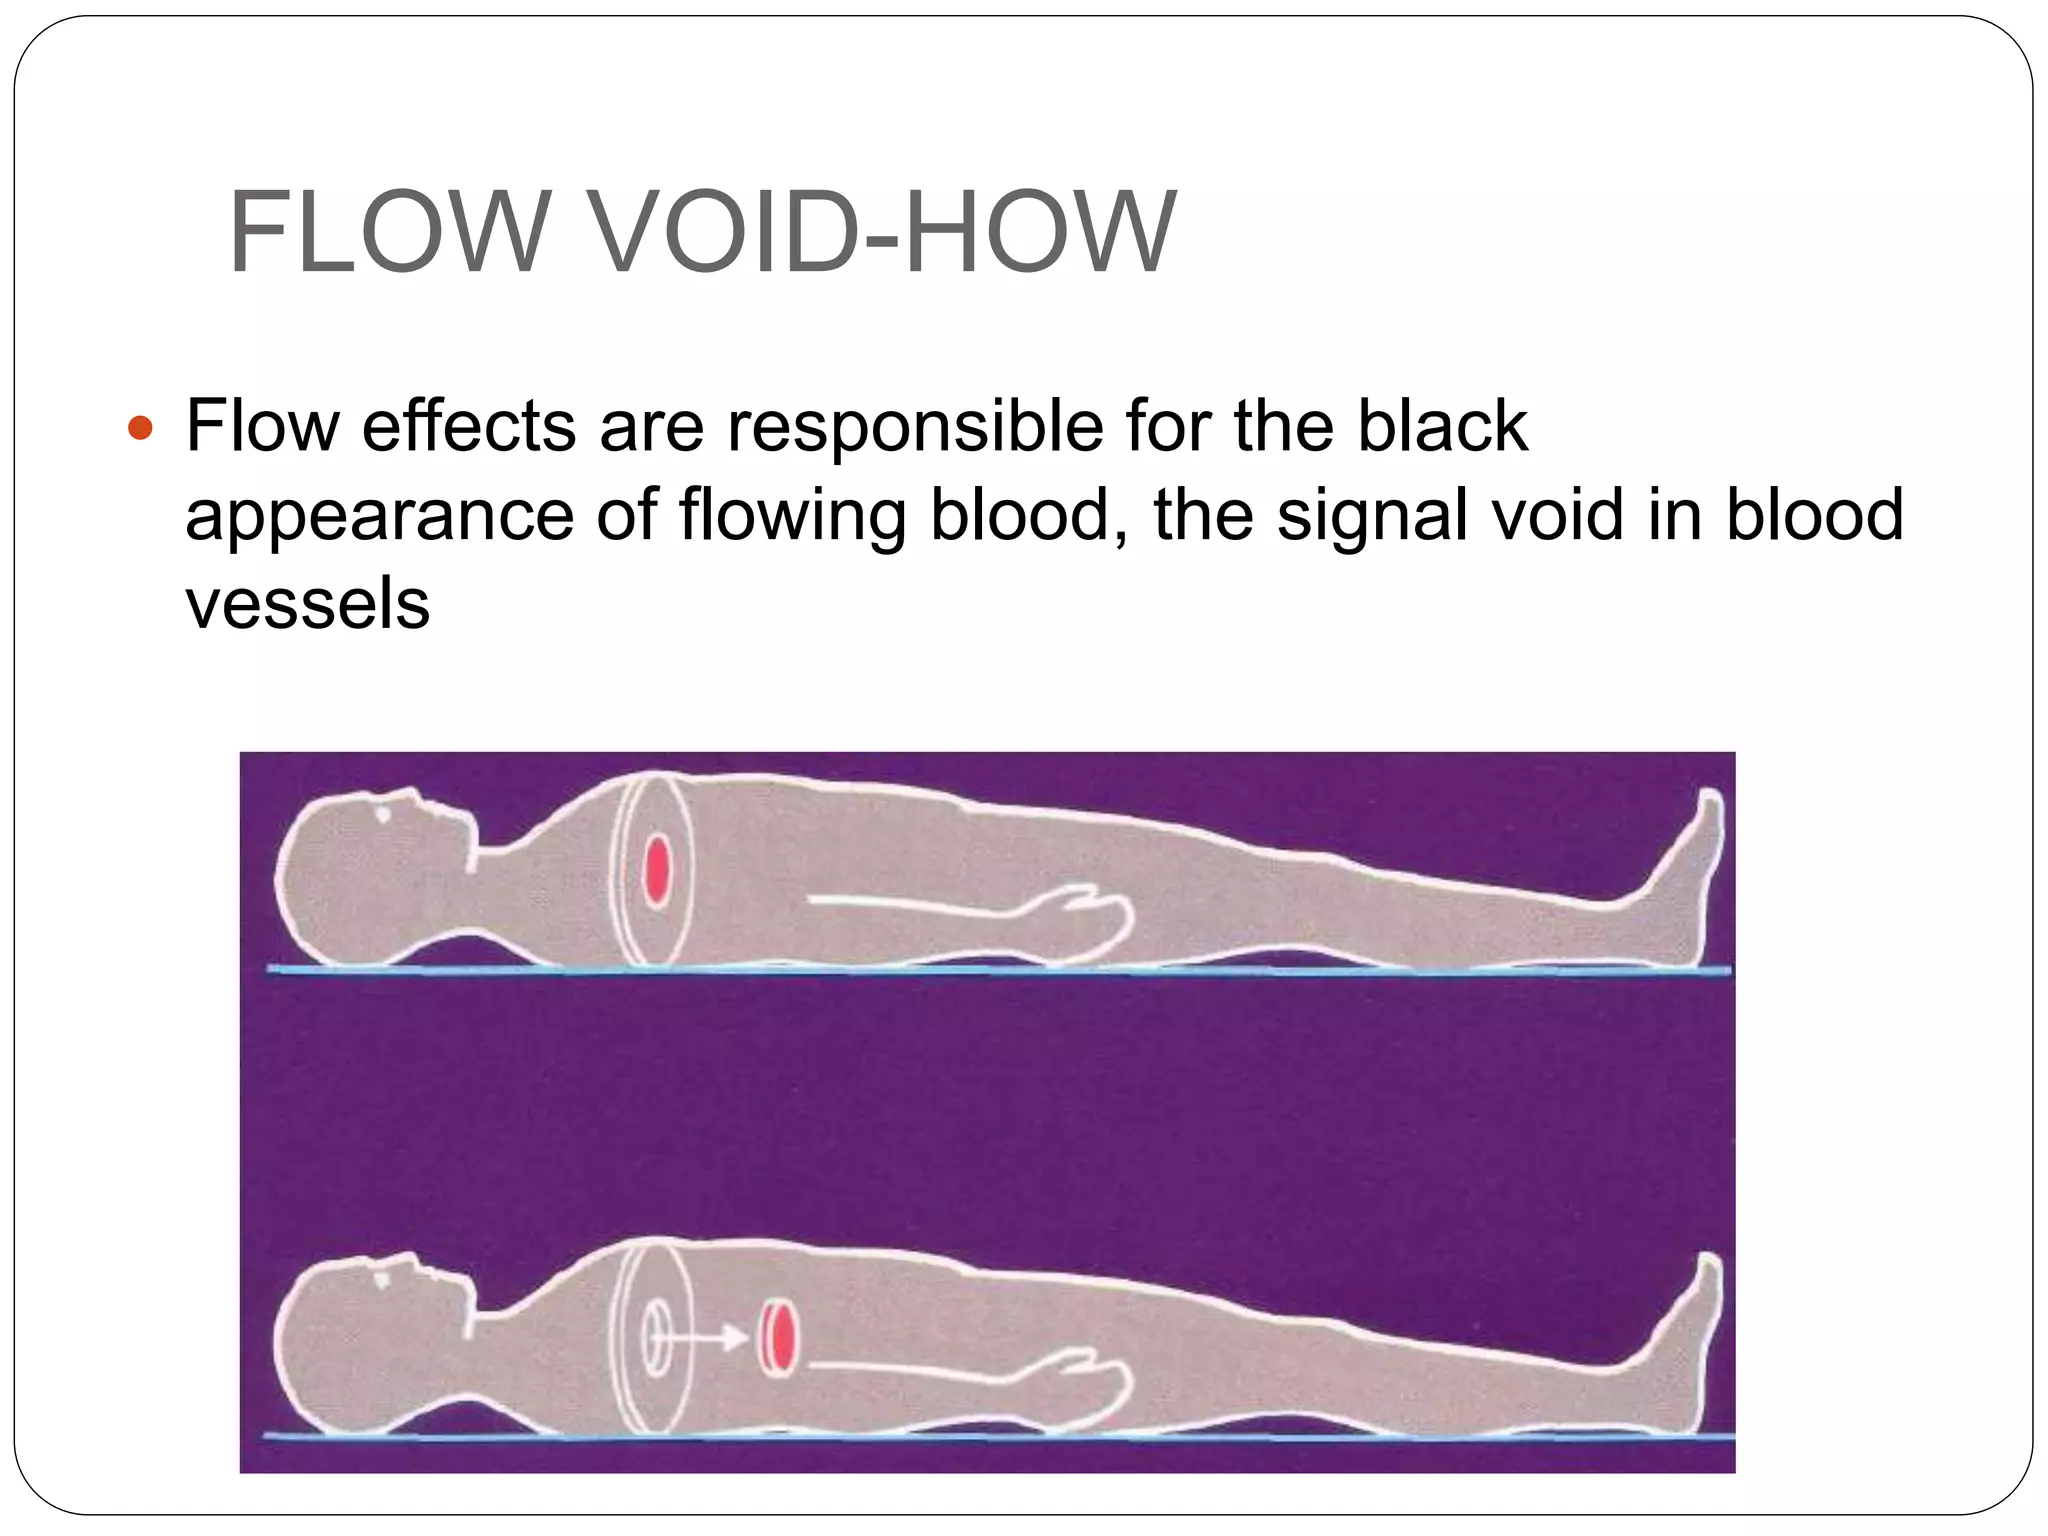
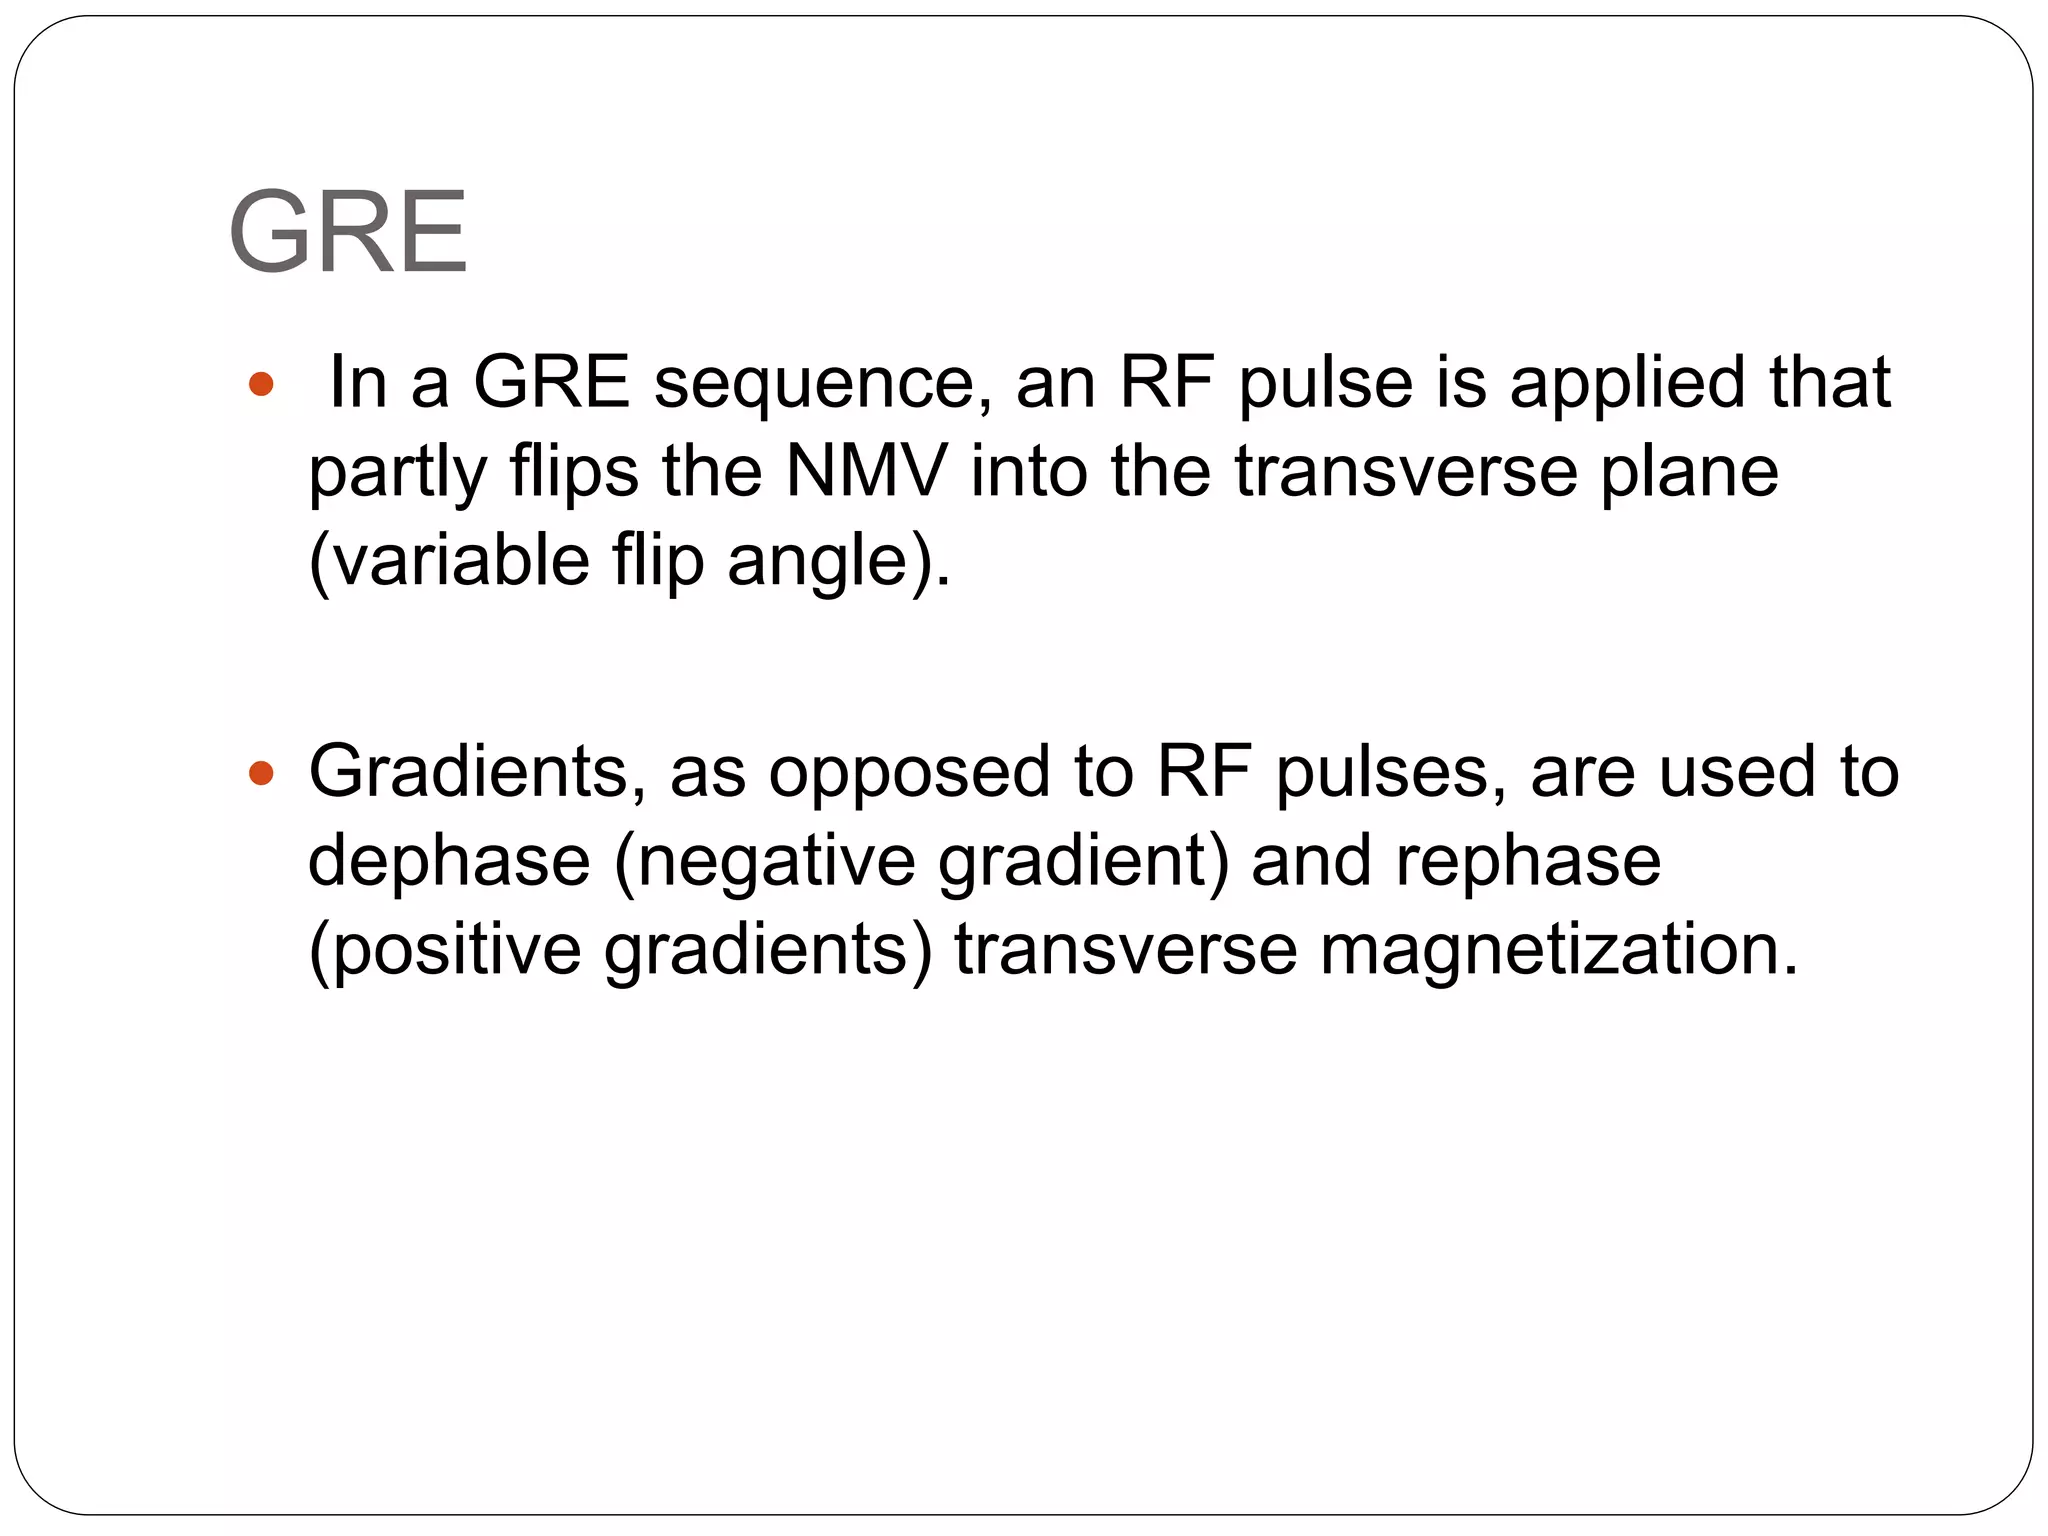
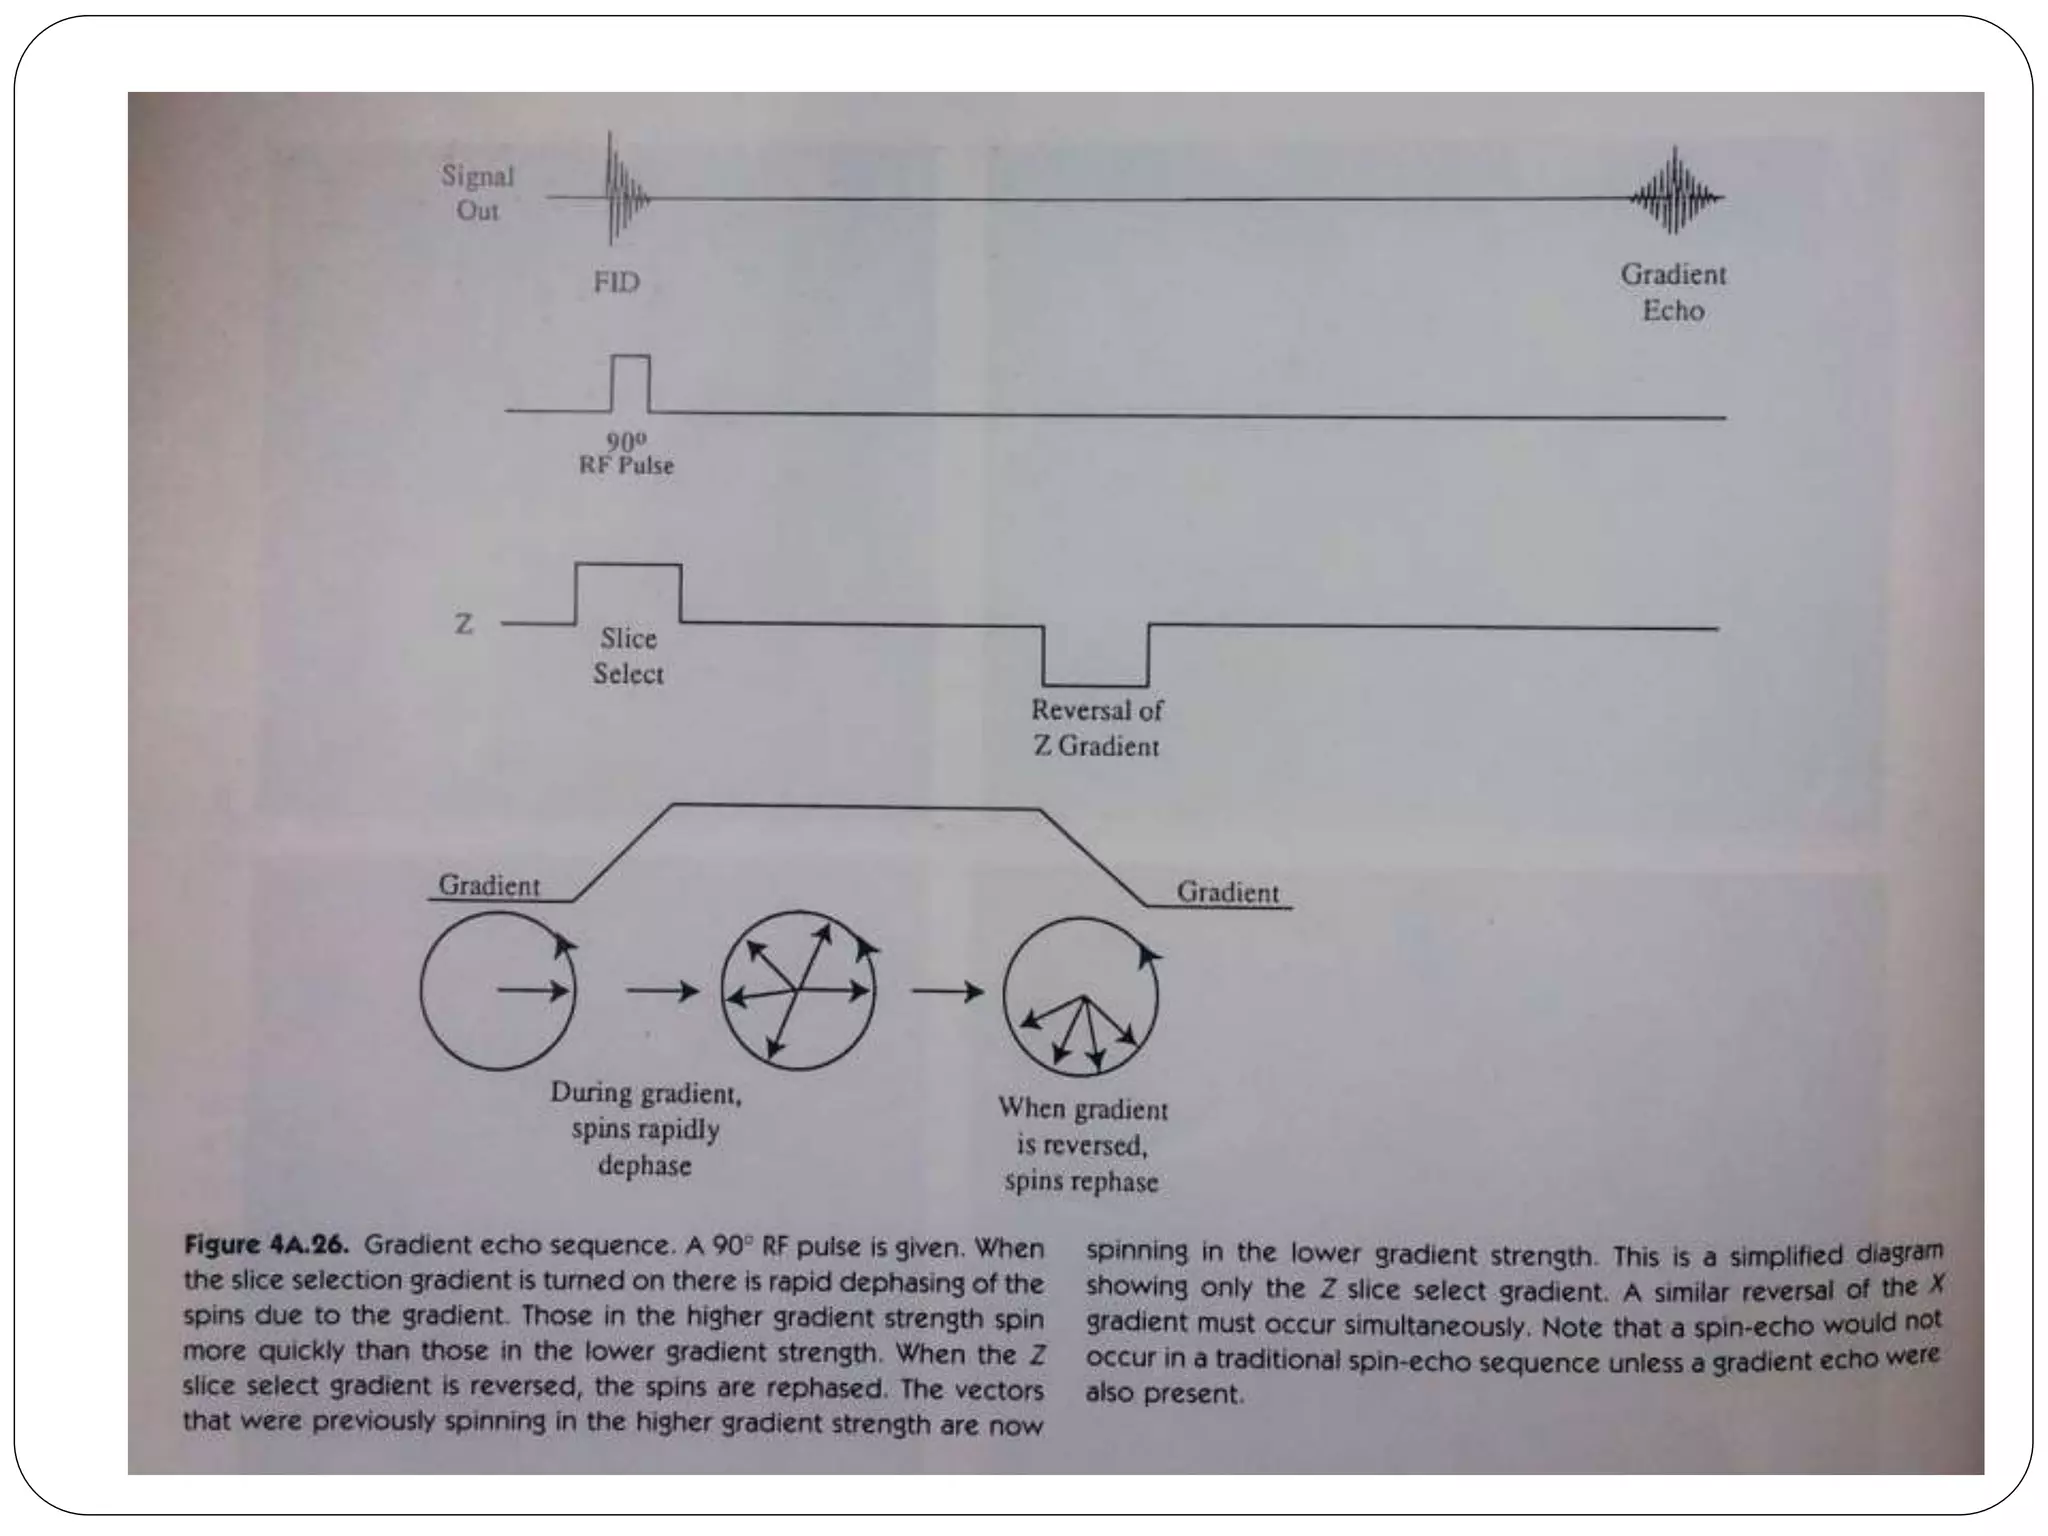
Details the use of various MR sequences in clinical evaluation. Discusses artifacts in MR imaging and their implications.
Thank you note from the presenter, concluding the educational session on MRI.
Nuclear magnetic resonance
âşDrIsidor Rabi (Nobel in 1944), discovered NMR
(Nuclear Magnetic Resonance) in the late 1930s, but
considered it to be an artefact of his apparatus
âşCJ Gorter, coined the term âNuclear Magnetic
Resonanceâ in 1942.
âşBloch and Purcell (Nobel Prize in 1952 )if Certain
nuclei are placed in magnetic field ,absorb energy in
electromagnetic spectrum and re emit energy when
regain their original position.
5.
MRI HARDWARE
ď Permanentmagnets
ď Resistive magnets: In a resistive magnet, an
electrical current is passed through a loop of wire
and generates a magnetic field.
ď Superconducting magnets: Superconducting
magnets are the ones most widely used in MR
machines at the present time. They also make
use of electricity, but they have a special current
carrying conductor.
ď This is cooled down to superconducting
temperature
(about 4° K or -269° C). At this temperature, the
current conducting material loses its resistance
for electricity.
6.
ď In MRIradio frequency coils are necessary to
send in the RF pulse to excite the protons, and to
receive the resulting signal. The same or different
coils can be used for transmission of the RF
pulse and receiving the signal.
MRI principle
ď MRIis based on the principle of nuclear magnetic
resonance (NMR)
ď Two basic principles of NMR:
1.Atoms with an odd number of protons or neutrons
have spin
2.A moving electric charge, be it positive or negative,
produces a magnetic field
10.
Protons
ď Protons possessa positive charge.
ď Like the earth they are constantly turning around
an axis and have their own magnetic field.
11.
Protons
ď Normally protonsare aligned in a random
fashion. This, however, changes when they are
exposed to a strong external magnetic field.
ď Then they are aligned in only two ways, either
parallel or antiparallel to the external magnetic
field
Precession Frequency
ď Tocalculate the precession frequency.
Larmor equation:
ď B0 = is the strength of the external magnetic field,
which is given in Tesla (T)
ď is the angular frequency, and âyâis the so-
called gyromagnetic ratio.
14.
EFFECT OF MAGNETICFIELD
ď The z-axis runs in the direction of the magnetic
field lines,
ď The five protons, which "point" down cancel out
the magnetic effects of the same number of
protons, which "point"up
15.
Radio Frequency (RF)
ďA short burst of some electromagnetic wave, which is
called a radio frequency (RF) pulse.
ď The purpose of this RF pulse is to disturb the protons,
which are peacefully precessing in alignment with the
external magnetic field.
ď Not every RF pulse disturbs the alignment of the protons.
For this, we need a special RF pulse, one that can
exchange energy with the protons.
ď Only when the RF pulse and the protons have the same
frequency, can protons can pick up some energy from the
radio wave, a phenomenon called Resonance.
16.
Longitudinal magnetization
ď thevectors along the z-axis point in the same
direction, and thus add up to a new magnetic sum
vector pointing up. As this magnetization is in
direction along/longitudinal to the external
magnetic field, it is also called longitudinal
magnetization
17.
EFFECT OF RFPULSE ON
MAGNETIZATION
ď The radiofrequency pulse exchanges energy with
the protons (a), and some of them are lifted to a
higher level of energy, pointing downward in the
illustration (b).
ď In effect the magnetization along the z-axis
decreases, as the protons which point down
"neutralize" the same number of protons pointing
up.
18.
Transversal Magnetization
ď Whenthe protons randomly point left/right, back/forth
and so on, they also cancel their magnetic forces in
these directions
ď The RF pulse synchronize them - "in phase". They
now point in the same direction at the same time, and
thus their magnetic vectors add up in this direction.
This results in a magnetic vector pointing to the side
to which the precessing protons point, and this is in a
transverse direction.
ď This is why it is called transversal magnetization.
19.
ď As thetransversal magnetic vector moves around
with the precessing protons, it comes towards the
antenna, goes away from it, comes towards it
again and so on, also with the precession
frequency.
ď The resulting MR signal therefore also has the
precession.
20.
Longitudinal and transversal
relaxation
ďThe newly established transverse magnetization
starts to disappear (a process called transversal
relaxation), and the longitudinal magnetization
grows back to its original size (a process called
longitudinal relaxation).
21.
Longitudinal/Spin lattice
relaxation
ď Afterthe RF pulse is switched off, protons go
back from their higher to the lower state of
energy, i.e. point up again.
ď This energy is just handed over to their
surroundings, the so called lattice. And this is why
this process is not only called longitudinal
relaxation, but also spin-lattice-relaxation
22.
T1-Curve
ď If oneplots the longitudinal magnetization vs.
time after the RF pulse was switched off, one gets
a so-called T1-curve.
23.
SPIN SPIN RELAXATION
ďAfter the RF pulse is switched off, protons lose
phase coherence, they get out of step thus
transversal magnetization decreases.
24.
ď Plot showingtransversal magnetization vs. time after
the RF pulse is switched off, one gets a curve as
illustrated,which is called a T2-curve.
25.
Characteristics of T1and T2
ď T1 is about 300 to 2000 msec, and T2 is about 30
to 150 msec.
ď It is difficult to pinpoint the end of the longitudinal
and transversal relaxation exactly.
ď T1 =63% of the original longitudinal
magnetization is reached.
ď T2 =37% of the original value,T1 is longer than
T2
ď T1 varies with the magnetic field strength; it is
longer in stronger magnetic fields.
26.
90°pulse
ď If afterthe RF pulse, the number of protons on
the higher energy level equals the number of
protons on the lower energy level, longitudinal
magnetization disappears, and there is only
transversal magnetization due to phase
coherence.
ď The magnetic vector seems to have been "tiltedâ
90° to the side. The corresponding RF pulse is
thus also called a 90° pulse
27.
TE vs TR
ď⢠TE: the time between the 90° pulse and the
echo.
ď ⢠TR: the time between two pulse sequences, i.e.
from one 90° pulse to the next.
ď A andB are two tissues with different relaxation
times.
ď Frame 0 shows the situation before, frame 1
immediately after a 90° pulse.
ď When we wait for a long time (TRlong) the
longitudinal magnetization of both tissues will
have totally recovered (frame 5).
ď A second 90° pulse after this time results in the
same amount of transversal magnetization
(frame 6) for both tissues, as was observed
30.
ď When wedo not wait as long , but send in the
second RF pulse after a shorter time (TRShort),
longitudinal magnetization of tissue B, which has
the longer T1, has not recovered as much as that
of tissue A with the shorter T1.
ď The transversal magnetization of the two tissues
after the second RF pulse will then be different
(frame 5). Thus, by changing the time between
successive RF pulses, we can influence and
modify magnetization and the signal intensity of
31.
TR AND SIGNALINTENSITY
ď Brain has a shorter longitudinal relaxation time
than CSF.
ď With a short TR the signal intensities of brain and
CSF differ more than after a long TR.
32.
T2*/T2effect/spin echo sequence
ďAfter the RF pulse is switched off, the protons
dephase (a-c).
ď The 180°pulse causes them to precess in the
opposite direction and so they rephase again (d-f).
33.
T2* curve
ď The180° pulse refocusses the dephasing protons which results in a
stronger signal, the spin echo after the time TE.
ď The protons then dephase again and can be refocussed another time
by a 180° pulse and so on. Thus it is possible to obtain more than
one signal, more than one spin echo.
ď The spin echoes, however, differ in intensity due to so-called T2-
effects.
ď A curve connecting the spin echo intensities is the T2 curve. If we did
not use the 180° pulse, the signal intensity would decay much faster.
A curve describing the signal intensity in that case is the T*2 (T2
star) curve, The type of pulse
sequence,
that we used in our
experiment, is called a
spin echo sequence,
consisting of a 90°
pulse and a 180°
pulse
34.
ď T2-curves fortwo tissues with different
transversal relaxation times; tissue A has a
shorter T2 than tissue B, thus loses transversal
magnetization faster.
ď With a short TE (TEshort) the difference in signal
intensity is less pronounced than after a longer
TE (TElong).
35.
Short vs LongTE/TR
ď A TR of less than 500 msec is considered to be
short, a TR of more than 1500 msec to be long
ď A short TE is one that is as short as possible, a
long TE also is about 3 times as long.
ď A TE of less than 30 msec is considered to be
short, a TE greater than 80 msec to be long.
36.
spin echo pulse
sequence
ď1. (90° - TE/2 -180° - TE/2 -> record signal at TE)
ď after TR (time from the beginning of one 90°
pulse to the next 90° pulse) follows another pulse
cycle and signal b measurement:
ď 2. (90° - TE/2 -180° - TE/2 -> record signal at TE)
37.
EFFECT OF TR/TEON IMAGE
ď By combining T1- and T2-curves signal intensity of certain
tissues can be determined for a pulse sequence using TR and
TE as illustrated.
ď With a long TR, differences in T1, in longitudinal magnetization
time are not very important any more, as all tissues have
regained their full longitudinal magnetization.
ď When we only wait a very short TE then differences in signal
intensity due to differences in T2 have not yet had time to
become pronounced.
ď The resulting picture is thus neither T1- nor T2-weighted, but
mostly determined by the proton density of the tissues (for this,
ideally TE should be zero).
38.
T2-weighted picture
ď Whenwe wait a long TR and a long TE, differences
in T2 have had time enough to become pronounced,
the resulting picture is T2-weighted
39.
T1-weighted picture
ď Whenwe wait a shorter time TR, differences in T1
influence tissue contrast to a larger extent, the picture is
T1-weighted, especially when we also wait a short TE
(when signal differences due to differing T2s have not
had time to become pronounced)
40.
ď T2-curves ofdifferent tissues can intersect. The signal intensity of
the tissues is reversed choosing a TE beyond the crossing point
(TEC): before this crossing point (e.g. at TE1) tissue A has a higher
signal intensity than tissue B.
ď This means that image contrast is still determined by differences in
T1: the tissue A with the shorter T1 has the stronger signal intensity.
ď At TEC both tissues have the same signal intensity, and thus cannot
be differentiated.
ď After the crossing point (e.g. at TE2) the relative signal intensities are
reversed, and tissue B has the stronger signal
Useful for: Evaluating
anatomicdetail
CSF: Dark
White Matter: White
Gray Matter: Gray
Vessels: Dark
Useful for: Looking at areas of
edema & pathology
CSF: Bright
White Matter: Gray
Gray Matter: Lighter than white
matter
Vessels: Dark
44.
T1 Recovery
Short TRď T1 contrast
(T1 Weighted)
ď TR 300-600 ms
ď TE 10-30 ms
45.
Bright on T1
ďFat, subacute hemorrhage, melanin, protein rich fluid.
ď Slowly flowing blood
ď Paramagnetic substances(gadolinium,copper,manganese)
ď 9
46.
Dark on T1
ďEdema, tumor, infection, inflammation,
hemorrhage(hyperacute, chronic)
ď Low proton density, calcification
ď Flow void
47.
T2 Decay
Long TEď T2 contrast
(T2 Weighted)
ď TR 2000 ms
ď TE 70 ms
48.
Bright on T2
ďEdema, tumor, Infection, inflammation, subdural
collection
ď Met hemoglobin in late sub acute hemorrhage
49.
Dark on T2
ďLow proton density,calcification,fibrous tissue
ď Paramagnetic substances(deoxy
hemoglobin,methemoglobin(intracellular),ferritin,h
emosiderin,melanin.
ď Protein rich fluid
ď Flow void
50.
Which scan bestdefines the
abnormality
ď T1 W Images:
ď Subacute Hemorrhage
ď Fat-containing structures
ď Anatomical Details
ď T2 W Images:
ď Edema
ď Demyelination
ď Infarction
ď Chronic Hemorrhage
ď FLAIR Images:
ď Edema,
ď Demyelination
ď Infarction esp. in Periventricular location
51.
Infarct
ď Acute :T1W âIsointense hypo intense
T2W-Hyper intense
ď Sub acute: T1W-Low signal,increasedsignal in
peripheral region..hemorrhage(metHb)
T2W- High signal
ď Chronic:T1W-low signal
T2W-High siignal
FLOW VOID-HOW
ď Floweffects are responsible for the black
appearance of flowing blood, the signal void in blood
vessels
54.
ď Paramagnetic substances
likeGadolinium shorten
the T1 and the T2 of their
surroundings.
ď The respective T1- and
T2-curves are shifted
towards the left.
ď In effect, that means that
for a certain TR there is
more, for a certain TE
there is less signal
EFFECT OF CONTRAST MATERIAL
55.
When tissue Aand B has less
contrast:
ď T1-curves for tissue A and B are
very close to each other,
resulting in only a small
difference in signal intensity
between the tissues at TR.
ď NOW- the T1-curve of tissue A
is shifted to the left, as contrast
agent entered tissue A but not
tissue B. At the same time TR
there now is a much greater
difference in signal intensity, i.e.
tissue contrast
56.
The inversion recovery
sequence
ďThe inversion recovery sequence uses a 180° pulse which
inverts the longitudinal magnetization, followed by a 90° pulse
after the time TI.
ď The 90° pulse "tiltsâ the magnetization into the transversal (x-y-)
plane, so it can be measured/received.
ď The tissue in the bottom row goes back to its original longitudinal
magnetization faster, thus has the shorter T1.
ď For the time TI, which is illustrated, this results in less transversal
magnetization after the 90° pulse
ď Substances having
bothLONG T1 and
T2 will be bright.
ď T1 and T2 of most
pathologic lesion
are prolonged.
ď And substances
with short T1 will be
suppressed eg.
hemorrhage, gd-
enhancement.
59.
Fluid-attenuated inversion recovery
(FLAIR)
ďFirst described in 1992 and has become one of
the corner stones of brain MR imaging protocols
ď An IR sequence with a long TR and TE and an
inversion time (TI) that is tailored to null the signal
from CSF
61.
ď Water boundto complex molecule with in plaque
has relatively shorter T1 than free water with in
ventricle.
ď Long inversion time effectively suppress free
water eg./csf.
ď Lesion that contain complex, partially bound
water (less mobile)âŚshorter T1 than free water
appears bright.
ď Effective in high lightening lesion eg
demyelination, stroke, Ischemic gliosis and
tumor.
62.
ď Useful indiffrentiating acute infarct from cystic
encephalomalacia
ď Useful in SAH âŚremoves CSF signal
GRE
ď In aGRE sequence, an RF pulse is applied that
partly flips the NMV into the transverse plane
(variable flip angle).
ď Gradients, as opposed to RF pulses, are used to
dephase (negative gradient) and rephase
(positive gradients) transverse magnetization.
66.
ď GRE Sequencescontd:
ď This feature of GRE sequences is exploited- in
detection of hemorrhage, as the iron in Hb becomes
magnetized locally (produces its own local magnetic
field) and thus dephases the spinning nuclei.
ď The technique is particularly helpful for diagnosing
hemorrhagic contusions such as those in the brain .
Diffusion-weighted MRI
ď DWIimages is obtained by applying pairs of
opposing and balanced magnetic field gradients (but
of differing durations and amplitudes) around a spin-
echo refocusing pulse of a T2 weighted sequence.
ď Stationary water molecules are unaffected by the
paired gradients, and thus retain their signal.
ď Non stationary water molecules acquire phase
information from the first gradient, but are not re
phased by the second gradient, leading to an overall
loss of the MR signal
70.
ď The normalmotion of water molecules within living
tissues is random (brownian motion).
ď In acute stroke, there is an alteration of
homeostasis
ď Acute stroke causes excess intracellular water
accumulation, or cytotoxic edema, with an overall
decreased rate of water molecular diffusion within
the affected tissue.
ď Tissues with a higher rate of diffusion undergo a
greater loss of signal in a given period of time than
do tissues with a lower diffusion rate.
ď Therefore, areas of cytotoxic edema, in which the
motion of water molecules is restricted, appear
brighter on diffusion-weighted images because of
lesser signal losses
72.
Apparent Diffusion Coefficient
ďCalculated by acquiring two or more images with
a different gradient duration and amplitude .
ď To differentiate T2 shine through effects or
artifacts from real ischemic lesions.
73.
ADC
ď useful forestimating the lesion age and
distinguishing acute from subacute DWI lesions.
ď Acute ischemic lesions can be divided into
ď 1- hyperacute lesions (low ADC and DWI-
positive)
ď 2-subacute lesions (normalized ADC).
ď 3-Chronic lesions can be differentiated from
acute lesions by normalization of ADC and DWI.
74.
Nonischemic causes fordecreased
ADC
ď Abscess
ď Lymphoma and other tumors
ď Multiple sclerosis
ď Seizures
ď Metabolic (Canavans )
75.
Evaluation of acutestroke on DWI
ď The DWI and ADC maps show changes in
ischemic brain within minutes to few hours
ď The signal intensity of acute stroke on DW
images increase during the first week after
symptom onset and decrease thereafter, but
signal remains hyper intense for a long period
(up to 72 days in the study by Lausberg et al)
ď The ADC values decline rapidly after the onset
of ischemia and subsequently increase from
dark to bright 7-10 days later .
76.
ď This propertymay be used to differentiate the
lesion older than 10 days from more acute ones .
ď Chronic infarcts are characterized by elevated
diffusion and appear hypo, iso or hyper intense
on DW images and hyperintense on ADC maps
78.
DW MR imagingcharacteristics of Various Disease Entities
MR Signal Intensity
Disease DW Image ADC Image ADC Cause
Acute Stroke High Low Restricted Cytotoxic edema
Chronic Strokes Variable High Elevated Gliosis
Hypertensive
encephalopathy
Variable High Elevated Vasogenic edema
Arachnoid cyst Low High Elevated Free water
Epidermoid mass High Low Restricted Cellular tumor
Herpes encephalitis High Low Restricted Cytotoxic edema
CJD High Low Restricted Cytotoxic edema
MS acute lesions Variable High Elevated Vasogenic edema
Chronic lesions Variable High Elevated Gliosis
79.
Slice selection andthickness
ď There are two ways to determine slice
thickness.
(a). By using certain bandwidth of RF pulse
eg. If frequencies between 64 and 65 mHz,
protons in slice 1 will be influenced by the
RF pulse.
ď When the RF pulse only contains
frequencies between 64 mHz and 64.5
mHz, thus has a smaller bandwidth, slice 2,
which is half as thick as slice 1 will be
imaged.
ď When there is more difference in magnetic
field strength between the level of the feet
and the head, i.e. The magnetic gradient is
steeper, the resulting slice will be thinner,
even though the RF pulse bandwidth is the
same.
THE IMAGING PLANES
-Axial plane: Transverse images represent
"slices" of the body
- Sagittal plane: Images taken
perpendicular to the axial plane which
separate the left and right sides (lateral
view)
- Coronal plane: Images taken
perpendicular to the sagittal plane which
separate the front from the back. (frontal
view)
82.
How do youdescribe abnormalities
on MR?
Hyperintense (more intense): If an abnormality is bright (white) on MR,
we describe it as hyperintense.
Isointense (the same intensity): If an abnormality is the same intensity
to a reference structure, we describe it as isointense.
Hypointense (less intense): If an abnormality is dark on MR .
83.
IT IS CTOR MRI?
CT: Computed Tomography MRI: Magnetic Resonance Imaging
Imaging Plane: in the axial
plane. The axial data set can then be
used to reconstruct images in other
planes, sagittal and coronal are the
most common.
Windows: "brain window" AND âbone
window â
White and Black:air within the
sinuses is black, the brain
parenchyma has a gray appearance
and the skull is bright white
Imaging Plane: in any plane, not just
axial
Sequences: different type of image
is referred to a sequence.
White and Black:same structure
may be bright or dark depending on
the type of sequence; CSF for
example is bright on T2, but dark on
T1. The tissue and imaging
characteristics are a lot more
complicated than CT.
84.
Types of MRImages
Useful for: Evaluating anatomic
detail
CSF: Dark
White Matter: White
Gray Matter: Gray
Vessels: Dark
Useful for: Evaluating for BBB breakdown
in the setting of tumor, infection, MS etc.
CSF: Dark
White Matter: White
Gray Matter: Gray
Vessels: Brigh
85.
Useful for: Lookingat areas of edema &
pathology
CSF: Bright
White Matter: Gray
Gray Matter: Lighter than white matter
Vessels: Dark
Useful for: Evaluating areas of edema with
CSF subtraction. Edema stands out
because is CSF dark
CSF: Dark
White Matter: Gray
Gray Matter: Lighter than white matter
Vessels: Dark
86.
Useful for: strokeimaging, abscess,
cellular tumors
CSF: Dark
White Matter: Gray
Gray Matter: Lighter than white matter
Fuzzier image than FLAIR
T2* (T2-star, or SWI)
Form of T2-weighted image which is
susceptible to iron or calcium
Blood, bone, calcium appear dark
Area of blood often appears much larger
than reality(âbloomingâ)
Useful for: Identification of early
hemorrhage
Look for: DARK only
Recognition:
o Like T2 except
o Cranium, scalp are dark or absent
o Dark areas near frontal and temporal
bones
87.
Apparent Diffusion Coefficient(ADC
Map)
Contains actual data relevant to diffusion
image
Areas of restricted diffusion are dark
Useful for:
o Excluding T2-shine through
o Real restricted diffusion is bright on DWI,
dark
on ADC
Look for: DARK only
Recognition
o Images marked ADC
o Grainy dark images
88.
MR ARTIFACTS
Artifacts inMR images refer to pixels that do not faithfully represent the
anatomy being studied.
1 Motion Artifacts- Motion artifacts occur as a result of movement of
tissue during the data acquisition period.
2.Sequence/Protocol-Related Artifacts- results from the specific
measurement process
used to acquire the image.
subtypes
2a. Aliasing
2b. Chemical Shift Artifacts
2c. Phase Cancellation Artifact
2d. Truncation Artifacts
2e. Coherence Artifacts
2f. Magnetic-Susceptibility Difference Artifacts
3. External Artifacts. External artifacts are generated from sources
other than patient tissue.
3a. Magnetic Field Distortions
3b. Measurement Hardware
3c. Noise
89.
refrences
1.MRI: Basic Principlesand Applications, Third Edition, by M. A. Brown
and R. C. Semelka.ISBN 0-471-43310-1 Š 2003 John Wiley & Sons,
Inc.
2.Schering: MRI made easy,by Hans H. Schild Nationales Druckhaus
Berlin.ISBN 3-921817-41-
3. Bradleyâs text book of neurology-6th edition
4.Robert A Ziemarmanâs Neuroimaging clinical and physical principle.
5. https://sites.google.com/a/wisc.edu/neuroradiology/image-
acquisition/the-basics