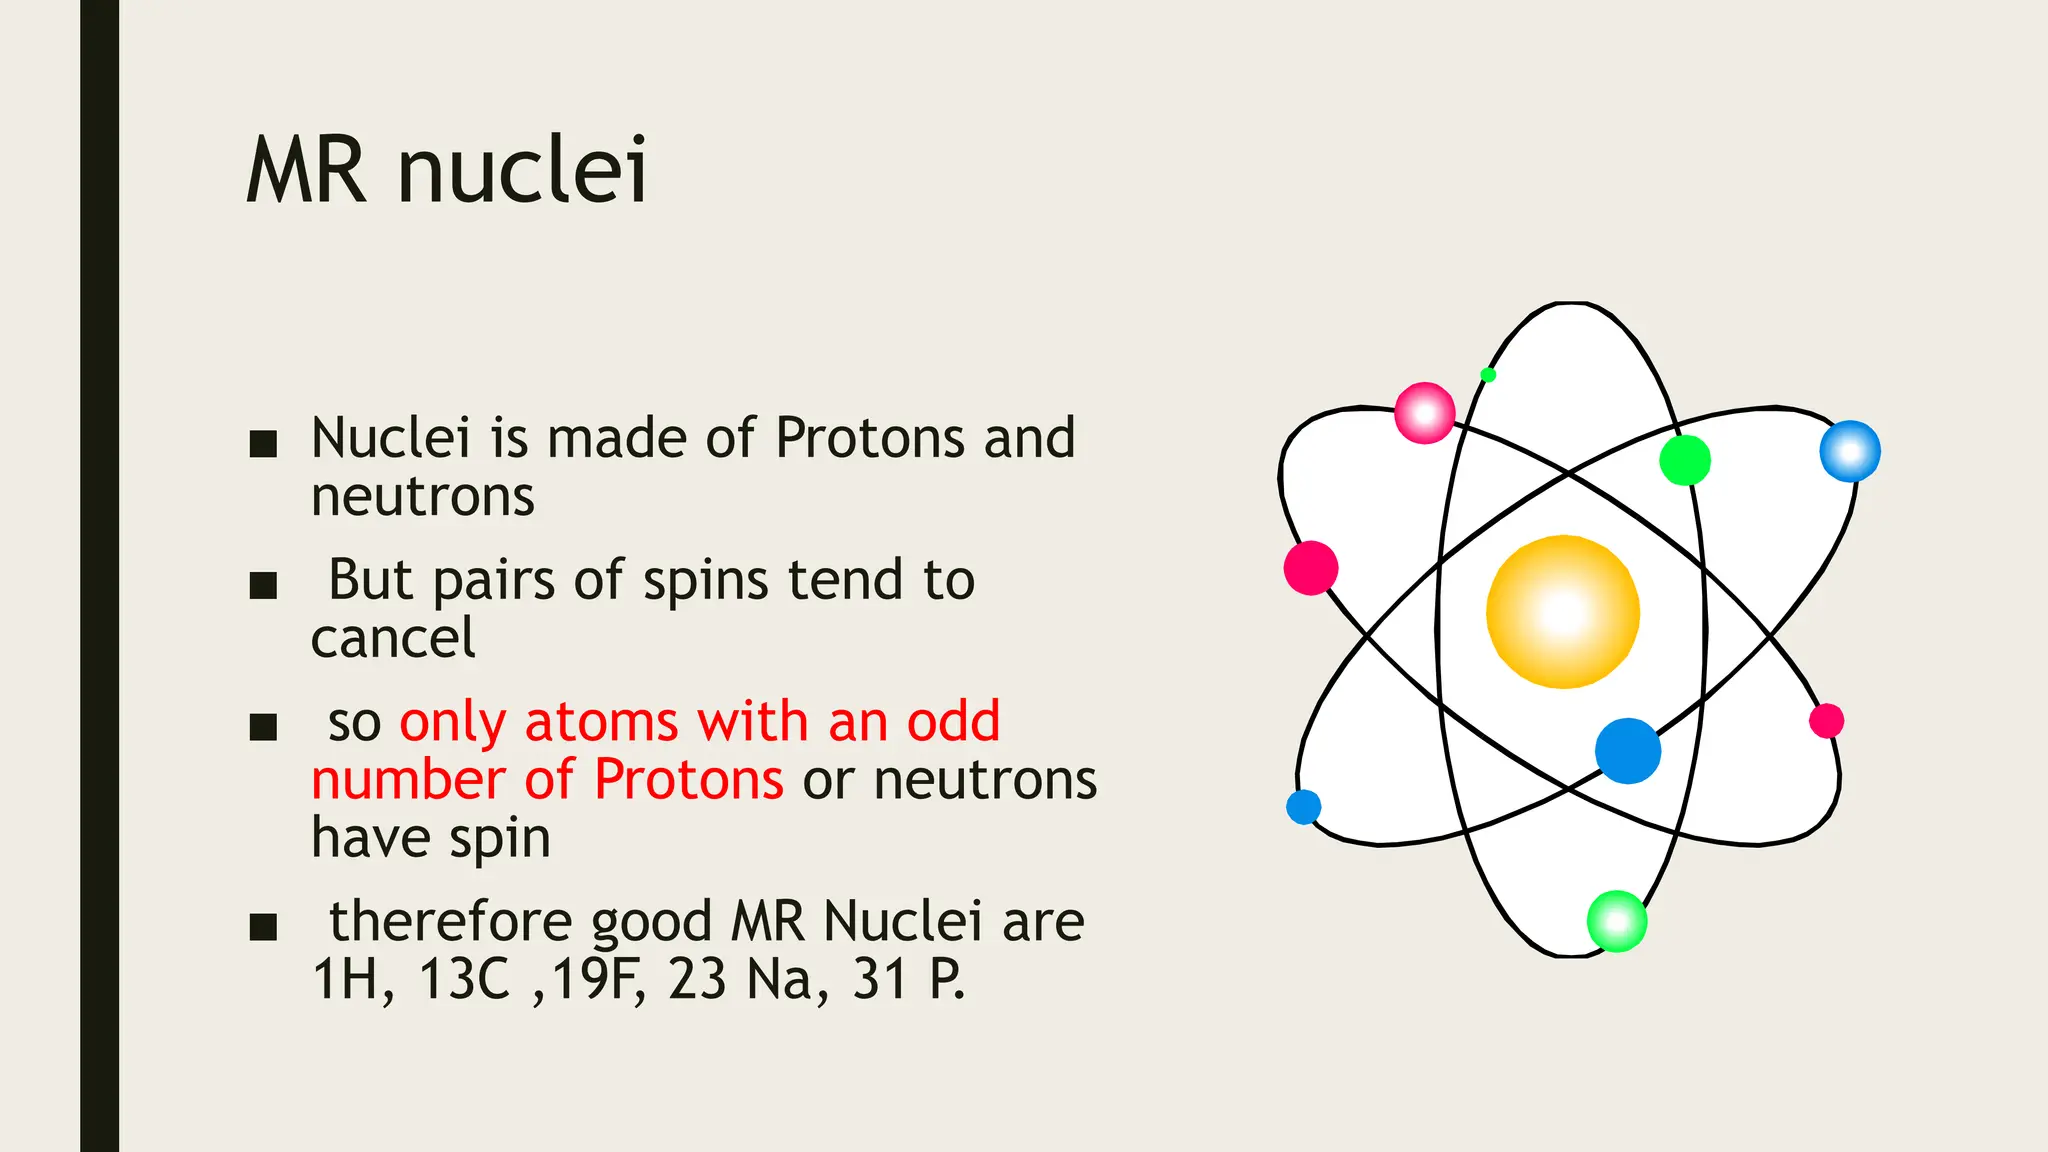
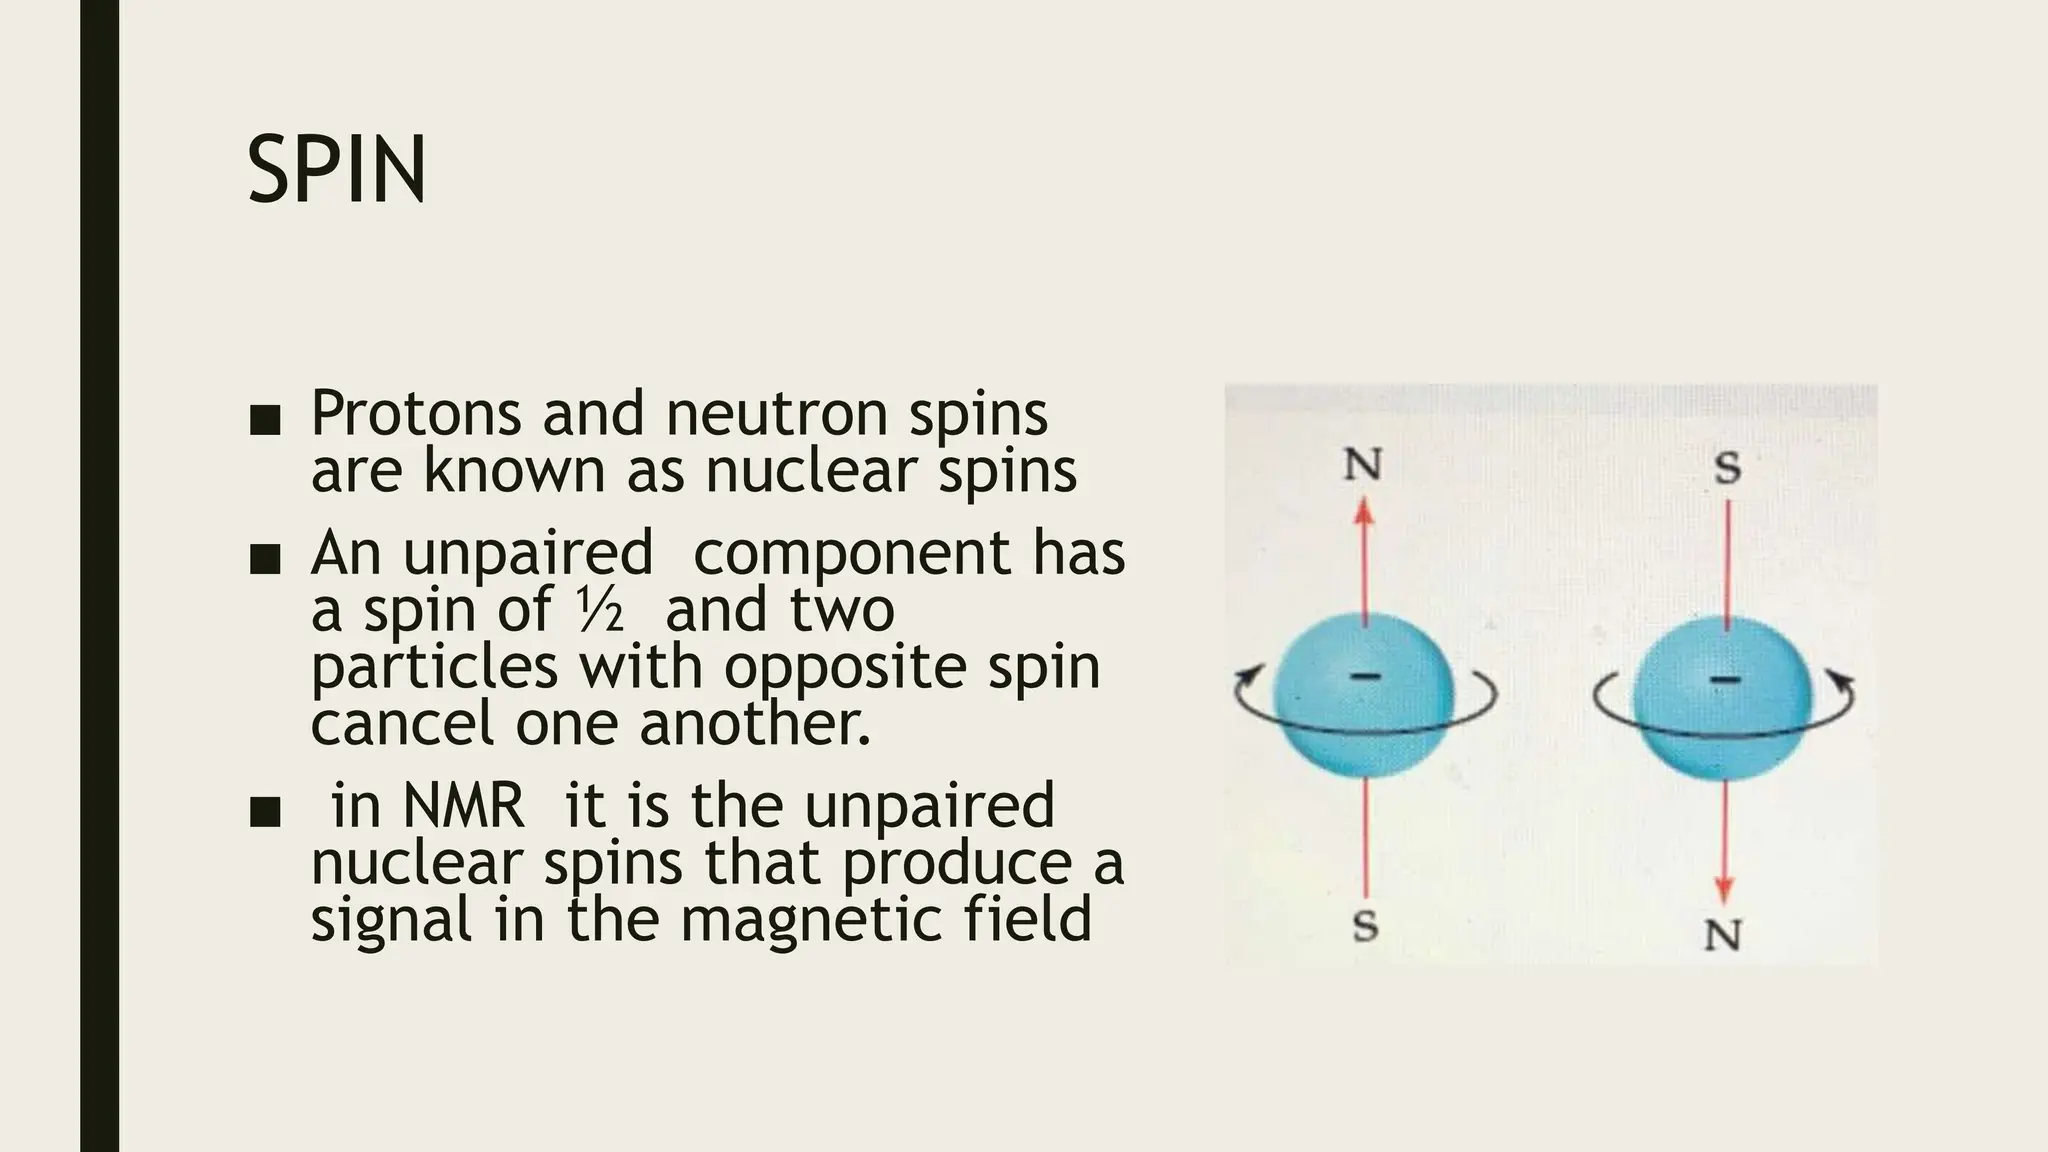
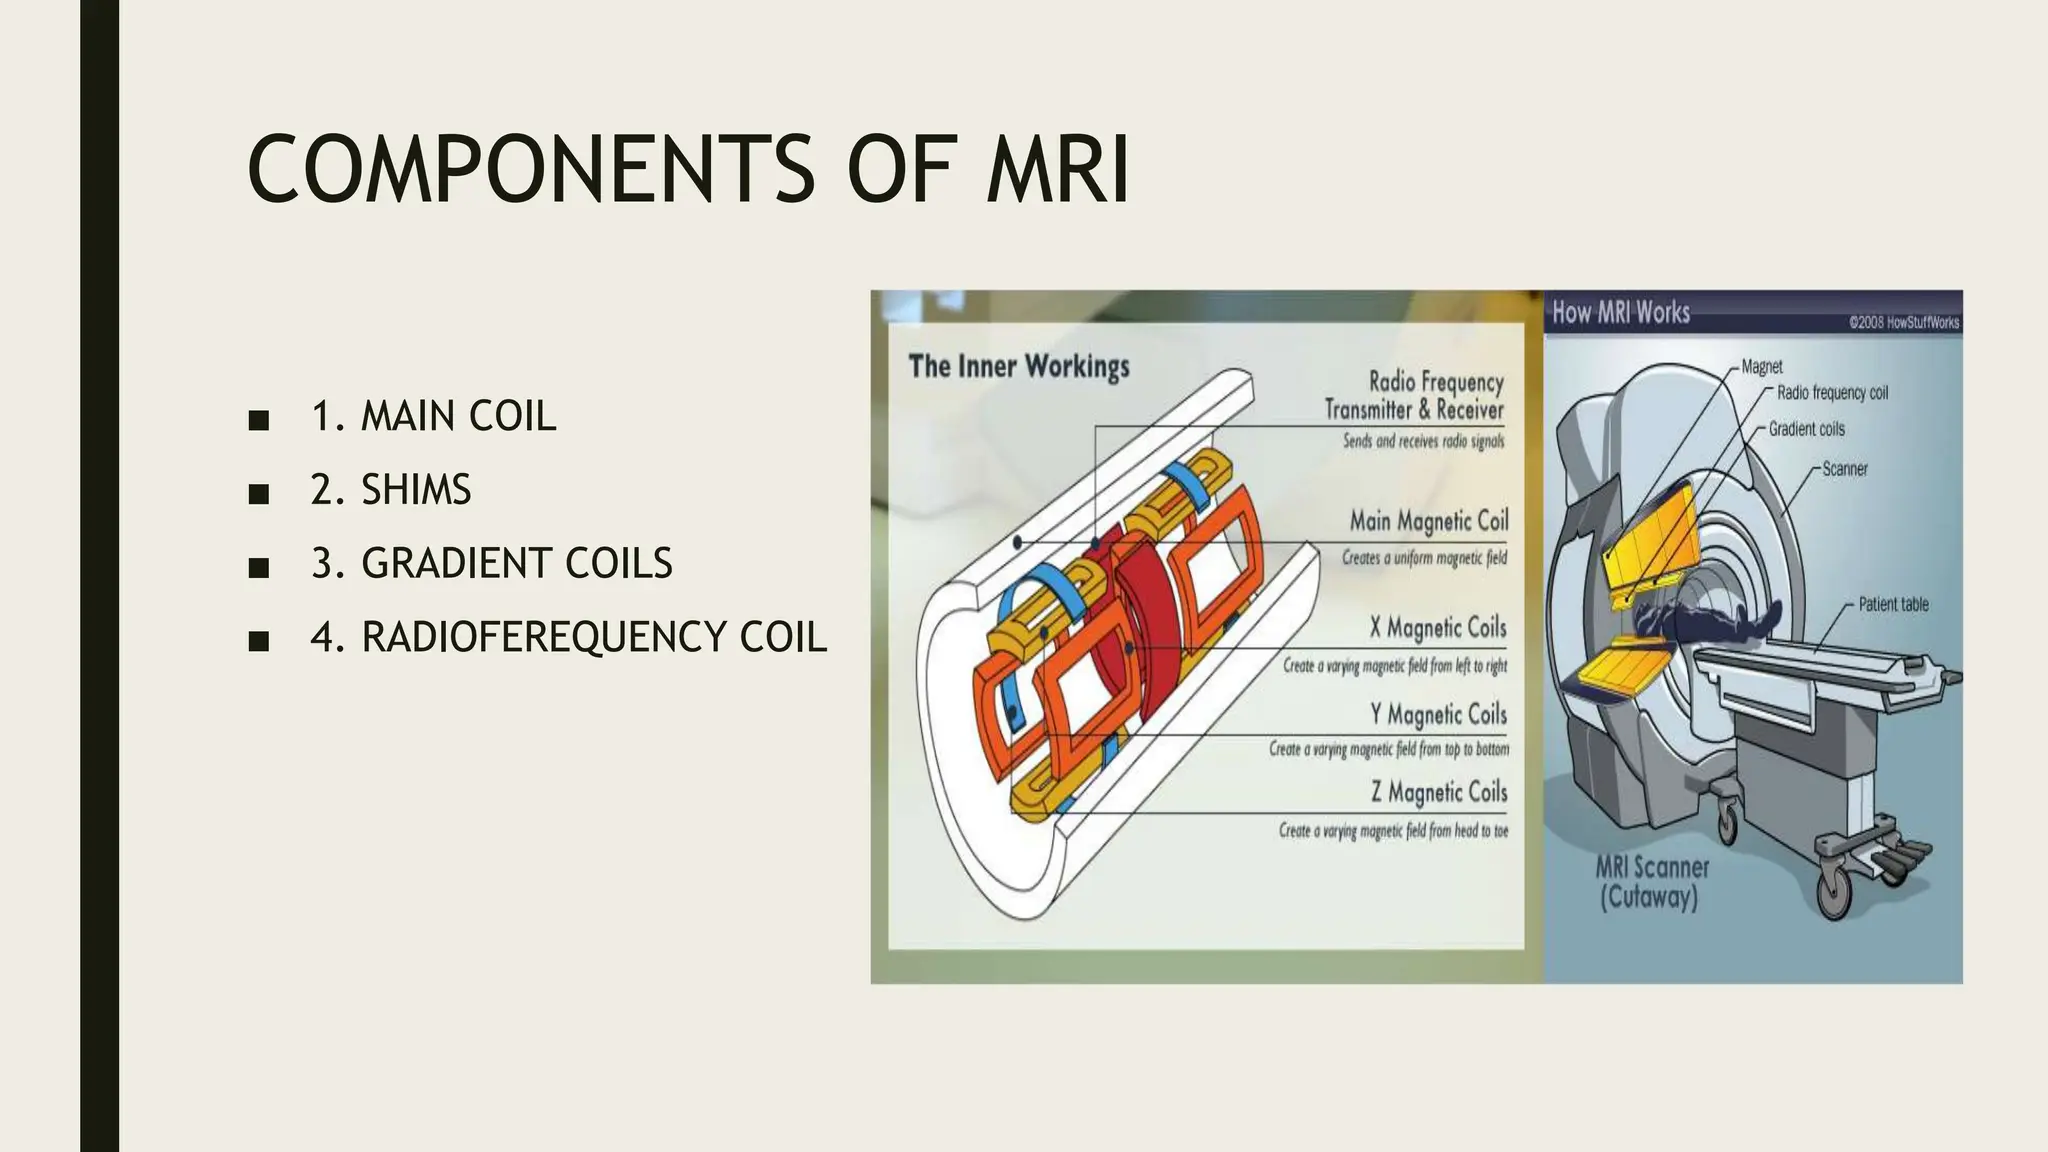
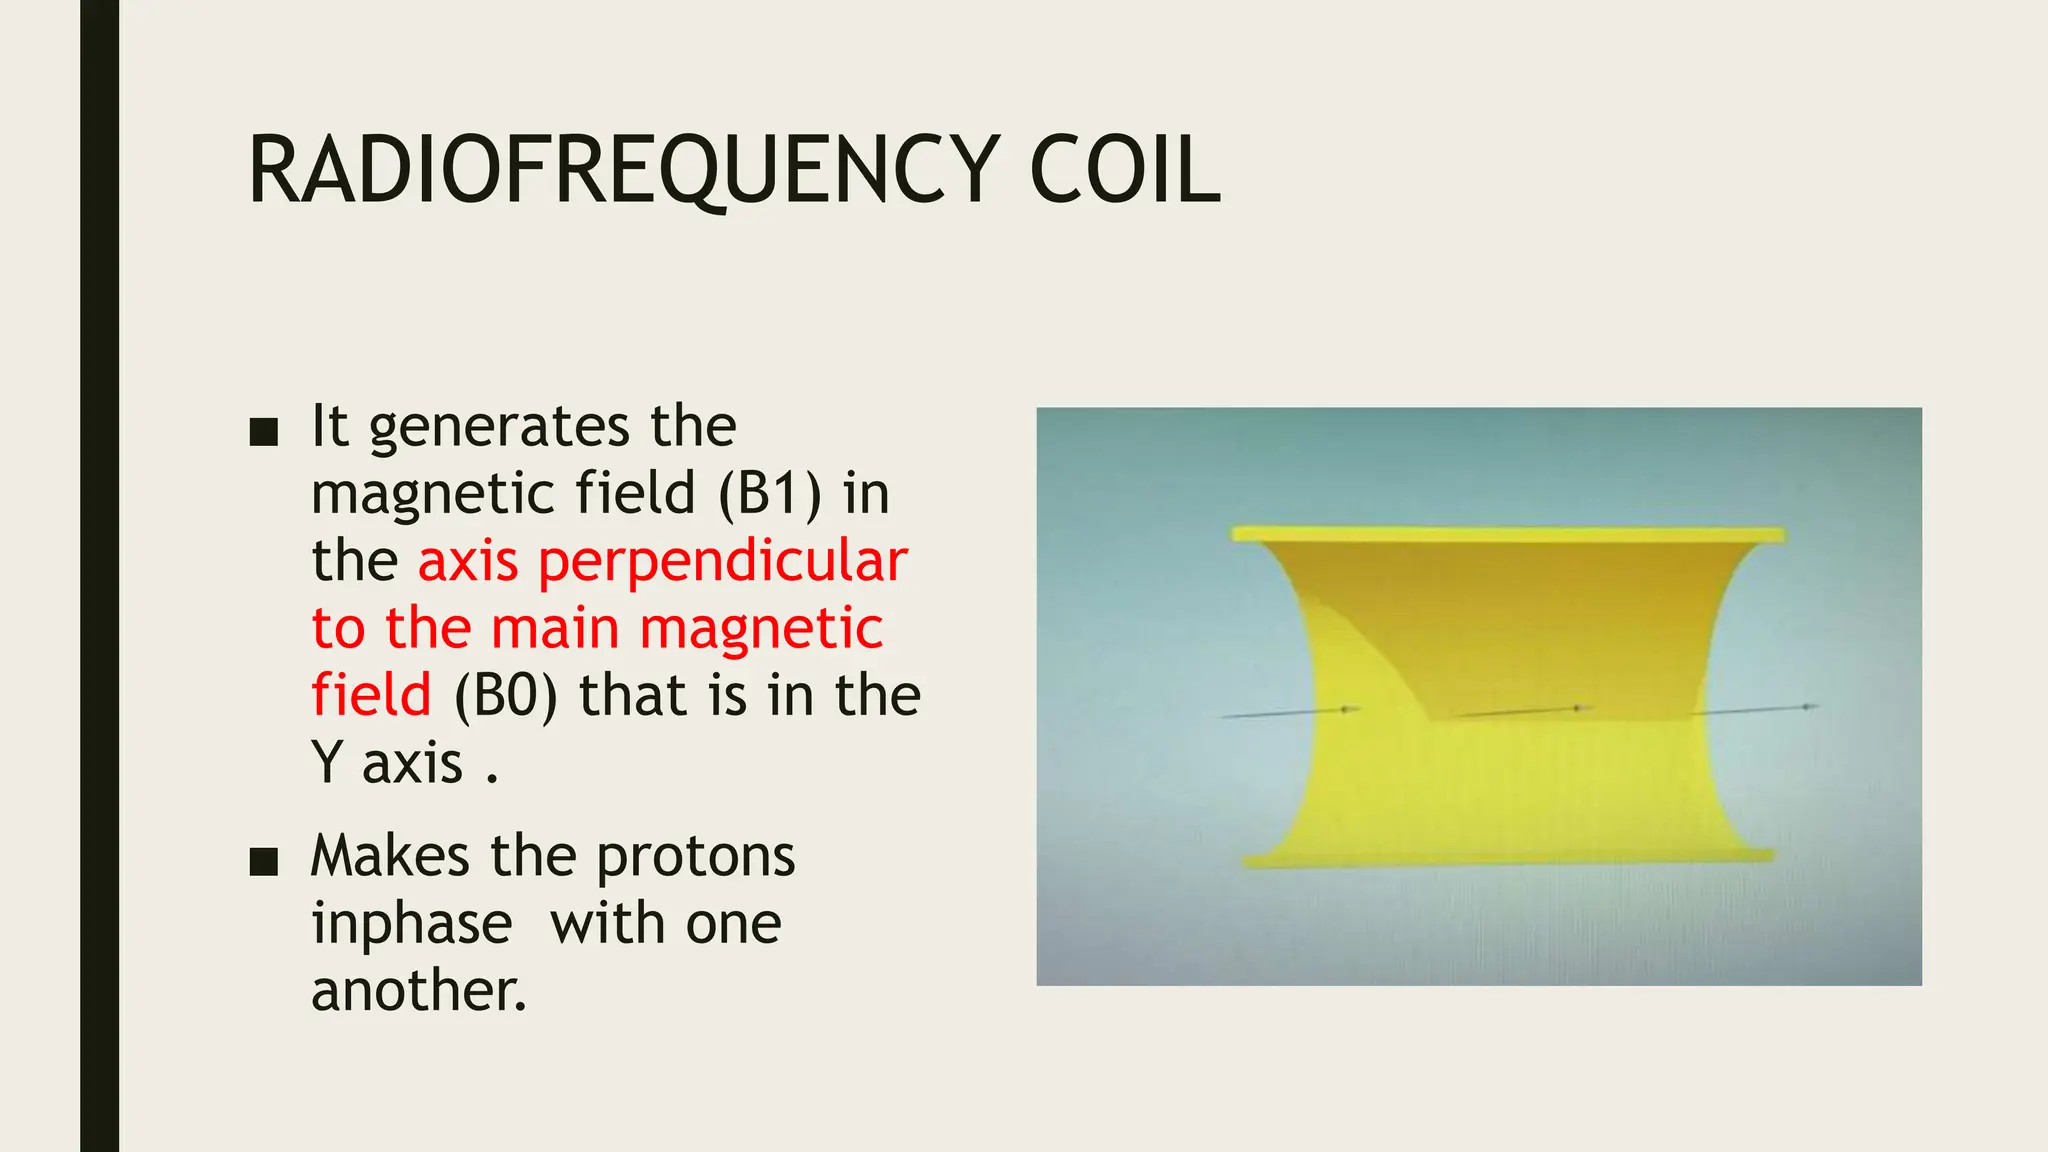
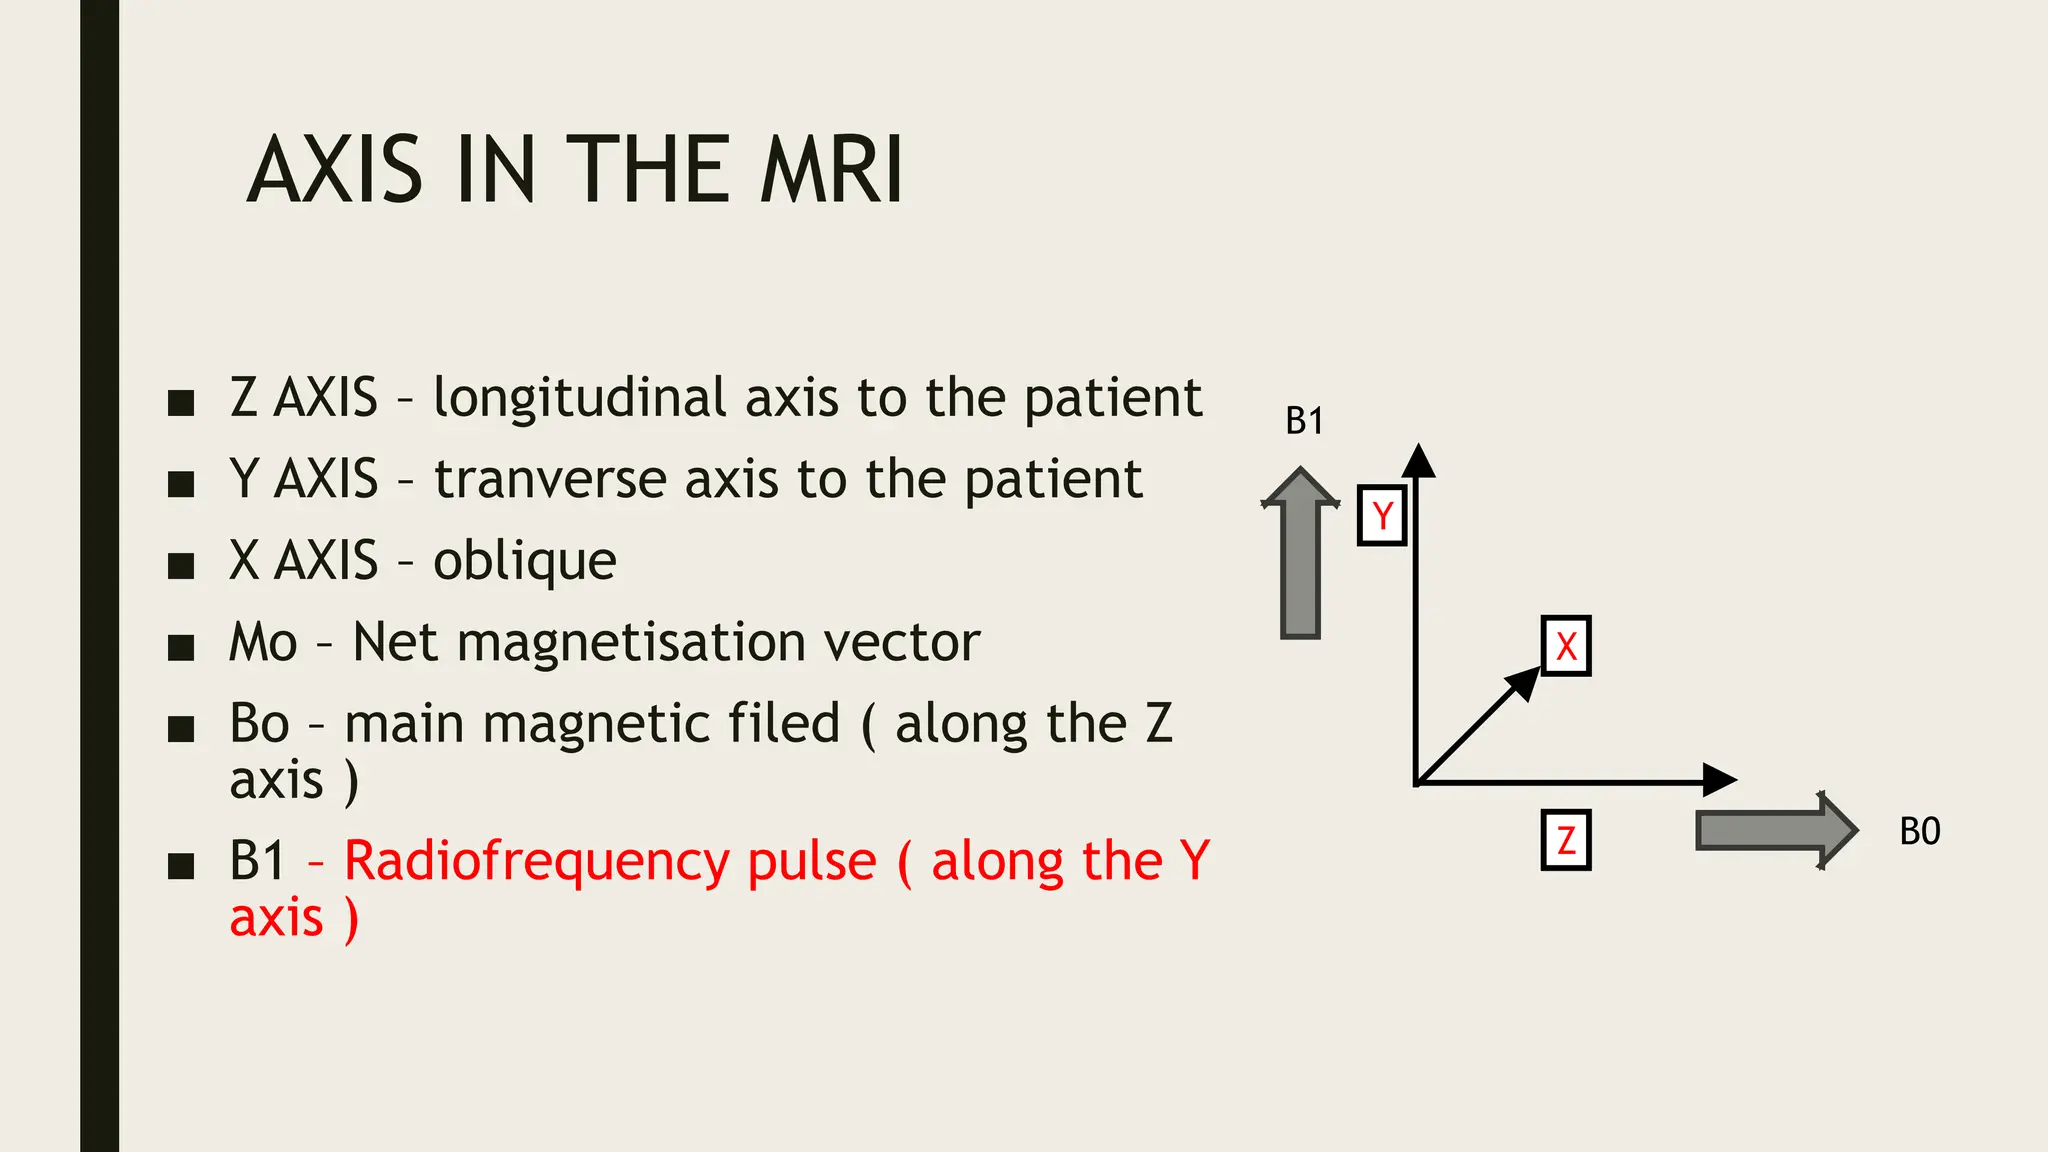
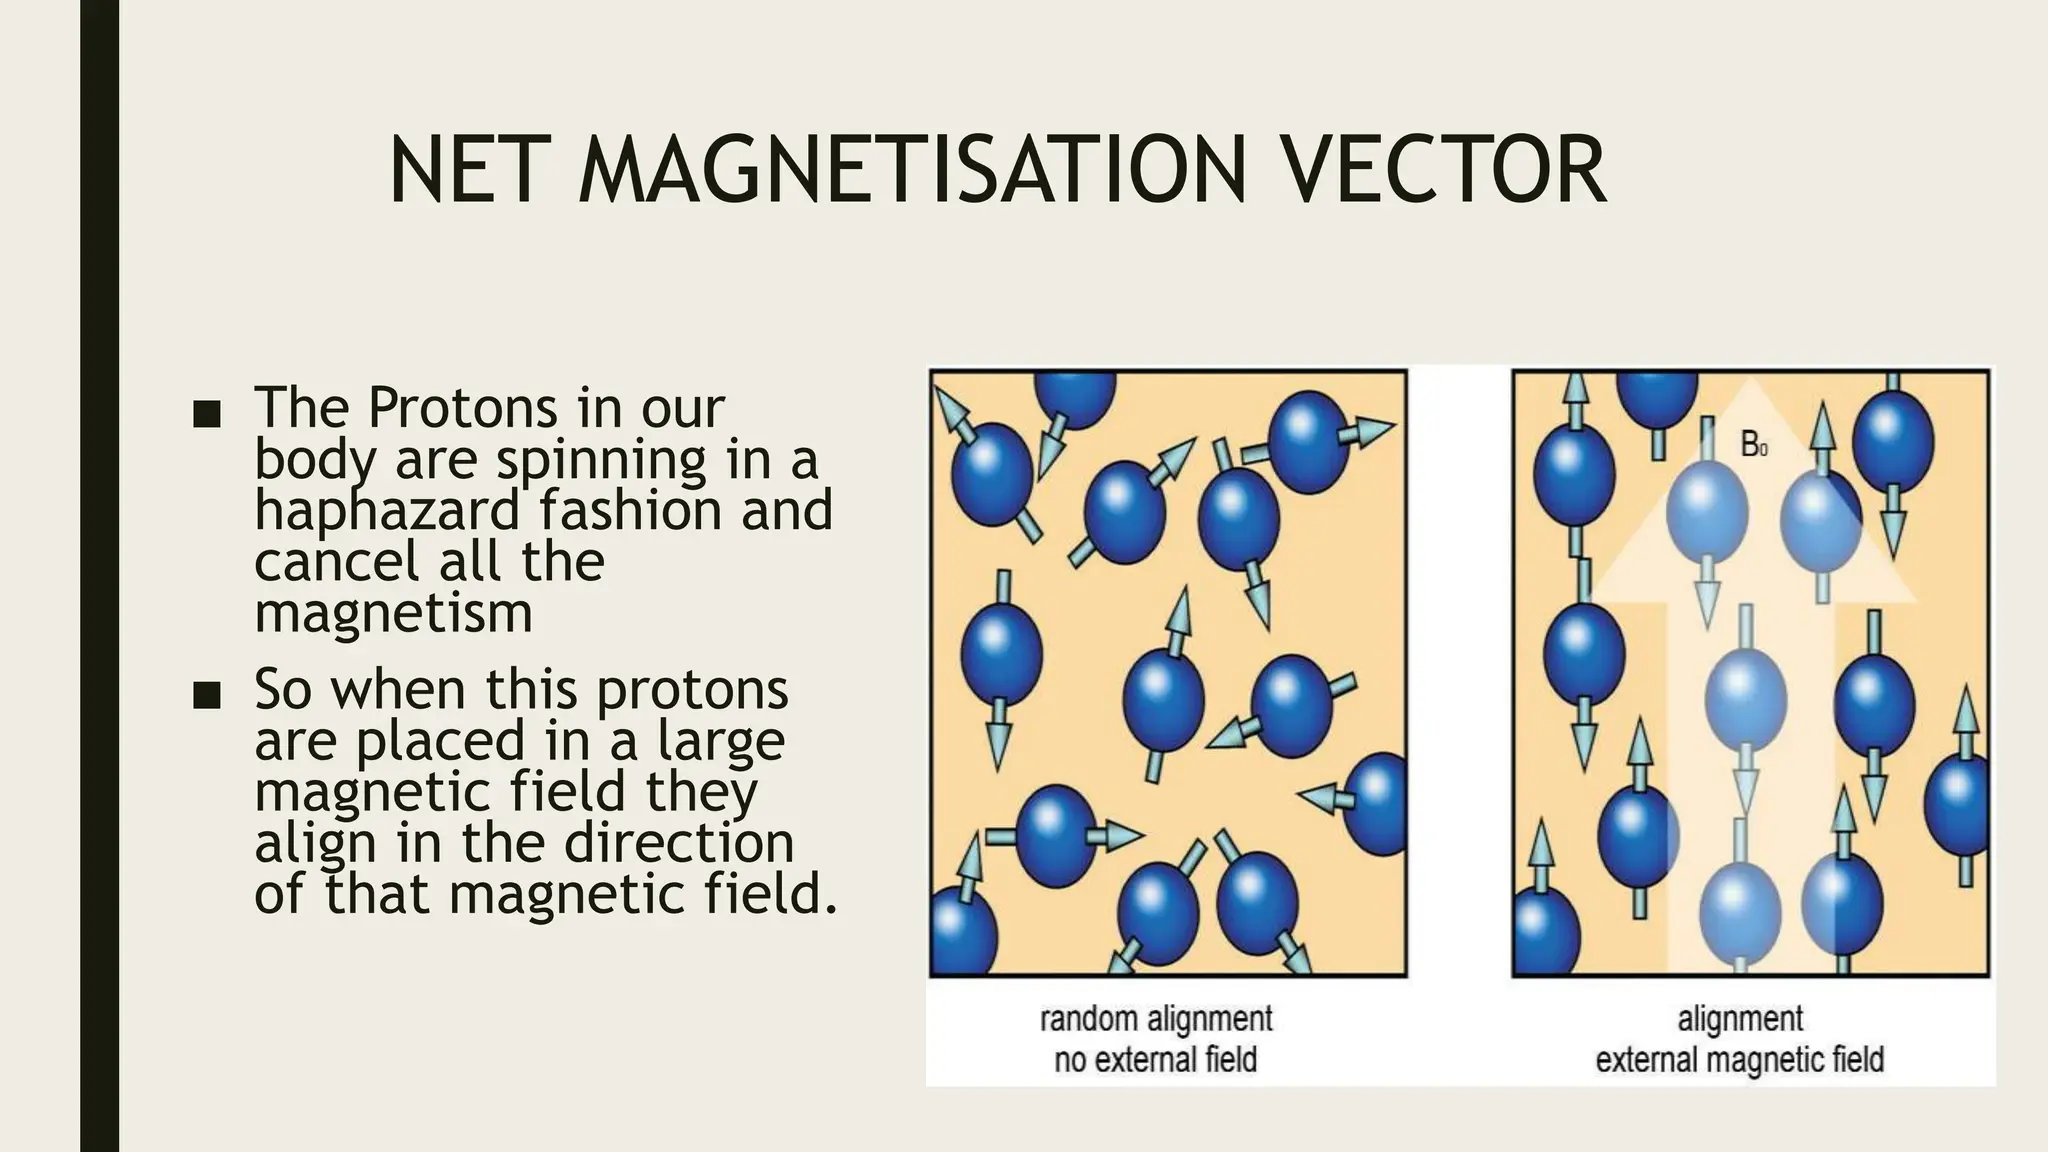
SlideShare a Scribd company logo
1 of 69
MRI PHYSICS
MODERATOR- DR.PRASHANTHI MDRD
PRESENTOR- DR.SWETHA
Introduction
■ MRI is an imaging modality based on interaction
between hydrogen nuclei in human body under
the influence of strong magnetic field.
PRINCIPLE
■ It works on the principle of nuclear magnetic
resonance
■ Nuclear magnetic resonance (NMR)measures the
net magnetization of atomic nuclei in our body
in the presence of magnetic fields and utilise the
information to produce the image
MR nuclei
■ Nuclei is made of Protons and
neutrons
■ But pairs of spins tend to
cancel
■ so only atoms with an odd
number of Protons or neutrons
have spin
■ therefore good MR Nuclei are
1H, 13C ,19F, 23 Na, 31 P.
• A charged particle in motion will create a
magnetic field
• The postitively charged, spinning hydrogen
nucleus generates a magnetic field
WHY HYDROGEN
■ Human body is predominantly made of water
■ Water has hydrogen atom. Hydrogen atoms
exhibits spin and charge
■ They have relatively high magnetic resonance
sensitivity
SPIN
■ Protons and neutron spins
are known as nuclear spins
■ An unpaired component has
a spin of ½ and two
particles with opposite spin
cancel one another.
■ in NMR it is the unpaired
nuclear spins that produce a
signal in the magnetic field
COMPONENTS OF MRI
■ 1. MAIN COIL
■ 2. SHIMS
■ 3. GRADIENT COILS
■ 4. RADIOFEREQUENCY COIL
MAIN COIL
■ Outermost coil
■ When current passes through these
coils there is a formation of strong
main magnetic field denoted as B0.
■ Utilises the principle of
superconductivity.
■ Niobium titanium alloy is used
■ This main magnetic field aligns the
H+ Protons in one direction and
forms a Vector(M0)
■ Continuous passage of current produces heat in the coil
■ To cool down the system we need to continuously
circulate the liquid helium to keep the temperature
below 4 kelvin
■ If the temperature is more than 4 Kelvin the liquid
helium converts to gas and is released -this process is
called as quenching
■ After quenching the MRI machine is non
superconducting and not act as a magnet.
SHIMS
■ They manipulate
the main magnetic
field and make the
magnetic field as
homogeneous as
possible
GRADIENT COILS
■ They apply the
gradient along the
magnetic field
■ The change or
manipulate the
strength of magnetic
field along the
separate axis
RADIOFREQUENCY COIL
■ It generates the
magnetic field (B1) in
the axis perpendicular
to the main magnetic
field (B0) that is in the
Y axis .
■ Makes the protons
inphase with one
another.
AXIS IN THE MRI
■ Z AXIS – longitudinal axis to the patient
■ Y AXIS – tranverse axis to the patient
■ X AXIS – oblique
■ Mo – Net magnetisation vector
■ Bo – main magnetic filed ( along the Z
axis )
■ B1 – Radiofrequency pulse ( along the Y
axis )
Y
Z
X
B0
B1
NET MAGNETISATION VECTOR
■ The Protons in our
body are spinning in a
haphazard fashion and
cancel all the
magnetism
■ So when this protons
are placed in a large
magnetic field they
align in the direction
of that magnetic field.
■ When a body is placed into the bore of the scanner, the strong
magnetic field will cause the individual hydrogen nuclei to
either
A) ALIGN ANTI-PARALLEL TO THE MAIN MAGNETIC FIELD
(B0
OR
B) ALIGN PARALLEL TO THE MAIN MAGNETIC FIELD (B0)
.parallel or anti parallel depend to external magnetic field and
thermal energy level of the nuclei.
B0
■ The majority will cancel each other but the net
number of Protons is sufficient to produce an
image.
■ This vector is called as net magnetization
vector(Mo)
■ Interaction of NMV with Bo is the basis of MRI
■ The unit of B0 is Tesla.
■ We can’t measure the net magnetization vector
in the longitudinal axis as the main magnetic
field (Bo) is strong in this axis.
■ In order to measure the NMV we have to flip the
vector towards the transverse axis.
■ In order to change the NMV from longitudinal to
transverse axis we have to apply an another
magnetic field called as radio frequency
pulse(B1).
■ After applying this radio frequency pulse the
NMV Changes from longitudinal to transverse
axis.
■ Now we’ll measure the NMV in the transverse
axis.
RADIOFRQUENCY PULSE
■ Follows the Law of Electromagnetism (charged
particles in motion will generate a magnetic field)
■ This magnetic field is known in RF pulse denoted as
B1
■ RF Applied as a “pulse” during MR sequences
■ The RF pulse is applied so that B1 is 90 to B0
■ The application of an RF
pulse that causes
resonance to occur is
termed excitation . This
absorption of energy
causes an increase in the
number of spin - down
hydrogen nuclei
populations.
■ Now the NMV vector flips
from longitudinal to
transverse axis
FLIP ANGLE
■ The angle to which
the NMV move out of
alignment is called as
flip angle.
■ the NMV is given
enough energy by the
RF pulse to move
from 90 relative to
B0.
The nuclei gain the energy and resonate and align
in INPHASE if the energy delivered at :
Exactly its precessional frequency.
90 degrees to NMV and B0
PRECESSION
■ Due to the influence of
B0 the hydrogen nucleus
wobbles or precesses.
■ The axis of the nucleus
forms a path around the
B0 known as
precessional path.
■ The speed at which the hydrogen precesss
depends on the strength of B0 and is called as
precessional frequency.
■ The precessional frequency of hydrogen in a 1.5
Tesla magnetic field(B0) is 63 .86 Mhz.
LARMOR EQUATION
■ User to calculate the precessional frequency of
the hydrogen atom.
Larmar equation tells us two
important facts
■ All Active Nuclei have their own gyromagnetic
constant so that when they are exposed to the
same field strength they precess at different
frequencies.
■ This allows us to specifically image hydrogen and
ignore the other MR active nuclei in the body.
HOW TO MEASURE
■ When the nuclei precess in phase in the B-1
plane a changing magnetic field is created.
■ If you place a receiver coil / antenna in the path
of this changing magnetic field a current will be
induced .
■ This is called as Faraday’s law of induction.
■ A signal or voltage is only induced in
the received coil if there is
magnetization in transverse plane, that
in phase.
RELAXATION
■ When the RF pulse is switched
off , the NMV is again
influenced by B 0 and it tries
to realign with it.
■ The process by which
hydrogen loses this energy is
called relaxation.
■ The amount of magnetization
in the longitudinal plane
gradually increases – this is
called recovery.
■ A t the same time, but
independently, the amount of
magnetization in the
transverse plane gradually
decreases – this is called
decay.
B1
B0
T1
RECOVERY
T2
DECAY
TR - REPETITION TIME
■ Time from the application of one RF pulse to
another RF pulse by ms .
■ TR determinates the amount of T1relaxation
that has occurred.
■ TE - ECHO TIME
■ Time from the application of the RF pulse to
the peak of the signal induced in the coil. (ms).
■ TE determinates how much decay is occur before
the signal is read .
■ TE controls the amount of T2 relaxation
T1 RECOVERY
■ Also called as longitudinal recovery or or spin lattice
relaxation.
■ Caused by nuclei giving up their energy to the
surrounding environment or lattice(spin lattice
relaxation ) .
■ The rate of recovery is an exponential process, with a
recovery time constant called T1.
■ T1 is the time it takes 63% of the longitudinal
magnetization to recover in the tissue.(time &signal
intensity)
T1 RECOVERY
T1 RECOVERY IN FAT
■ T1 recovery in fat: the
recovery of the fat
relatively rapid so the
magnetic moment of fat
are able to relax and
regain their longitudinal
magnetization quickly.
■ NMV of the fat realigns
rapidly with B0 and
therefore the T1time of
fat is short.
T1 RECOVERY IN WATER
■ In water molecular mobility is
high resulting in less efficient
T1recovery.
■ The magnetic moments of
water take longer to relax and
regain their longitudinal
magnetization .
■ The NMV of water take longer
to realign with B0 and so the
T1time of water is long
T2 DECAY
■ Caused by nuclei exchanging energy with neighboring nuclei
by magnetic field of each nucleus interacting with its
neighbour.
■ Termed spin spin relaxation .
■ The rate of decay is exponential process.
■ T2 relaxation time of tissue is its time constant of decay.
■ It’s the time takes 63%of the transverse magnetization to be
lost(37% remains).
T2 STAR DECAY
■ T2*decay is decay of the FID following the RF excitation pulse.
■ This decay is faster than T2decay since it is a combination of two
effects:
– 1-T2 decay it self.
– 2-dephasing due to magnetic field inhomogeneities.
■ Dephasing caused by inhomogeneities can be compensated for by
a180 Rf pulse.
■ A pulse sequence that used a 180 RF pulse to compensate for
dephasing is called a spin pulse sequence.
T2 DECAY IN FAT
■ This process is efficient in hydrogen in fat as the
molecules are packed closely together and therefore
spin – spin interactions are more likely to occur.
■ As a result spins dephase quickly and the loss of
transverse magnetization is rapid
■ As energy exchange in more efficient in fat, the T2time
is short.
T2 DECAY IN WATER
■ T2time of hydrogen of water is long(the molecules are
spaced apart and spin – spin
■ interactions are less likely to occur.
■ As a result, spins dephase slowly and the loss of
transverse magnetization is gradual
IMAGE CONTRAST AND
WEIGHTING
■ The factors that affect image contrast in diagnostic
imaging are usually divided into two categories:
■ Intrinsic contrast parameters are those that cannot be
changed because they are inherent in to the body ’ s
tissues.
• Extrinsic contrast parameters those that can be
changed.
INTRINSIC FACTORS
■ T 1 recovery time
■ T 2 decay time
■ proton density
■ flow
■ apparent diffusion coefficient (ADC).
EXTRINSIC FACTORS
– T R
– T E
– flip angle
– T I
– turbo factor/echo train length
– b value.
■ MR image has contrast if there are areas of high signal
(white on the image) and areas of low signal (dark on
the image).
■ Some areas have an intermediate signal (shades of gray
in between white and black)
■ Image obtain contrast mainly through the
mechanisms of T1recovery,T2decay and proton
density.
■ T1 and T2 relaxation depend on three factors:
– The inherent energy of the tissue .
– How closely packed the molecules are.
– How well the molecular tumbling rate matches the
Larmor frequency of hydrogen
T1 WEIGHTING
■ A T1 weighted image is one where the contrast depends
predominantly on the differences in the T1 times
between fat and water.
■ TR control the amount of T1weighting.
■ For T1 weighting the TR must be short. nei ther fat nor
water has sufficient time to fully return to B0.
■ TR controls how far each vector can recover before it is
excited by the next RF pulse.
SHORT TR AND SHORT TE
■ With a short TR, the
difference in T1 shows up
■ With a short TE, difference in
tissue intensities is not well
appreciated. So, T2 doesn’t
influence the signal
■ Thus, the resulting image is
T1 weighted
T2 WEIGHTING
■ The TE controls the amount of T2 decay that is allowed
to occur before the signal is received.
■ TE must be long enough to give both fat and water to
decay (large contrast different between fat and water).
■ If the TE is too short, neither fat nor water has had time
to decay, and therefore the differences in their T2
times are not demonstrated
LONG TR AND LONG TE
■ With a long TR, T1 doesn’t
influence the signal
■ With a long TE, difference in
tissue intensities is becomes well
pronounced
■ Thus the resulting image is T2
weighted
PROTON DENSITY IMAGING
■ If image acquired at Short TE and long TR the effect of
T1and T2contrast must be diminished.
■ Along TR allows both fat and water to fully recover
their longitudinal magnetization and diminished
T1weighting.
■ A short TE dose not give fat or water time to decay and
therefore diminshed
LONG TR AND SHORT TE
■ With a long TR, T1 doesn’t
influence the signal
■ With a short TE, difference in
tissue intensities is not well
appreciated. So, T2 doesn’t
influence the signal
■ Thus, the signal here is influenced
by proton density
FLOW VOIDS
■ When we send in our first 90° pulse, all the protons
■ in the cross section are influenced by the radio wave.
■ After we turn the RF pulse off, we "listen" into the section and
record a signal.
■ At this time, all the original blood in our vessel may have left
the examined slice. So there is no signal coming out of the vessel
-it appears black in the picture.
■ This phenomenon is called flow-void phenomenon.
EFFECT OF CONTRAST
■ Gadolinium, a paramagnetic substance, is used as an MR contrast
medium.
■ Chemically the substance is a rare earth.
■ As Gadolinium is toxic in its free state, it is bound to DTPA
■ Gadolinium does not go through the intact, but rather the
disrupted blood-brainbarrier.
■ The effect of the contrast medium is a change of the signal
intensity by shortening T1 and T2 in its surroundings
■ With a short T1, the signal from the tissue will be stronger than
before
■ With a short T2, less signal comes from the tissues
■ As loss of signal often is more difficult to appreciate than a signal
enhancement, T1-weighted images are the predominant imaging
technique used after contrast medium injection.
SLICE SELECTION
■ we can select a slice to be examined by using a gradient field,
which is superimposed on the external magnetic field.
■ Protons along this gradient field are exposed to different
magnetic field strengths, and thus have different precession
frequencies.
■ As they have different precession frequencies, we can send in an
RF pulse that contains only those frequencies, which excite the
protons in the slice which we want to image.
SLICE THICKNESS
Slice thickness can be altered in two ways:
■ by changing the band width of the RF pulse,
■ by modifying the steepness of the gradient field.
SIGNAL PROCESSING
■ To determine the point in a slice from which a
certain signal is coming, we use two other
gradients, the frequency encoding and the phase
encoding gradient
FREQUENCY ENCODING
■ The frequency encoding gradient is sent in after the
slice selection gradient.
■ It is applied in the direction of the y-axis.
■ This results in different precession frequencies along
the y-axis, and thus different frequencies of the
corresponding signals
PHASE ENCODING
■ the phase encoding gradient is turned on for a short time
■ after the RF pulse along the x-axis.
■ During this short time, the protons along the x-axis precess with
different frequencies.
■ When this gradient is switched off, they go back to their former
precession frequency, which was the same for all of them.
■ Due to this phase encoding gradient, however, the protons and
their signals are now out of phase, which can be detected.
PROCESSING
■ the moving proton vector induces a signal in the RF
antenna
■ The signal is picked up by a coil and sent to the
computer system. The received signal is sinusoidal in
nature
■ The computer receives mathematical data, which is
converted through the use of a Fourier transform into
an image.
THANK YOU

More Related Content

Similar to MRI PHYSICS.pptxMRI PHYSICS.pptxMRI PHYSICS.pptx

Nuclear magnetic resonance partial lecture notes
Nuclear magnetic resonance   partial lecture notesNuclear magnetic resonance   partial lecture notes
Nuclear magnetic resonance partial lecture notes
ankit
 

Similar to MRI PHYSICS.pptxMRI PHYSICS.pptxMRI PHYSICS.pptx (20)

How mri scan works ?
How mri scan works ?How mri scan works ?
How mri scan works ?
 
Nuclear magnetic resonance partial lecture notes
Nuclear magnetic resonance   partial lecture notesNuclear magnetic resonance   partial lecture notes
Nuclear magnetic resonance partial lecture notes
 
Mri physics PART-1
Mri physics PART-1Mri physics PART-1
Mri physics PART-1
 
MRI Physics
MRI PhysicsMRI Physics
MRI Physics
 
JC on MRI -BASICS.pptx
JC on MRI -BASICS.pptxJC on MRI -BASICS.pptx
JC on MRI -BASICS.pptx
 
Girish mri
Girish mriGirish mri
Girish mri
 
Principle of MRI.pptx
Principle of MRI.pptxPrinciple of MRI.pptx
Principle of MRI.pptx
 
Principle of MRI Physics. Shafiee
Principle of MRI Physics. ShafieePrinciple of MRI Physics. Shafiee
Principle of MRI Physics. Shafiee
 
Basic MRI in hepatobiliary surgery.pptx
Basic MRI in hepatobiliary surgery.pptxBasic MRI in hepatobiliary surgery.pptx
Basic MRI in hepatobiliary surgery.pptx
 
NMR.pptx
NMR.pptxNMR.pptx
NMR.pptx
 
1H NUCLEAR MAGNETIC RESONANCE
1H NUCLEAR MAGNETIC RESONANCE1H NUCLEAR MAGNETIC RESONANCE
1H NUCLEAR MAGNETIC RESONANCE
 
Ppt mri brain
Ppt mri brainPpt mri brain
Ppt mri brain
 
MRI physics
MRI physicsMRI physics
MRI physics
 
Mri physics
Mri physicsMri physics
Mri physics
 
NMR SPECTROSCOPY .ppt
NMR SPECTROSCOPY .pptNMR SPECTROSCOPY .ppt
NMR SPECTROSCOPY .ppt
 
MRI
MRIMRI
MRI
 
Magnetic Resonance Imaging
Magnetic Resonance ImagingMagnetic Resonance Imaging
Magnetic Resonance Imaging
 
NMR presentation
NMR presentationNMR presentation
NMR presentation
 
Mri basic principles
Mri basic principlesMri basic principles
Mri basic principles
 
mribasicprinciples-19091912334002451.pdf
mribasicprinciples-19091912334002451.pdfmribasicprinciples-19091912334002451.pdf
mribasicprinciples-19091912334002451.pdf
 

Recently uploaded

Transparency, Recognition and the role of eSealing - Ildiko Mazar and Koen No...
Transparency, Recognition and the role of eSealing - Ildiko Mazar and Koen No...Transparency, Recognition and the role of eSealing - Ildiko Mazar and Koen No...
Transparency, Recognition and the role of eSealing - Ildiko Mazar and Koen No...
EADTU
 

Recently uploaded (20)

Jamworks pilot and AI at Jisc (20/03/2024)
Jamworks pilot and AI at Jisc (20/03/2024)Jamworks pilot and AI at Jisc (20/03/2024)
Jamworks pilot and AI at Jisc (20/03/2024)
 
Play hard learn harder: The Serious Business of Play
Play hard learn harder:  The Serious Business of PlayPlay hard learn harder:  The Serious Business of Play
Play hard learn harder: The Serious Business of Play
 
NO1 Top Black Magic Specialist In Lahore Black magic In Pakistan Kala Ilam Ex...
NO1 Top Black Magic Specialist In Lahore Black magic In Pakistan Kala Ilam Ex...NO1 Top Black Magic Specialist In Lahore Black magic In Pakistan Kala Ilam Ex...
NO1 Top Black Magic Specialist In Lahore Black magic In Pakistan Kala Ilam Ex...
 
Details on CBSE Compartment Exam.pptx1111
Details on CBSE Compartment Exam.pptx1111Details on CBSE Compartment Exam.pptx1111
Details on CBSE Compartment Exam.pptx1111
 
How to Add New Custom Addons Path in Odoo 17
How to Add New Custom Addons Path in Odoo 17How to Add New Custom Addons Path in Odoo 17
How to Add New Custom Addons Path in Odoo 17
 
Transparency, Recognition and the role of eSealing - Ildiko Mazar and Koen No...
Transparency, Recognition and the role of eSealing - Ildiko Mazar and Koen No...Transparency, Recognition and the role of eSealing - Ildiko Mazar and Koen No...
Transparency, Recognition and the role of eSealing - Ildiko Mazar and Koen No...
 
TỔNG HỢP HƠN 100 ĐỀ THI THỬ TỐT NGHIỆP THPT TOÁN 2024 - TỪ CÁC TRƯỜNG, TRƯỜNG...
TỔNG HỢP HƠN 100 ĐỀ THI THỬ TỐT NGHIỆP THPT TOÁN 2024 - TỪ CÁC TRƯỜNG, TRƯỜNG...TỔNG HỢP HƠN 100 ĐỀ THI THỬ TỐT NGHIỆP THPT TOÁN 2024 - TỪ CÁC TRƯỜNG, TRƯỜNG...
TỔNG HỢP HƠN 100 ĐỀ THI THỬ TỐT NGHIỆP THPT TOÁN 2024 - TỪ CÁC TRƯỜNG, TRƯỜNG...
 
Wellbeing inclusion and digital dystopias.pptx
Wellbeing inclusion and digital dystopias.pptxWellbeing inclusion and digital dystopias.pptx
Wellbeing inclusion and digital dystopias.pptx
 
Unit 3 Emotional Intelligence and Spiritual Intelligence.pdf
Unit 3 Emotional Intelligence and Spiritual Intelligence.pdfUnit 3 Emotional Intelligence and Spiritual Intelligence.pdf
Unit 3 Emotional Intelligence and Spiritual Intelligence.pdf
 
OSCM Unit 2_Operations Processes & Systems
OSCM Unit 2_Operations Processes & SystemsOSCM Unit 2_Operations Processes & Systems
OSCM Unit 2_Operations Processes & Systems
 
AIM of Education-Teachers Training-2024.ppt
AIM of Education-Teachers Training-2024.pptAIM of Education-Teachers Training-2024.ppt
AIM of Education-Teachers Training-2024.ppt
 
PANDITA RAMABAI- Indian political thought GENDER.pptx
PANDITA RAMABAI- Indian political thought GENDER.pptxPANDITA RAMABAI- Indian political thought GENDER.pptx
PANDITA RAMABAI- Indian political thought GENDER.pptx
 
dusjagr & nano talk on open tools for agriculture research and learning
dusjagr & nano talk on open tools for agriculture research and learningdusjagr & nano talk on open tools for agriculture research and learning
dusjagr & nano talk on open tools for agriculture research and learning
 
diagnosting testing bsc 2nd sem.pptx....
diagnosting testing bsc 2nd sem.pptx....diagnosting testing bsc 2nd sem.pptx....
diagnosting testing bsc 2nd sem.pptx....
 
REMIFENTANIL: An Ultra short acting opioid.pptx
REMIFENTANIL: An Ultra short acting opioid.pptxREMIFENTANIL: An Ultra short acting opioid.pptx
REMIFENTANIL: An Ultra short acting opioid.pptx
 
Including Mental Health Support in Project Delivery, 14 May.pdf
Including Mental Health Support in Project Delivery, 14 May.pdfIncluding Mental Health Support in Project Delivery, 14 May.pdf
Including Mental Health Support in Project Delivery, 14 May.pdf
 
Andreas Schleicher presents at the launch of What does child empowerment mean...
Andreas Schleicher presents at the launch of What does child empowerment mean...Andreas Schleicher presents at the launch of What does child empowerment mean...
Andreas Schleicher presents at the launch of What does child empowerment mean...
 
Diuretic, Hypoglycemic and Limit test of Heavy metals and Arsenic.-1.pdf
Diuretic, Hypoglycemic and Limit test of Heavy metals and Arsenic.-1.pdfDiuretic, Hypoglycemic and Limit test of Heavy metals and Arsenic.-1.pdf
Diuretic, Hypoglycemic and Limit test of Heavy metals and Arsenic.-1.pdf
 
Model Attribute _rec_name in the Odoo 17
Model Attribute _rec_name in the Odoo 17Model Attribute _rec_name in the Odoo 17
Model Attribute _rec_name in the Odoo 17
 
Towards a code of practice for AI in AT.pptx
Towards a code of practice for AI in AT.pptxTowards a code of practice for AI in AT.pptx
Towards a code of practice for AI in AT.pptx
 

MRI PHYSICS.pptxMRI PHYSICS.pptxMRI PHYSICS.pptx

  • 1. MRI PHYSICS MODERATOR- DR.PRASHANTHI MDRD PRESENTOR- DR.SWETHA
  • 2. Introduction ■ MRI is an imaging modality based on interaction between hydrogen nuclei in human body under the influence of strong magnetic field.
  • 3. PRINCIPLE ■ It works on the principle of nuclear magnetic resonance ■ Nuclear magnetic resonance (NMR)measures the net magnetization of atomic nuclei in our body in the presence of magnetic fields and utilise the information to produce the image
  • 4. MR nuclei ■ Nuclei is made of Protons and neutrons ■ But pairs of spins tend to cancel ■ so only atoms with an odd number of Protons or neutrons have spin ■ therefore good MR Nuclei are 1H, 13C ,19F, 23 Na, 31 P.
  • 5. • A charged particle in motion will create a magnetic field • The postitively charged, spinning hydrogen nucleus generates a magnetic field
  • 6. WHY HYDROGEN ■ Human body is predominantly made of water ■ Water has hydrogen atom. Hydrogen atoms exhibits spin and charge ■ They have relatively high magnetic resonance sensitivity
  • 7. SPIN ■ Protons and neutron spins are known as nuclear spins ■ An unpaired component has a spin of ½ and two particles with opposite spin cancel one another. ■ in NMR it is the unpaired nuclear spins that produce a signal in the magnetic field
  • 8. COMPONENTS OF MRI ■ 1. MAIN COIL ■ 2. SHIMS ■ 3. GRADIENT COILS ■ 4. RADIOFEREQUENCY COIL
  • 9. MAIN COIL ■ Outermost coil ■ When current passes through these coils there is a formation of strong main magnetic field denoted as B0. ■ Utilises the principle of superconductivity. ■ Niobium titanium alloy is used ■ This main magnetic field aligns the H+ Protons in one direction and forms a Vector(M0)
  • 10. ■ Continuous passage of current produces heat in the coil ■ To cool down the system we need to continuously circulate the liquid helium to keep the temperature below 4 kelvin ■ If the temperature is more than 4 Kelvin the liquid helium converts to gas and is released -this process is called as quenching ■ After quenching the MRI machine is non superconducting and not act as a magnet.
  • 11. SHIMS ■ They manipulate the main magnetic field and make the magnetic field as homogeneous as possible
  • 12. GRADIENT COILS ■ They apply the gradient along the magnetic field ■ The change or manipulate the strength of magnetic field along the separate axis
  • 13.
  • 14. RADIOFREQUENCY COIL ■ It generates the magnetic field (B1) in the axis perpendicular to the main magnetic field (B0) that is in the Y axis . ■ Makes the protons inphase with one another.
  • 15. AXIS IN THE MRI ■ Z AXIS – longitudinal axis to the patient ■ Y AXIS – tranverse axis to the patient ■ X AXIS – oblique ■ Mo – Net magnetisation vector ■ Bo – main magnetic filed ( along the Z axis ) ■ B1 – Radiofrequency pulse ( along the Y axis ) Y Z X B0 B1
  • 16. NET MAGNETISATION VECTOR ■ The Protons in our body are spinning in a haphazard fashion and cancel all the magnetism ■ So when this protons are placed in a large magnetic field they align in the direction of that magnetic field.
  • 17. ■ When a body is placed into the bore of the scanner, the strong magnetic field will cause the individual hydrogen nuclei to either A) ALIGN ANTI-PARALLEL TO THE MAIN MAGNETIC FIELD (B0 OR B) ALIGN PARALLEL TO THE MAIN MAGNETIC FIELD (B0) .parallel or anti parallel depend to external magnetic field and thermal energy level of the nuclei. B0
  • 18. ■ The majority will cancel each other but the net number of Protons is sufficient to produce an image. ■ This vector is called as net magnetization vector(Mo) ■ Interaction of NMV with Bo is the basis of MRI ■ The unit of B0 is Tesla.
  • 19. ■ We can’t measure the net magnetization vector in the longitudinal axis as the main magnetic field (Bo) is strong in this axis. ■ In order to measure the NMV we have to flip the vector towards the transverse axis.
  • 20. ■ In order to change the NMV from longitudinal to transverse axis we have to apply an another magnetic field called as radio frequency pulse(B1). ■ After applying this radio frequency pulse the NMV Changes from longitudinal to transverse axis. ■ Now we’ll measure the NMV in the transverse axis.
  • 21. RADIOFRQUENCY PULSE ■ Follows the Law of Electromagnetism (charged particles in motion will generate a magnetic field) ■ This magnetic field is known in RF pulse denoted as B1 ■ RF Applied as a “pulse” during MR sequences ■ The RF pulse is applied so that B1 is 90 to B0
  • 22. ■ The application of an RF pulse that causes resonance to occur is termed excitation . This absorption of energy causes an increase in the number of spin - down hydrogen nuclei populations. ■ Now the NMV vector flips from longitudinal to transverse axis
  • 23. FLIP ANGLE ■ The angle to which the NMV move out of alignment is called as flip angle. ■ the NMV is given enough energy by the RF pulse to move from 90 relative to B0.
  • 24. The nuclei gain the energy and resonate and align in INPHASE if the energy delivered at : Exactly its precessional frequency. 90 degrees to NMV and B0
  • 25. PRECESSION ■ Due to the influence of B0 the hydrogen nucleus wobbles or precesses. ■ The axis of the nucleus forms a path around the B0 known as precessional path.
  • 26. ■ The speed at which the hydrogen precesss depends on the strength of B0 and is called as precessional frequency. ■ The precessional frequency of hydrogen in a 1.5 Tesla magnetic field(B0) is 63 .86 Mhz.
  • 27. LARMOR EQUATION ■ User to calculate the precessional frequency of the hydrogen atom.
  • 28. Larmar equation tells us two important facts ■ All Active Nuclei have their own gyromagnetic constant so that when they are exposed to the same field strength they precess at different frequencies. ■ This allows us to specifically image hydrogen and ignore the other MR active nuclei in the body.
  • 29. HOW TO MEASURE ■ When the nuclei precess in phase in the B-1 plane a changing magnetic field is created. ■ If you place a receiver coil / antenna in the path of this changing magnetic field a current will be induced . ■ This is called as Faraday’s law of induction.
  • 30. ■ A signal or voltage is only induced in the received coil if there is magnetization in transverse plane, that in phase.
  • 31.
  • 32. RELAXATION ■ When the RF pulse is switched off , the NMV is again influenced by B 0 and it tries to realign with it. ■ The process by which hydrogen loses this energy is called relaxation.
  • 33. ■ The amount of magnetization in the longitudinal plane gradually increases – this is called recovery. ■ A t the same time, but independently, the amount of magnetization in the transverse plane gradually decreases – this is called decay. B1 B0 T1 RECOVERY T2 DECAY
  • 34. TR - REPETITION TIME ■ Time from the application of one RF pulse to another RF pulse by ms . ■ TR determinates the amount of T1relaxation that has occurred.
  • 35. ■ TE - ECHO TIME ■ Time from the application of the RF pulse to the peak of the signal induced in the coil. (ms). ■ TE determinates how much decay is occur before the signal is read . ■ TE controls the amount of T2 relaxation
  • 36.
  • 37. T1 RECOVERY ■ Also called as longitudinal recovery or or spin lattice relaxation. ■ Caused by nuclei giving up their energy to the surrounding environment or lattice(spin lattice relaxation ) . ■ The rate of recovery is an exponential process, with a recovery time constant called T1. ■ T1 is the time it takes 63% of the longitudinal magnetization to recover in the tissue.(time &signal intensity)
  • 39. T1 RECOVERY IN FAT ■ T1 recovery in fat: the recovery of the fat relatively rapid so the magnetic moment of fat are able to relax and regain their longitudinal magnetization quickly. ■ NMV of the fat realigns rapidly with B0 and therefore the T1time of fat is short.
  • 40. T1 RECOVERY IN WATER ■ In water molecular mobility is high resulting in less efficient T1recovery. ■ The magnetic moments of water take longer to relax and regain their longitudinal magnetization . ■ The NMV of water take longer to realign with B0 and so the T1time of water is long
  • 41. T2 DECAY ■ Caused by nuclei exchanging energy with neighboring nuclei by magnetic field of each nucleus interacting with its neighbour. ■ Termed spin spin relaxation . ■ The rate of decay is exponential process. ■ T2 relaxation time of tissue is its time constant of decay. ■ It’s the time takes 63%of the transverse magnetization to be lost(37% remains).
  • 42.
  • 43. T2 STAR DECAY ■ T2*decay is decay of the FID following the RF excitation pulse. ■ This decay is faster than T2decay since it is a combination of two effects: – 1-T2 decay it self. – 2-dephasing due to magnetic field inhomogeneities. ■ Dephasing caused by inhomogeneities can be compensated for by a180 Rf pulse. ■ A pulse sequence that used a 180 RF pulse to compensate for dephasing is called a spin pulse sequence.
  • 44. T2 DECAY IN FAT ■ This process is efficient in hydrogen in fat as the molecules are packed closely together and therefore spin – spin interactions are more likely to occur. ■ As a result spins dephase quickly and the loss of transverse magnetization is rapid ■ As energy exchange in more efficient in fat, the T2time is short.
  • 45.
  • 46. T2 DECAY IN WATER ■ T2time of hydrogen of water is long(the molecules are spaced apart and spin – spin ■ interactions are less likely to occur. ■ As a result, spins dephase slowly and the loss of transverse magnetization is gradual
  • 47.
  • 48. IMAGE CONTRAST AND WEIGHTING ■ The factors that affect image contrast in diagnostic imaging are usually divided into two categories: ■ Intrinsic contrast parameters are those that cannot be changed because they are inherent in to the body ’ s tissues. • Extrinsic contrast parameters those that can be changed.
  • 49. INTRINSIC FACTORS ■ T 1 recovery time ■ T 2 decay time ■ proton density ■ flow ■ apparent diffusion coefficient (ADC).
  • 50. EXTRINSIC FACTORS – T R – T E – flip angle – T I – turbo factor/echo train length – b value.
  • 51. ■ MR image has contrast if there are areas of high signal (white on the image) and areas of low signal (dark on the image). ■ Some areas have an intermediate signal (shades of gray in between white and black) ■ Image obtain contrast mainly through the mechanisms of T1recovery,T2decay and proton density.
  • 52. ■ T1 and T2 relaxation depend on three factors: – The inherent energy of the tissue . – How closely packed the molecules are. – How well the molecular tumbling rate matches the Larmor frequency of hydrogen
  • 53. T1 WEIGHTING ■ A T1 weighted image is one where the contrast depends predominantly on the differences in the T1 times between fat and water. ■ TR control the amount of T1weighting. ■ For T1 weighting the TR must be short. nei ther fat nor water has sufficient time to fully return to B0. ■ TR controls how far each vector can recover before it is excited by the next RF pulse.
  • 54. SHORT TR AND SHORT TE ■ With a short TR, the difference in T1 shows up ■ With a short TE, difference in tissue intensities is not well appreciated. So, T2 doesn’t influence the signal ■ Thus, the resulting image is T1 weighted
  • 55. T2 WEIGHTING ■ The TE controls the amount of T2 decay that is allowed to occur before the signal is received. ■ TE must be long enough to give both fat and water to decay (large contrast different between fat and water). ■ If the TE is too short, neither fat nor water has had time to decay, and therefore the differences in their T2 times are not demonstrated
  • 56. LONG TR AND LONG TE ■ With a long TR, T1 doesn’t influence the signal ■ With a long TE, difference in tissue intensities is becomes well pronounced ■ Thus the resulting image is T2 weighted
  • 57. PROTON DENSITY IMAGING ■ If image acquired at Short TE and long TR the effect of T1and T2contrast must be diminished. ■ Along TR allows both fat and water to fully recover their longitudinal magnetization and diminished T1weighting. ■ A short TE dose not give fat or water time to decay and therefore diminshed
  • 58. LONG TR AND SHORT TE ■ With a long TR, T1 doesn’t influence the signal ■ With a short TE, difference in tissue intensities is not well appreciated. So, T2 doesn’t influence the signal ■ Thus, the signal here is influenced by proton density
  • 59.
  • 60. FLOW VOIDS ■ When we send in our first 90° pulse, all the protons ■ in the cross section are influenced by the radio wave. ■ After we turn the RF pulse off, we "listen" into the section and record a signal. ■ At this time, all the original blood in our vessel may have left the examined slice. So there is no signal coming out of the vessel -it appears black in the picture. ■ This phenomenon is called flow-void phenomenon.
  • 61. EFFECT OF CONTRAST ■ Gadolinium, a paramagnetic substance, is used as an MR contrast medium. ■ Chemically the substance is a rare earth. ■ As Gadolinium is toxic in its free state, it is bound to DTPA ■ Gadolinium does not go through the intact, but rather the disrupted blood-brainbarrier.
  • 62. ■ The effect of the contrast medium is a change of the signal intensity by shortening T1 and T2 in its surroundings ■ With a short T1, the signal from the tissue will be stronger than before ■ With a short T2, less signal comes from the tissues ■ As loss of signal often is more difficult to appreciate than a signal enhancement, T1-weighted images are the predominant imaging technique used after contrast medium injection.
  • 63. SLICE SELECTION ■ we can select a slice to be examined by using a gradient field, which is superimposed on the external magnetic field. ■ Protons along this gradient field are exposed to different magnetic field strengths, and thus have different precession frequencies. ■ As they have different precession frequencies, we can send in an RF pulse that contains only those frequencies, which excite the protons in the slice which we want to image.
  • 64. SLICE THICKNESS Slice thickness can be altered in two ways: ■ by changing the band width of the RF pulse, ■ by modifying the steepness of the gradient field.
  • 65. SIGNAL PROCESSING ■ To determine the point in a slice from which a certain signal is coming, we use two other gradients, the frequency encoding and the phase encoding gradient
  • 66. FREQUENCY ENCODING ■ The frequency encoding gradient is sent in after the slice selection gradient. ■ It is applied in the direction of the y-axis. ■ This results in different precession frequencies along the y-axis, and thus different frequencies of the corresponding signals
  • 67. PHASE ENCODING ■ the phase encoding gradient is turned on for a short time ■ after the RF pulse along the x-axis. ■ During this short time, the protons along the x-axis precess with different frequencies. ■ When this gradient is switched off, they go back to their former precession frequency, which was the same for all of them. ■ Due to this phase encoding gradient, however, the protons and their signals are now out of phase, which can be detected.
  • 68. PROCESSING ■ the moving proton vector induces a signal in the RF antenna ■ The signal is picked up by a coil and sent to the computer system. The received signal is sinusoidal in nature ■ The computer receives mathematical data, which is converted through the use of a Fourier transform into an image.