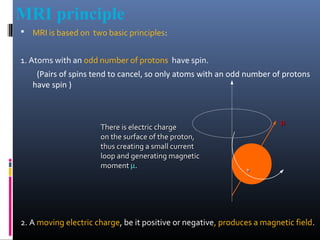
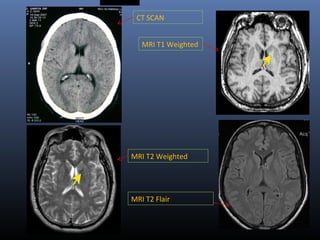
MRI utilizes the magnetic spin property of protons in hydrogen atoms to generate images. It works by aligning hydrogen protons in the body with an external magnetic field, manipulating the alignment with radiofrequency pulses, and detecting signals as the protons relax and return to their original alignment. Different tissues can be distinguished based on their relaxation times, T1 and T2. FLAIR and STIR sequences are used to suppress the signal from cerebrospinal fluid and fat, respectively, improving visualization of lesions near these tissues. FLAIR is particularly useful for evaluating diseases of the brain parenchyma near CSF spaces.
this power-point slide presentation includes lots of information like how MRI coil works. what is shimming, magnet, fringe, and design of mri coil and also magnet. this will help a lot for radiologist and technician radiographers.. thanks.
La imagen por resonancia magnética (MRI) crea imágenes transversales del interior de su cuerpo. La MRI utiliza imanes potentes para producir las imágenes, no radiación. Una MRI toma cortes transversales (vistas) desde muchos ángulos, como si alguien estuviera mirando una sección de su cuerpo de frente, de costado, o por encima de su cabeza. Este estudio crea imágenes de partes del tejido blando del cuerpo que a veces son difíciles de ver cuando se emplean otros estudios por imágenes. Un escáner de MRI es un cilindro o tubo que contiene un imán grande y muy potente. Usted se acuesta sobre una mesa que se desliza dentro del tubo, y la máquina le rodea con un campo magnético potente. La máquina utiliza una poderosa fuerza magnética y emite una ráfaga de ondas de radiofrecuencia para recoger las señales del núcleo (centros) de los átomos de hidrógeno en su cuerpo. Una computadora convierte estas señales en una imagen en blanco y negro.
These are slides for an introductory lecture on fMRI/MRI and analysis of fMRI data. The corresponding tutorial is available on my website kathiseidlrathkopf.com
Here I discussed about the concept,types, types of images obtained, the advantages and disadvantages of MRI shortly...anyone who wants to know about MRI just go through it. I just prepared it in very simple language for the convenience of the readers all over the world. Thank you.
MRI uses a strong magnetic field and radio waves to create detailed images of the organs and tissues within the body.
Developed by the Lauterbur in 1972 at Stony brook in New York.
MRI does not involve radiation
MRI contrasting agent is less likely to produce an allergic reaction that may occur when iodine-based substances are used for x-rays and CT scans
MRI gives extremely clear, detailed images of soft-tissue structures that other imaging techniques cannot achieve
The MRI machine cannot just simply “see the hydrogen nuclei which lie “hidden” in the water molecules distributed in the patient.
It needs to do ‘something’ to the hydrogen nuclei to detect their presence.
Title: Sense of Smell
Presenter: Dr. Faiza, Assistant Professor of Physiology
Qualifications:
MBBS (Best Graduate, AIMC Lahore)
FCPS Physiology
ICMT, CHPE, DHPE (STMU)
MPH (GC University, Faisalabad)
MBA (Virtual University of Pakistan)
Learning Objectives:
Describe the primary categories of smells and the concept of odor blindness.
Explain the structure and location of the olfactory membrane and mucosa, including the types and roles of cells involved in olfaction.
Describe the pathway and mechanisms of olfactory signal transmission from the olfactory receptors to the brain.
Illustrate the biochemical cascade triggered by odorant binding to olfactory receptors, including the role of G-proteins and second messengers in generating an action potential.
Identify different types of olfactory disorders such as anosmia, hyposmia, hyperosmia, and dysosmia, including their potential causes.
Key Topics:
Olfactory Genes:
3% of the human genome accounts for olfactory genes.
400 genes for odorant receptors.
Olfactory Membrane:
Located in the superior part of the nasal cavity.
Medially: Folds downward along the superior septum.
Laterally: Folds over the superior turbinate and upper surface of the middle turbinate.
Total surface area: 5-10 square centimeters.
Olfactory Mucosa:
Olfactory Cells: Bipolar nerve cells derived from the CNS (100 million), with 4-25 olfactory cilia per cell.
Sustentacular Cells: Produce mucus and maintain ionic and molecular environment.
Basal Cells: Replace worn-out olfactory cells with an average lifespan of 1-2 months.
Bowman’s Gland: Secretes mucus.
Stimulation of Olfactory Cells:
Odorant dissolves in mucus and attaches to receptors on olfactory cilia.
Involves a cascade effect through G-proteins and second messengers, leading to depolarization and action potential generation in the olfactory nerve.
Quality of a Good Odorant:
Small (3-20 Carbon atoms), volatile, water-soluble, and lipid-soluble.
Facilitated by odorant-binding proteins in mucus.
Membrane Potential and Action Potential:
Resting membrane potential: -55mV.
Action potential frequency in the olfactory nerve increases with odorant strength.
Adaptation Towards the Sense of Smell:
Rapid adaptation within the first second, with further slow adaptation.
Psychological adaptation greater than receptor adaptation, involving feedback inhibition from the central nervous system.
Primary Sensations of Smell:
Camphoraceous, Musky, Floral, Pepperminty, Ethereal, Pungent, Putrid.
Odor Detection Threshold:
Examples: Hydrogen sulfide (0.0005 ppm), Methyl-mercaptan (0.002 ppm).
Some toxic substances are odorless at lethal concentrations.
Characteristics of Smell:
Odor blindness for single substances due to lack of appropriate receptor protein.
Behavioral and emotional influences of smell.
Transmission of Olfactory Signals:
From olfactory cells to glomeruli in the olfactory bulb, involving lateral inhibition.
Primitive, less old, and new olfactory systems with different path
Adv. biopharm. APPLICATION OF PHARMACOKINETICS : TARGETED DRUG DELIVERY SYSTEMSAkankshaAshtankar
MIP 201T & MPH 202T
ADVANCED BIOPHARMACEUTICS & PHARMACOKINETICS : UNIT 5
APPLICATION OF PHARMACOKINETICS : TARGETED DRUG DELIVERY SYSTEMS By - AKANKSHA ASHTANKAR
micro teaching on communication m.sc nursing.pdfAnurag Sharma
Microteaching is a unique model of practice teaching. It is a viable instrument for the. desired change in the teaching behavior or the behavior potential which, in specified types of real. classroom situations, tends to facilitate the achievement of specified types of objectives.
Integrating Ayurveda into Parkinson’s Management: A Holistic ApproachAyurveda ForAll
Explore the benefits of combining Ayurveda with conventional Parkinson's treatments. Learn how a holistic approach can manage symptoms, enhance well-being, and balance body energies. Discover the steps to safely integrate Ayurvedic practices into your Parkinson’s care plan, including expert guidance on diet, herbal remedies, and lifestyle modifications.
Rasamanikya is a excellent preparation in the field of Rasashastra, it is used in various Kushtha Roga, Shwasa, Vicharchika, Bhagandara, Vatarakta, and Phiranga Roga. In this article Preparation& Comparative analytical profile for both Formulationon i.e Rasamanikya prepared by Kushmanda swarasa & Churnodhaka Shodita Haratala. The study aims to provide insights into the comparative efficacy and analytical aspects of these formulations for enhanced therapeutic outcomes.
Tom Selleck Health: A Comprehensive Look at the Iconic Actor’s Wellness Journeygreendigital
Tom Selleck, an enduring figure in Hollywood. has captivated audiences for decades with his rugged charm, iconic moustache. and memorable roles in television and film. From his breakout role as Thomas Magnum in Magnum P.I. to his current portrayal of Frank Reagan in Blue Bloods. Selleck's career has spanned over 50 years. But beyond his professional achievements. fans have often been curious about Tom Selleck Health. especially as he has aged in the public eye.
Follow us on: Pinterest
Introduction
Many have been interested in Tom Selleck health. not only because of his enduring presence on screen but also because of the challenges. and lifestyle choices he has faced and made over the years. This article delves into the various aspects of Tom Selleck health. exploring his fitness regimen, diet, mental health. and the challenges he has encountered as he ages. We'll look at how he maintains his well-being. the health issues he has faced, and his approach to ageing .
Early Life and Career
Childhood and Athletic Beginnings
Tom Selleck was born on January 29, 1945, in Detroit, Michigan, and grew up in Sherman Oaks, California. From an early age, he was involved in sports, particularly basketball. which played a significant role in his physical development. His athletic pursuits continued into college. where he attended the University of Southern California (USC) on a basketball scholarship. This early involvement in sports laid a strong foundation for his physical health and disciplined lifestyle.
Transition to Acting
Selleck's transition from an athlete to an actor came with its physical demands. His first significant role in "Magnum P.I." required him to perform various stunts and maintain a fit appearance. This role, which he played from 1980 to 1988. necessitated a rigorous fitness routine to meet the show's demands. setting the stage for his long-term commitment to health and wellness.
Fitness Regimen
Workout Routine
Tom Selleck health and fitness regimen has evolved. adapting to his changing roles and age. During his "Magnum, P.I." days. Selleck's workouts were intense and focused on building and maintaining muscle mass. His routine included weightlifting, cardiovascular exercises. and specific training for the stunts he performed on the show.
Selleck adjusted his fitness routine as he aged to suit his body's needs. Today, his workouts focus on maintaining flexibility, strength, and cardiovascular health. He incorporates low-impact exercises such as swimming, walking, and light weightlifting. This balanced approach helps him stay fit without putting undue strain on his joints and muscles.
Importance of Flexibility and Mobility
In recent years, Selleck has emphasized the importance of flexibility and mobility in his fitness regimen. Understanding the natural decline in muscle mass and joint flexibility with age. he includes stretching and yoga in his routine. These practices help prevent injuries, improve posture, and maintain mobilit
Local Advanced Lung Cancer: Artificial Intelligence, Synergetics, Complex Sys...Oleg Kshivets
Overall life span (LS) was 1671.7±1721.6 days and cumulative 5YS reached 62.4%, 10 years – 50.4%, 20 years – 44.6%. 94 LCP lived more than 5 years without cancer (LS=2958.6±1723.6 days), 22 – more than 10 years (LS=5571±1841.8 days). 67 LCP died because of LC (LS=471.9±344 days). AT significantly improved 5YS (68% vs. 53.7%) (P=0.028 by log-rank test). Cox modeling displayed that 5YS of LCP significantly depended on: N0-N12, T3-4, blood cell circuit, cell ratio factors (ratio between cancer cells-CC and blood cells subpopulations), LC cell dynamics, recalcification time, heparin tolerance, prothrombin index, protein, AT, procedure type (P=0.000-0.031). Neural networks, genetic algorithm selection and bootstrap simulation revealed relationships between 5YS and N0-12 (rank=1), thrombocytes/CC (rank=2), segmented neutrophils/CC (3), eosinophils/CC (4), erythrocytes/CC (5), healthy cells/CC (6), lymphocytes/CC (7), stick neutrophils/CC (8), leucocytes/CC (9), monocytes/CC (10). Correct prediction of 5YS was 100% by neural networks computing (error=0.000; area under ROC curve=1.0).
ABDOMINAL TRAUMA in pediatrics part one.drhasanrajab
Abdominal trauma in pediatrics refers to injuries or damage to the abdominal organs in children. It can occur due to various causes such as falls, motor vehicle accidents, sports-related injuries, and physical abuse. Children are more vulnerable to abdominal trauma due to their unique anatomical and physiological characteristics. Signs and symptoms include abdominal pain, tenderness, distension, vomiting, and signs of shock. Diagnosis involves physical examination, imaging studies, and laboratory tests. Management depends on the severity and may involve conservative treatment or surgical intervention. Prevention is crucial in reducing the incidence of abdominal trauma in children.
Best Ayurvedic medicine for Gas and IndigestionSwastikAyurveda
Here is the updated list of Top Best Ayurvedic medicine for Gas and Indigestion and those are Gas-O-Go Syp for Dyspepsia | Lavizyme Syrup for Acidity | Yumzyme Hepatoprotective Capsules etc
1. GUIDE: Dr Anil Rathva (AP/RD) Presented By: Dr. Bhishm Sevendra(R1/RD)
2. MRI principle
MRI is based on two basic principles:
1. Atoms with an odd number of protons have spin.
(Pairs of spins tend to cancel, so only atoms with an odd number of protons
have spin )
2. A moving electric charge, be it positive or negative, produces a magnetic field.
++
µµ
There is electric chargeThere is electric charge
on the surface of the proton,on the surface of the proton,
thus creating a small currentthus creating a small current
loop and generating magneticloop and generating magnetic
momentmoment µµ..
3. Body has many such atoms that can act as good MR nuclei (1
H, 13
C, 19
F, 23
Na) .
Hydrogen nuclei is one of them which is not only positively charged, but
also has magnetic spin.
MRI utilizes this magnetic spin property of protons of hydrogen to elicit
images
4. WHY HYDROGEN IONS???
Hydrogen nucleus has an unpaired proton which is positively charged.
Hydrogen is abundant in the body in the form of water and fat.
Every hydrogen nucleus is a tiny magnet which produces small but
noticeable magnetic field.
Essentially all MRI is hydrogen (proton) imaging.
5. Body in an external magnetic
field (B0)
•In our natural stateIn our natural state Hydrogen ions in body areHydrogen ions in body are
spinning in a haphazard fashion, and cancel allspinning in a haphazard fashion, and cancel all
the magnetism.the magnetism.
•When an external magnetic field is applied protonsWhen an external magnetic field is applied protons
in the body align in one direction.in the body align in one direction.
6. Net magnetization
Half of the protons align along the magnetic field and rest are aligned opposite
population ratio of
parallel versus anti- parallel
protons is more.
These extra protons produce net magnetization vector (M).
Net magnetization depends on B0.
7. Precession
The external magnetic field causes the spinning
proton to ‘wobble’ in a regular manner called
‘PRECESSION.
8. LARMOR EQUATION
How fast the protons precess , this speed can be measured as precession
frequency, that is, how many times the protons precess per second.
9. coordinate system
Using a coordinate system makes the description of proton motion in the
magnetic field easier, and also we can stop drawing the external magnetic field
10. Manipulating the net
magnetization Magnetization can be manipulated by changing the magnetic field environment
(static, gradient, and RF fields)
RF waves (short burst of electromagnetic wave, which is called
a radio frequency (RF) pulse), are used to manipulate the magnetization of H
nuclei.
Energy exchange is possible when protons and the radiofrequency pulse
have the same frequency.
Externally applied RF waves perturb magnetization into different axis (transverse
axis). Only transverse magnetization produces signal.
11. 2 things happen after RF pulse:
1- Energy Absorption
Increase number of High energy Spin down nuclei.
2- Phase Coherence
Proton precesses in transverse plane at Larmor Frequency.
When RF pulse switched of nuclei return to their original state they emit
RF signals which can be detected with the help of receiving coils
12.
13.
14. T1 and T2 relaxation
When RF pulse is stopped higher energy gained by proton is retransmitted and
hydrogen nuclei relax by two mechanisms
T1 or spin lattice relaxation- by which original magnetization (Mz) begins to
recover.
This energy is just handed over to their surroundings, the so called
lattice.
T2 relaxation or spin spin relaxation - by which magnetization in X-Y plane
decays towards zero . It is due to incoherence of H nuclei.
Now we will talk about contrast…
15. T1 relaxation
After protons are
Excited with RF pulse
They move out of
Alignment with B0
But once the RF Pulse
is stopped they Realign
after some Time And
this is called t1 relaxation
T1 is defined as the time it takes for the hydrogen nucleus to recover
63% of its longitudinal magnetization.
16. T2 r: T2 is the time when transverse magnetization decreased to 37%
of the original value.
17.
18. Different tissues have different relaxation times.
These relaxation time differences is used to generate
image contrast.
WATER: long T1 & short T2.
FAT: short T1 & very short T2.
19. TR and TE
TE (echo time) : time interval in which signals are measured after RF excitation
TR (repetition time) : the time between two excitations is called repetition time
By varying the TR and TE one can obtain T1WI and T2WI & proton density
image.
20. A and B are two tissues with different relaxation times. Frame 0 shows the
situation before, frame 1 immediately after a 90° pulse. When we wait for a
long time (TR long) the longitudinal magnetization of both tissues will have
totally recovered (frame 5). A second 90° pulse after this time results in the same
amount of transversal magnetization (frame 6) for both tissues, as was observed after
the first RF pulse (frame 1). the difference in signal is mainly due to different proton
densities, we have a so called proton density (or spin density) weighted image.
21. When we do not wait as long , but send in the second RF pulse after a shorter time
( TR Short), longitudinal magnetization of tissue B, which has the longer T1, has not
recovered as much as that of tissue A with the shorter T1. The transversal
magnetization of the two tissues after the second RF pulse will then be different
(frame 5). Thus, by changing the time between successive RF pulses, we can
influence and modify magnetization and the signal intensity of tissues .this will give
T1 waited image
22. Brain has a shorter longitudinal relaxation time than
CSF. With a short TR the signal intensities of brain
and CSF differ more than after a long TR.
27. T2* DECAY
T2* relaxation – Disturbances in magnetic
field ,magnetic susceptibility, increase the
rate of T2 relaxation.
28. In general a short TR (<1000ms) and short
TE (<45 ms) scan is T1WI
Long TR (>2000ms) and long TE (>45ms)
scan is T2WI
Long TR (>2000ms) and short TE (<45ms)
scan is proton density image
31. What happens , when we choose a long TR, as as all tissues have regained
their full longitudinal magnetization.
When we only choose a very short TE then differences in signal intensity due
to differences in T2 have not yet had time to become pronounced.
The resulting picture is thus neither T1- nor T2-weighted,but mostly
determined by the proton density of the tissues (for this, ideally TE should be
zero).
32. When we wait a long TR and a long TE , differences in T2 have had time
enough to become pronounced, the resulting picture is T2-weighted.
When we wait a shorter time TR, differences in T1 influence tissue contrast
to a larger extent, the picture isT1-weighted, especially when we also
wait a short TE (when signal differences due to differing T2s have not had time
to become pronounced).
34. Signal intensity of tissues having a different T1 depending on the choice of
TR: With a long TR, the saturation recovery sequence, image contrast is
determined mainly by proton (spin)density.
With a shorter TR, the partial saturation sequence, the resulting image is T1-
weighted.
37. The inversion recovery sequence uses a 180° pulse which inverts the longitudinal
magnetization, followed by a 90° pulse after the time TI.
The 90° pulse "tilts“ the magnetization into the transverse (x-y-) plane, so it can
be measured/received.
The tissue with short longitudinal relaxation time goes back to its original
longitudinal magnetization faster, thus has the shorter T1.
this results in less transversal magnetization after the 90° pulse
38. fast imaging sequences
FLASH (Fast Low Angle Shot).
GRASS(Gradient Recalled Acquisition at Steady
State).
39. The TR is the most time consuming parameter of an imaging sequence .
It makes sense to shorten TR if we want to make imaging faster. And this is done
in the fast imaging sequence.
it requires some time to deliver a 180° pulse, and with a very short TR there will
not be enough time between the 90° pulses.
This use a different way to refocus the dephasing spins:
instead of a 180° pulse, we apply a magnetic field gradient. This means that an
uneven magnetic field, a gradient field, is added/superimposed on the existing
magnetic field.
40. This results in even larger magnetic field inhomogenecity.
Due to these larger magnetic field inhomogeneities, transverse magnetization
disappears faster(protons dephase faster).
Then the magnetic gradient is switched off, and after a short time turned back
on with the same strength, but in opposite direction.
This results in some rephasing , and thus the signal increases again to a certain
maximum, which is called a gradient echo.
52. Conventional Inversion Recovery
-180° preparatory pulseis applied to flip the net magnetization vector 180° andnull the
signal from a particular entity (eg, water in tissue).
-When the RF pulse ceases, the spinning nuclei begin to relax.When the net
magnetization vector for water passes the transverseplane (the null point for that
tissue), the conventional 90°pulse is applied, and the SE sequence then continues
as before.
-The interval between the 180° pulse and the 90°pulse is the TI ( Inversion Time).
53. Conventional Inversion Recovery Contd:
At TI, the net magnetization vector of water is very weak, whereas that for body
tissues is strong. When the net magnetization vectors are flipped by the 90°
pulse, there is little or no transverse magnetization in water, so no signal is
generated (fluid appears dark), whereas signal intensity ranges from low to high
in tissues with a stronger NMV.
Two important clinical implementations of the inversion recovery concept are:
Short TI inversion-recovery (STIR) sequence
Fluid-attenuated inversion-recovery (FLAIR) sequence.
54. Short TI inversion-recovery (STIR) sequence
In STIR sequences, an inversion-recovery pulse is used to nullthe signal from
fat (180° RF Pulse).
When NMVof fat passes its null point , 90° RF pulse is applied. As little or no
longitudinalmagnetization is present and the transverse magnetizationis
insignificant.
It is transverse magnetization thatinduces an electric current in the receiver coil
so no signal is generated from fat.
STIRsequences provide excellent depiction of bone marrow edema which may
be the only indication of an occult fracture.
Unlikeconventional fat-saturation sequences STIRsequences are not affected by
magnetic field inhomogeneities,so they are more efficient for nulling the signal
from fat
55. Comparison of fast SE and STIR sequences
for depiction of bone marrow edema
FSE STIR
56. Fluid-attenuated inversion recovery
(FLAIR)
First described in 1992 and has become one of the corner stones of brain MR
imaging protocols
An IR sequence with a long TR and TE and an inversion time (TI) that is tailored
to null the signal from CSF
In contrast to real image reconstruction, negative signals are recorded as positive
signals of the same strength so that the nulled tissue remains dark and all other
tissues have higher signal intensities.
57. Most pathologic processes show increased SI on T2-WI, and the conspicuity of
lesions that are located close to interfaces b/w brain parenchyma and CSF may be
poor in conventional SE or FSE T2-WI sequences.
FLAIR images are heavily T2-weighted with CSF signal suppression, highlights
hyperintense lesions and improves their conspicuity and detection, especially when
located adjacent to CSF containing spaces
58. In addition to T2- weightening, FLAIR possesses considerable T1-weighting,
because it largely depends on longitudinal magnetization
As small differences in T1 characteristics are accentuated, mild T1-shortening
becomes conspicuous.
This effect is prominent in the CSF-containing spaces, where increased protein
content results in high SI (eg, associated with sub- arachnoid space disease)
High SI of hyperacute SAH is caused by T2 prolongation in addition to T1
shortening
59. Clinical Applications:
Used to evaluate diseases affecting the brain parenchyma neighboring the CSF-
containing spaces for eg: MS & other demyelinating disorders.
Unfortunately, less sensitive for lesions involving the brainstem & cerebellum,
owing to CSF pulsation artifacts
Helpful in evaluation of neonates with perinatal HIE.
Useful in evaluation of gliomatosis cerebri owing to its superior delineation of
neoplastic spread
Useful for differentiating extra-axial masses eg. epidermoid cysts from
arachnoid cysts. However, distinction is more easier & reliable with DWI.
60. Mesial temporal sclerosis: m/c pathology in patients with partial complex seizures.
Thin-section coronal FLAIR is the standard sequence in these patients & seen as a
bright small hippocampus on dark background of suppressed CSF-containing
spaces. However, normally also mesial temporal lobes have mildly increased SI on
FLAIR images.
Focal cortical dysplasia of Taylor’s balloon cell type- markedly hyperintense
funnel-shaped subcortical zone tapering toward the lateral ventricle is the
characteristic FLAIR imaging finding
In tuberous sclerosis- detection of hamartomatous lesions, is easier with FLAIR
than with PD or T2-W sequences
61. Embolic infarcts- Improved visualization
Chronic infarctions- typically dark with a rim of high signal. Bright peripheral zone
corresponds to gliosis, which is well seen on FLAIR and may be used to
distinguish old lacunar infarcts from dilated perivascular spaces.
63. Subarachnoid Hemorrhage (SAH):
FLAIR imaging surpasses even CT in the detection of traumatic supratentorial
SAH.
It has been proposed that MR imaging with FLAIR, gradient-echo T2*-
weighted, and rapid high-spatial resolution MR angiography could be used to
evaluate patients with suspected acute SAH, possibly obviating the need for CT
and intra-arterial angiography.
With the availability of high-quality CT angiography, this approach may not be
necessary.
66. Diffusion-weighted MRI
Diffusion-weighted MRI is a example of endogenous contrast, using
the motion of protons to produce signal changes
DWI images is obtained by applying pairs of opposing and balanced
magnetic field gradients (but of differing durations and amplitudes)
around a spin-echo refocusing pulse of a T2 weighted sequence.
Stationary water molecules are unaffected by the paired gradients, and
thus retain their signal. Nonstationary water molecules acquire phase
information from the first gradient, but are not rephased by the second
gradient, leading to an overall loss of the MR signal
67. • The normal motion of water molecules within living tissues is random
(brownian motion).
• In acute stroke, there is an alteration of homeostasis
• Acute stroke causes excess intracellular water accumulation, or cytotoxic
edema, with an overall decreased rate of water molecular diffusion within
the affected tissue.
• Reduction of extracellular space
• Tissues with a higher rate of diffusion undergo a greater loss of signal in a
given period of time than do tissues with a lower diffusion rate.
• Therefore, areas of cytotoxic edema, in which the motion of water
molecules is restricted, appear brighter on diffusion-weighted images
because of lesser signal losses
Restriction of DWI is not specific for stroke
68. description T1 T2 FLAIR DWI ADC
White matter high low intermediate low low
Grey matter intermediate intermediate high intermediate intermediate
CSF low high low low high
69. DW images usually performed with echo-planar sequences which
markedly decrease imaging time, motion artifacts and increase sensitivity
to signal changes due to molecular motion.
The primary application of DW MR imaging has been in brain imaging,
mainly because of its exquisite sensitivity to early detection of ischemic
stroke
70. The increased sensitivity of diffusion-weighted MRI in detecting
acute ischemia is thought to be the result of the water shift
intracellularly restricting motion of water protons (cytotoxic edema),
whereas the conventional T2 weighted images show signal alteration
mostly as a result of vasogenic edema
71. • Core of infarct = irreversible damage
• Surrounding ischemic area may be salvaged
• DWI: open a window of opportunity during which Tt is beneficial
• Regions of high mobility “rapid diffusion” dark
• Regions of low mobility “slow diffusion” bright
• Difficulty: DWI is highly sensitive to all of types of motion (blood flow,
pulsatility, patient motion).
75. Apparent Diffusion Coefficient
It is a measure of diffusion
Calculated by acquiring two or more images with a different gradient
duration and amplitude (b-values)
To differentiate T2 shine through effects or artifacts from real ischemic
lesions.
The lower ADC measurements seen with early ischemia,
An ADC map shows parametric images containing the apparent diffusion
coefficients of diffusion weighted images. Also called diffusion map
76. The ADC may be useful for estimating the lesion age and
distinguishing acute from subacute DWI lesions.
Acute ischemic lesions can be divided into hyperacute lesions (low
ADC and DWI-positive) and subacute lesions (normalized ADC).
Chronic lesions can be differentiated from acute lesions by
normalization of ADC and DWI.
a tumour would exhibit more restricted apparent diffusion
compared with a cyst because intact cellular membranes in a
tumour would hinder the free movement of water molecules
77. Nonischemic causes for decreased
ADC
Abscess
Lymphoma and other tumors
Multiple sclerosis
Seizures
Metabolic (Canavans )
79. Evaluation of acute stroke on DWI
The DWI and ADC maps show changes in ischemic brain within
minutes to few hours
The signal intensity of acute stroke on DW images increase
during the first week after symptom onset and decrease
thereafter, but signal remains hyper intense for a long period
(up to 72 days in the study by Lausberg et al)
The ADC values decline rapidly after the onset of ischemia and
subsequently increase from dark to bright 7-10 days later .
This property may be used to differentiate the lesion older than
10 days from more acute ones (Fig 2).
Chronic infarcts are characterized by elevated diffusion and
appear hypo, iso or hyper intense on DW images and
hyperintense on ADC maps
80.
81. DW MR imaging characteristics of Various Disease Entities
MR Signal Intensity
Disease DW Image ADC Image ADC Cause
Acute Stroke High Low Restricted Cytotoxic edema
Chronic Strokes Variable High Elevated Gliosis
Hypertensive
encephalopathy
Variable High Elevated Vasogenic edema
Arachnoid cyst Low High Elevated Free water
Epidermoid mass High Low Restricted Cellular tumor
Herpes encephalitis High Low Restricted Cytotoxic edema
CJD High Low Restricted Cytotoxic edema
MS acute lesions Variable High Elevated Vasogenic edema
Chronic lesions Variable High Elevated Gliosis
82. Clinical Uses of DWI &
ADCStroke:
Hyperacute Stage:- within one hour minimal hyperintensity seen in
DWI and ADC value decrease 30% or more below normal (Usually
<50X10-4
mm2
/sec)
Acute Stage:- Hyperintensity in DWI and ADC value low but after 5-
7days of ictus ADC values increase and return to normal value
(Pseudonormalization)
Subacute to Chronic Stage:- ADC value are increased (Vasogenic
edema) but hyperintensity still seen on DWI (T2 shine effect)
84. GRE
In a GRE sequence, an RF pulse is applied that partly flipsthe NMV
into the transverse plane (variableflip angle).
Gradients, as opposed to RF pulses, are usedto dephase (negative
gradient) and rephase (positive gradients)transverse magnetization.
Because gradients donot refocus field inhomogeneities, GRE
sequences with long TEsare T2* weighted (because of magnetic
susceptibility) ratherthan T2 weighted like SE sequences
85. GRE Sequences contd:
This feature of GRE sequences is exploited- in detection of hemorrhage, as the
iron in Hb becomesmagnetized locally (produces its own local magnetic field)
andthus dephases the spinning nuclei.
The technique is particularlyhelpful for diagnosing hemorrhagic contusions such
as thosein the brain and in pigmented villonodular synovitis.
SE sequences, on the other hand- relativelyimmune from magnetic susceptibility
artifacts, and also lesssensitive in depicting hemorrhage and calcification.
87. GRE Sequences contd:
Magnetic susceptibility imaging-
- Basis of cerebral perfusionstudies, in which the T2* effects (ie, signal decrease)
createdby gadolinium (a metal injected intravenously as a chelatedion in aqueous
solution, typically in the form of gadopentetatedimeglumine) are sensitively
depicted by GRE sequences.
- Also used in blood oxygenationlevel–dependent (BOLD) imaging, in which the
relativeamount of deoxyhemoglobin in the cerebral vasculature is measuredas a
reflection of neuronal activity. BOLD MR imaging is widelyused for mapping of
human brain function.
88. Gradient Echo
Pros:
fast technique
Cons:
More sensitive to magnetic susceptibility
artifacts
Clinical use:
eg. Hemorrhage , calcification
89. Axial T1 (C), T2 (D), and GRE (E) images show corresponding T1-hyperintense and GRE-
hypointense foci with associated T2 hyperintensity (arrows).
91. MR Spectroscopy
Magnetic resonance spectroscopy (MRS) is a means of noninvasive
physiologic imaging of the brain that measures relative levels of
various tissue metabolites
Purcell and Bloch (1952) first detected NMR signals from magnetic
dipoles of nuclei when placed in an external magnetic field.
Initial in vivo brain spectroscopy studies were done in the early 1980s.
Today MRS-in particular, IH MRS-has become a valuable physiologic
imaging tool with wide clinical applicability.
92. PRINCIPLES:
The radiation produced by any substance is dependent on its atomic composition.
Spectroscopy is the determination of this chemical composition of a substance by
observing the spectrum of electromagnetic energy emerging from or through it.
NMR is based on the principle that some nuclei have associated magnetic spin
properties that allow them to behave like small magnet.
In the presence of an externally applied magnetic field, the magnetic nuclei
interact with that field and distribute themselves to different energy levels.
These energy states correspond to the proton nuclear spins, either aligned in the
direction of (low-energy spin state) or against the applied magnetic field (high-
energy spin state).
93. If energy is applied to the system in the form of a radiofrequency (RF) pulse
that exactly matches the energy between both states. a condition of
resonance occurs.
Chemical elements having different atomic numbers such as hydrogen ('H)
and phosphorus (31P) resonate at different Larmor RFs.
Small change in the local magnetic field, the nucleus of the atom resonates
at a shifted Larmor RF.
This phenomenon is called the chemical shift.
94. Technique:
Single volume and Multivolume MRS.
1) Single volume:
Stimulated echo acquisition mode (STEAM)
Point-resolved spectroscopy (PRESS)
It gives a better signal-to noise ratio
2) Multivolume MRS:
chemical shift imaging (CSI) or spectroscopic imaging (SI)
much larger area can be covered, eliminating the sampling error to an extent
but significant weakening in the signal-to-noise ratio and a longer scan time.
Time of echo: 35 ms and 144ms.
Resonance frequencies on the x-axis and amplitude (concentration) on the y-
axis.
95. Effect Of TE on the peaks
__________
TE 35ms
___________
___________
TE 144ms
__________
103. MRS
Dec NAA/Cr
Inc acetate,
succinate, amino
acid, lactate
Neuodegenera
tive
Alzheimer
Dec NAA/Cr
Dec NAA/
Cho
Inc
Myo/NAA
Slightly inc Cho/ Cr
Cho/NAA
Normal Myo/NAA
± lipid/lactate
Inc Cho/Cr
Myo/NAA
Cho/NAA
Dec NAA/Cr
± lipid/lactate
Malignancy
Demyelinating
disease Pyogenic
abscess
104. Clinical Applications of MRS:
Class A MRS Applications: Useful in Individual Patients
1) MRS of brain masses:
Distinguish neoplastic from non neoplastic masses
Primary from metastatic masses.
Tumor recurrence vs radiation necrosis
Prognostication of the disease
Mark region for stereotactic biopsy.
Monitoring response to treatment.
Research tool
2) MRS of Inborn Errors of Metabolism
Include the leukodystrophies, mitochondrial disorders, and enzyme defects that cause an absence or
accumulation of metabolites
105. Class B MRS Applications: Occasionally Useful in Individual
Patients
1) Ischemia, Hypoxia, and Related Brain Injuries
Ischemic stroke
Hypoxic ischemic encephalopathy.
2)Epilepsy
Class C Applications: Useful Primarily in Groups of Patients (Research)
HIV disease and the brain
Neurodegenerative disorders
Amyotrophic lateral sclerosis
Multiple sclerosis
Hepatic encephalopathy
Psychiatric disorders
106. MAGNETIZATION TRANSFER (MT) MRI
MT is a recently developed MR technique that alters contrast of tissue on
the basis of macromolecular environments.
MTC is most useful in two basic area, improving image contrast and tissue
characterization.
MT is accepted as an additional way to generate unique contrast in MRI
that can be used to our advantage in a variety of clinical applications.
107. Magnetization transfer (MT) contd:-
Basis of the technique: that the state of magnetization of an atomic nucleus can be
transferred to a like nucleus in an adjacent molecule with different relaxation
characteristics.
Acc. to this theory- H1
proton spins in water molecules can exchange magnetization
with H1
protons of much larger molecules, such as proteins and cell membranes.
Consequence is that the observed relaxation times may reflect not only the
properties of water protons but also, indirectly, the characteristics of the
macromolecular solidlike environment
MT occurs when RF saturation pulses are placed far from the resonant frequency of
water into a component of the broad macromolecular pool.
108. Magnetization transfer (MT) contd:-
These off-resonance pulses, which may be added to standard MR pulse sequences,
reduce the longitudinal magnetization of the restricted protons to zero without
directly affecting the free water protons.
The initial MT occurs between the macromolecular protons and the transiently
bound hydration layer protons on the surface of large molecules’
Saturated bound hydration layer protons then diffuse and mix with the free water
proton pool
Saturation is transferred to the mobile water protons, reducing their longitudinal
magnetization, which results in decreased signal intensity and less brightness on
MR images.
109. Magnetization transfer (MT) contd:-
The MT effect is superimposed on the intrinsic contrast of the baseline image
Amount of signal loss on MT images correlates with the amount of
macromolecules in a given tissue and the efficiency of the magnetization exchange
MT characteristically:
Reduces the SI of some solid like tissues, such as most of the brain and spinal cord
Does not influence liquid like tissues significantly, such as the cerebrospinal fluid
(CSF)
111. CLINICAL
APPLICATION• Useful diagnostic tool in characterization of a variety of CNS infection
• In detection and diagnosis of meningitis , encephalitis, CNS tuberculosis ,
neurocysticercosis and brain abscess.
TUBERCULOMA
• Pre-contrast T1-W MT imaging helps to better assess the disease load in CNS
tuberculosis by improving the detectability of the lesions, with more number
of tuberculomas detected on pre-contrast MT images compared to routine SE
images
• It may also be possible to differentiate T2 hypo intense tuberculoma from T2
hypo intense cysticerus granuloma with the use of MTR, as cysticercus
granulomas show significantly higher MT ratio compared to tuberculomas
113. NEUROCYSTICERCOSIS
Findings vary with the stage of disease
T1-W MT images are also important in demonstrating perilesional gliosis
in treated neurocysticercus lesions
Gliotic areas show low MTR compared to the gray matter and white
matter. So appear as hyperintense
BRAIN ABSCESS
Lower MTR from tubercular abscess wall in comparison to wall of
pyogenic abscess(~20 vs. ~26)
114. Magnetization transfer (MT) contd:-
Qualitative applications:
MR angiography,
postcontrast studies
spine imaging
MT pulses have a greater influence on brain tissue (d/t high conc. of structured
macromolecules such as cholesterol and lipid) than on stationary blood.
By reducing the background signal vessel-to-brain contrast is accentuated,
Not helpful when MR angiography is used for the detection and characterization of
cerebral aneurysms.
115. GRE images of the cervical spine without (A) and with (B) MT
show improved CSF–spinal cord contrast
116. Magnetization transfer (MT) contd:-
Quantitative applications:
Multiple sclerosis: discriminates multiple sclerosis & other demyelinating
disorders, provides measure of total lesion load, assess the spinal cord lesion
burden and to monitor the response to different treatments of multiple sclerosis
systemic lupus erythematosus,
CADASIL (cerebral autosomal dominant arteriopathy with subcortical infarcts and
leukoencephalopathy),
Multiple system atrophy,
Amyotrophic lateral sclerosis,
Schizophrenia
Alzheimer’s disease
117. MTR Quantitative applications contd:
May be used to differentiate between progressive multifocal leukoencephalopathy
and HIV encephalitis
To detect axonal injury in normal appearing splenium of corpus callosum after
head trauma
In chronic liver failure, diffuse MTR abnormalities have been found in normal
appearing brain, which return to normal following liver transplantation
Lipid increase in high-grade gliomas, meningiomas, demyelination, necrotic foci, and inborn errors of metabolism
NAA is the most prominent one in normal
adult brain proton MRS and is used as a reference for
determination of chemical shift and nonspecific
neuronal marker. Normal absolute concentrations of NAA in the adult
brain are generally in the range of 8 to 9 mmol/kg. NAA concentrations
are decreased in many brain disorders, resulting in neuronal
and axonal loss, such as in neurodegenerative diseases,
stroke, brain tumors, epilepsy, and multiple sclerosis, but
are increased in Canavan&apos;s disease
Cr peak is an indirect
indicator of brain intracellular energy stores, tends to be relatively constant in each tissue
type in normal brain, mean
absolute Cr concentration in normal adult brains of 7.49; reduced in all brain tumors, particularly
malignant ones
Cho reflects cell membrane synthesis and
Degradation. Processes resulting in hypercellularity
(e.g., primary brain neoplasms or gliosis) or myelin
breakdown (demyelinating diseases) lead to locally increased
Cho concentration, whereas hypomyelinating diseases
result in decreased Cho levels. Mean absolute Cho concentration in
normal adult brain tissue of 1.32
Ig3 MI is believed to be a glial
marker because it is present primarily in glial cells and is
absent in neurons; abnormally increased in
patients with demyelinating diseases and in those with
Alzheimer&apos;s disease
Lac levels in normal brain tissue are absent or extremely low (C0.5
Mmol/L), they are essentially undetectable on normal spectra. Found in anaerobic glycolysis,
which may be seen with brain neoplasms, infarcts, hypoxia,
metabolic disorders or seizure and accumulate
within cysts or foci of necrosis.