Magnetic resonance imaging (MRI) is described. Key points include:
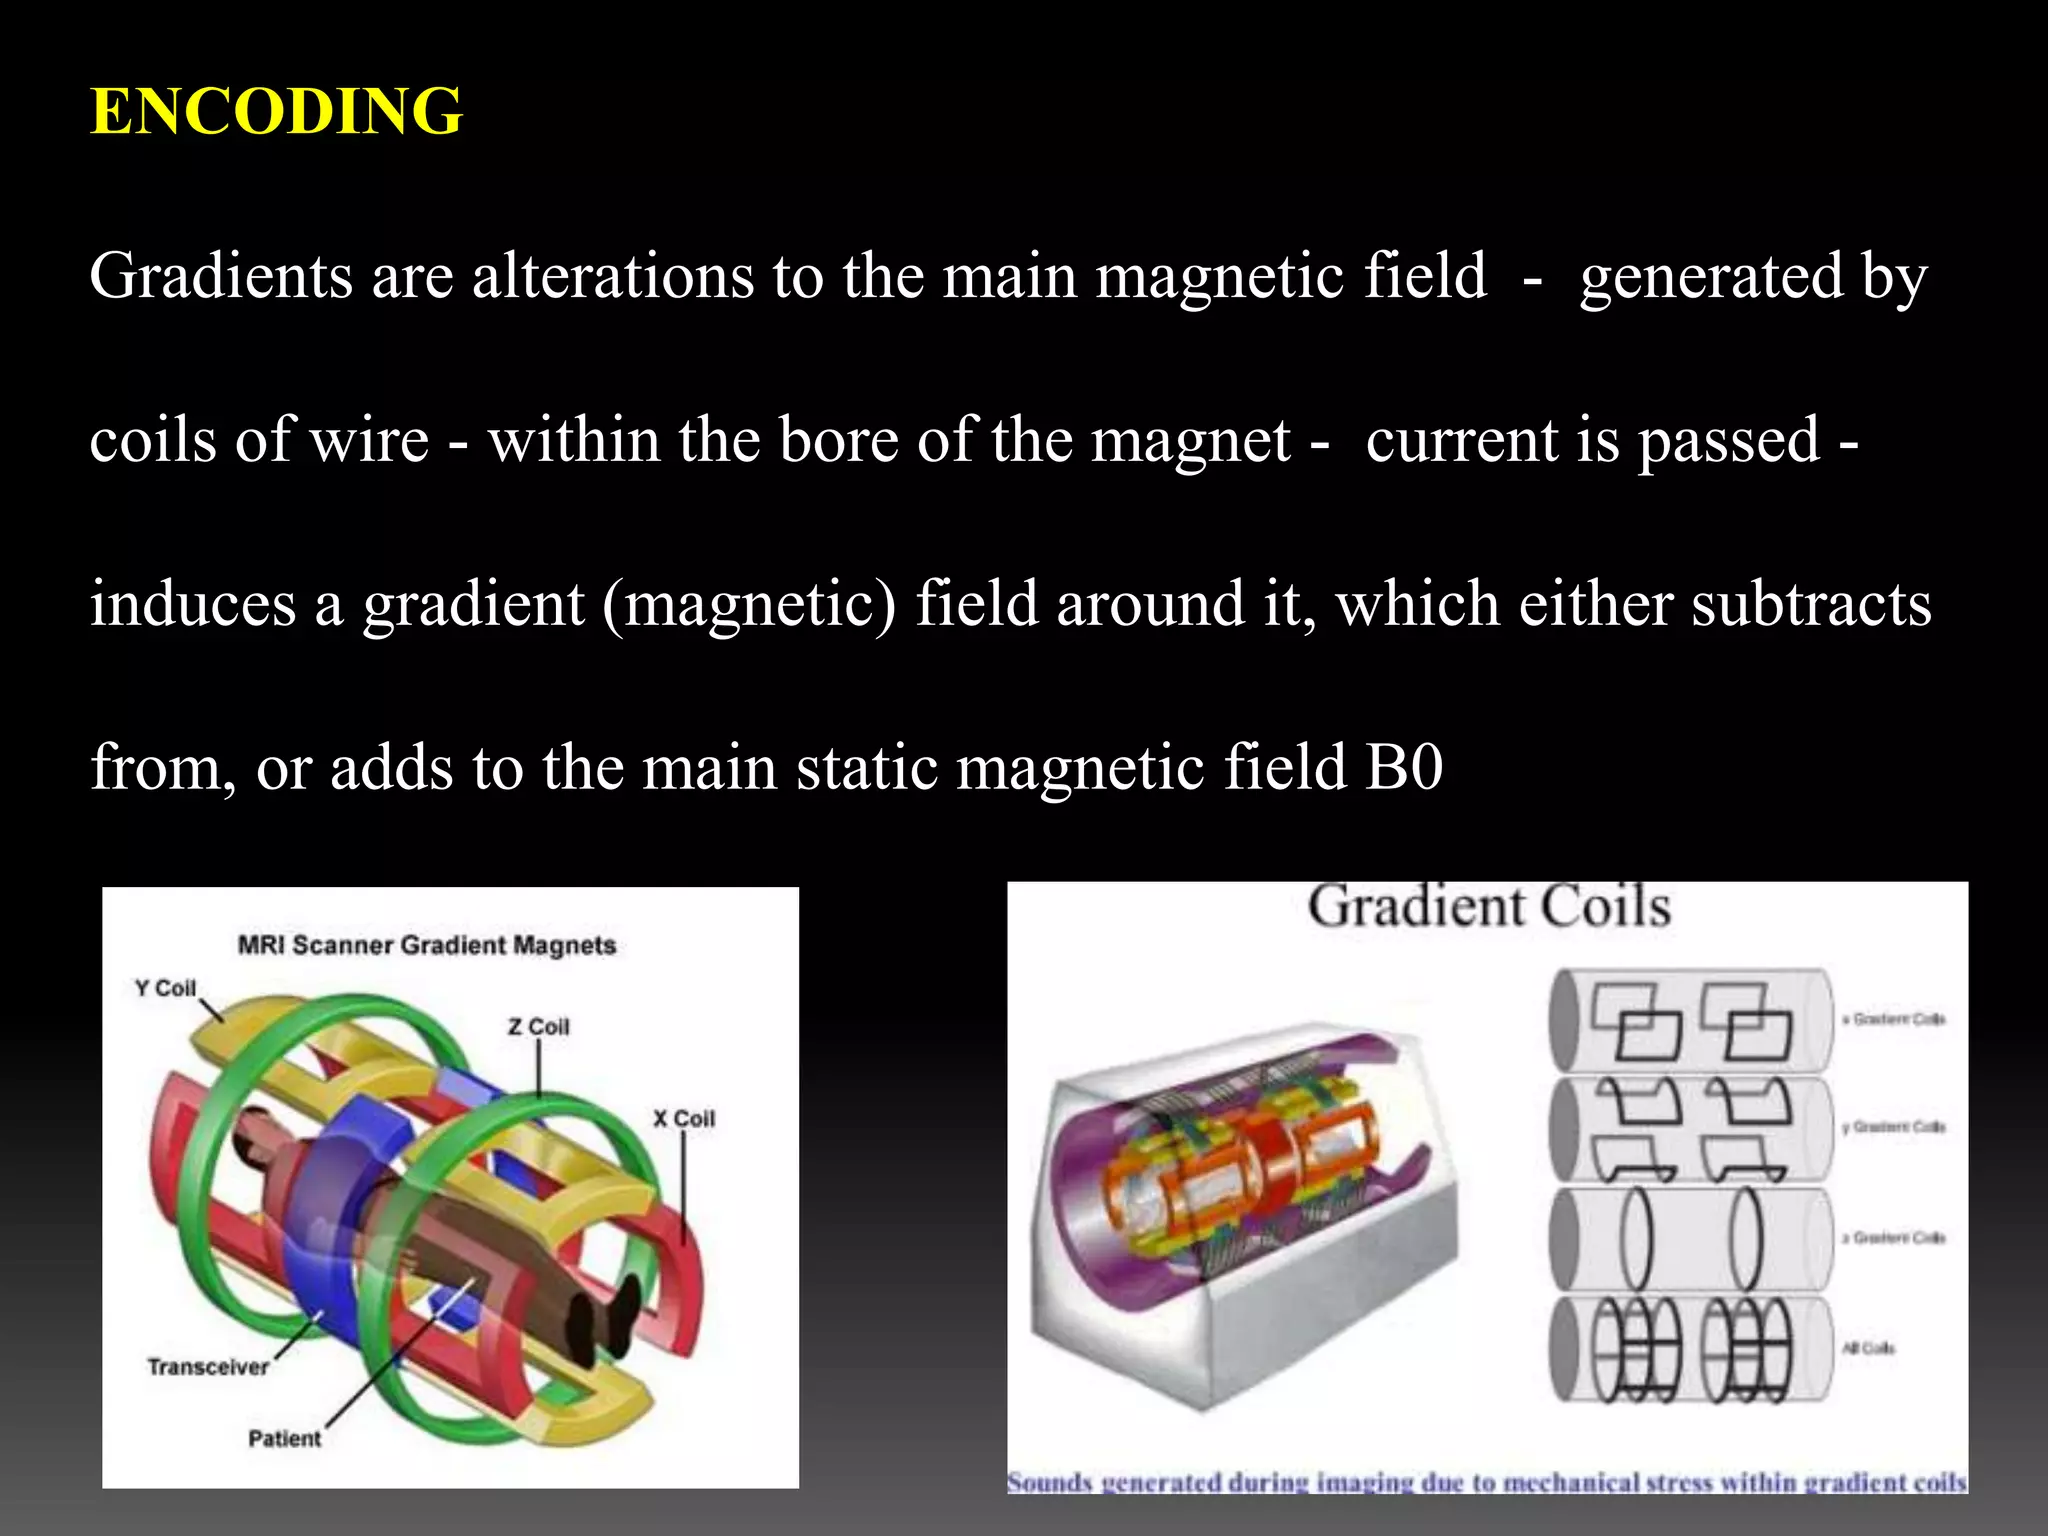
- MRI was developed in the 1970s and clinically used in the 1980s. It uses strong magnetic fields and radio waves to generate images of the body.
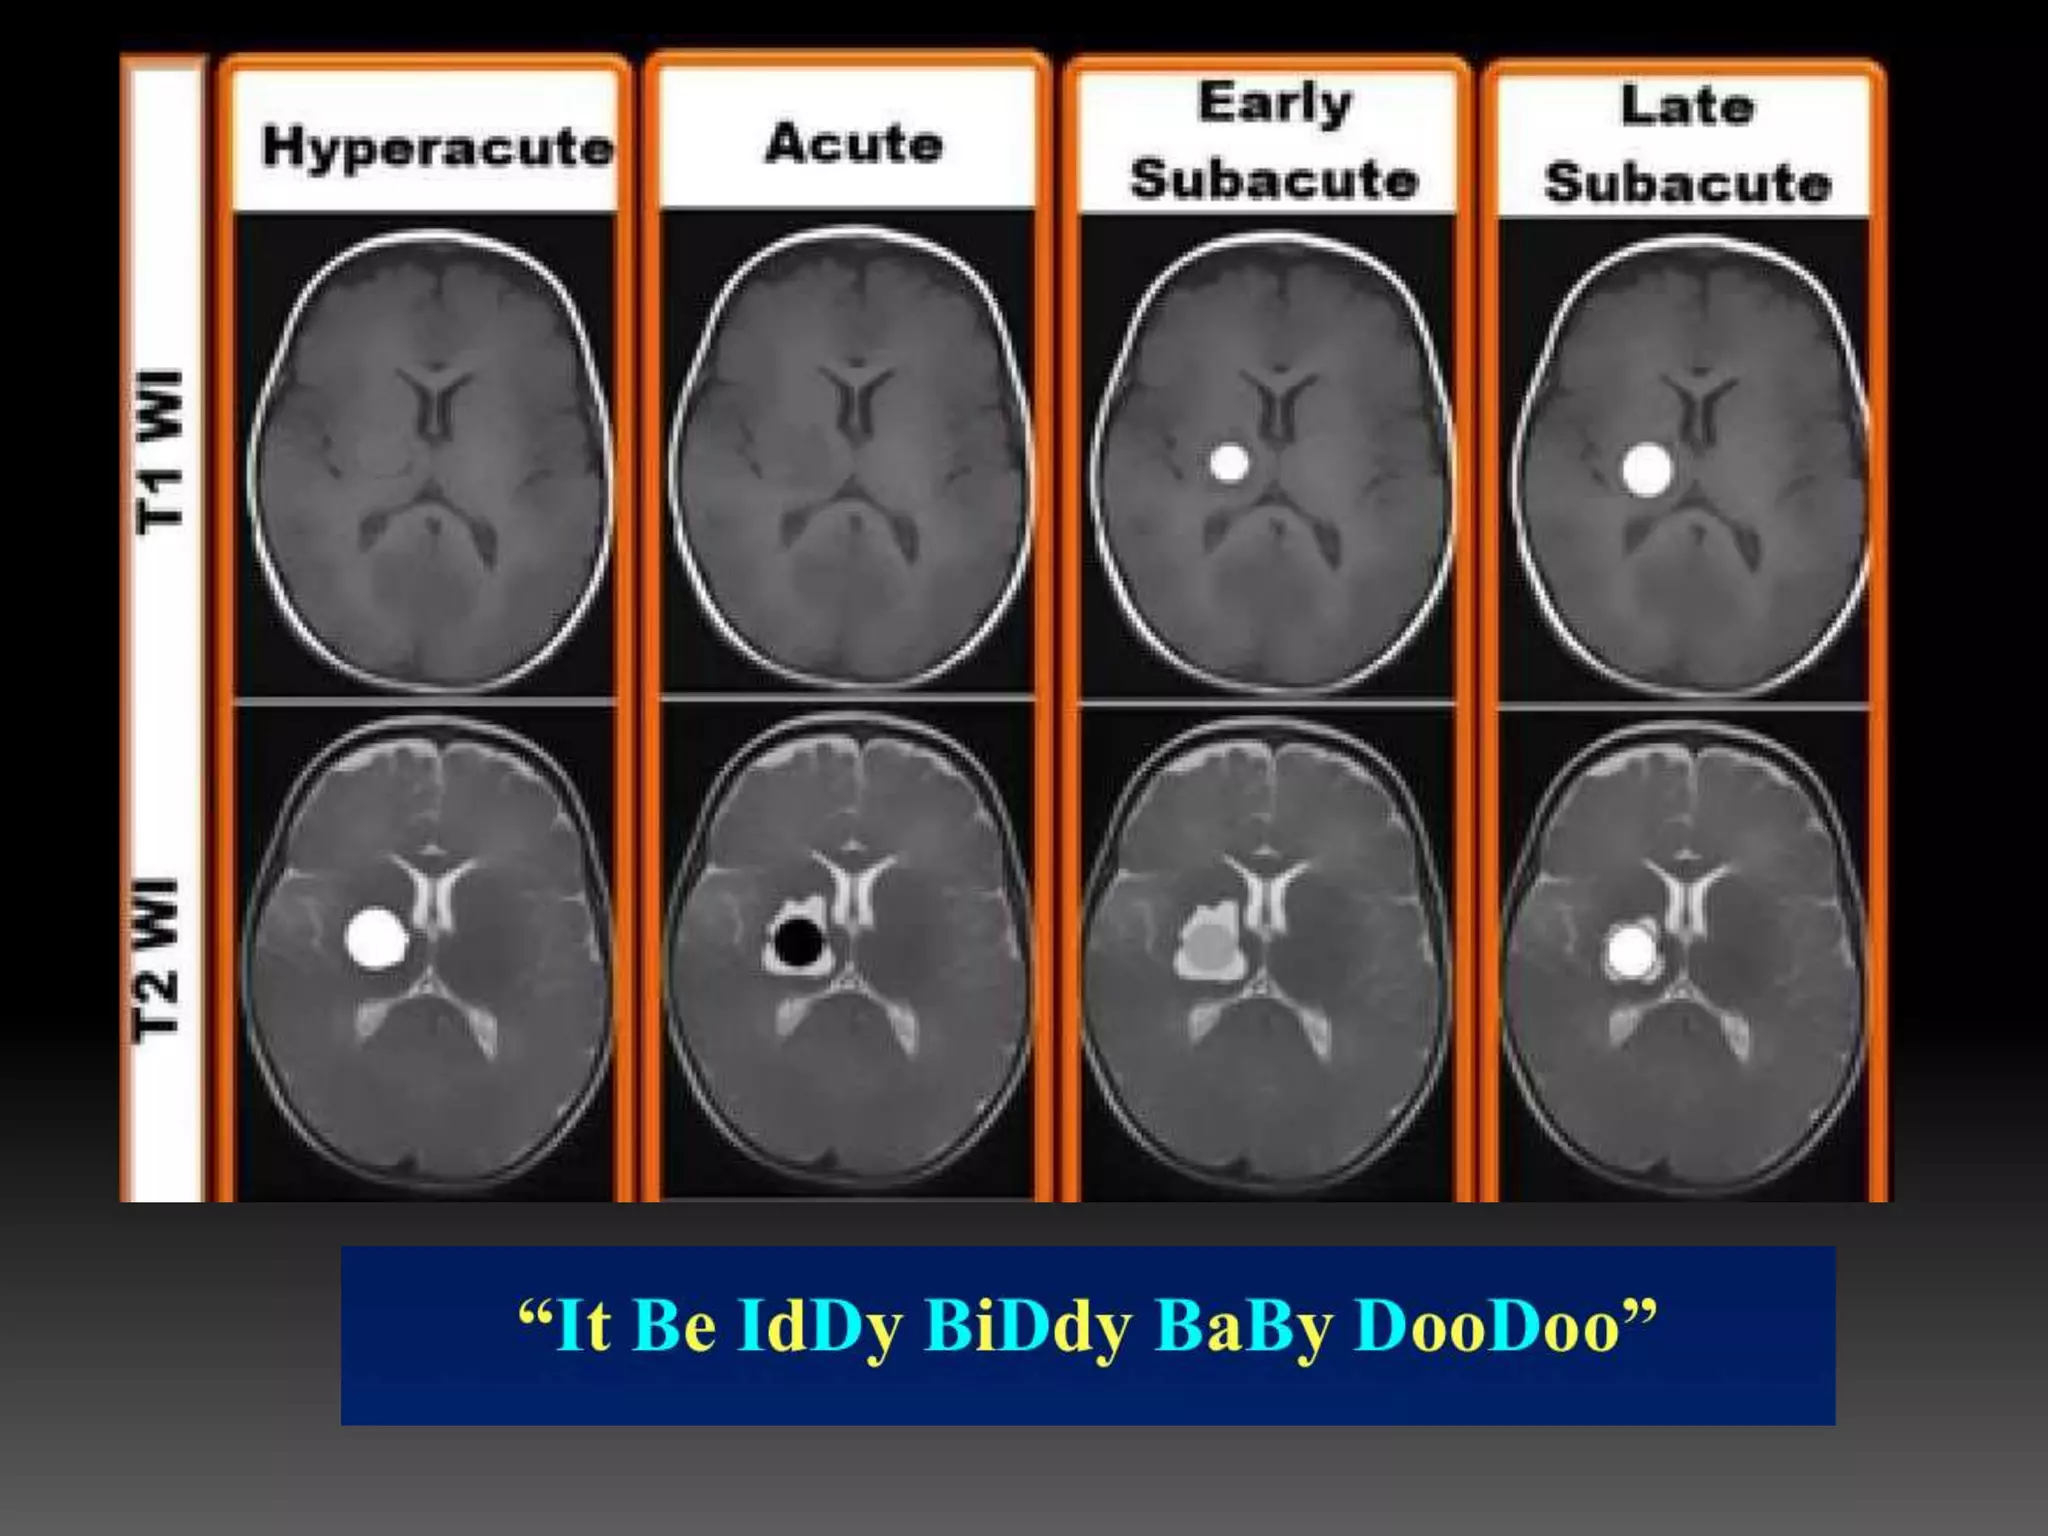
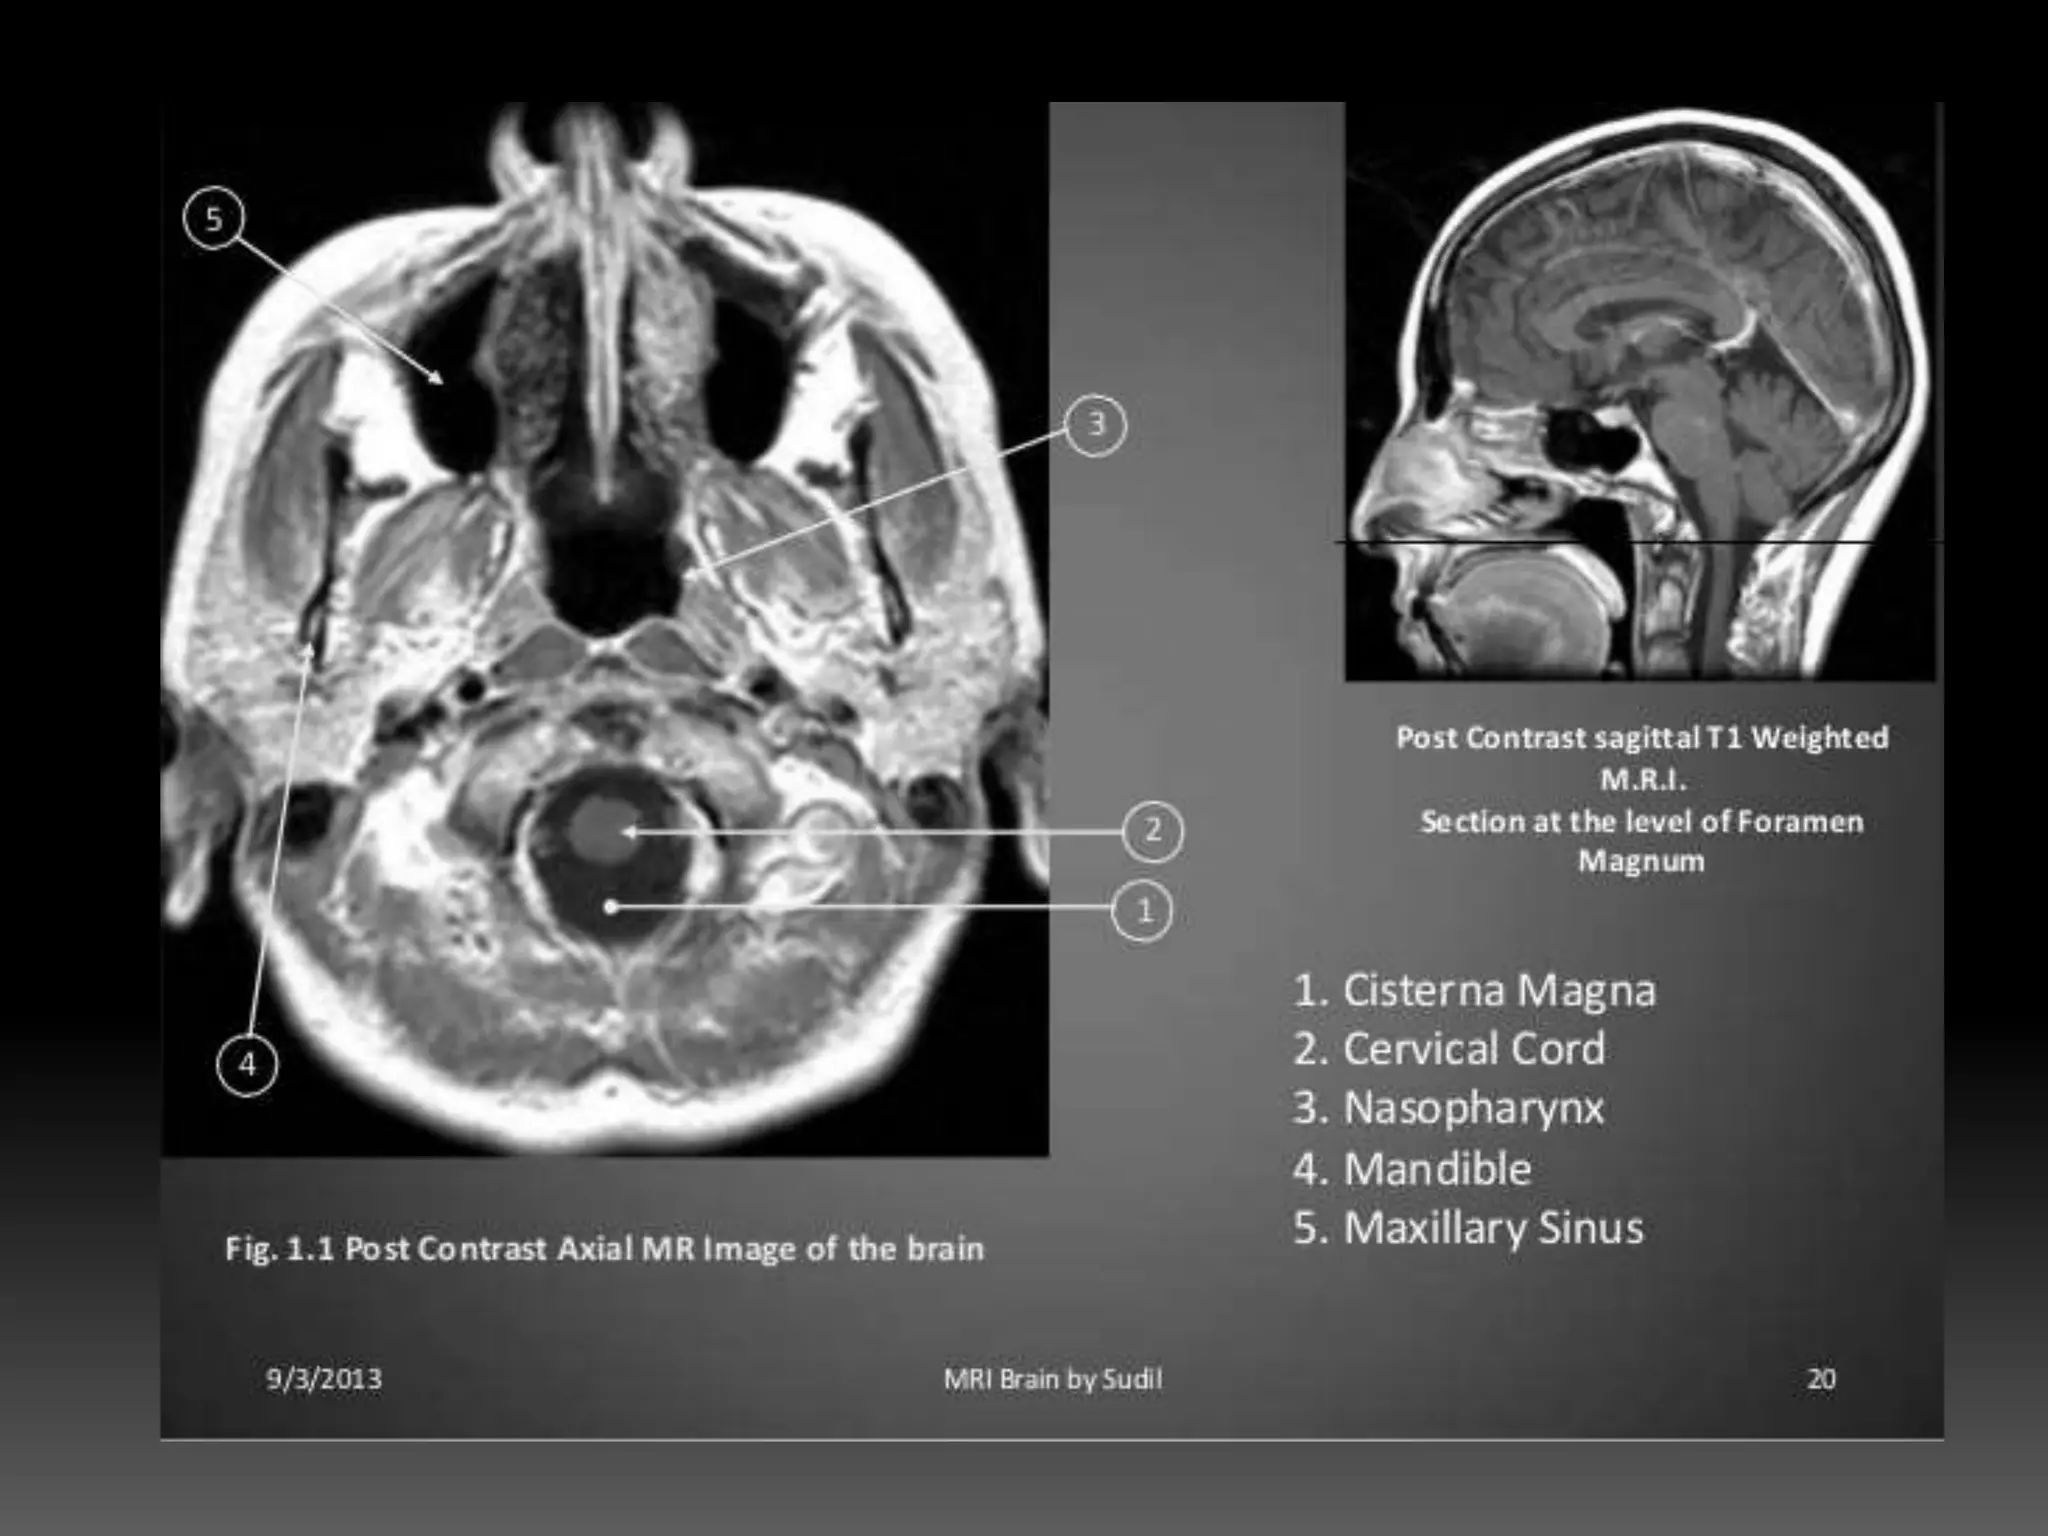
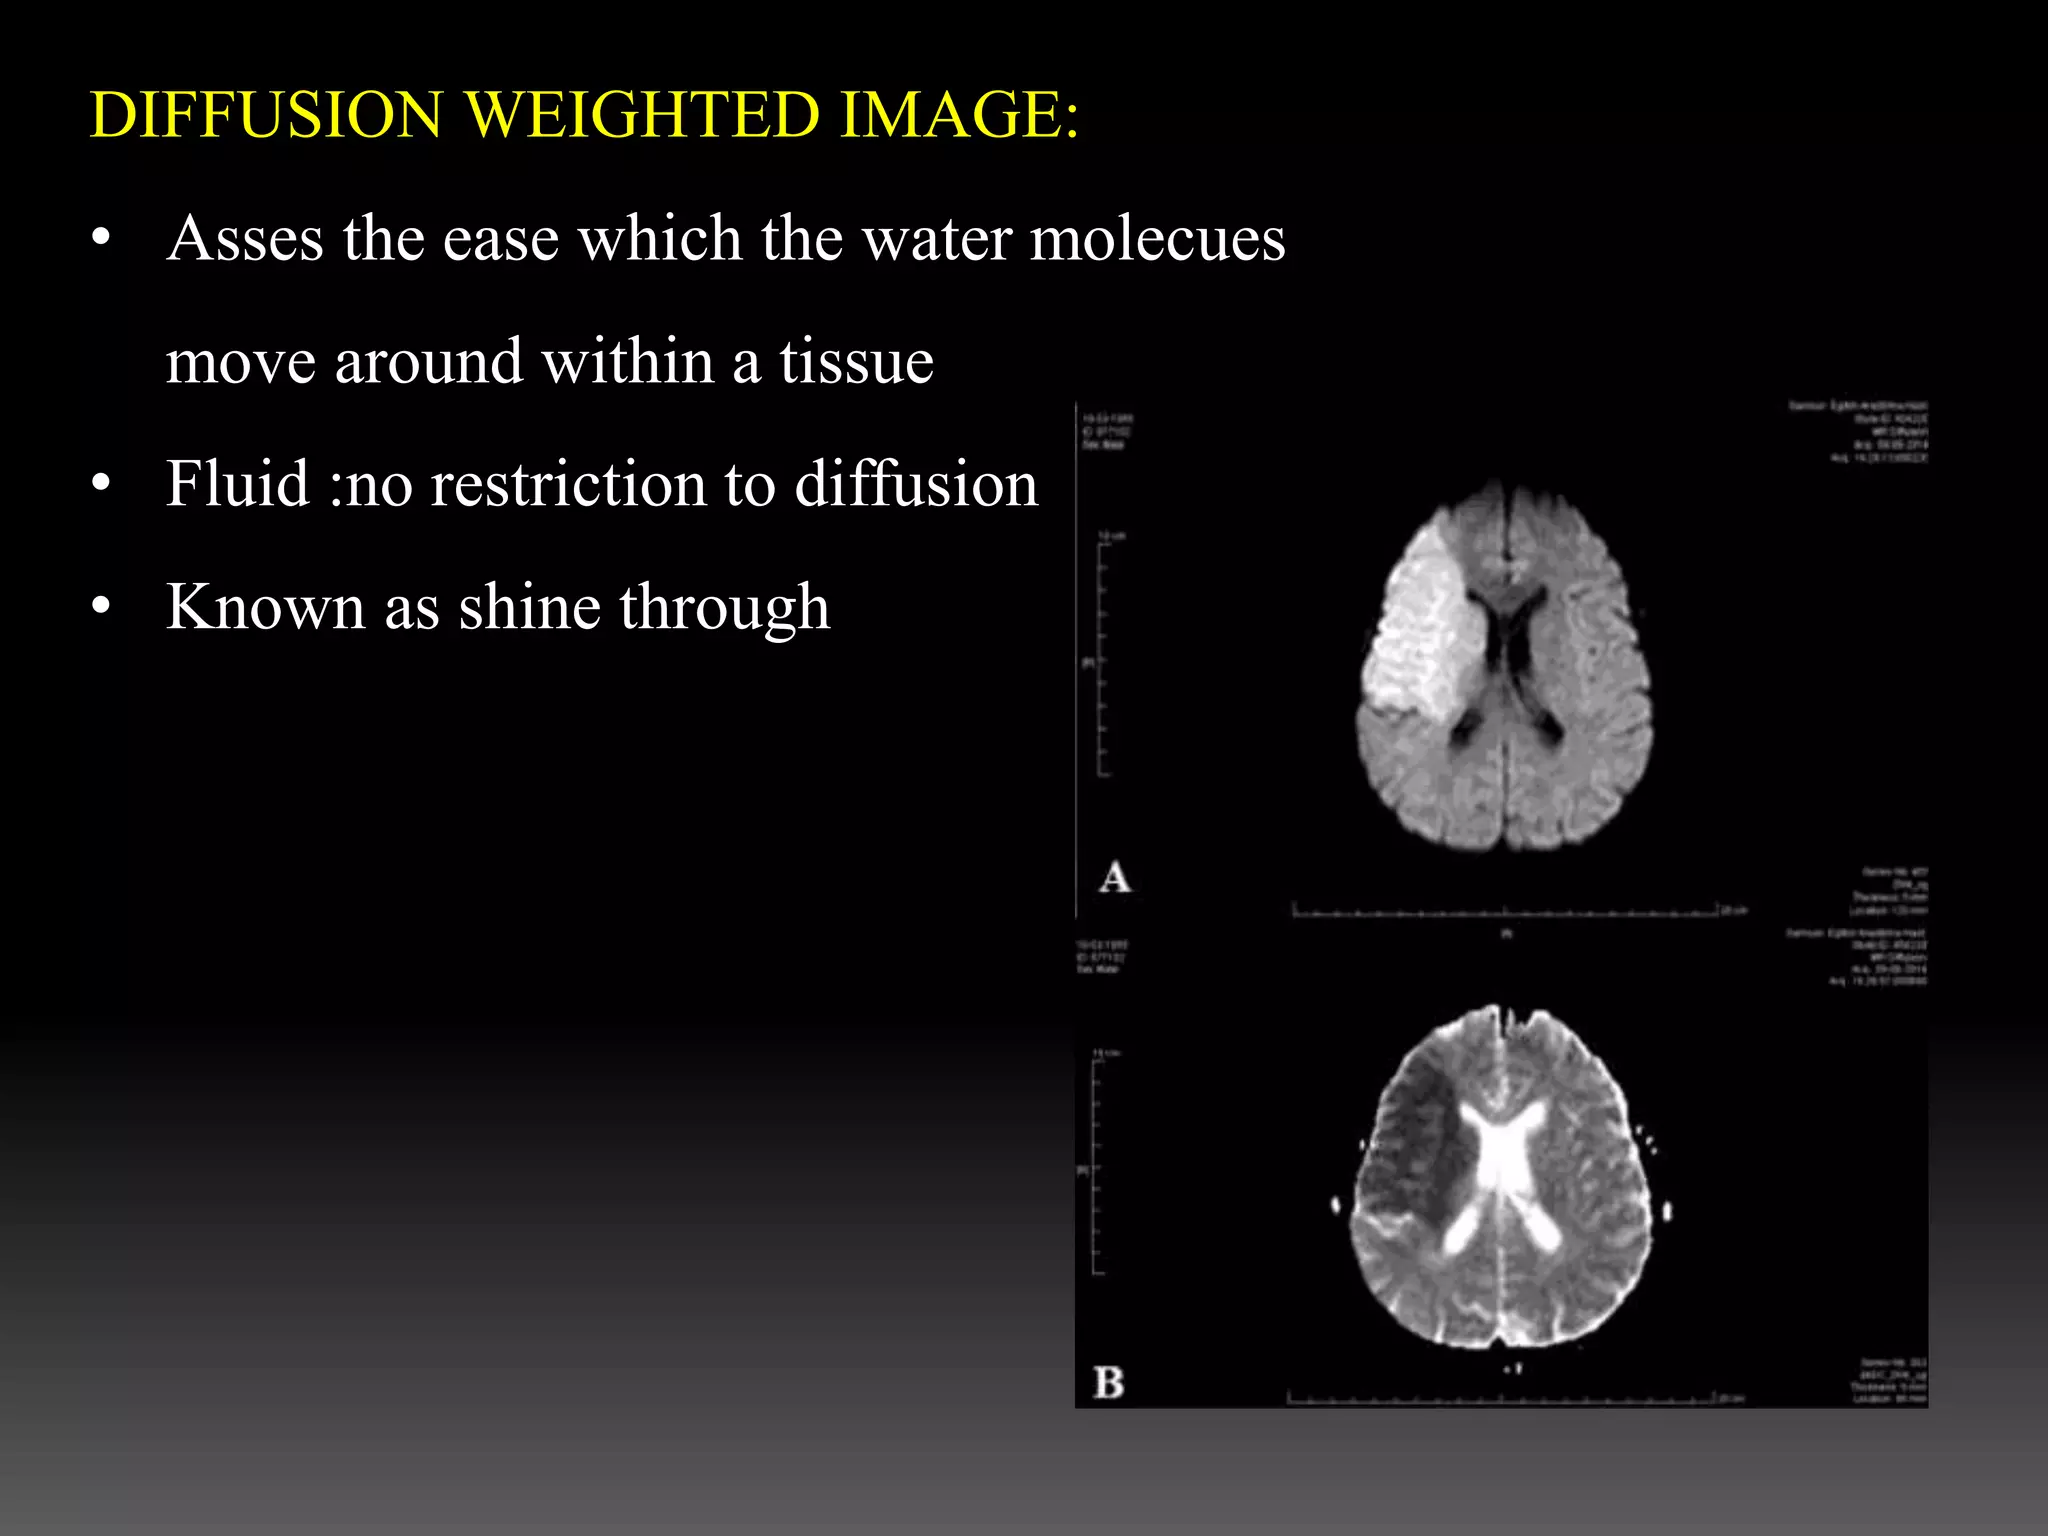
- MRI can be used to assess lesions of the brain, spinal cord, and other soft tissues. It is useful for tumor staging and investigations of the temporomandibular joint.
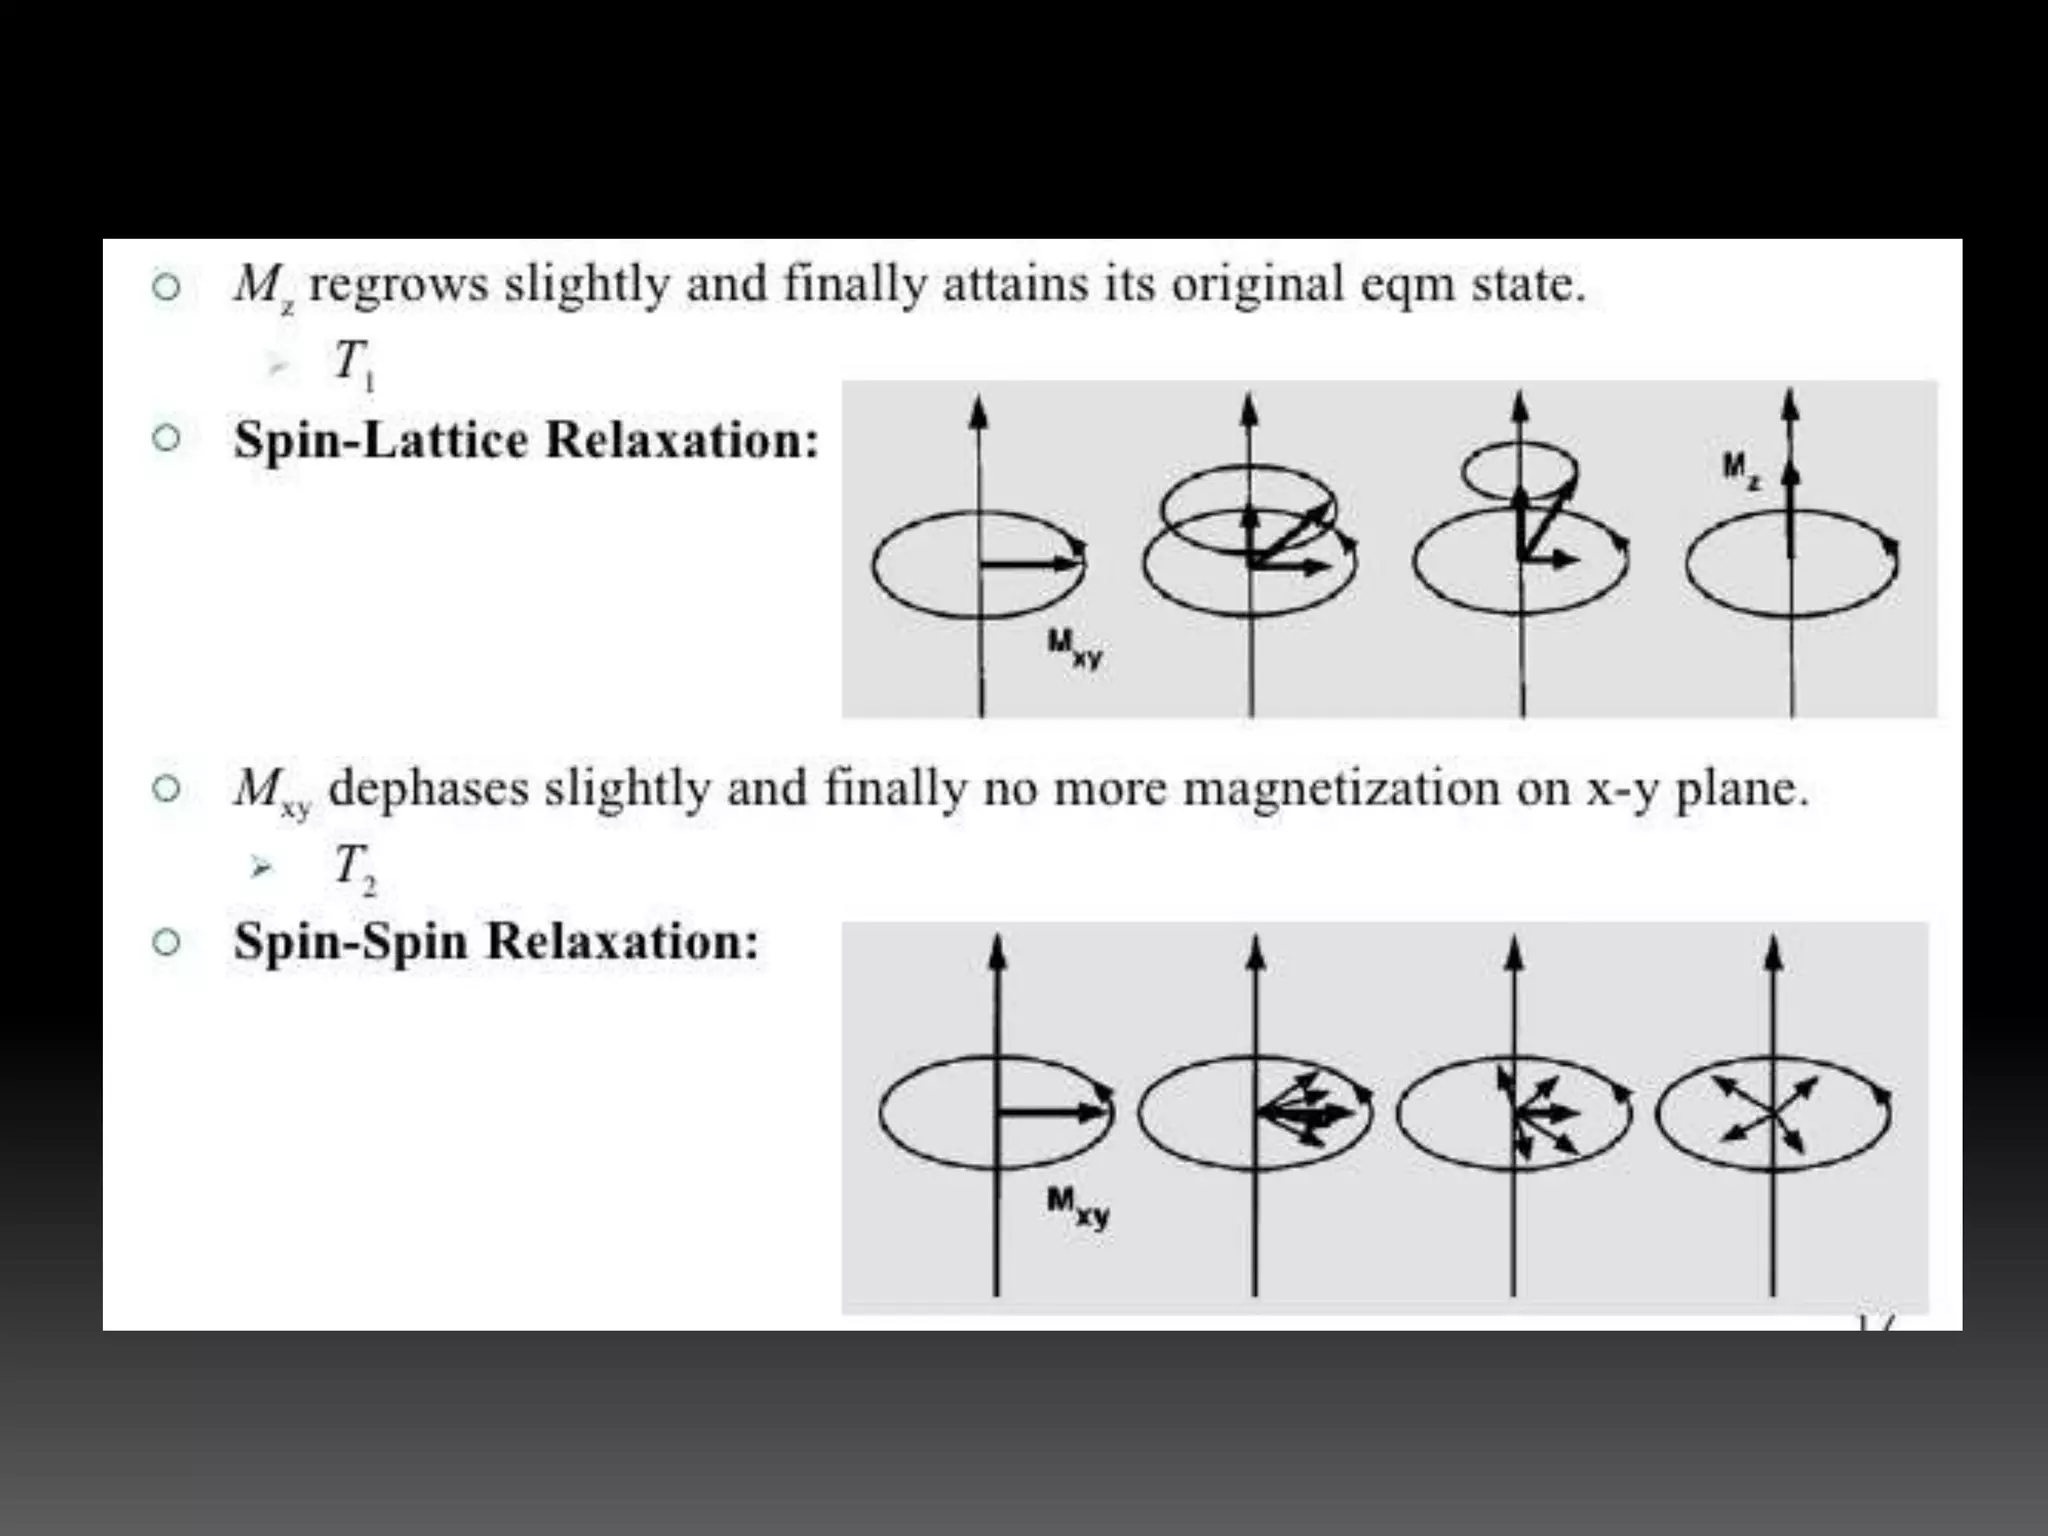
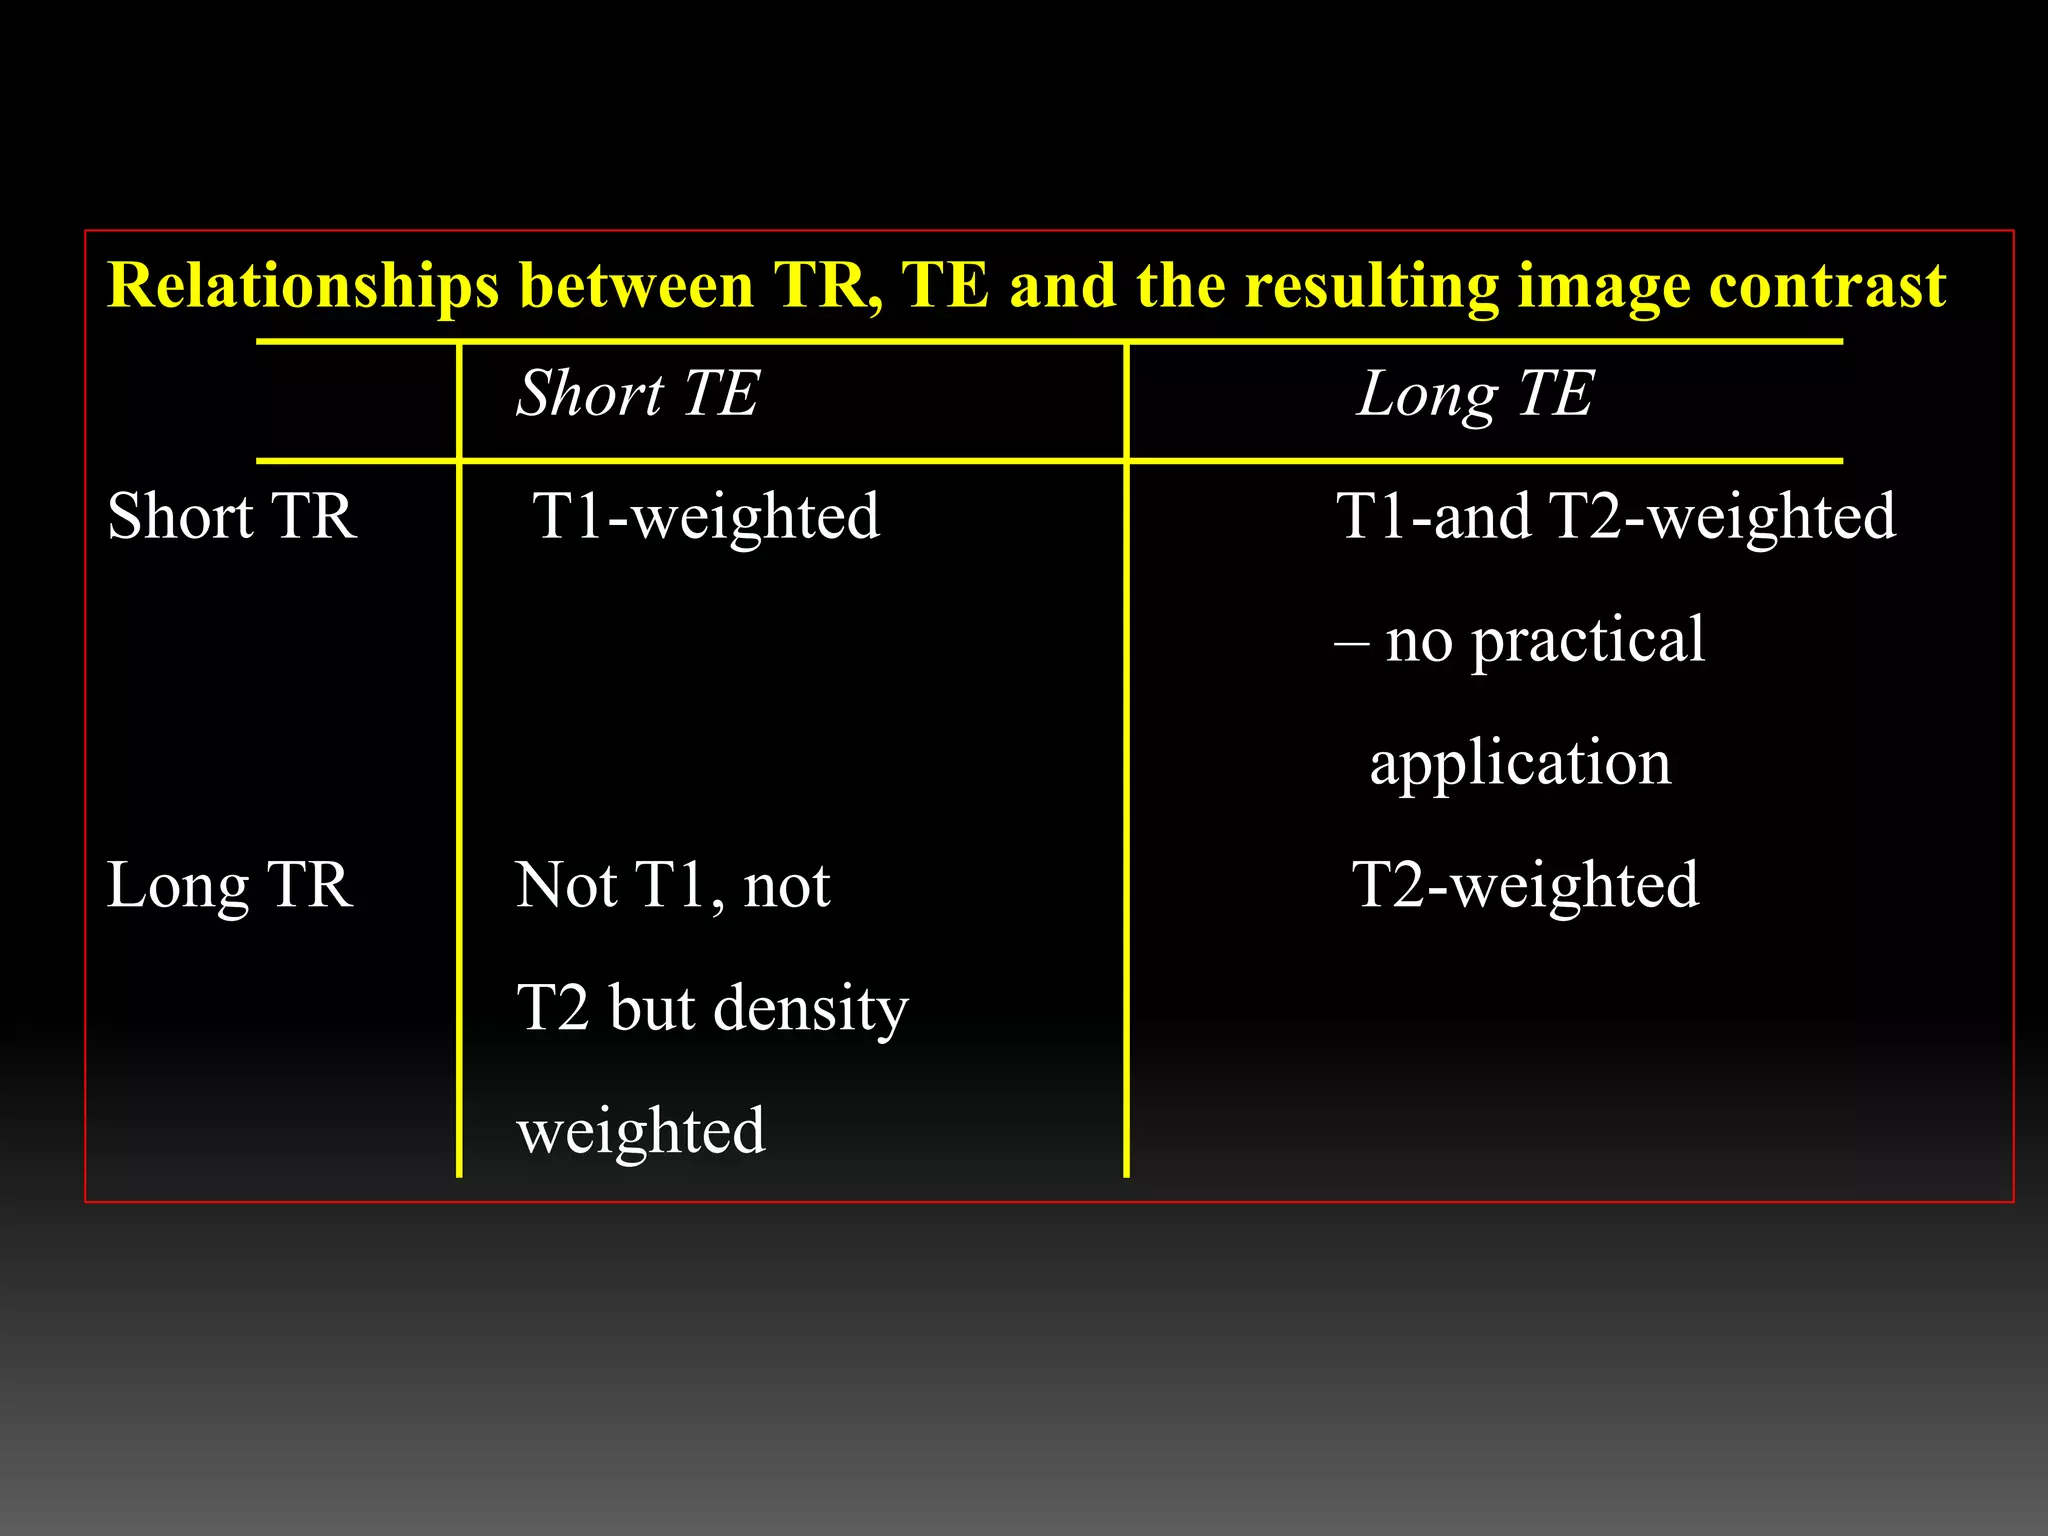
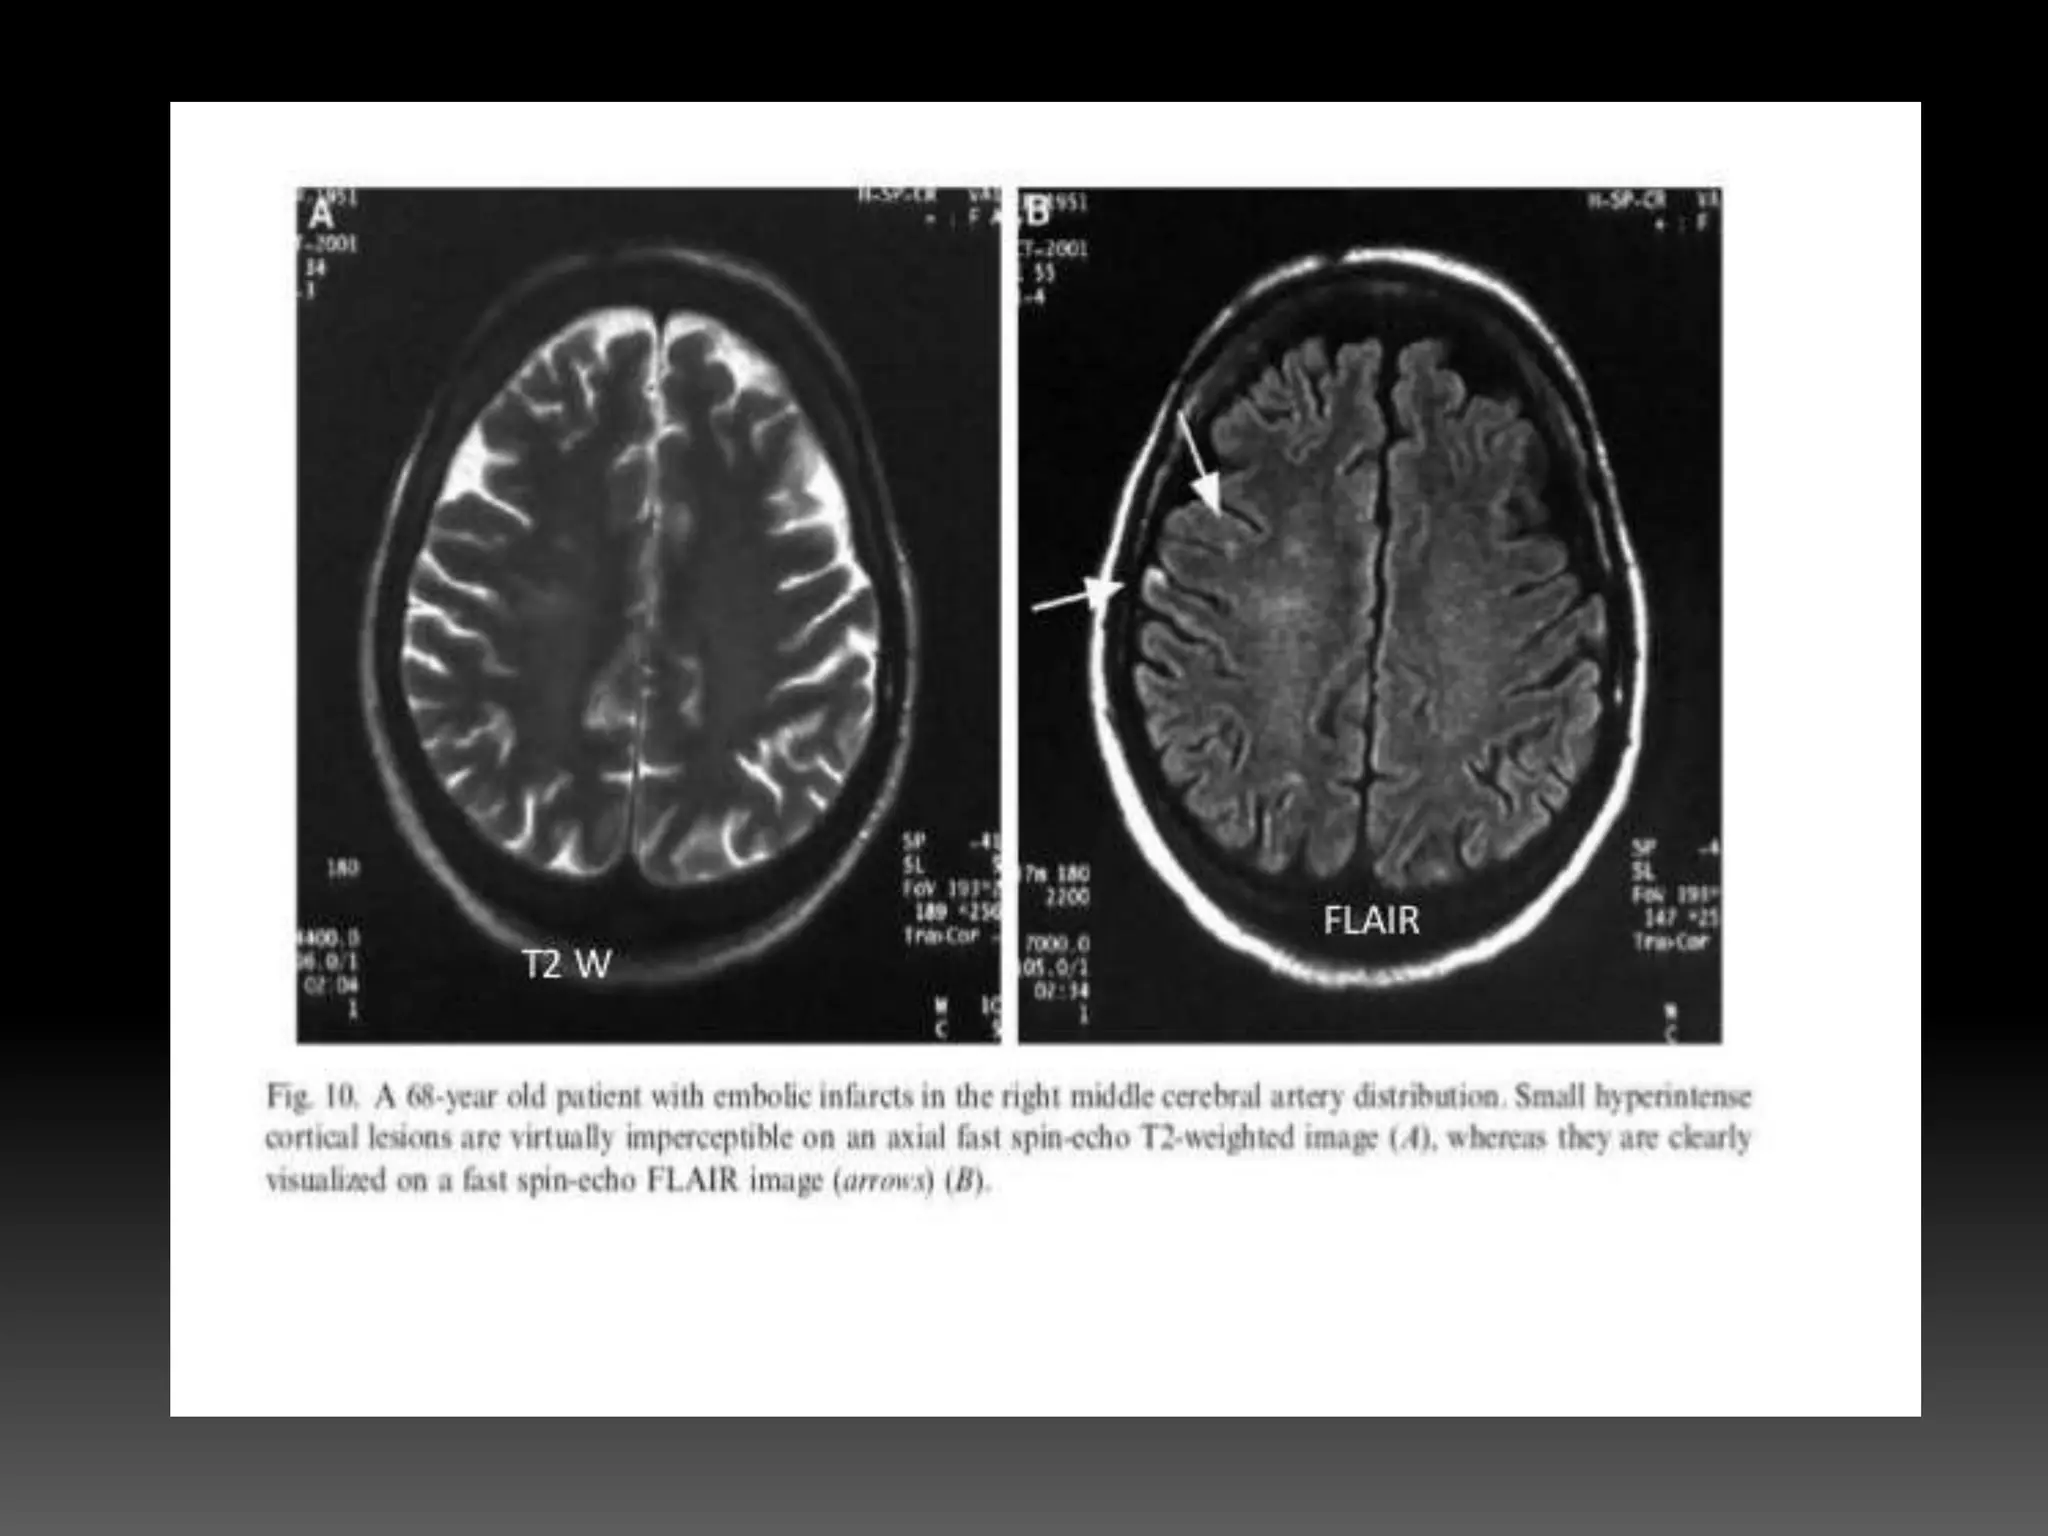
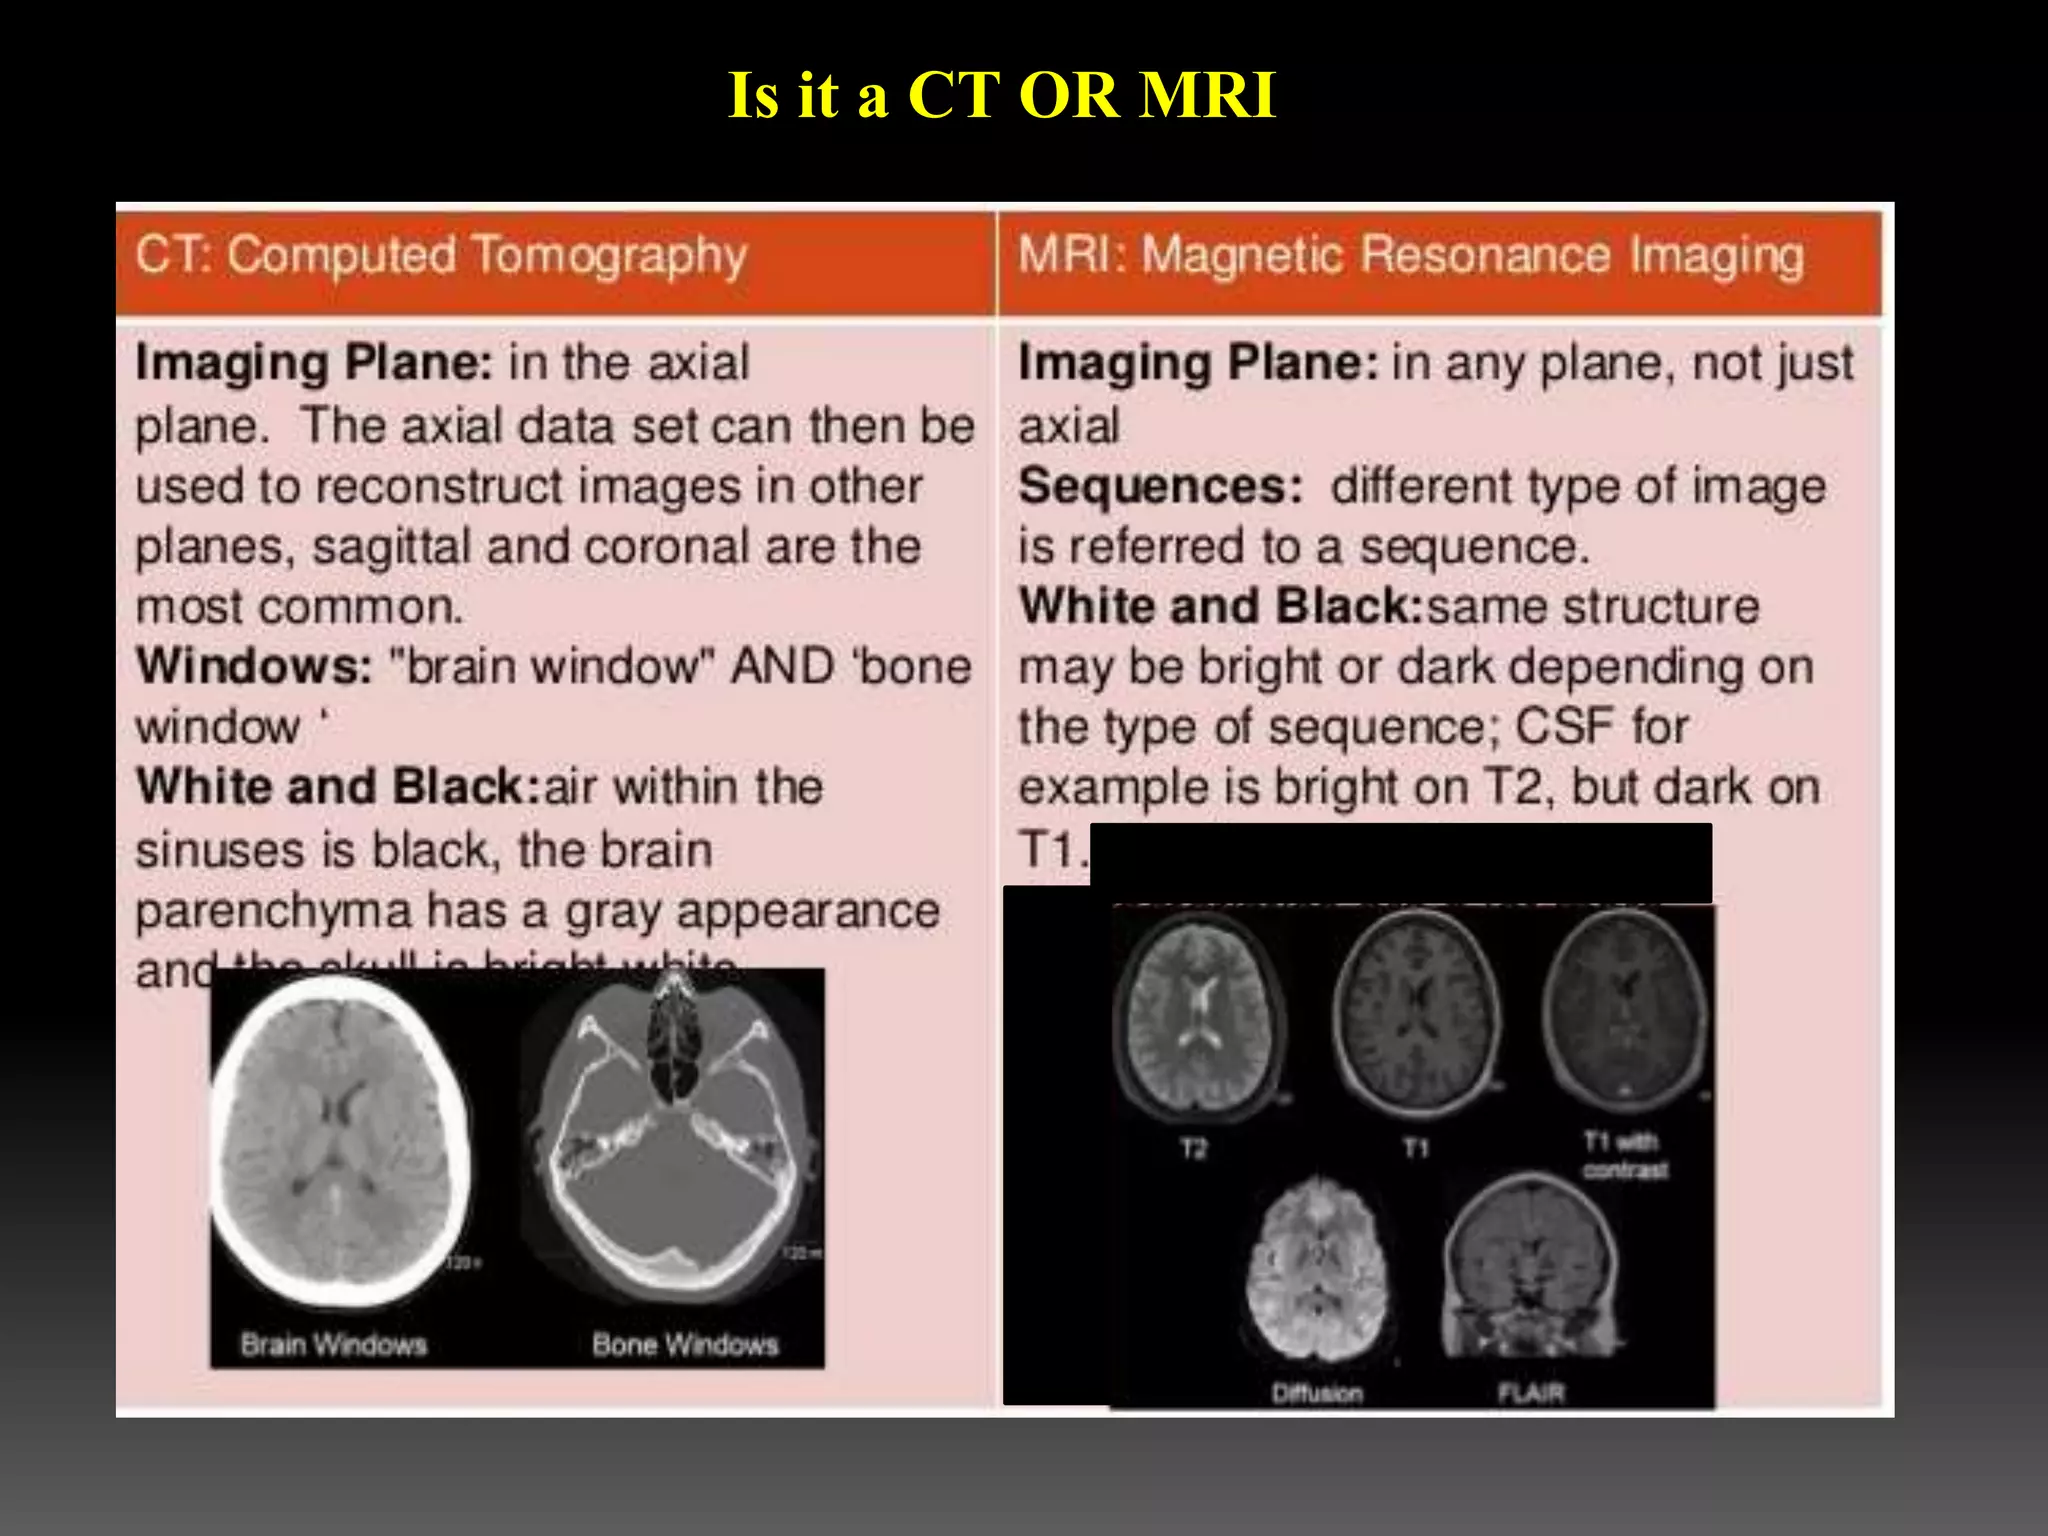
- Patients with metallic implants cannot undergo MRI due to interactions with the strong magnetic field. The document then describes the basic principles and sequences of MRI. T1-weighted and T2-weighted images provide different types of tissue contrast.