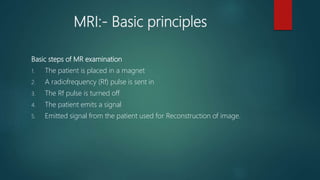
1. MRI works by using a strong magnetic field and radiofrequency pulses to align the spin of protons in water molecules in the body and detect the signals emitted as the spins relax back to equilibrium.
2. When placed in a magnetic field, protons in the body align with the field but precess at specific frequencies. An RF pulse can excite the protons, causing their spins to flip and emit signals as they relax.
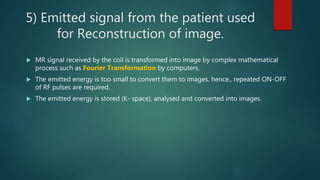
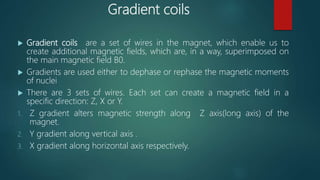
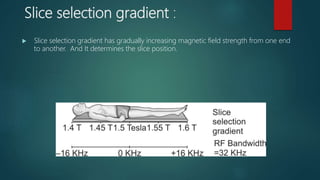
3. Gradient coils allow localization of these signals by giving different frequencies or phases to protons in different locations, encoding spatial information. The signals are Fourier transformed into images.