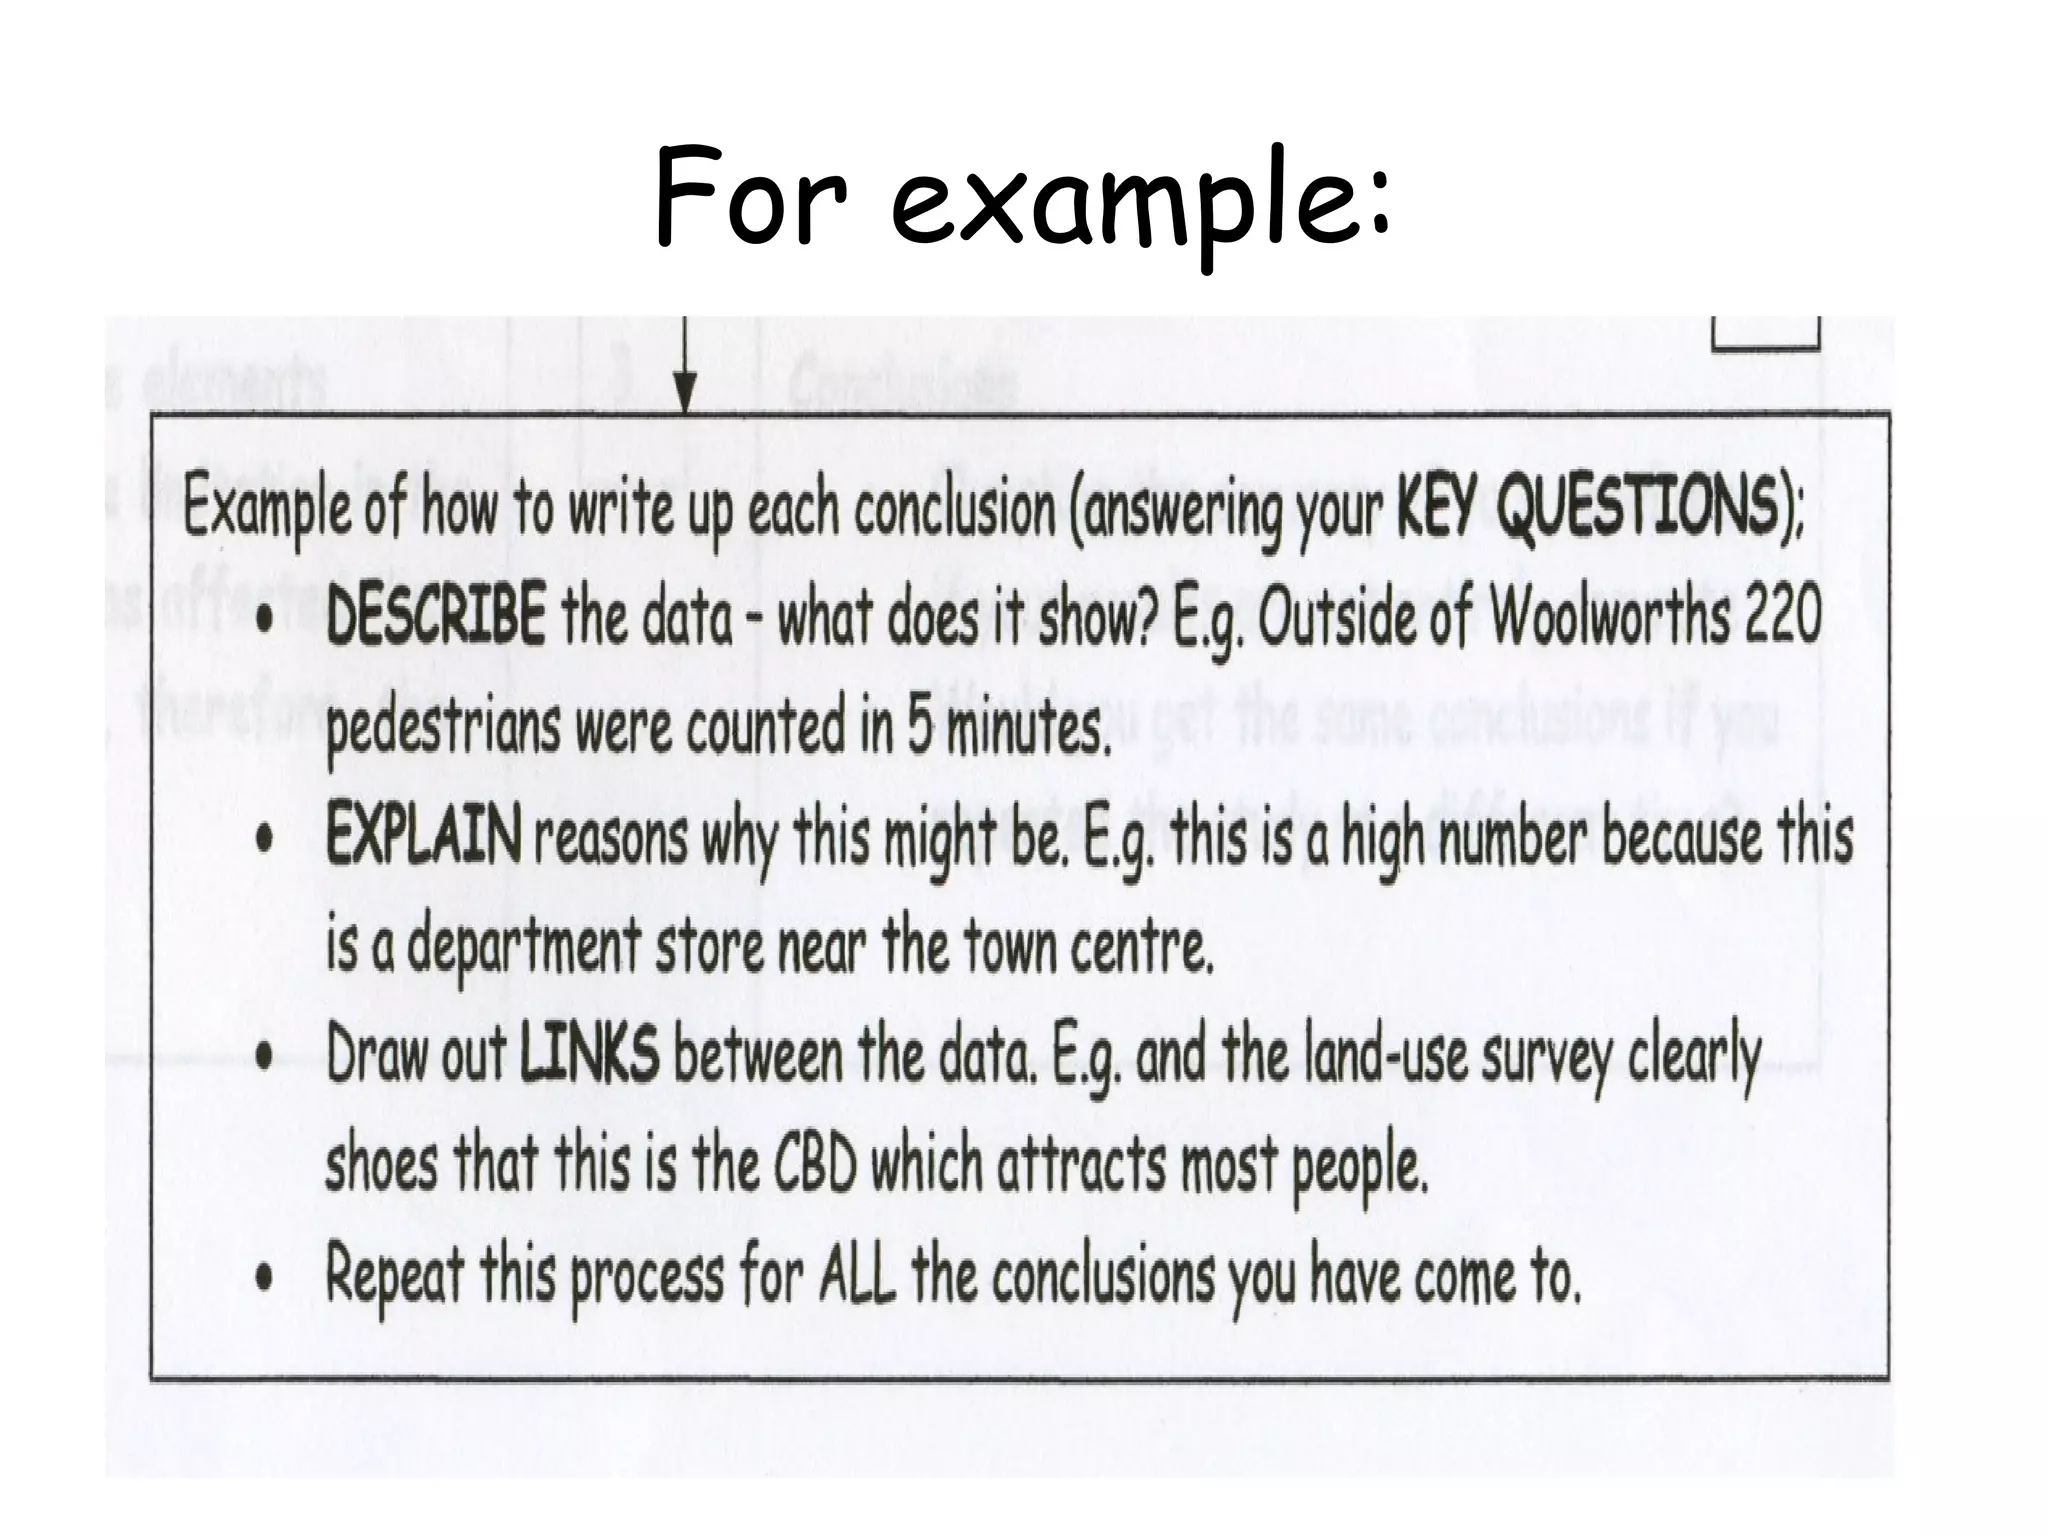
This document provides guidance on summarizing and analyzing collected data in 3 levels of detail:
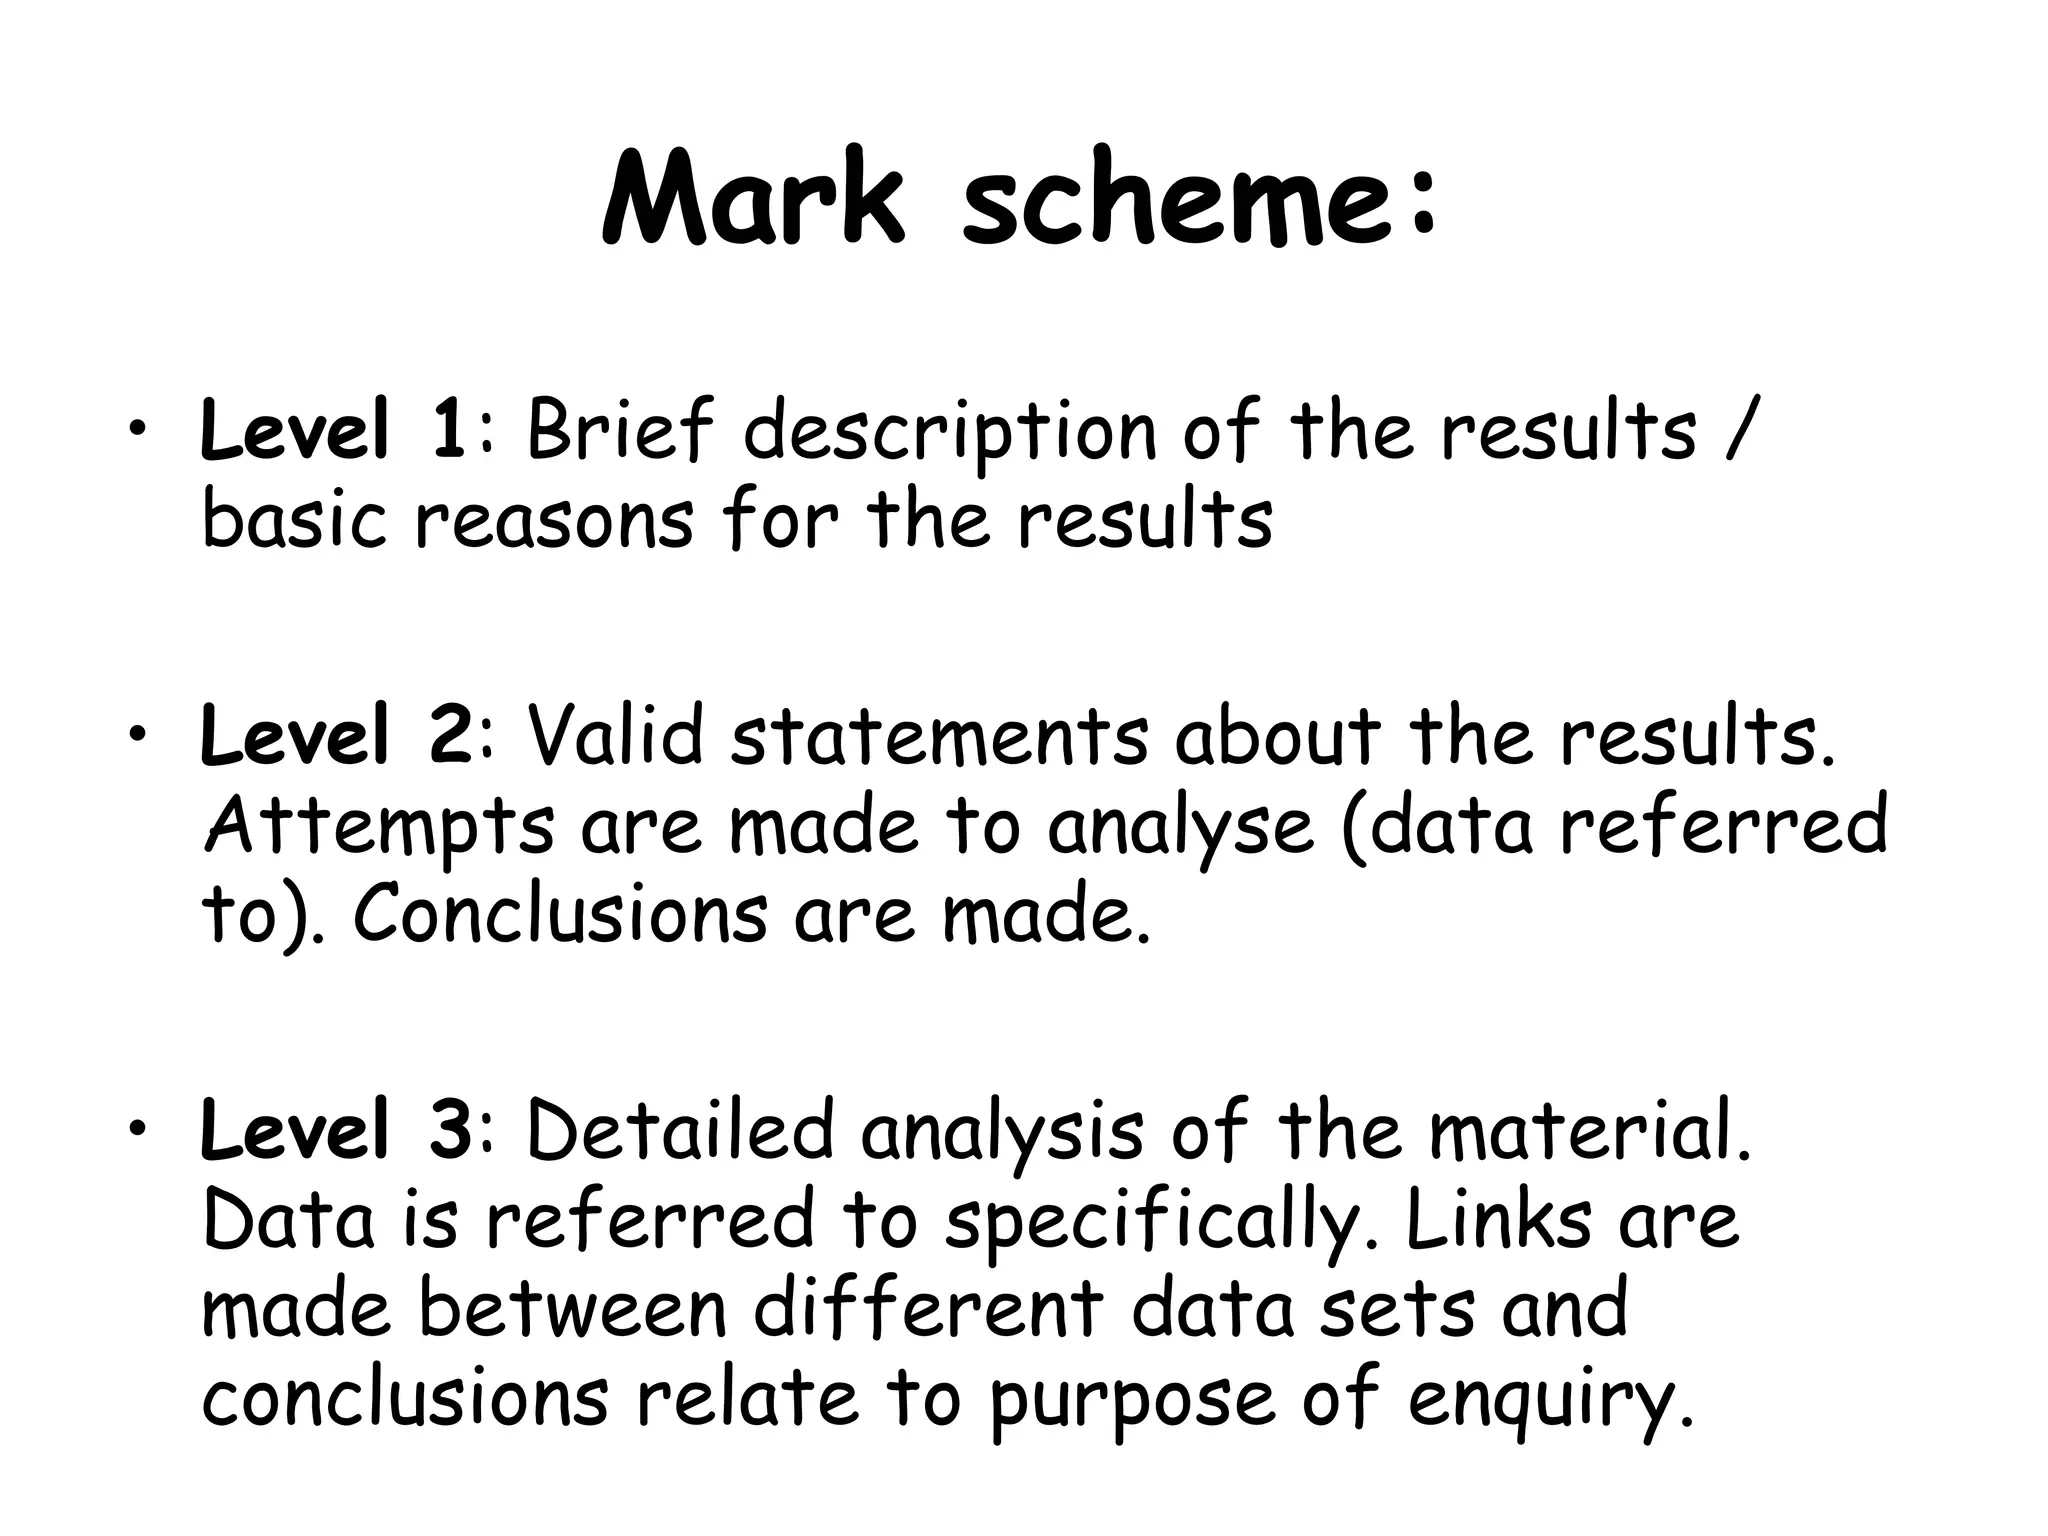
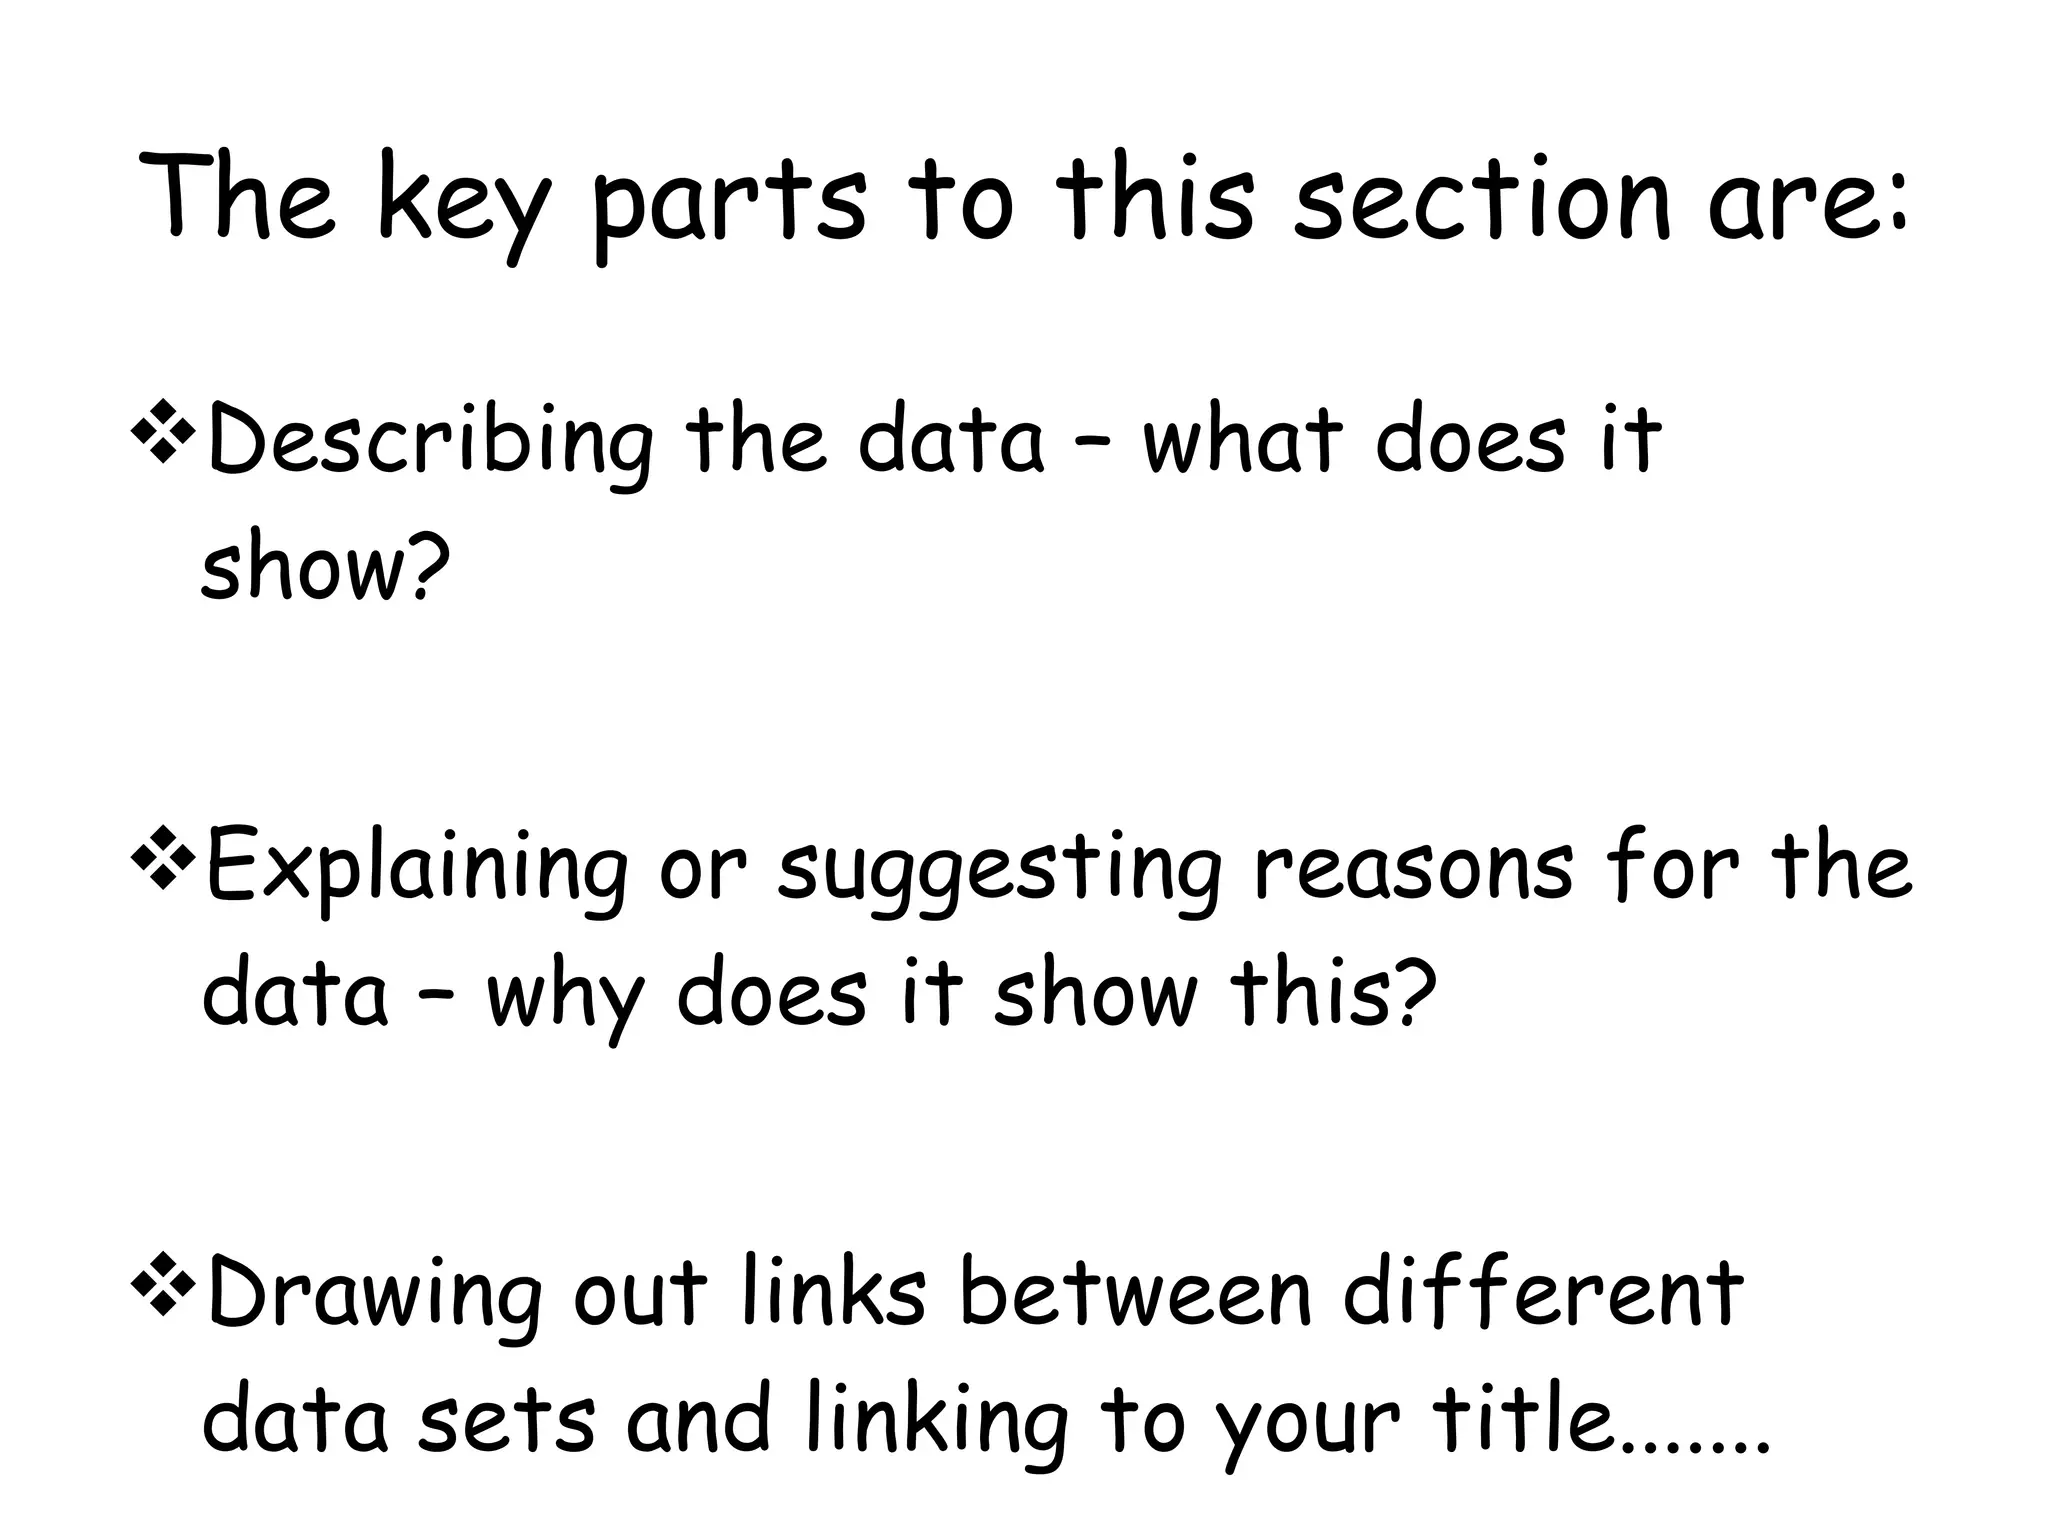
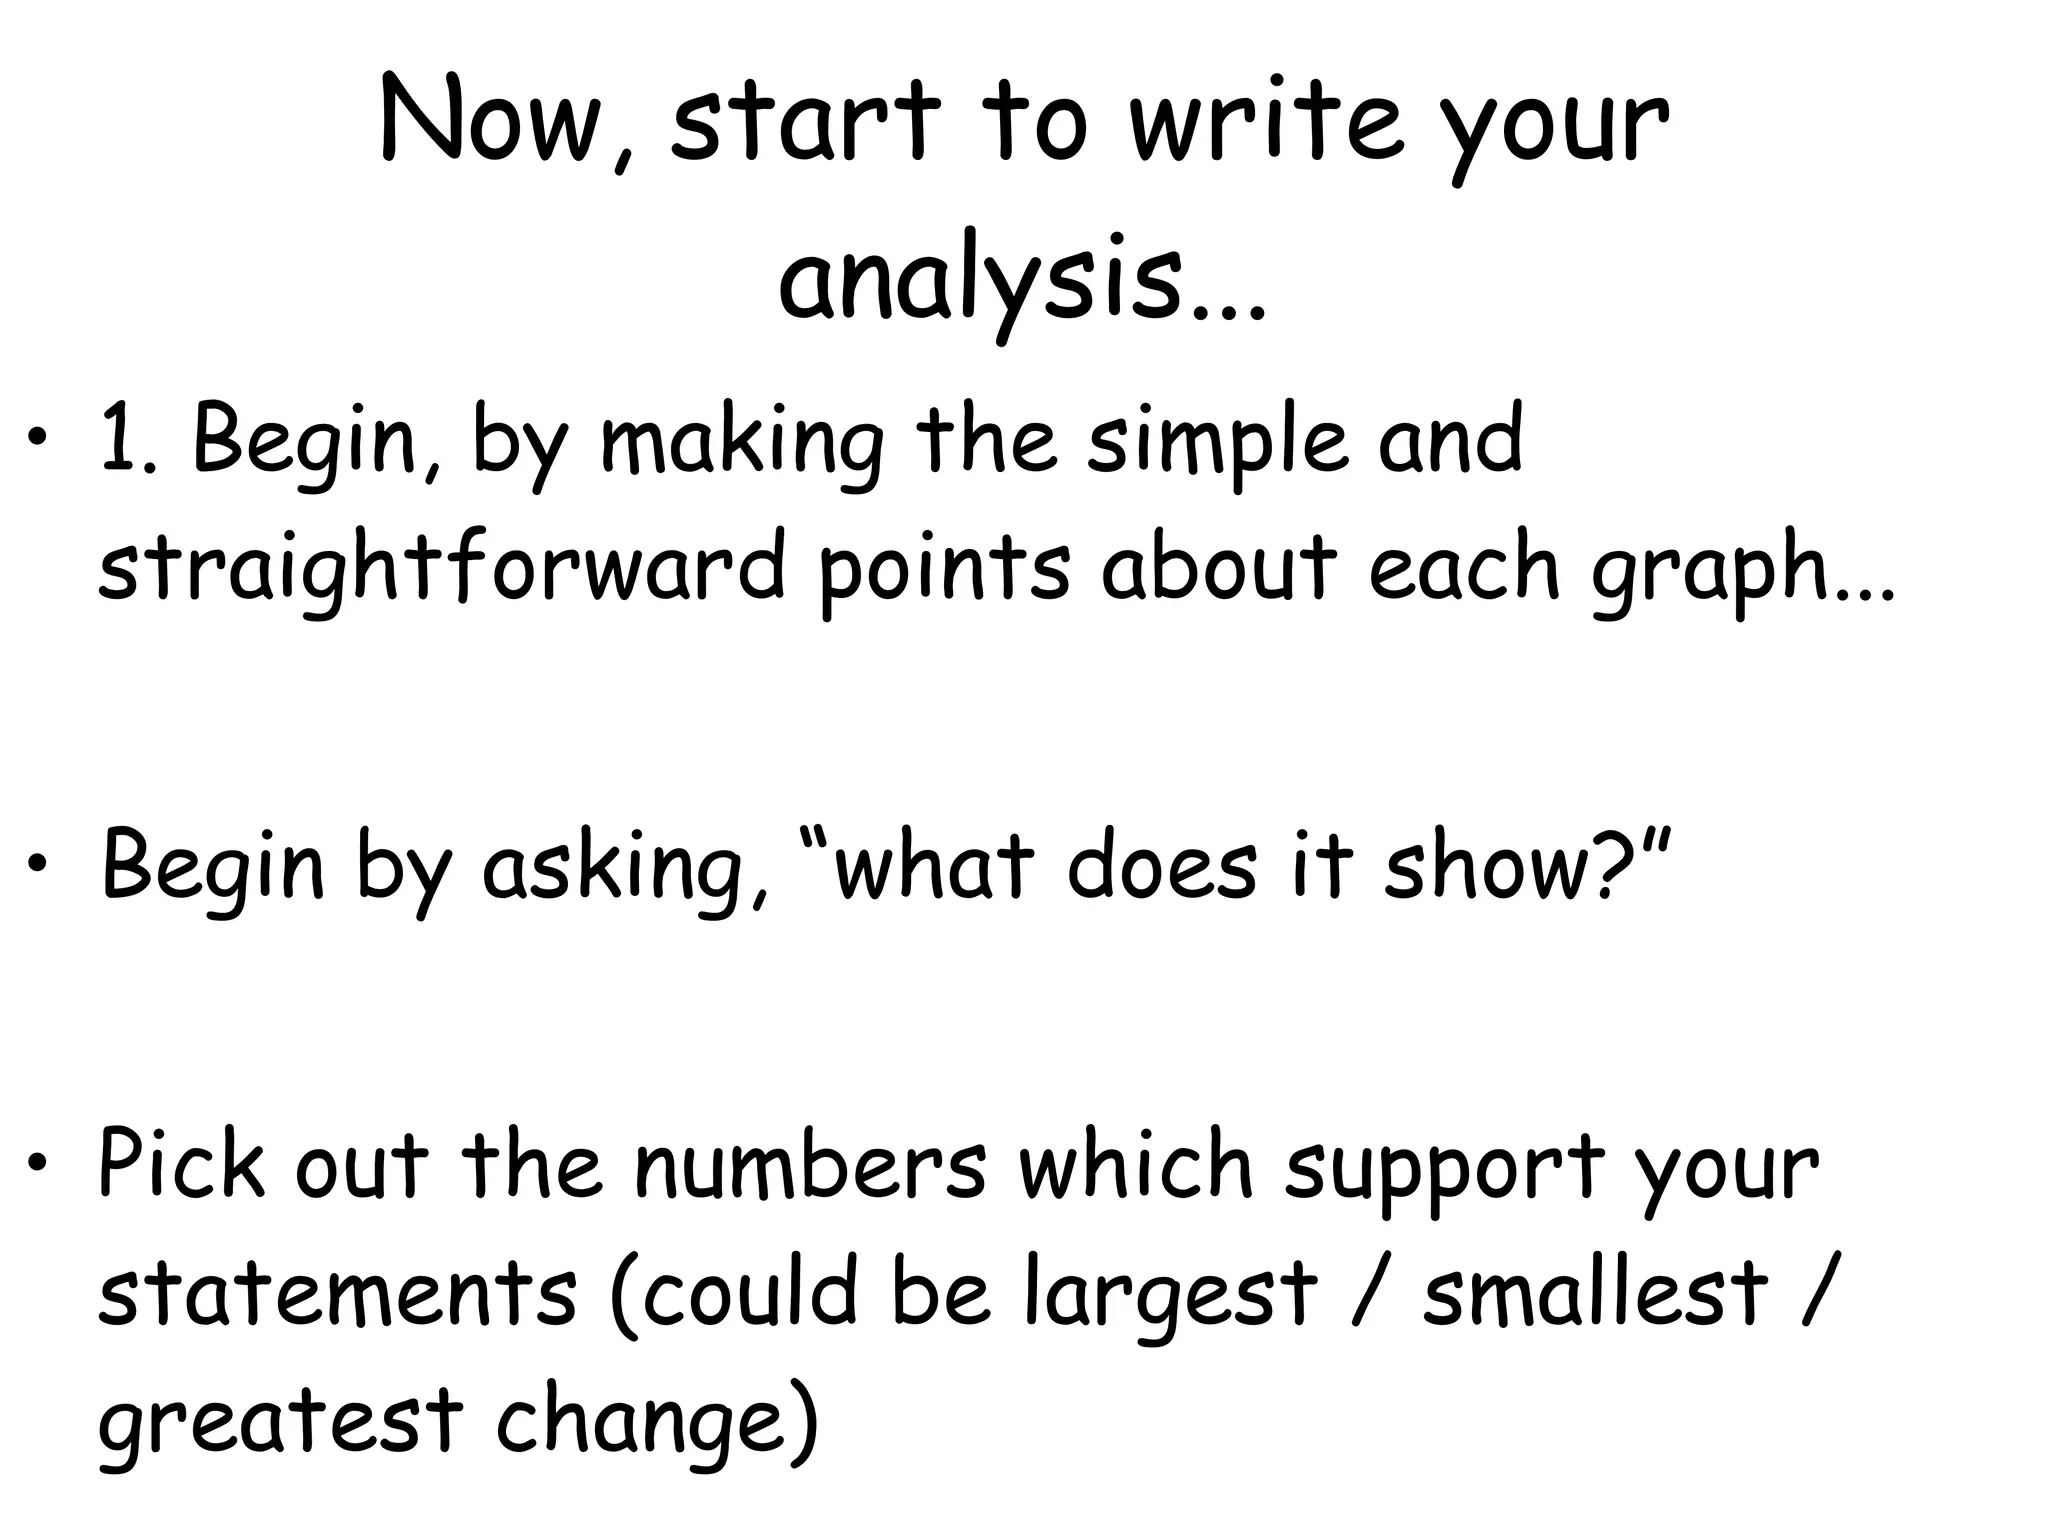
Level 1 involves briefly describing results and stating basic reasons for those results. Level 2 adds valid statements analyzing the data by referring to it and drawing conclusions. Level 3 provides a detailed analysis linking different data sets together, referring specifically to data, and drawing conclusions related to the original purpose. The key is to describe data patterns, explain reasons for those patterns by asking why, and link different data sets to the overall topic.