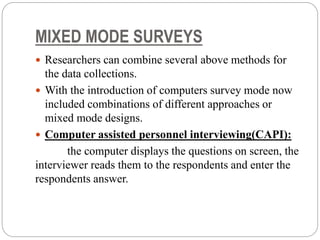
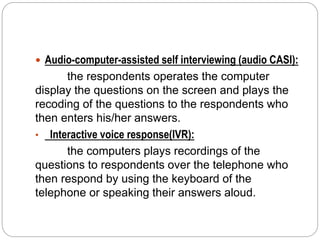
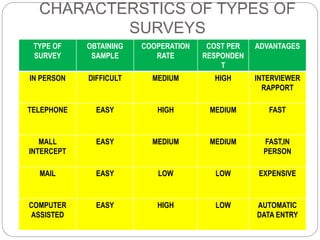
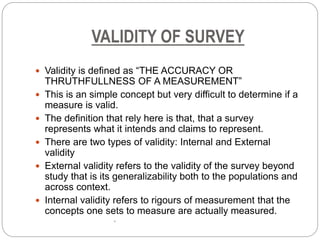
What is Survey? History of Survey? Why it is important? Types of Survey? How it helps in Sampling? Types of Sampling? Advantages of Survey And Disadvantages of Survey
Non- Probability Sampling & Its MethodsArpit Surana
A detailed explanation of non-probability sampling and its methods have been covered. There are 4 types of non- probability sampling methods:
1. convenience sampling
2. purposive sampling
3. quota sampling (both controlled and uncontrolled)
4. snowball sampling (all 3 ways of performing)
Meaning with adequate examples, pros and cons have been covered
For and query or further information, Kindly contact:
Arpit Surana
https://www.linkedin.com/in/arpitsurana116/
arpitsurana116116@gmail.com
A sample design is a definite plan for obtaining a sample from a given population. Researcher must select/prepare a sample design which should be reliable and appropriate for his research study.
Explains the different methods of Sampling with diagram. In statistics, quality assurance, and survey methodology, sampling is the selection of a subset of individuals from within a statistical population to estimate characteristics of the whole population. Statisticians attempt for the samples to represent the population in question.
UNIVARIATE & BIVARIATE ANALYSIS
UNIVARIATE BIVARIATE & MULTIVARIATE
UNIVARIATE ANALYSIS
-One variable analysed at a time
BIVARIATE ANALYSIS
-Two variable analysed at a time
MULTIVARIATE ANALYSIS
-More than two variables analysed at a time
TYPES OF ANALYSIS
DESCRIPTIVE ANALYSIS
INFERENTIAL ANALYSIS
DESCRIPTIVE ANALYSIS
Transformation of raw data
Facilitate easy understanding and interpretation
Deals with summary measures relating to sample data
Eg-what is the average age of the sample?
INFERENTIAL ANALYSIS
Carried out after descriptive analysis
Inferences drawn on population parameters based on sample results
Generalizes results to the population based on sample results
Eg-is the average age of population different from 35?
DESCRIPTIVE ANALYSIS OF UNIVARIATE DATA
1. Prepare frequency distribution of each variable
Missing Data
Situation where certain questions are left unanswered
Analysis of multiple responses
Measures of central tendency
3 measures of central tendency
1.Mean
2.Median
3.Mode
MEAN
Arithmetic average of a variable
Appropriate for interval and ratio scale data
x
MEDIAN
Calculates the middle value of the data
Computed for ratio, interval or ordinal scale.
Data needs to be arranged in ascending or descending order
MODE
Point of maximum frequency
Should not be computed for ordinal or interval data unless grouped.
Widely used in business
MEASURE OF DISPERSION
Measures of central tendency do not explain distribution of variables
4 measures of dispersion
1.Range
2.Variance and standard deviation
3.Coefficient of variation
4.Relative and absolute frequencies
DESCRIPTIVE ANALYSIS OF BIVARIATE DATA
There are three types of measure used.
1.Cross tabulation
2.Spearmans rank correlation coefficient
3.Pearsons linear correlation coefficient
Cross Tabulation
Responses of two questions are combined
Spearman’s rank order correlation coefficient.
Used in case of ordinal data
Analysis of data is a process of inspecting, cleaning, transforming, and modeling data with the goal of discovering useful information, suggesting conclusions, and supporting decision-making.
a PowerPoint about research analysis on the diversity of a certain organisms in a specific place and their abundance and environmental factors that could possibly affect their existence in the area
this document also includes the presentation of my group and a comprehensive analysis on lichen life in the baranggay
unfortunately it's not the final research for this paper so all the details are not yet to include tho alot of important information were included so that a general understanding of he topic is expected to be explained very well including all the important details
A very important aspect in determining and studying disease is the knowledge of surveys. Its designs, methods etc. This elaborative presentation gives a detailed insight to the survey procedures used in dentistry. Special section on the WHO oral assessment proforma.
Sampling - Types, Steps in Sampling process.pdfRKavithamani
Sampling is a technique of selecting individual members or a subset of the population to make statistical inferences from them and estimate the characteristics of the whole population. Different sampling methods are widely used by researchers in market research so that they do not need to research the entire population to collect actionable insights.
Research techniques; samling and ethics eltAbdo90nussair
Advance Research Techniques; How to make samples Abdurrahman Abdalla .. كيف تؤخد العينة في طرق البحث المتقدم .. إعداد عبدالرحمن المهدي نصير جامعة الشرق الادنى - قبرص الشمالية
Project Monitorig and Evaluation_Data Collection Methods is a Presentation by William Afani Paul for a Project MEAL Masterclass by Excellence Foundation for South Sudan
This session is designed to equip participants with essential knowledge and skills in monitoring and evaluating projects effectively.
During this masterclass, participants will delve into the fundamental concepts, tools, and techniques of project monitoring and evaluation. Through interactive discussions, case studies, and practical exercises, attendees will gain a comprehensive understanding of MEAL principles and their application in diverse project contexts.
Key Objectives
Understand the importance of project monitoring and evaluation in ensuring project success.
Learn how to develop and implement effective monitoring and evaluation frameworks.
Explore various data collection methods and analysis techniques for monitoring and evaluation purposes.
Gain insights into utilizing monitoring and evaluation findings to inform decision-making and improve project outcomes.
Learning Outcomes: By the end of the masterclass, participants will able to:
Define key concepts related to project monitoring and evaluation.
Develop a monitoring and evaluation plan tailored to specific project requirements.
Apply appropriate data collection methods and tools for monitoring and evaluation activities.
Utilize monitoring and evaluation findings to enhance project performance and impact.
The French Revolution, which began in 1789, was a period of radical social and political upheaval in France. It marked the decline of absolute monarchies, the rise of secular and democratic republics, and the eventual rise of Napoleon Bonaparte. This revolutionary period is crucial in understanding the transition from feudalism to modernity in Europe.
For more information, visit-www.vavaclasses.com
Model Attribute Check Company Auto PropertyCeline George
In Odoo, the multi-company feature allows you to manage multiple companies within a single Odoo database instance. Each company can have its own configurations while still sharing common resources such as products, customers, and suppliers.
Operation “Blue Star” is the only event in the history of Independent India where the state went into war with its own people. Even after about 40 years it is not clear if it was culmination of states anger over people of the region, a political game of power or start of dictatorial chapter in the democratic setup.
The people of Punjab felt alienated from main stream due to denial of their just demands during a long democratic struggle since independence. As it happen all over the word, it led to militant struggle with great loss of lives of military, police and civilian personnel. Killing of Indira Gandhi and massacre of innocent Sikhs in Delhi and other India cities was also associated with this movement.
2024.06.01 Introducing a competency framework for languag learning materials ...Sandy Millin
http://sandymillin.wordpress.com/iateflwebinar2024
Published classroom materials form the basis of syllabuses, drive teacher professional development, and have a potentially huge influence on learners, teachers and education systems. All teachers also create their own materials, whether a few sentences on a blackboard, a highly-structured fully-realised online course, or anything in between. Despite this, the knowledge and skills needed to create effective language learning materials are rarely part of teacher training, and are mostly learnt by trial and error.
Knowledge and skills frameworks, generally called competency frameworks, for ELT teachers, trainers and managers have existed for a few years now. However, until I created one for my MA dissertation, there wasn’t one drawing together what we need to know and do to be able to effectively produce language learning materials.
This webinar will introduce you to my framework, highlighting the key competencies I identified from my research. It will also show how anybody involved in language teaching (any language, not just English!), teacher training, managing schools or developing language learning materials can benefit from using the framework.
The Roman Empire A Historical Colossus.pdfkaushalkr1407
The Roman Empire, a vast and enduring power, stands as one of history's most remarkable civilizations, leaving an indelible imprint on the world. It emerged from the Roman Republic, transitioning into an imperial powerhouse under the leadership of Augustus Caesar in 27 BCE. This transformation marked the beginning of an era defined by unprecedented territorial expansion, architectural marvels, and profound cultural influence.
The empire's roots lie in the city of Rome, founded, according to legend, by Romulus in 753 BCE. Over centuries, Rome evolved from a small settlement to a formidable republic, characterized by a complex political system with elected officials and checks on power. However, internal strife, class conflicts, and military ambitions paved the way for the end of the Republic. Julius Caesar’s dictatorship and subsequent assassination in 44 BCE created a power vacuum, leading to a civil war. Octavian, later Augustus, emerged victorious, heralding the Roman Empire’s birth.
Under Augustus, the empire experienced the Pax Romana, a 200-year period of relative peace and stability. Augustus reformed the military, established efficient administrative systems, and initiated grand construction projects. The empire's borders expanded, encompassing territories from Britain to Egypt and from Spain to the Euphrates. Roman legions, renowned for their discipline and engineering prowess, secured and maintained these vast territories, building roads, fortifications, and cities that facilitated control and integration.
The Roman Empire’s society was hierarchical, with a rigid class system. At the top were the patricians, wealthy elites who held significant political power. Below them were the plebeians, free citizens with limited political influence, and the vast numbers of slaves who formed the backbone of the economy. The family unit was central, governed by the paterfamilias, the male head who held absolute authority.
Culturally, the Romans were eclectic, absorbing and adapting elements from the civilizations they encountered, particularly the Greeks. Roman art, literature, and philosophy reflected this synthesis, creating a rich cultural tapestry. Latin, the Roman language, became the lingua franca of the Western world, influencing numerous modern languages.
Roman architecture and engineering achievements were monumental. They perfected the arch, vault, and dome, constructing enduring structures like the Colosseum, Pantheon, and aqueducts. These engineering marvels not only showcased Roman ingenuity but also served practical purposes, from public entertainment to water supply.
Macroeconomics- Movie Location
This will be used as part of your Personal Professional Portfolio once graded.
Objective:
Prepare a presentation or a paper using research, basic comparative analysis, data organization and application of economic information. You will make an informed assessment of an economic climate outside of the United States to accomplish an entertainment industry objective.
Palestine last event orientationfvgnh .pptxRaedMohamed3
An EFL lesson about the current events in Palestine. It is intended to be for intermediate students who wish to increase their listening skills through a short lesson in power point.
Welcome to TechSoup New Member Orientation and Q&A (May 2024).pdfTechSoup
In this webinar you will learn how your organization can access TechSoup's wide variety of product discount and donation programs. From hardware to software, we'll give you a tour of the tools available to help your nonprofit with productivity, collaboration, financial management, donor tracking, security, and more.
How to Make a Field invisible in Odoo 17Celine George
It is possible to hide or invisible some fields in odoo. Commonly using “invisible” attribute in the field definition to invisible the fields. This slide will show how to make a field invisible in odoo 17.
A Strategic Approach: GenAI in EducationPeter Windle
Artificial Intelligence (AI) technologies such as Generative AI, Image Generators and Large Language Models have had a dramatic impact on teaching, learning and assessment over the past 18 months. The most immediate threat AI posed was to Academic Integrity with Higher Education Institutes (HEIs) focusing their efforts on combating the use of GenAI in assessment. Guidelines were developed for staff and students, policies put in place too. Innovative educators have forged paths in the use of Generative AI for teaching, learning and assessments leading to pockets of transformation springing up across HEIs, often with little or no top-down guidance, support or direction.
This Gasta posits a strategic approach to integrating AI into HEIs to prepare staff, students and the curriculum for an evolving world and workplace. We will highlight the advantages of working with these technologies beyond the realm of teaching, learning and assessment by considering prompt engineering skills, industry impact, curriculum changes, and the need for staff upskilling. In contrast, not engaging strategically with Generative AI poses risks, including falling behind peers, missed opportunities and failing to ensure our graduates remain employable. The rapid evolution of AI technologies necessitates a proactive and strategic approach if we are to remain relevant.
June 3, 2024 Anti-Semitism Letter Sent to MIT President Kornbluth and MIT Cor...Levi Shapiro
Letter from the Congress of the United States regarding Anti-Semitism sent June 3rd to MIT President Sally Kornbluth, MIT Corp Chair, Mark Gorenberg
Dear Dr. Kornbluth and Mr. Gorenberg,
The US House of Representatives is deeply concerned by ongoing and pervasive acts of antisemitic
harassment and intimidation at the Massachusetts Institute of Technology (MIT). Failing to act decisively to ensure a safe learning environment for all students would be a grave dereliction of your responsibilities as President of MIT and Chair of the MIT Corporation.
This Congress will not stand idly by and allow an environment hostile to Jewish students to persist. The House believes that your institution is in violation of Title VI of the Civil Rights Act, and the inability or
unwillingness to rectify this violation through action requires accountability.
Postsecondary education is a unique opportunity for students to learn and have their ideas and beliefs challenged. However, universities receiving hundreds of millions of federal funds annually have denied
students that opportunity and have been hijacked to become venues for the promotion of terrorism, antisemitic harassment and intimidation, unlawful encampments, and in some cases, assaults and riots.
The House of Representatives will not countenance the use of federal funds to indoctrinate students into hateful, antisemitic, anti-American supporters of terrorism. Investigations into campus antisemitism by the Committee on Education and the Workforce and the Committee on Ways and Means have been expanded into a Congress-wide probe across all relevant jurisdictions to address this national crisis. The undersigned Committees will conduct oversight into the use of federal funds at MIT and its learning environment under authorities granted to each Committee.
• The Committee on Education and the Workforce has been investigating your institution since December 7, 2023. The Committee has broad jurisdiction over postsecondary education, including its compliance with Title VI of the Civil Rights Act, campus safety concerns over disruptions to the learning environment, and the awarding of federal student aid under the Higher Education Act.
• The Committee on Oversight and Accountability is investigating the sources of funding and other support flowing to groups espousing pro-Hamas propaganda and engaged in antisemitic harassment and intimidation of students. The Committee on Oversight and Accountability is the principal oversight committee of the US House of Representatives and has broad authority to investigate “any matter” at “any time” under House Rule X.
• The Committee on Ways and Means has been investigating several universities since November 15, 2023, when the Committee held a hearing entitled From Ivory Towers to Dark Corners: Investigating the Nexus Between Antisemitism, Tax-Exempt Universities, and Terror Financing. The Committee followed the hearing with letters to those institutions on January 10, 202
Read| The latest issue of The Challenger is here! We are thrilled to announce that our school paper has qualified for the NATIONAL SCHOOLS PRESS CONFERENCE (NSPC) 2024. Thank you for your unwavering support and trust. Dive into the stories that made us stand out!
3. DEFINITION
A Standardised stimulus designed to convert fuzzy
psychological phenomenon into hard data.
Survey research is a type of research to collect the
data and facts about some certain situations or
issues from the target populations existing in
surroundings having relevance to the nature of
study.
4. INTRODUCTION
In research of human subjects, a survey is a list of
questions aimed at extracting specific data from a
particular group of people.
Survey research is often used to assess thoughts,
opinions, and feelings. Surveys can be specific and
limited, or they can have more global, widespread
goals. Psychologist and sociologists often use surveys
to analyse behaviour, while it is also used to meet the
more pragmatic needs of the media, such as, in
evaluating political candidates, public health officials,
professional organizations, and advertising and
marketing directors
5. Surveys may be conducted by phone, mail, via the
internet, and sometimes face-to-face on busy street
corners or in malls.
A survey consists of a predetermined set of questions
that is given to a sample.
With a representative sample, that is, one that is
representative of the larger population of interest, one
can describe the attitudes of the population from which
the sample was drawn. Further, one can compare the
attitudes of different populations as well as look for
changes in attitudes over time.
6. HISTORY OF SURVEY RESEARCH
- Survey research methology was initially developed
during the 1920’s.
- Civil servant at trailer park, collecting census
data,Netherlands,1925
- Since the 1980’s theories and principles evolved to
create a unified perceptive on the design conduct and
evaluation of surveys i.e. survey science.
7. SURVEY RESEARCH EXAMPLES
SOME FIELDS WHICH USE SURVEY RESEARCH
FIELD EXAMPLES
Demographics Census
Epidemiology Health survey
Marketing Customer satisfaction
Politics Polls
Psychology Attitudes, emotions
Sociology Social trends
Pharmacology Drug effects, causes
8.
9. SURVEY RESEARCH CHARACTERSTICS
USAGE: Surveys are widely used in the social
sciences.
SYSTEMATIC: follow specific procedures based on
the survey science and the scientific method,
REPLICABLE: other people using the same methods
are likely to get essentially the same results. One
aspect of the quality of the survey instrument is the
reliability of the measures on the instrument. It is
important that the measurement process be consistent
10. TYPES: Often use interviews or questionnaires.
IMPARTIAL SAMPLING: Units are selected from the
populations without prejudice or preference and so to be
the representative. Real world samples.
DATA: Often quantitative but can be qualitative also.
11. TYPES OF SURVEY
According to Span of time involved
The span of time needed to complete the survey brings us to the two different
types of surveys:
1) CROSS SECTIONAL SURVEY
2) LONGITUDINAL SURVEY
12. Cross sectional surveys
Collecting information from the respondents at a single
period in time uses the cross sectional type of survey.
Cross-sectional survey usually utilises questionnaires
to ask about a particular topic at one point in time.
For instance, a researcher conducted a cross sectional
survey asking teenagers views on cigarette smoking
Sometimes, cross sectional surveys are used to identify
the relationship between two variables as in a
comparative study.
For example: peer pressure and cigarette smoking
among teenagers
13. LONGITUDINAL SURVEY
When the researchers attempts to gather information
over a period of time or from one point in time up to
another, he is doing a longitudinal survey.
The aim of longitudinal survey is to collect data and
examine the changes in the data gathered.
Longitudinal surveys are used in cohort studies, panel
studies and trend studies.
14. CONDITIONS FOR A SURVEY
It should answer the objectives
Be unbiased
Accurate
Be generalizable
Be ethical
Be economical
15. PURPOSES OF SURVEY RESEARCH
There are two broad purposes of survey based research:
INFORMATION
GATHERING
THEORY
TESTING AND
BUILTING
16. INFORMATION GATHERING
The goal is to gather information for e.g
Polls
Census
Customer satisfaction
Attitudes
The goal is to test and built theory for e.g habit of
smoking causes lung cancer in 89% of the populations.
Personality and social psychology theories
THEORY TESTING AND BUILTING
17. PROCEDURES IN SURVEYING
Conducting a survey appears easy, however without
careful planning and thought, the data collected may
not provide the information needed.
A survey research project should follow the scientific
process that is used in any research project.
Defining the study purpose clearly and narrowing is
essential. It is also important to conduct a literature
search to determine research that has been previously
done.
There are four main characteristics when conducting a
survey:
18. 1) SAMPLING
2) DATA COLLECTION
3) SURVEY INSTRUMENT DESIGN
4) DATAANALYSIS AND REPORTING
SAMPLING
SURVEY
INSTRUMENT
DESIGN
DATA
COLLECTION DATA
ANALYSIS
19. SAMPLING
Sampling is the selection of population to represent the
entire population. The study population includes all those
of interest from which a sample can be selected.
Selecting a sample to represent a population should be done
with careful thought.
The study populations includes all those of interest from
which a sample can be selected. Before defining a
populations and selecting a sample, the sampling unit
should be determined.
Often the sampling unit is an individual person(patient or
physician). However, the sampling unit may be pharmacies,
families, household, clinics hospital may be grouping.
20.
21. Once the population and sampling unit have been
determined, a sample frame can be developed. The sample
frame is the operational definition of the population that is
used to select the sample.
After the sampling is defined, a sample can be selected.
SAMPLING DESIGN
The part of research plan that details that how the sample
can be selected is the sample design. Both probability and
non probability designs can be used for sampling.
Probability sampling
Non- probability sampling
22. PROBABILITY SAMPLING
Probability sampling means that each sampling unit has a
known probability of being included in the sample.
Because there is a known probability of being included,
the laws of mathematical probability can be used to make
inferences about the population, and the results can be
generalized to the study population.
The types of probability sampling are as follows:
• RANDOM SAMPLING
STRATIFIED SAMPLING
CLUSTER SAMPLING
23. RANDOM SAMPLING
Random sampling means each sampling unit is randomly
selected to participate. In simple random sampling, each
sampling unit has a known and equal chance of
participating in the survey. To select a simple random
sample, a random number generator or a table of random
numbers can be used to select the sample from the
sample frame.
The list of sampling units can be generated in many
ways, such as an alphabetical list of employees or a
sequential list of patients admitted to a ward. Then after
selecting a random starting point, every Nth name is
selected from the list of sampling units
24.
25. STRATIFIED SAMPLING
Stratified sampling refers to grouping a study
population according to some demographic
characteristic.
The populations to be sampled is to be divided into
groups called “strata”, such that each group is
homogenous in its characteristics.
For example, hospital employees can be grouped by
department, and then within each group, five
employees can be randomly selected.
This method ensures more representativeness provide
greater accuracy and can concentrate on a wider
geographical area.
26.
27. CLUSTER SAMPLING
Cluster sampling refers to selecting participants
randomly who are naturally grouped by either
geographic location, natural groups or time.
Within cluster sampling, there are single-stage
clustering. In single-stage clustering, the pharmacy
researcher may randomly select clusters and then
survey all sampling units within the clusters.
For example, villages, wards, or children of the school.
This method is simpler and involves less time and cost
but gives a high standard error.
28.
29. NON-PROBABILITY SAMPLING
Nonprobability sampling means there is not a known
probability of being included in the sample. Although
confidence intervals and sampling error can be computed
from a nonprobability sample, these statistics would be
technically invalid.
However, there are times when a nonprobability
sampling technique is acceptable because of the purpose of
the study or because it is the only way to select participants
for a study.
For example, it may be best to use a nonprobability
sampling technique when surveying hard-to-identify groups
(e.g., patients who are homeless or individuals who abuse
drugs) or specific groups (e.g., patients who live in a
hospice facility).
30. Convenience Sampling/Accidental sampling
Convenience sampling is when a researcher
selects a group of individuals from the study population
who are easily accessible to participate in the study. For
example, shoppers in a single mall.
Snowball Sampling
Snowball sampling is selecting people to
participate and then asking these participants to supply
names of other potential participants i.e. the friend also
refers a friend . But the give people with more social
connection an unknown but higher chances of selection.
31.
32. Quota Sampling/ Ad hoc quotas
Quota sampling divides the population into
groups or strata, such as by race, age, or gender, and
determines how many sampling units per strata are
needed .Then the researcher selects anyone in the
population to fill the quotas at his or her discretion.
Example: 100 smokers or 10 males.
• Judgmental sampling/purposive sampling
The researcher chooses the sample based on who they
think would be appropriate for the study. This is used when
there is a limited number of people that have expertise in the
area of being researched.
33. SURVEY INSTRUMENT DESIGN
1) Questionnaires:
Typically a question is “paper and pencil instrument”
that is administered to the respondents. The usual questions
found in questionnaires are closed ended questions, which are
followed by response options.
Questionnaires have been developed over the years.
Today, questionnaires are utilised in various survey methods
according to how they are given. These methods include the
self administered, the group administered and the household
drop off.
Among this the self administered method is often used by
researcher nowadays.
34.
35. A questionnaire is a research instruments consisting of a
series of questions and other prompts for the purpose of
gathering information's from respondents.
The questions framed to be answered by the sample class
should be:
Short and concise
Open questions
Multiple choice
Yes/no
Phrasing of questions is critical
Avoid vague, nebulous questions
Eg: what do you think about abortions?
36. Avoid double- barred questions(compound questions)
Eg: Do you think that students should have more
classes about pharmacology and
anatomy?
• Avoid loaded language (push polling)
E.g. don’t you think that…?
Emotionally charged words like gang members,
welfare mothers.
• Avoid slang, jargon, abbreviations and acronyms
• Avoid or minimize negative wordings
37. Questions must be clear, unambiguous
Good example: which of the following statements
best represents your attitudes toward abortions in first
trimester?
Conduct a readable analysis.
• Avoid lengthy questions; keep questions short
example: how many times to you smoke daily?
38. OPEN ENDED/CLOSED ENDED
An open ended questions asks the respondents to
formulate his/her own answers, whereas the closed ended
questions has the respondents pick an answer from the given
number of options.
Open ended allows subjects more leeway flexibility
example: what is your primary cultural background?
Close ended or forced-choices ties respondents hands
somewhat easy to code the data.
example: choose your favourite ice-cream?
a) strawberry b) choclate
c) vanilla d) pista
39.
40. ADVANTAGES:
Ideal for asking closed ended questions,
effective for market or consumer research.
• DISADVANTAGES:
Limit the researcher understanding of the
respondent answer, requires budget for reproduction of
survey questionnaires.
41. INTERVIEWS
Between the two broad types of survey, interviews are
more personnel and probing.
Questionnaires do not provide the freedom to ask
follow up questions to explore the answers of the
respondents, but interviews do.
An interview includes two persons-the researcher as
the interviewer and the respondent who is interviewed.
These are the personnel or face to face interview, the
phone interview and more recently the online
interview.
42.
43. ADVANTAGES:
-follow up questions can be asked
- provide better understanding of the answers of
the respondents.
• DISADVANTAGES:
- Time-consuming
- many target respondents have no public listed
phone numbers or contacts.
44. METHODS OF DATA COLLECTION
There are several ways of administering a survey.
Within a survey different methods are used for
different parts.
The choice between administration modes is
influenced by several factors including:
- costs
-coverage of the target populations
- flexibility of asking questions
- respondents; willingness to participate
-response accuracy
45. MOBILE SURVEY
MOBILE DATA collection or mobile survey is an
increasingly popular method of data collections.
Over 50% of surveys todays are opened on mobile devices.
The survey from app or collection tool is on the mobile
devices such as smart phone or tablet.
These data offer innovate ways to gather data and eliminate
the laborious “data entry” which delays data analysis and
understanding.
SMS survey can reach any handset in any language in any
country. As they are not dependant on internet access and
the answers can be sent when its convenient
Apart from high mobile phone penetration, further
advantages are quicker response times and; possibility to
reach previously hard to reach target group ups.
46.
47. ONLINE SURVEY
Online survey are becoming an essential research tool
for a variety of research fields including marketing.
According to data ,online survey research accounted
for 20% of global data collection expenditure.
Online consumers panel are also extremely used for
carrying out survey but the quality is considered
inferior because the plane list tend to be fatigued.
Advantages are they are faster, simpler and cheaper.
The entire data collection period is significantly
shortened as all the data collected and processed in
little more than a month.
48.
49. TELEPHONE
Use of interviewers encourages sample person to
respond, leading to higher response rates
Interviewer can increase comprehension of questions
by answering respondents questions.
Fairly cost effective depending on local calls charge
structure.
Good for large national sampling frames.
Three types:
Traditional telephone interviews
Computer assisted telephone dialling
Computer assisted telephone interviewing.
50. MAIL
The questionnaires may be handed to the respondents
or mailed to them but in all cases they are returned to
the researchers via mail.
An advantage is that its cost is very low, since bulk
postage is cheap in most countries.
Not suitable for issues that may require clarifications.
No interviewer bias
Large amount of information can be obtained.
51. FACE TO FACE
Suitable for locations where telephones or mailed are
not developed remote areas.
Potential for interviewer bias
Easy to manipulate by completing multiple times to
skew results.
52. MIXED MODE SURVEYS
Researchers can combine several above methods for
the data collections.
With the introduction of computers survey mode now
included combinations of different approaches or
mixed mode designs.
Computer assisted personnel interviewing(CAPI):
the computer displays the questions on screen, the
interviewer reads them to the respondents and enter the
respondents answer.
53.
54. Audio-computer-assisted self interviewing (audio CASI):
the respondents operates the computer
display the questions on the screen and plays the
recoding of the questions to the respondents who
then enters his/her answers.
• Interactive voice response(IVR):
the computers plays recordings of the
questions to respondents over the telephone who
then respond by using the keyboard of the
telephone or speaking their answers aloud.
55.
56. CHARACTERSTICS OF TYPES OF
SURVEYS
TYPE OF
SURVEY
OBTAINING
SAMPLE
COOPERATION
RATE
COST PER
RESPONDEN
T
ADVANTAGES
IN PERSON DIFFICULT MEDIUM HIGH INTERVIEWER
RAPPORT
TELEPHONE EASY HIGH MEDIUM FAST
MALL
INTERCEPT
EASY MEDIUM MEDIUM FAST,IN
PERSON
MAIL EASY LOW LOW EXPENSIVE
COMPUTER
ASSISTED
EASY HIGH LOW AUTOMATIC
DATA ENTRY
57. VALIDITY OF SURVEY
Validity is defined as “THE ACCURACY OR
THRUTHFULLNESS OF A MEASUREMENT”
This is an simple concept but very difficult to determine if a
measure is valid.
The definition that rely here is that, that a survey
represents what it intends and claims to represent.
There are two types of validity: Internal and External
validity
External validity refers to the validity of the survey beyond
study that is its generalizability both to the populations and
across context.
Internal validity refers to rigours of measurement that the
concepts one sets to measure are actually measured.
•
59. MODES OF VALIDITY
CONTENT VALIDITY:
this approach measures the degree to which
the test item represent the domain being measured.
In order to measure the content validity of a
measuring instrument the researcher must identify
the overall content to be represented. Items must
be randomly chosen from this content that will
accurately represent the information of the areas.
60. CONSTRUCT VALIDITY:
construct validity must be investigated
whenever no criterion is accepted as entirely
adequate to define the quality to be measured.
There are two parts of the construct validity first
and foremost the theory underlying the construct
must be constructed. Secondly, the adequacy of
the test in measuring the construct is evaluated.
• CRITERION –RELATED VALIDITY:
this approach is concerned with detecting the
presence and absence of one or more criteria to
represent domain
61. DATA PROCESSING AND ANALYSIS
After the data have been collected, they have to be
processed and analyzed to provide results. Although data
processing will vary slightly depending on the data
collection method, the basic principles are the same.
DATA RECEIPT AND CODING:
Most survey responses need to be recorded in
numerical form, rather than words; therefore, surveys need to be
coded. If computer technology is used and the responses are
entered directly into a software program, the survey is coded
before data collection. If the question asks for a numerical
answer or has a linear-type scale with a numerical value, the
number response is recorded. However, if categories are listed,
then each category response is given a numeric code. Codes are
given to missing data. A codebook can be generated that
provides the code for each question so that all data entry clerks
are using the same codes.
62. DATA ANALYSIS:
When a sample is surveyed, statistical
analysis is conducted so that inferences can be made to
the population. Statistical analysis allows the researcher
to compute the probability that the values obtained from
the sample are within a specific range of those for the
population. Statistical analysis helps the researcher
describe the population, identify trends, and identify
relationships.
After statistical analysis, the pharmacy
researcher should interpret the results and report the
findings through publication or presentation.
63. ADVANTAGES OF SURVEY
Ecological validity
Access to wide range of participants
Potentially large amounts of data
May be more ethical than experiments.
Relatively easy to administer
Can be developed in less time
Cost effective
Can be administer remotely
A broad range of data can be collected
64. DISADVANTAGES OF SURVEY
Lack of control
Less internal validity
Data may be superficial
Can be costly to obtain representative data
Self report data only
Potentially low compliance rates
Respondents may not feel encouraged to provide
accurate honest answers.
Customised surveys can run the risk of containing
certain types of errors.