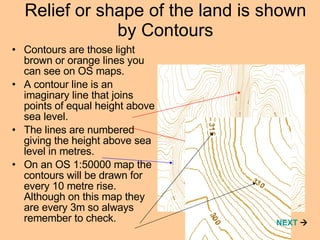
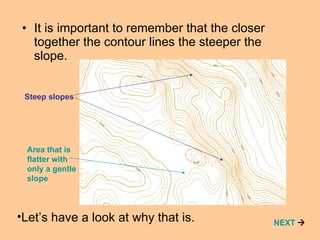
Contours are lines on maps that connect points of equal elevation. They show the shape and features of the land. Closer contour lines indicate a steeper slope, while more spaced out lines show flatter, more gentle slopes. Contours can be used to identify hills, valleys, spurs and other landforms based on the pattern and spacing of the lines.
This topic includes representation of topography by various non mathematical and mathematical methods.
Pictorial method (Hachure lines, Hill shading)
Mathematical method (Spot heights,Bench marks, Trigonometrical stations, Layer tint or altitude tints, Contour lines )
Combination of different methods
Definition of map: diagrammatic representation of reality on a paper.
elements of a map: scale, direction, title, subtitle, ownership, key map, legend
contents of base map: boundaries
network, topography, landuse, contours, utilities
appropriate scales for various types of plan like regional plan, perspective plan, development plan, local area plan
measurement of sclaes: scale conversion from larger unit to smaller units and vice-versa
Landuse classification, Landuse Landcover (LULC) classification
The following presentation titled “Basics of Specification Drafting”, was delivered on 18th December, 2016 by Mr. Somashekar Ramakrishna, Senior Partner, BananaIP Counsels, at National Law School of India University, Bangalore (NLSIU) to the Post Graduate Diploma Intellectual Property Rights Law PGDIPR students as a part of their course.
Contact Us for Intellectual Property Services
BananaIP Counsels
Regd Office
No.40,3rd Main Road,JC Industrial Estate,
Kanakapura Road,Bangalore – 560 062.
Email: contact@bananaip.com
Telephone: +91-80-26860414/24/34
o Spatially explicit data from various contexts in Indonesia shows that a very specific understanding of drivers of deforestation and recovery of tree cover is needed as they vary from context to context. Specific leverage points can be identified by understanding this interconnectedness and variation amongst the drivers
It will give you a fundamentals on different types of map and an introduction on topographic mapping.
This presentation is made for my report in Basic Geography Class
By the end of the lesson students should be able to:
-explain how height is shown on maps
-recognise slope types
-some will identify landscape features from looking at contours
Delineating watershed boundaries. All watershed delineation means
is that you’re drawing lines on a map to identify a watershed’s
boundaries. These are typically drawn on topographic maps using
information from contour lines. Contour lines are lines of equal
elevation, so any point along a given contour line is the same elevation.
To delineate a watershed’s boundaries on a topographic map it’s easiest if you
first understand some things about these maps. Rather than taking a lot of time
to explain that here, there are several good web sites that describe this. I
recommend that you Google “Read a topographic map” to access some of
those sites. But here are a few highlights of topographic maps, and a bit more
information will be given later in the presentation
This presentation is for Grades 6 and 7. It is based on the Edexcel Curriculum. This is a geography ppt on Contour lines. Hope this helps you to teach your classes.
Key Trends Shaping the Future of Infrastructure.pdfCheryl Hung
Keynote at DIGIT West Expo, Glasgow on 29 May 2024.
Cheryl Hung, ochery.com
Sr Director, Infrastructure Ecosystem, Arm.
The key trends across hardware, cloud and open-source; exploring how these areas are likely to mature and develop over the short and long-term, and then considering how organisations can position themselves to adapt and thrive.
The Art of the Pitch: WordPress Relationships and SalesLaura Byrne
Clients don’t know what they don’t know. What web solutions are right for them? How does WordPress come into the picture? How do you make sure you understand scope and timeline? What do you do if sometime changes?
All these questions and more will be explored as we talk about matching clients’ needs with what your agency offers without pulling teeth or pulling your hair out. Practical tips, and strategies for successful relationship building that leads to closing the deal.
Epistemic Interaction - tuning interfaces to provide information for AI supportAlan Dix
Paper presented at SYNERGY workshop at AVI 2024, Genoa, Italy. 3rd June 2024
https://alandix.com/academic/papers/synergy2024-epistemic/
As machine learning integrates deeper into human-computer interactions, the concept of epistemic interaction emerges, aiming to refine these interactions to enhance system adaptability. This approach encourages minor, intentional adjustments in user behaviour to enrich the data available for system learning. This paper introduces epistemic interaction within the context of human-system communication, illustrating how deliberate interaction design can improve system understanding and adaptation. Through concrete examples, we demonstrate the potential of epistemic interaction to significantly advance human-computer interaction by leveraging intuitive human communication strategies to inform system design and functionality, offering a novel pathway for enriching user-system engagements.
Smart TV Buyer Insights Survey 2024 by 91mobiles.pdf91mobiles
91mobiles recently conducted a Smart TV Buyer Insights Survey in which we asked over 3,000 respondents about the TV they own, aspects they look at on a new TV, and their TV buying preferences.
GDG Cloud Southlake #33: Boule & Rebala: Effective AppSec in SDLC using Deplo...James Anderson
Effective Application Security in Software Delivery lifecycle using Deployment Firewall and DBOM
The modern software delivery process (or the CI/CD process) includes many tools, distributed teams, open-source code, and cloud platforms. Constant focus on speed to release software to market, along with the traditional slow and manual security checks has caused gaps in continuous security as an important piece in the software supply chain. Today organizations feel more susceptible to external and internal cyber threats due to the vast attack surface in their applications supply chain and the lack of end-to-end governance and risk management.
The software team must secure its software delivery process to avoid vulnerability and security breaches. This needs to be achieved with existing tool chains and without extensive rework of the delivery processes. This talk will present strategies and techniques for providing visibility into the true risk of the existing vulnerabilities, preventing the introduction of security issues in the software, resolving vulnerabilities in production environments quickly, and capturing the deployment bill of materials (DBOM).
Speakers:
Bob Boule
Robert Boule is a technology enthusiast with PASSION for technology and making things work along with a knack for helping others understand how things work. He comes with around 20 years of solution engineering experience in application security, software continuous delivery, and SaaS platforms. He is known for his dynamic presentations in CI/CD and application security integrated in software delivery lifecycle.
Gopinath Rebala
Gopinath Rebala is the CTO of OpsMx, where he has overall responsibility for the machine learning and data processing architectures for Secure Software Delivery. Gopi also has a strong connection with our customers, leading design and architecture for strategic implementations. Gopi is a frequent speaker and well-known leader in continuous delivery and integrating security into software delivery.
Builder.ai Founder Sachin Dev Duggal's Strategic Approach to Create an Innova...Ramesh Iyer
In today's fast-changing business world, Companies that adapt and embrace new ideas often need help to keep up with the competition. However, fostering a culture of innovation takes much work. It takes vision, leadership and willingness to take risks in the right proportion. Sachin Dev Duggal, co-founder of Builder.ai, has perfected the art of this balance, creating a company culture where creativity and growth are nurtured at each stage.
UiPath Test Automation using UiPath Test Suite series, part 3DianaGray10
Welcome to UiPath Test Automation using UiPath Test Suite series part 3. In this session, we will cover desktop automation along with UI automation.
Topics covered:
UI automation Introduction,
UI automation Sample
Desktop automation flow
Pradeep Chinnala, Senior Consultant Automation Developer @WonderBotz and UiPath MVP
Deepak Rai, Automation Practice Lead, Boundaryless Group and UiPath MVP
"Impact of front-end architecture on development cost", Viktor TurskyiFwdays
I have heard many times that architecture is not important for the front-end. Also, many times I have seen how developers implement features on the front-end just following the standard rules for a framework and think that this is enough to successfully launch the project, and then the project fails. How to prevent this and what approach to choose? I have launched dozens of complex projects and during the talk we will analyze which approaches have worked for me and which have not.
PHP Frameworks: I want to break free (IPC Berlin 2024)Ralf Eggert
In this presentation, we examine the challenges and limitations of relying too heavily on PHP frameworks in web development. We discuss the history of PHP and its frameworks to understand how this dependence has evolved. The focus will be on providing concrete tips and strategies to reduce reliance on these frameworks, based on real-world examples and practical considerations. The goal is to equip developers with the skills and knowledge to create more flexible and future-proof web applications. We'll explore the importance of maintaining autonomy in a rapidly changing tech landscape and how to make informed decisions in PHP development.
This talk is aimed at encouraging a more independent approach to using PHP frameworks, moving towards a more flexible and future-proof approach to PHP development.
Neuro-symbolic is not enough, we need neuro-*semantic*Frank van Harmelen
Neuro-symbolic (NeSy) AI is on the rise. However, simply machine learning on just any symbolic structure is not sufficient to really harvest the gains of NeSy. These will only be gained when the symbolic structures have an actual semantics. I give an operational definition of semantics as “predictable inference”.
All of this illustrated with link prediction over knowledge graphs, but the argument is general.
Essentials of Automations: Optimizing FME Workflows with ParametersSafe Software
Are you looking to streamline your workflows and boost your projects’ efficiency? Do you find yourself searching for ways to add flexibility and control over your FME workflows? If so, you’re in the right place.
Join us for an insightful dive into the world of FME parameters, a critical element in optimizing workflow efficiency. This webinar marks the beginning of our three-part “Essentials of Automation” series. This first webinar is designed to equip you with the knowledge and skills to utilize parameters effectively: enhancing the flexibility, maintainability, and user control of your FME projects.
Here’s what you’ll gain:
- Essentials of FME Parameters: Understand the pivotal role of parameters, including Reader/Writer, Transformer, User, and FME Flow categories. Discover how they are the key to unlocking automation and optimization within your workflows.
- Practical Applications in FME Form: Delve into key user parameter types including choice, connections, and file URLs. Allow users to control how a workflow runs, making your workflows more reusable. Learn to import values and deliver the best user experience for your workflows while enhancing accuracy.
- Optimization Strategies in FME Flow: Explore the creation and strategic deployment of parameters in FME Flow, including the use of deployment and geometry parameters, to maximize workflow efficiency.
- Pro Tips for Success: Gain insights on parameterizing connections and leveraging new features like Conditional Visibility for clarity and simplicity.
We’ll wrap up with a glimpse into future webinars, followed by a Q&A session to address your specific questions surrounding this topic.
Don’t miss this opportunity to elevate your FME expertise and drive your projects to new heights of efficiency.
Leading Change strategies and insights for effective change management pdf 1.pdf
Contours
1. Contours NEXT Click the NEXT only when you are ready to move onto the next slide These slides will slowly tell you about contours wait until you see the NEXT button to move on.
7. Think where is the steepest slope on this island? Click here to see if you’re right xxx XXXX XXXX 50 100 150 200
8. Sometimes spot heights can be shown as a dot with a note of the height of that particular place. A trigonometrical point (or trig point) shows the highest point in an area (in meters) and is shown as a blue triangle Steepest slope – contour lines are closest together Sparrow point 227 . 76 xxx XXXX XXXX NEXT 50 100 150 200
9. You can spot other features by the shape and pattern of the contours NEXT
10. A valley may look like this… Often with a river running down through the valley 150 120 90 NEXT
11. However a spur can look very similar ! But here the heights are increasing in the opposite direction – always double check which way the contours are increasing or decreasing. 90 120 150 NEXT