Research Design
1
K.THIYAGU,
Assistant Professor, Department of Education,
Central University of Kerala, Kasaragod
2
• Blueprint
• Strategic plan
• Structural framework
Research Design
3
• Research Design is a kind of blueprint that
we prepare before actually carrying out
research.
• Research Design is the strategic plan of the
project that sets out the broad structure of
the research.
• Research design is the framework of
research methods and techniques chosen by
a researcher.
• A Research Design is simply a structural
framework of various research methods as
well as techniques that are utilised by a
researcher.
Research Design
4
Function and Purpose of
Research Design
Black and Champion (1976) have pointed
out the following three functions of
research design.
• A research design provides a blueprint
of operationalizing the research
activity.
• It defines the limit and scope of the
research
• It provides an opportunity to the
researcher to foresee possible areas of
problems in the process, carrying out
the research.
5
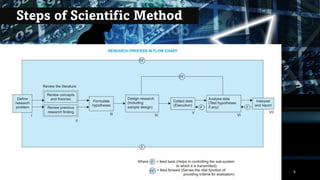
Steps of Scientific Method
6
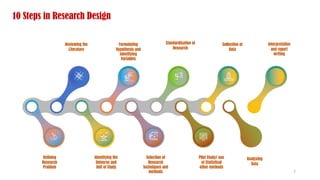
10 Steps in Research Design
Reviewing the
Literature
Formulating
Hypothesis and
Identifying
Variables
Standardisation of
Research
Collection of
Data
Pilot Study/ use
of Statistical
other methods
Selection of
Research
techniques and
methods
Identifying the
Universe and
Unit of Study
Defining
Research
Problem
Analysing
Data
Interpretation
and report
writing
7
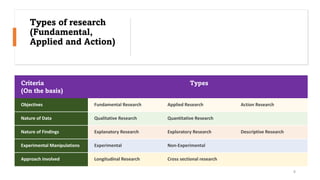
Types of research
(Fundamental,
Applied and Action)
Criteria
(On the basis)
Types
Objectives Fundamental Research Applied Research Action Research
Nature of Data Qualitative Research Quantitative Research
Nature of Findings Explanatory Research Exploratory Research Descriptive Research
Experimental Manipulations Experimental Non-Experimental
Approach involved Longitudinal Research Cross sectional research
8
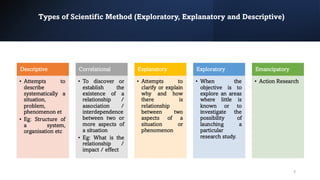
Types of Scientific Method (Exploratory, Explanatory and Descriptive)
9
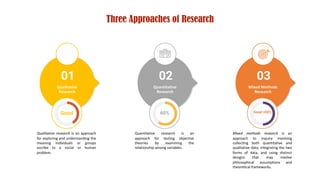
Three Approaches of Research
Quantitative
Research
Quantitative research is an
approach for testing objective
theories by examining the
relationship among variables.
02
60%
Mixed Methods
Research
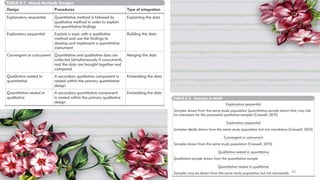
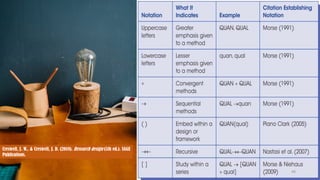
Mixed methods research is an
approach to inquiry involving
collecting both quantitative and
qualitative data, integrating the two
forms of data, and using distinct
designs that may involve
philosophical assumptions and
theoretical frameworks.
03
Good +60%
Qualitative
Research
Qualitative research is an approach
for exploring and understanding the
meaning individuals or groups
ascribe to a social or human
problem.
01
Good
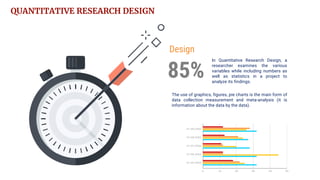
QUANTITATIVE RESEARCH DESIGN
The use of graphics, figures, pie charts is the main form of
data collection measurement and meta-analysis (it is
information about the data by the data).
Design
In Quantitative Research Design, a
researcher examines the various
variables while including numbers as
well as statistics in a project to
analyze its findings.
85%
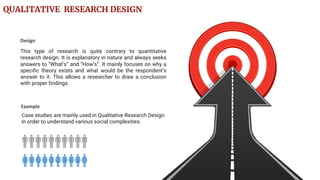
Case studies are mainly used in Qualitative Research Design
in order to understand various social complexities.
Example
This type of research is quite contrary to quantitative
research design. It is explanatory in nature and always seeks
answers to “What’s” and “How’s”. It mainly focuses on why a
specific theory exists and what would be the respondent’s
answer to it. This allows a researcher to draw a conclusion
with proper findings.
Design
QUALITATIVE RESEARCH DESIGN
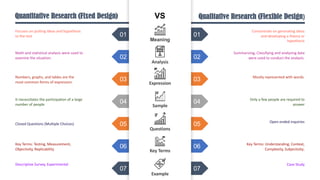
VS
Analysis
Expression
Sample
Questions
Key Terms
Example
01
02
03
04
05
06
07
01
02
03
04
05
06
07
Focuses on putting ideas and hypothesis
to the test
Concentrate on generating ideas
and developing a theory or
hypothesis
Math and statistical analysis were used to
examine the situation.
Numbers, graphs, and tables are the
most common forms of expression.
It necessitates the participation of a large
number of people
Closed Questions (Multiple Choices)
Key Terms: Testing, Measurement,
Objectivity, Replicability
Descriptive Survey, Experimental
Summarizing, Classifying and analyzing data
were used to conduct the analysis.
Mostly represented with words.
Only a few people are required to
answer
Open ended inquiries
Key Terms: Understanding, Context,
Complexity, Subjectivity.
Case Study
Quantitative Research (Fixed Design) Qualitative Research (Flexible Design)
Meaning
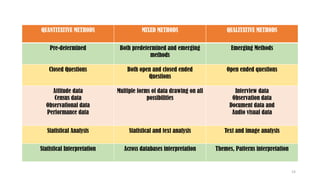
QUANTITATIVE METHODS MIXED METHODS QUALITATIVE METHODS
Pre-determined Both predetermined and emerging
methods
Emerging Methods
Closed Questions Both open and closed ended
Questions
Open ended questions
Attitude data
Census data
Observational data
Performance data
Multiple forms of data drawing on all
possibilities
Interview data
Observation data
Document data and
Audio visual data
Statistical Analysis Statistical and text analysis Text and image analysis
Statistical Interpretation Across databases interpretation Themes, Patterns interpretation
14
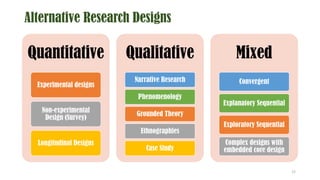
Alternative Research Designs
Quantitative
Experimental designs
Non-experimental
Design (Survey)
Longitudinal Designs
Qualitative
Narrative Research
Phenomenology
Grounded Theory
Ethnographies
Case Study
Mixed
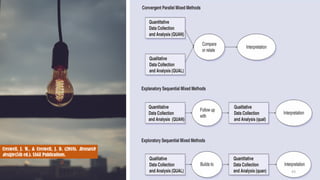
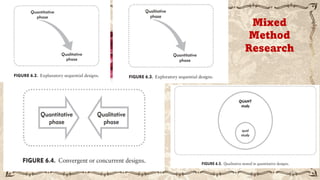
Convergent
Explanatory Sequential
Exploratory Sequential
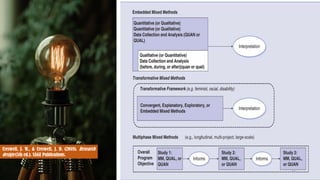
Complex designs with
embedded core design
15
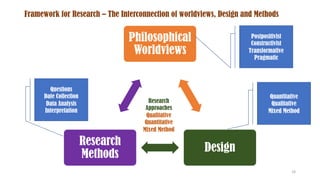
Framework for Research – The Interconnection of worldviews, Design and Methods
Philosophical
Worldviews
Design
Research
Methods
Postpositivist
Constructivist
Transformative
Pragmatic
Quantitative
Qualitative
Mixed Method
Questions
Date Collection
Data Analysis
Interpretation
Research
Approaches
Qualitative
Quantitative
Mixed Method
16
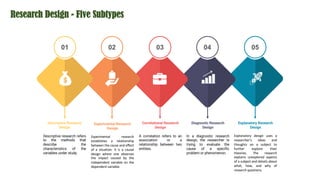
Research Design - Five Subtypes
01 02 03 04 05
Descriptive Research
Design
Descriptive research refers
to the methods that
describe the
characteristics of the
variables under study.
Experimental Research
Design
Experimental research
establishes a relationship
between the cause and effect
of a situation. It is a causal
design where one observes
the impact caused by the
independent variable on the
dependent variable.
Correlational Research
Design
A correlation refers to an
association or a
relationship between two
entities.
Diagnostic Research
Design
In a diagnostic research
design, the researcher is
trying to evaluate the
cause of a specific
problem or phenomenon.
Explanatory Research
Design
Explanatory design uses a
researcher’s ideas and
thoughts on a subject to
further explore their
theories. The research
explains unexplored aspects
of a subject and details about
what, how, and why of
research questions.
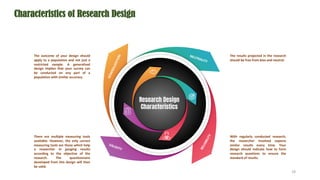
Characteristics of Research Design
The results projected in the research
should be free from bias and neutral.
With regularly conducted research,
the researcher involved expects
similar results every time. Your
design should indicate how to form
research questions to ensure the
standard of results.
There are multiple measuring tools
available. However, the only correct
measuring tools are those which help
a researcher in gauging results
according to the objective of the
research. The questionnaire
developed from this design will then
be valid.
The outcome of your design should
apply to a population and not just a
restricted sample. A generalized
design implies that your survey can
be conducted on any part of a
population with similar accuracy.
VALIDITY
R
E
L
I
A
B
I
L
I
T
Y
G
E
N
E
R
A
L
I
Z
A
T
I
O
N
Research Design
Characteristics
NEUTRALITY
18
Quantitative
Research
Design
19
Survey Method
20
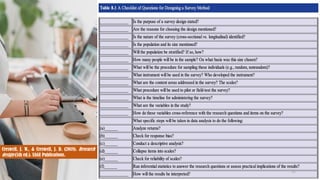
Survey Research
A survey design provides a quantitative or
numeric description of trends, attitudes, or
opinions of a population by studying a
sample of that population.
21
22
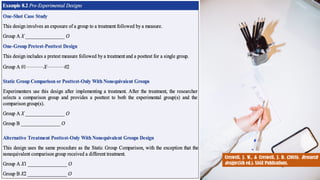
Creswell, J. W., & Creswell, J. D. (2018). Research
design (5th ed.). SAGE Publications.
Research Design Elements
Variables
Sampling
Techniques
Instruments
23
24
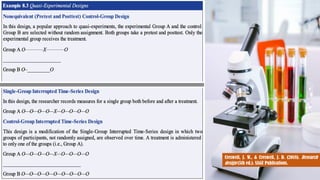
Creswell, J. W., & Creswell, J. D. (2018). Research
design (5th ed.). SAGE Publications.
Experimental
Research
25
Experimental
Research
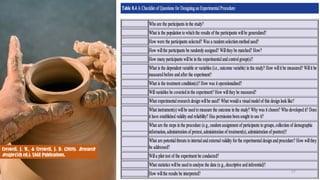
Experimental research is
a scientific approach to
research, where one or
more independent
variables are
manipulated and applied
to one or more
dependent variables to
measure their effect on
the latter.
27
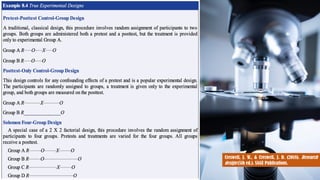
Creswell, J. W., & Creswell, J. D. (2018). Research
design (5th ed.). SAGE Publications.
28
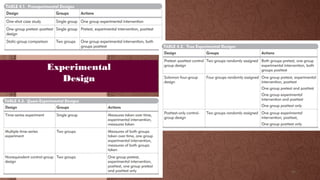
Creswell, J. W., & Creswell, J. D. (2018). Research
design (5th ed.). SAGE Publications.
29
Creswell, J. W., & Creswell, J. D. (2018). Research
design (5th ed.). SAGE Publications.
30
Creswell, J. W., & Creswell, J. D. (2018). Research
design (5th ed.). SAGE Publications.
Experimental
Design
31
32
Creswell, J. W., & Creswell, J. D. (2018). Research
design (5th ed.). SAGE Publications.
33
Creswell, J. W., & Creswell, J. D. (2018). Research
design (5th ed.). SAGE Publications.
Qualitative
Research
Designs
34
35
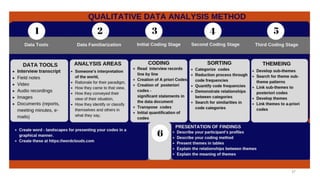
Qualitative Data Analysis
36
37
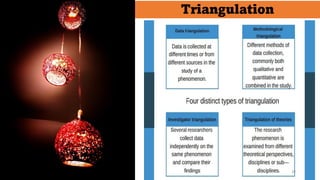
Triangulation
38
39
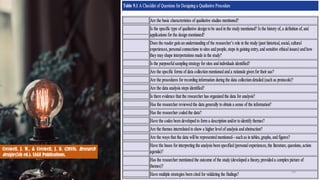
Creswell, J. W., & Creswell, J. D. (2018). Research
design (5th ed.). SAGE Publications.
40
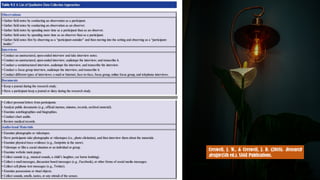
Creswell, J. W., & Creswell, J. D. (2018). Research
design (5th ed.). SAGE Publications.
Mixed Methods Design
41
42
43
Creswell, J. W., & Creswell, J. D. (2018). Research
design (5th ed.). SAGE Publications.
44
Creswell, J. W., & Creswell, J. D. (2018). Research
design (5th ed.). SAGE Publications.
Mixed
Method
Research
45
46
47
48
Creswell, J. W., & Creswell, J. D. (2018). Research design (5th ed.). SAGE
Publications.
Variables
49
Variables
The quantity or condition
that can change
(anything that has a quantity or
quality that varies)
50
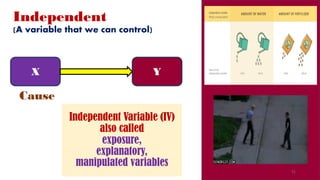
Independent
(A variable that we can control)
Cause
X Y
Independent Variable (IV)
also called
exposure,
explanatory,
manipulated variables
51
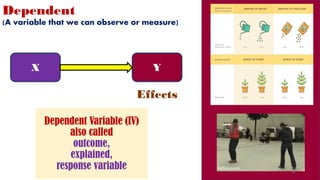
Dependent
(A variable that we can observe or measure)
Effects
X Y
Dependent Variable (IV)
also called
outcome,
explained,
response variable 52
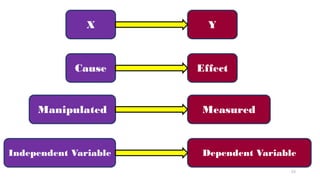
X Y
Cause Effect
Manipulated Measured
Independent Variable Dependent Variable
53
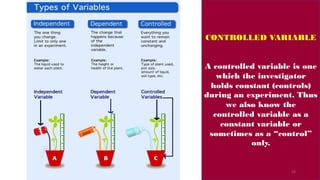
CONTROLLED VARIABLE
A controlled variable is one
which the investigator
holds constant (controls)
during an experiment. Thus
we also know the
controlled variable as a
constant variable or
sometimes as a “control”
only.
54
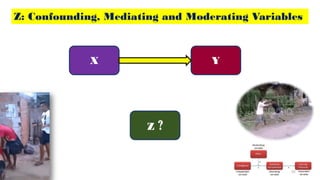
Z: Confounding, Mediating and Moderating Variables
X Y
Z ?
55
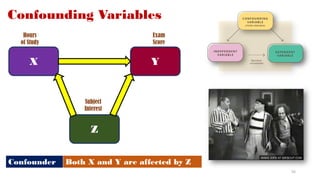
Confounding Variables
X Y
Z
Confounder Both X and Y are affected by Z
Subject
Interest
Hours
of Study
Exam
Score
56
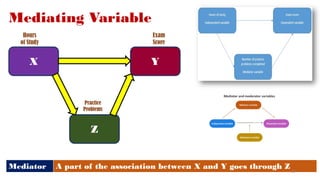
Mediating Variable
X Y
Z
Mediator A part of the association between X and Y goes through Z
Practice
Problems
Hours
of Study
Exam
Score
57
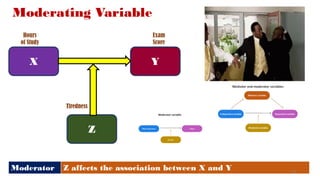
Moderating Variable
X Y
Z
Moderator Z affects the association between X and Y
Tiredness
Hours
of Study
Exam
Score
58
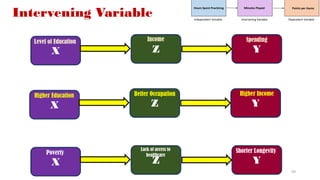
X Y
Z
Level of Education
Intervening Variable
Spending
Income
X Y
Z
Higher Education Higher Income
Better Occupation
X Y
Z
Poverty Shorter Longevity
Lack of access to
healthcare
59
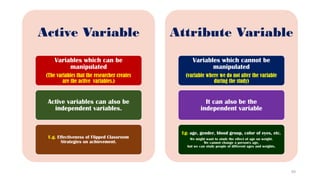
Active Variable
Variables which can be
manipulated
(The variables that the researcher creates
are the active variables.)
Active variables can also be
independent variables.
E.g. Effectiveness of Flipped Classroom
Strategies on achievement.
Attribute Variable
Variables which cannot be
manipulated
(variable where we do not alter the variable
during the study)
It can also be the
independent variable
Eg: age, gender, blood group, color of eyes, etc.
We might want to study the effect of age on weight.
We cannot change a person's age,
but we can study people of different ages and weights.
60
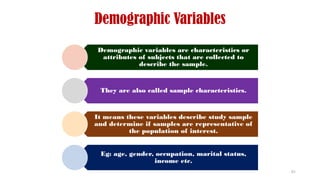
Demographic Variables
Demographic variables are characteristics or
attributes of subjects that are collected to
describe the sample.
They are also called sample characteristics.
It means these variables describe study sample
and determine if samples are representative of
the population of interest.
Eg: age, gender, occupation, marital status,
income etc.
61
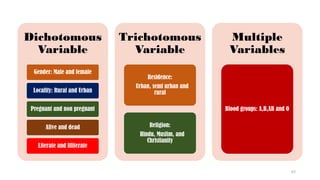
Dichotomous
Variable
Gender: Male and female
Locality: Rural and Urban
Pregnant and non pregnant
Alive and dead
Literate and illiterate
Trichotomous
Variable
Residence:
Urban, semi urban and
rural
Religion:
Hindu, Muslim, and
Christianity
Multiple
Variables
Blood groups: A,B,AB and O
62
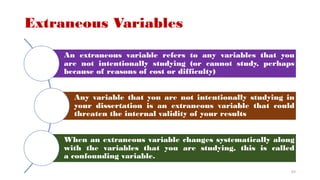
Extraneous Variables
An extraneous variable refers to any variables that you
are not intentionally studying (or cannot study, perhaps
because of reasons of cost or difficulty)
Any variable that you are not intentionally studying in
your dissertation is an extraneous variable that could
threaten the internal validity of your results
When an extraneous variable changes systematically along
with the variables that you are studying, this is called
a confounding variable.
63
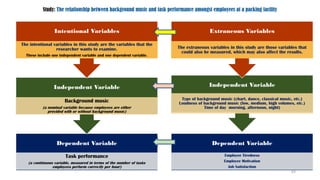
Dependent Variable
Task performance
(a continuous variable, measured in terms of the number of tasks
employees perform correctly per hour)
Independent Variable
Background music
(a nominal variable because employees are either
provided with or without background music)
Intentional Variables
The intentional variables in this study are the variables that the
researcher wants to examine.
These include one independent variable and one dependent variable.
Dependent Variable
Employee Tiredness
Employee Motivation
Job Satisfaction
Independent Variable
Type of background music (chart, dance, classical music, etc.)
Loudness of background music (low, medium, high volumes, etc.)
Time of day morning, afternoon, night)
Extraneous Variables
The extraneous variables in this study are those variables that
could also be measured, which may also affect the results.
Study: The relationship between background music and task performance amongst employees at a packing facility
64
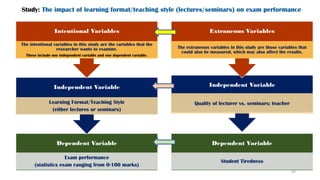
Dependent Variable
Exam performance
(statistics exam ranging from 0-100 marks)
Independent Variable
Learning Format/Teaching Style
(either lectures or seminars)
Intentional Variables
The intentional variables in this study are the variables that the
researcher wants to examine.
These include one independent variable and one dependent variable.
Dependent Variable
Student Tiredness
Independent Variable
Quality of lecturer vs. seminars; teacher
Extraneous Variables
The extraneous variables in this study are those variables that
could also be measured, which may also affect the results.
Study: The impact of learning format/teaching style (lectures/seminars) on exam performance
65
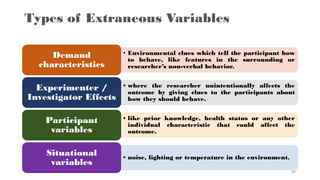
Types of Extraneous Variables
• Environmental clues which tell the participant how
to behave, like features in the surrounding or
researcher’s non-verbal behavior.
Demand
characteristics
• where the researcher unintentionally affects the
outcome by giving clues to the participants about
how they should behave.
Experimenter /
Investigator Effects
• like prior knowledge, health status or any other
individual characteristic that could affect the
outcome.
Participant
variables
• noise, lighting or temperature in the environment.
Situational
variables
66
Population and Sample
67
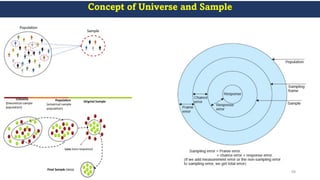
Concept of Universe and Sample
68
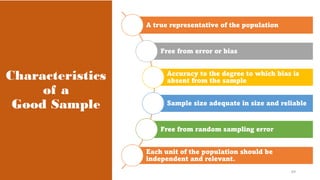
Characteristics
of a
Good Sample
A true representative of the population
Free from error or bias
Accuracy to the degree to which bias is
absent from the sample
Sample size adequate in size and reliable
Free from random sampling error
Each unit of the population should be
independent and relevant.
69
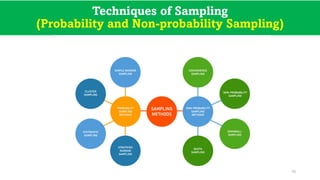
Techniques of Sampling
(Probability and Non-probability Sampling)
70
Tools & Techniques of
Research
71
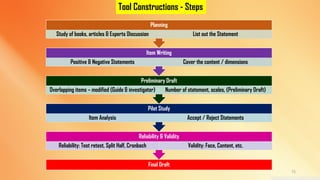
Tool Constructions - Steps
Final Draft
Reliability & Validity
Reliability: Test retest, Split Half, Cronbach Validity: Face, Content, etc.
Pilot Study
Item Analysis Accept / Reject Statements
Preliminary Draft
Overlapping items – modified (Guide & investigator) Number of statement, scales, (Preliminary Draft)
Item Writing
Positive & Negative Statements Cover the content / dimensions
Planning
Study of books, articles & Experts Discussion List out the Statement
72
Tools of Research in Education
Inquiry
Forms
Questionnaire
Checklist
Score-card
Schedule
Rating scale
Opinionnaire
Attitude scale
Observation Interview Sociometry
Psychological
Test
Achievement
Aptitude
Intelligence
Interest
inventory
Personality
Measures
73
Rating Scale
74
Rating Scales
Rating scales record judgment or opinions
and indicates the degree or amount of
different degrees of quality which are
arranged along a line is the scale.
75
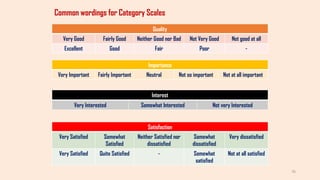
Common wordings for Category Scales
Quality
Very Good Fairly Good Neither Good nor Bad Not Very Good Not good at all
Excellent Good Fair Poor -
Importance
Very Important Fairly Important Neutral Not so important Not at all important
Satisfaction
Very Satisfied Somewhat
Satisfied
Neither Satisfied nor
dissatisfied
Somewhat
dissatisfied
Very dissatisfied
Very Satisfied Quite Satisfied - Somewhat
satisfied
Not at all satisfied
Interest
Very Interested Somewhat Interested Not very Interested
76
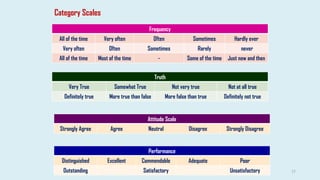
Category Scales
Frequency
All of the time Very often Often Sometimes Hardly ever
Very often Often Sometimes Rarely never
All of the time Most of the time - Some of the time Just now and then
Attitude Scale
Strongly Agree Agree Neutral Disagree Strongly Disagree
Truth
Very True Somewhat True Not very true Not at all true
Definitely true More true than false More false than true Definitely not true
Performance
Distinguished Excellent Commendable Adequate Poor
Outstanding Satisfactory Unsatisfactory 77
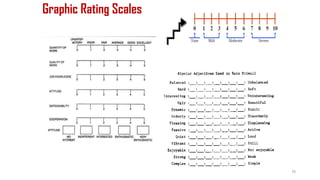
Graphic Rating Scales
78
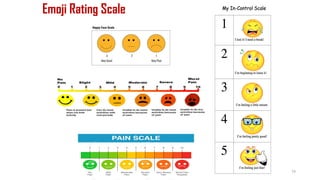
Emoji Rating Scale
79
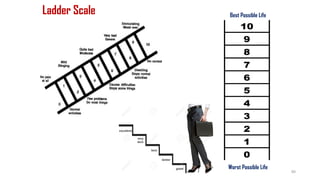
Ladder Scale
Worst Possible Life
Best Possible Life
80
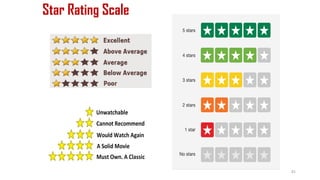
Star Rating Scale
81
Item Analysis
Item analysis is a statistical technique which is used for selecting and rejecting the
items of the test on the basis of their difficulty value and discriminated power.
Objectives of Item Analysis
• To select appropriate items for the final
draft
• To obtain the information about the
difficulty value (D.V) of all the items
• To provide discriminatory power (D.I)
to differentiate between capable and
less capable examinees for the items
• To provide modification to be made in
some of the items
• To prepare the final draft properly (
easy to difficult items)
Steps of Item analysis
• Arrange the scores in
descending order
• Separate two sub groups of the
test papers
• Take 27% of the scores out of
the highest scores and 27% of
the scores falling at bottom
• Count the number of right
answer in highest group (R.H)
and count the no of right answer
in lowest group (R.L)
• Count the non-response (N.R)
examinees
82
Cronbach’s Alpha Value
Cronbach's alpha is a measure of internal consistency, that is, how closely related a set of
items are as a group. It is considered to be a measure of scale reliability. A "high" value
for alpha does not imply that the measure is unidimensional.
MSE = Mean Score Error; MSB= Mean Score Between group
Spss demo
Excel demo
83
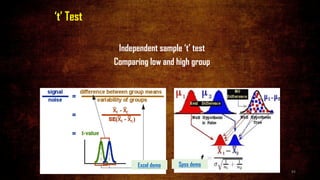
‘t’ Test
Independent sample ‘t’ test
Comparing low and high group
Spss demo
Excel demo
84
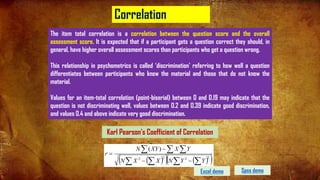
Correlation
Karl Pearson's Coefficient of Correlation
( )
( ) ( )
( )
2
2
2
2
)
(
å
å
å
å
å
å
å
-
-
-
=
Y
Y
N
X
X
N
Y
X
XY
N
r
The item total correlation is a correlation between the question score and the overall
assessment score. It is expected that if a participant gets a question correct they should, in
general, have higher overall assessment scores than participants who get a question wrong.
This relationship in psychometrics is called ‘discrimination’ referring to how well a question
differentiates between participants who know the material and those that do not know the
material.
Values for an item-total correlation (point-biserial) between 0 and 0.19 may indicate that the
question is not discriminating well, values between 0.2 and 0.39 indicate good discrimination,
and values 0.4 and above indicate very good discrimination.
Spss demo
Excel demo 85
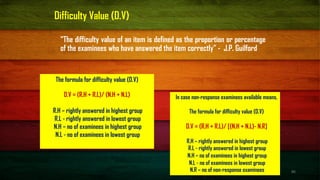
Difficulty Value (D.V)
“The difficulty value of an item is defined as the proportion or percentage
of the examinees who have answered the item correctly” - J.P. Guilford
The formula for difficulty value (D.V)
D.V = (R.H + R.L)/ (N.H + N.L)
R.H – rightly answered in highest group
R.L - rightly answered in lowest group
N.H – no of examinees in highest group
N.L - no of examinees in lowest group
In case non-response examinees available means,
The formula for difficulty value (D.V)
D.V = (R.H + R.L)/ [(N.H + N.L)- N.R]
R.H – rightly answered in highest group
R.L - rightly answered in lowest group
N.H – no of examinees in highest group
N.L - no of examinees in lowest group
N.R – no of non-response examinees 86
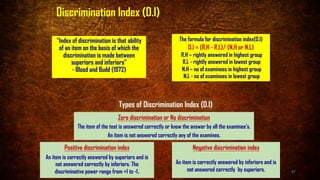
Discrimination Index (D.I)
“Index of discrimination is that ability
of an item on the basis of which the
discrimination is made between
superiors and inferiors”
- Blood and Budd (1972)
Zero discrimination or No discrimination
The item of the test is answered correctly or know the answer by all the examinee’s.
An item is not answered correctly any of the examinee.
Positive discrimination index
An item is correctly answered by superiors and is
not answered correctly by inferiors. The
discriminative power range from +1 to -1.
Negative discrimination index
An item is correctly answered by inferiors and is
not answered correctly by superiors.
Types of Discrimination Index (D.I)
The formula for discrimination index(D.I)
D.I = (R.H - R.L)/ (N.H or N.L)
R.H – rightly answered in highest group
R.L - rightly answered in lowest group
N.H – no of examinees in highest group
N.L - no of examinees in lowest group
87
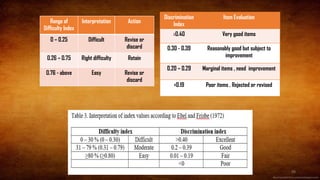
Range of
Difficulty Index
Interpretation Action
0 – 0.25 Difficult Revise or
discard
0.26 – 0.75 Right difficulty Retain
0.76 - above Easy Revise or
discard
Discrimination
Index
Item Evaluation
≥0.40 Very good items
0.30 - 0.39 Reasonably good but subject to
improvement
0.20 – 0.29 Marginal items , need improvement
<0.19 Poor items . Rejected or revised
88
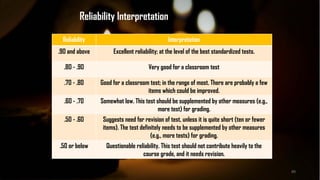
Reliability Interpretation
.90 and above Excellent reliability; at the level of the best standardized tests.
.80 - .90 Very good for a classroom test
.70 - .80 Good for a classroom test; in the range of most. There are probably a few
items which could be improved.
.60 - .70 Somewhat low. This test should be supplemented by other measures (e.g.,
more test) for grading.
.50 - .60 Suggests need for revision of test, unless it is quite short (ten or fewer
items). The test definitely needs to be supplemented by other measures
(e.g., more tests) for grading.
.50 or below Questionable reliability. This test should not contribute heavily to the
course grade, and it needs revision.
Reliability Interpretation
89
Instruments /
Tools of Research
Validity, Reliability and
Standardisation of a Tool
90
TESTING
A
good
test
has
91
…a balance of
Validity
92
…and
Reliability
93
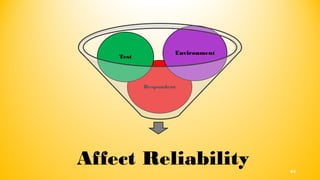
Respondent
Test
Environment
Affect Reliability 94
Reliability
• The consistency of your
measurement instrument
• The degree to which an instrument
measures the same way each time it
is used under the same condition
with the same subjects
Reliability
is
95
Validity
• if an instrument measures what it
is supposed to
• how “true” or accurate the
measurement is
Validity
asks
96
Types of Reliability
97
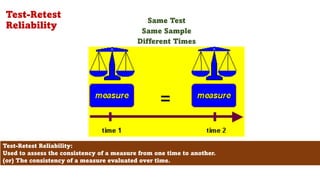
Test-Retest
Reliability
Same Test
Same Sample
Different Times
98
Test-Retest Reliability:
Used to assess the consistency of a measure from one time to another.
(or) The consistency of a measure evaluated over time.
Parallel Forms Reliability
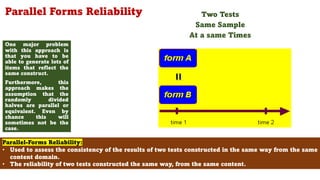
One major problem
with this approach is
that you have to be
able to generate lots of
items that reflect the
same construct.
Furthermore, this
approach makes the
assumption that the
randomly divided
halves are parallel or
equivalent. Even by
chance this will
sometimes not be the
case.
99
Parallel-Forms Reliability:
• Used to assess the consistency of the results of two tests constructed in the same way from the same
content domain.
• The reliability of two tests constructed the same way, from the same content.
Two Tests
Same Sample
At a same Times
Split-Half Reliability
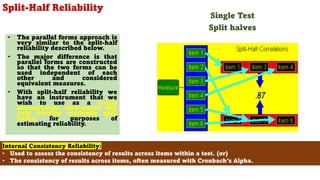
• The parallel forms approach is
very similar to the split-half
reliability described below.
• The major difference is that
parallel forms are constructed
so that the two forms can be
used independent of each
other and considered
equivalent measures.
• With split-half reliability we
have an instrument that we
wish to use as a single
measurement instrument and
only develop randomly split
halves for purposes of
estimating reliability.
100
Internal Consistency Reliability:
• Used to assess the consistency of results across items within a test. (or)
• The consistency of results across items, often measured with Cronbach’s Alpha.
Single Test
Split halves