Downloaded 272 times
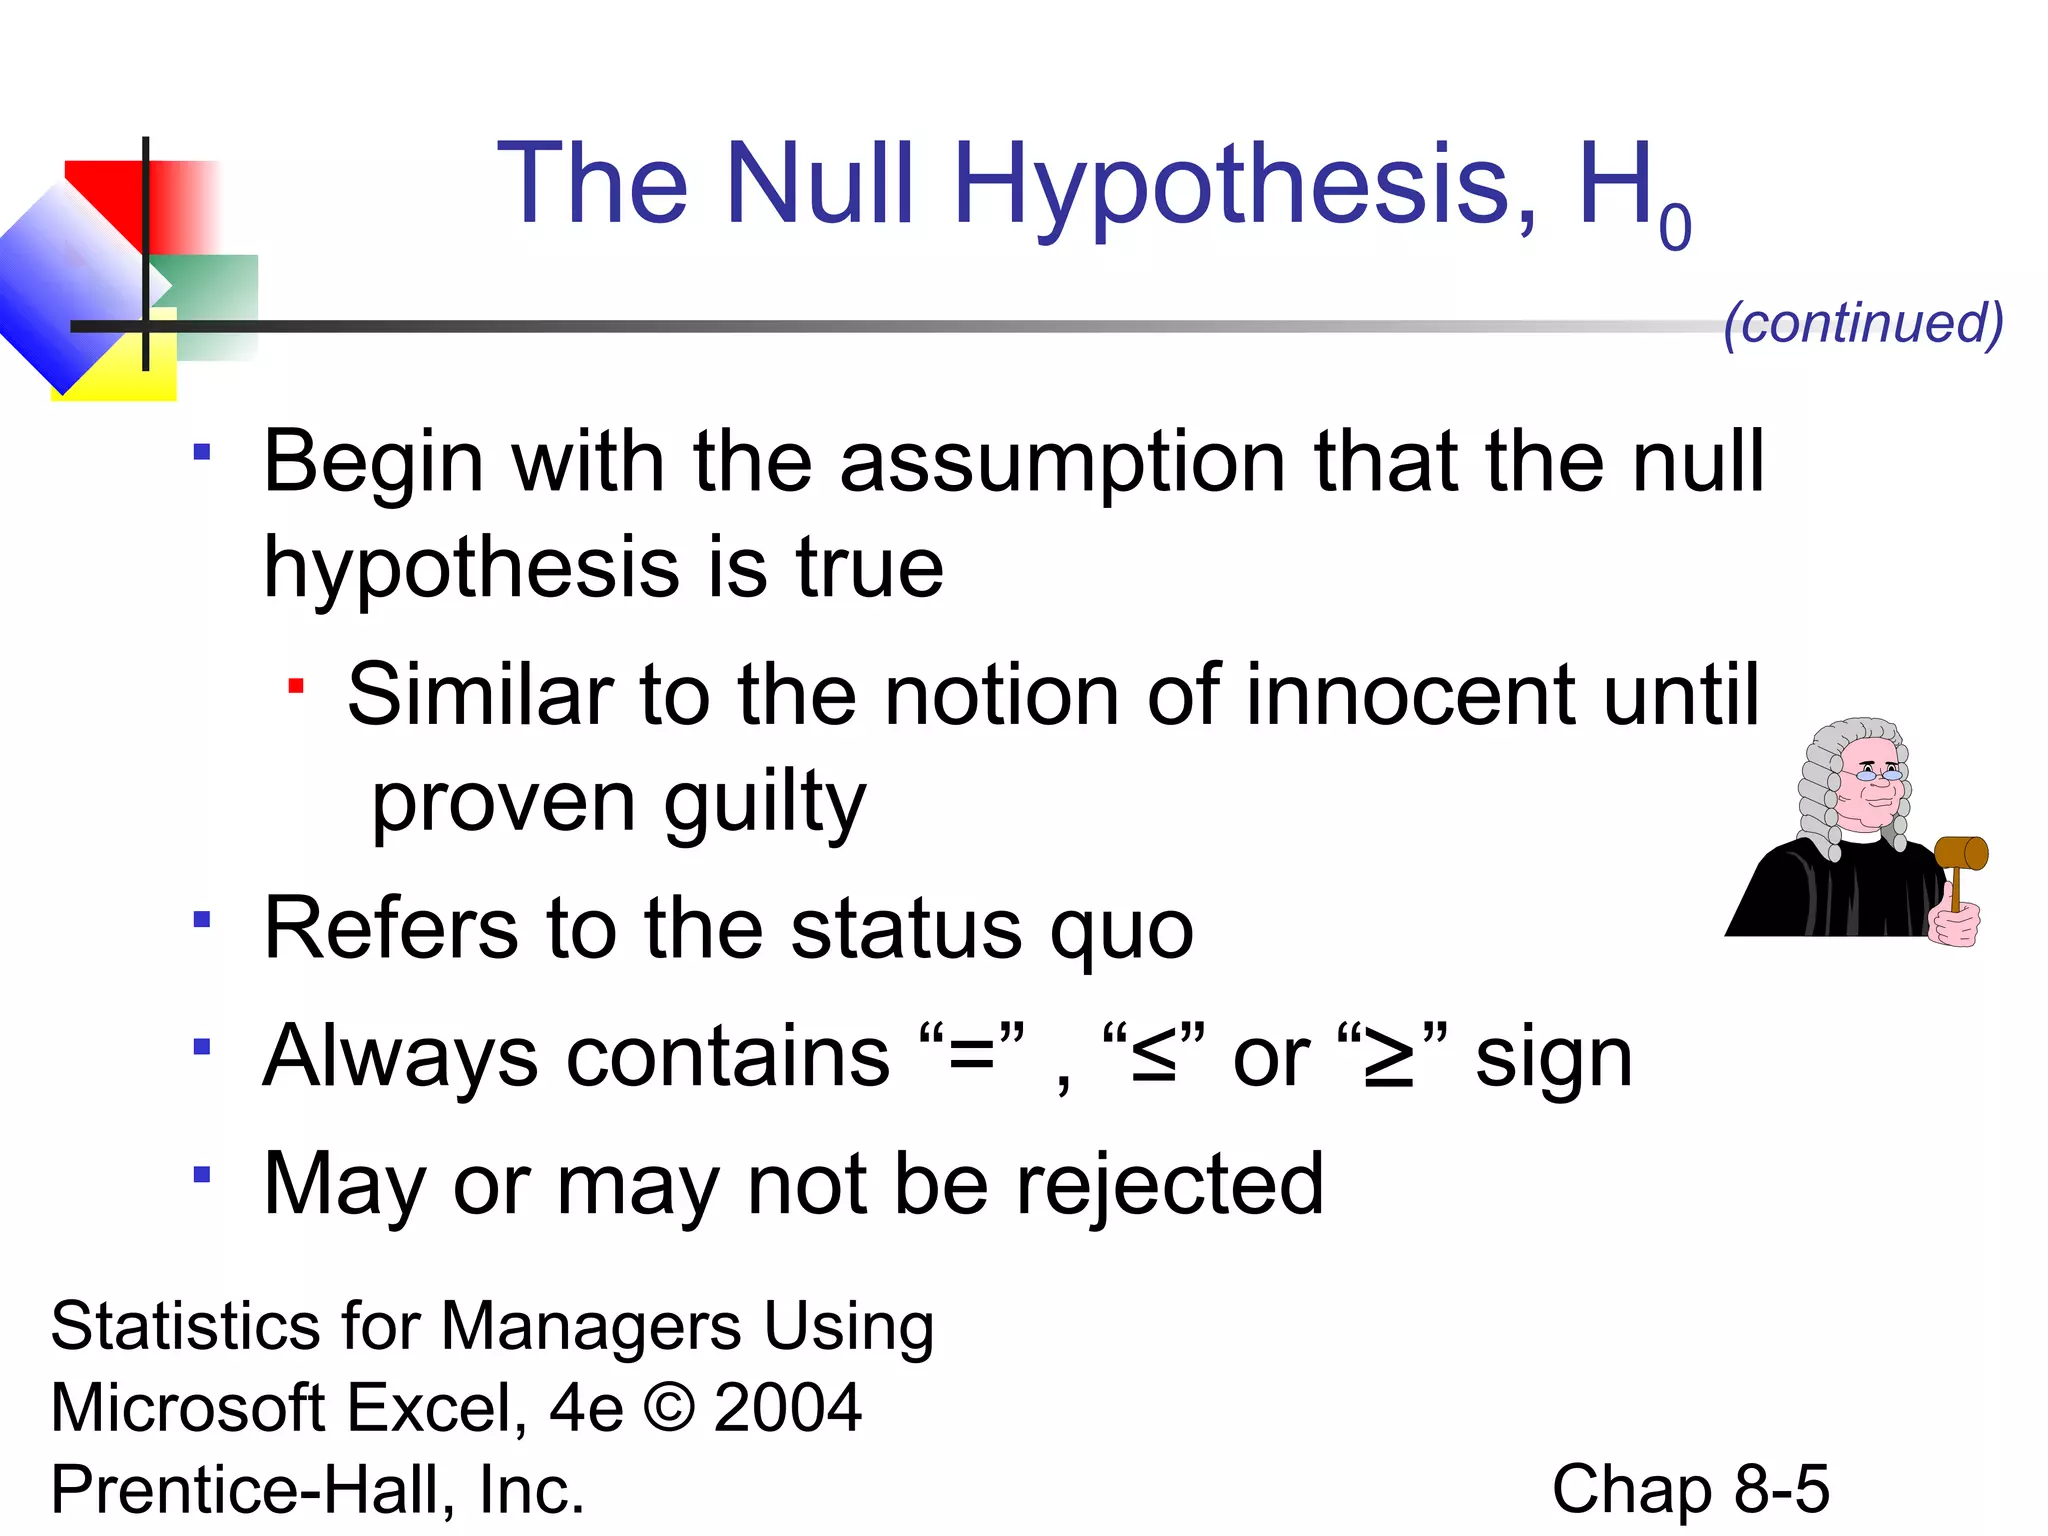
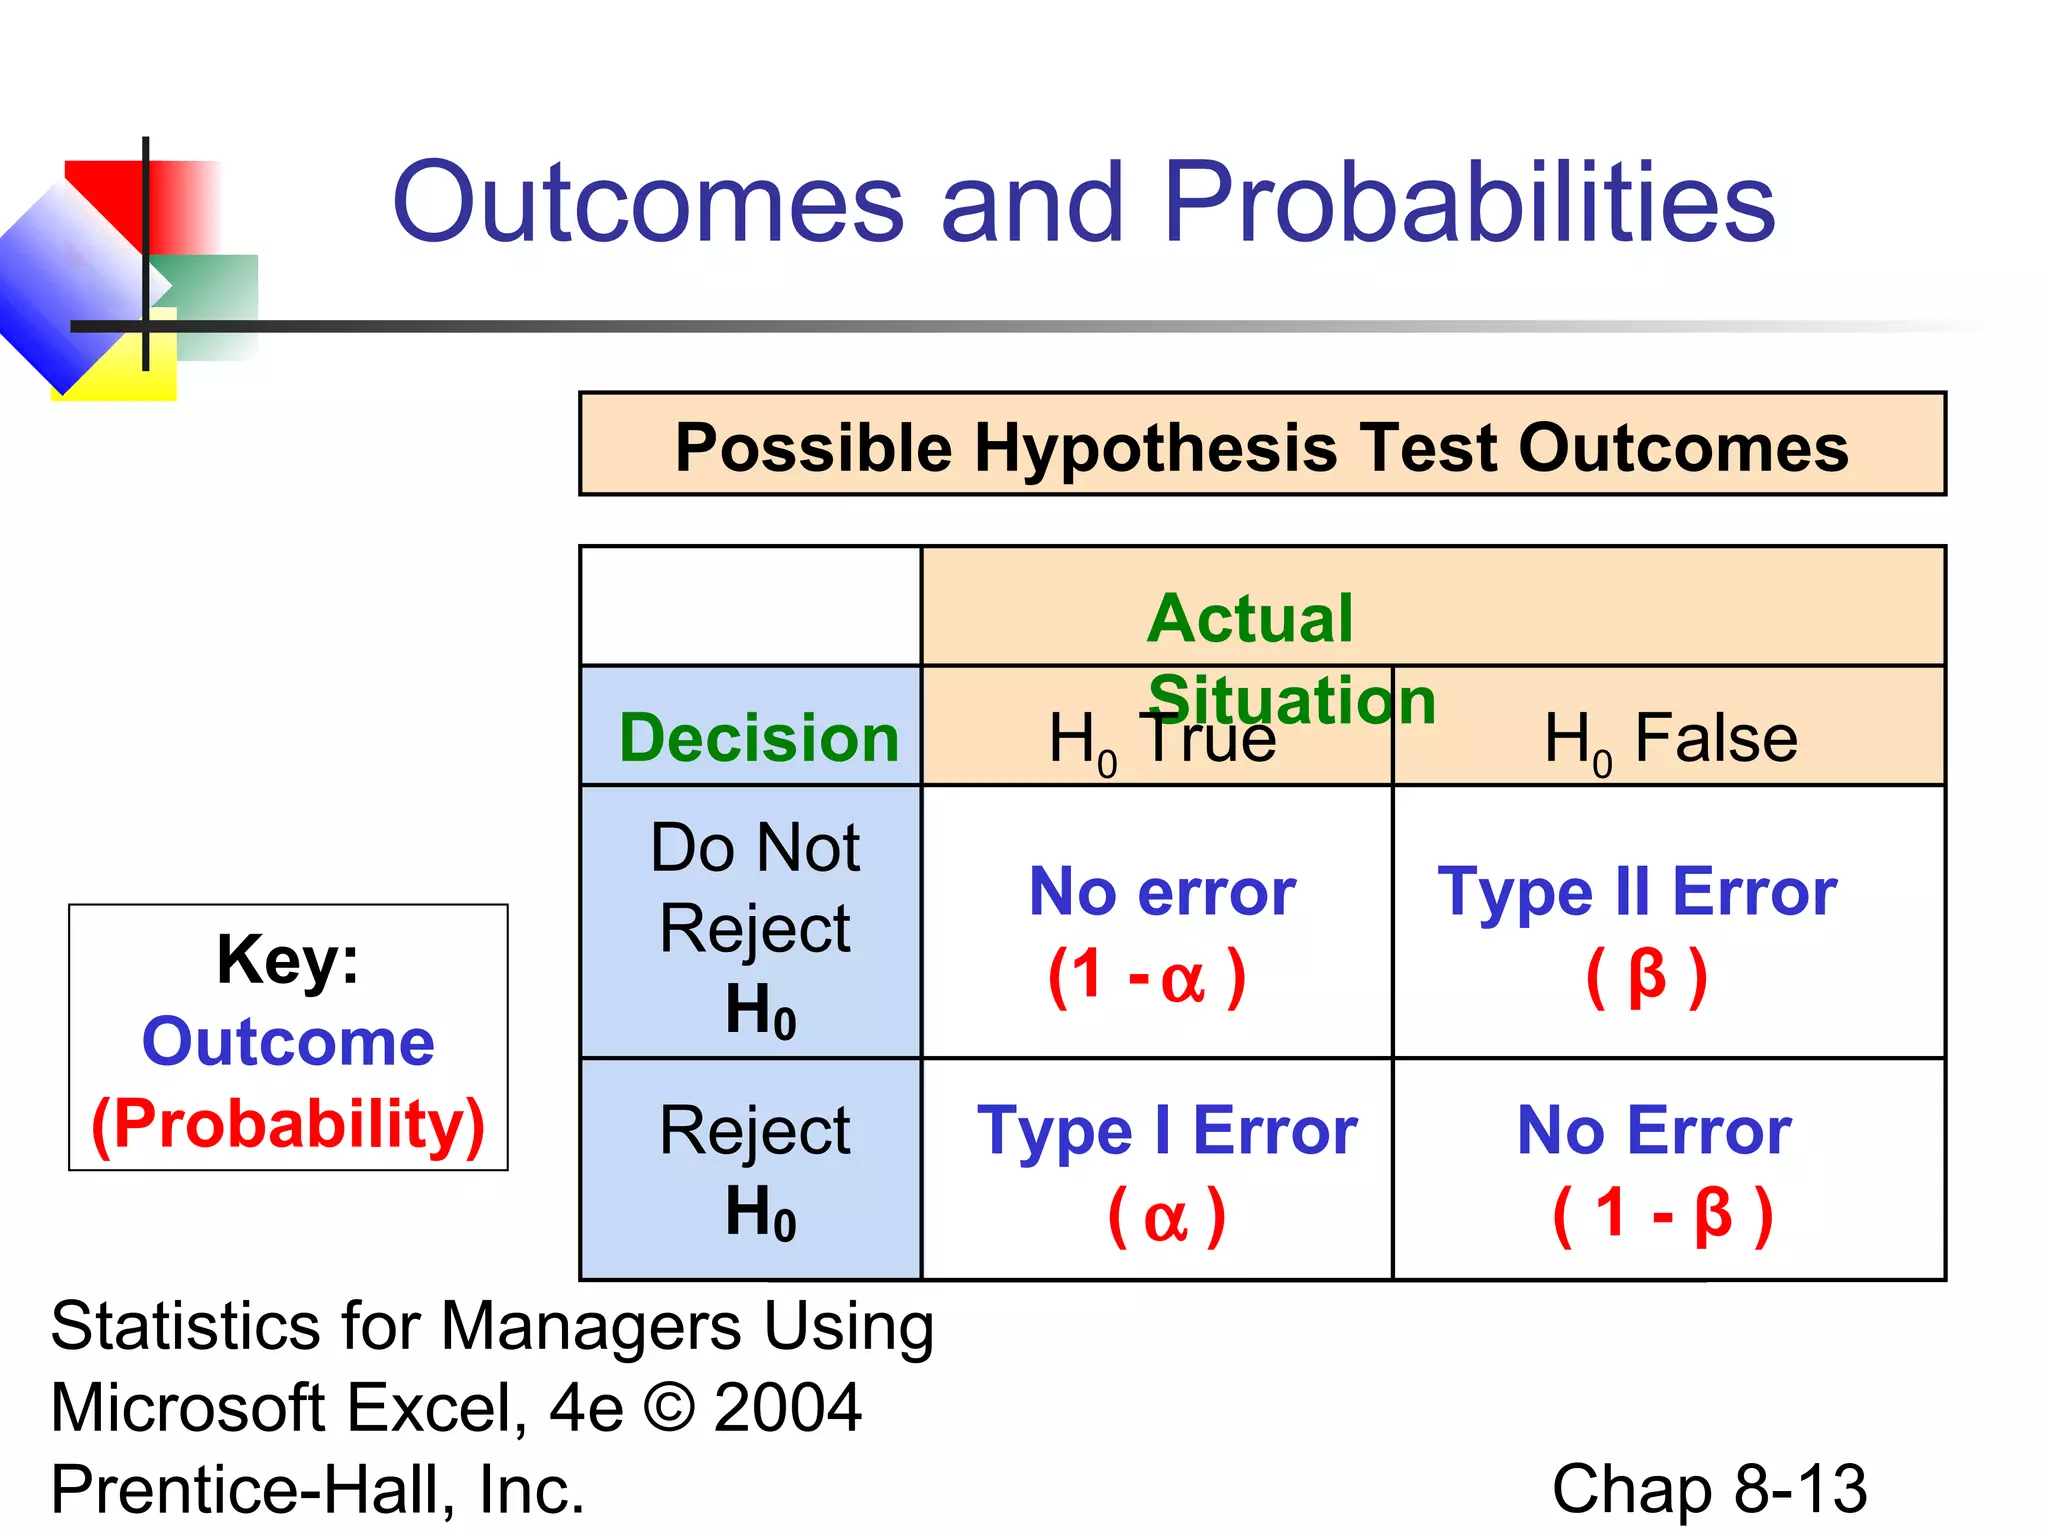
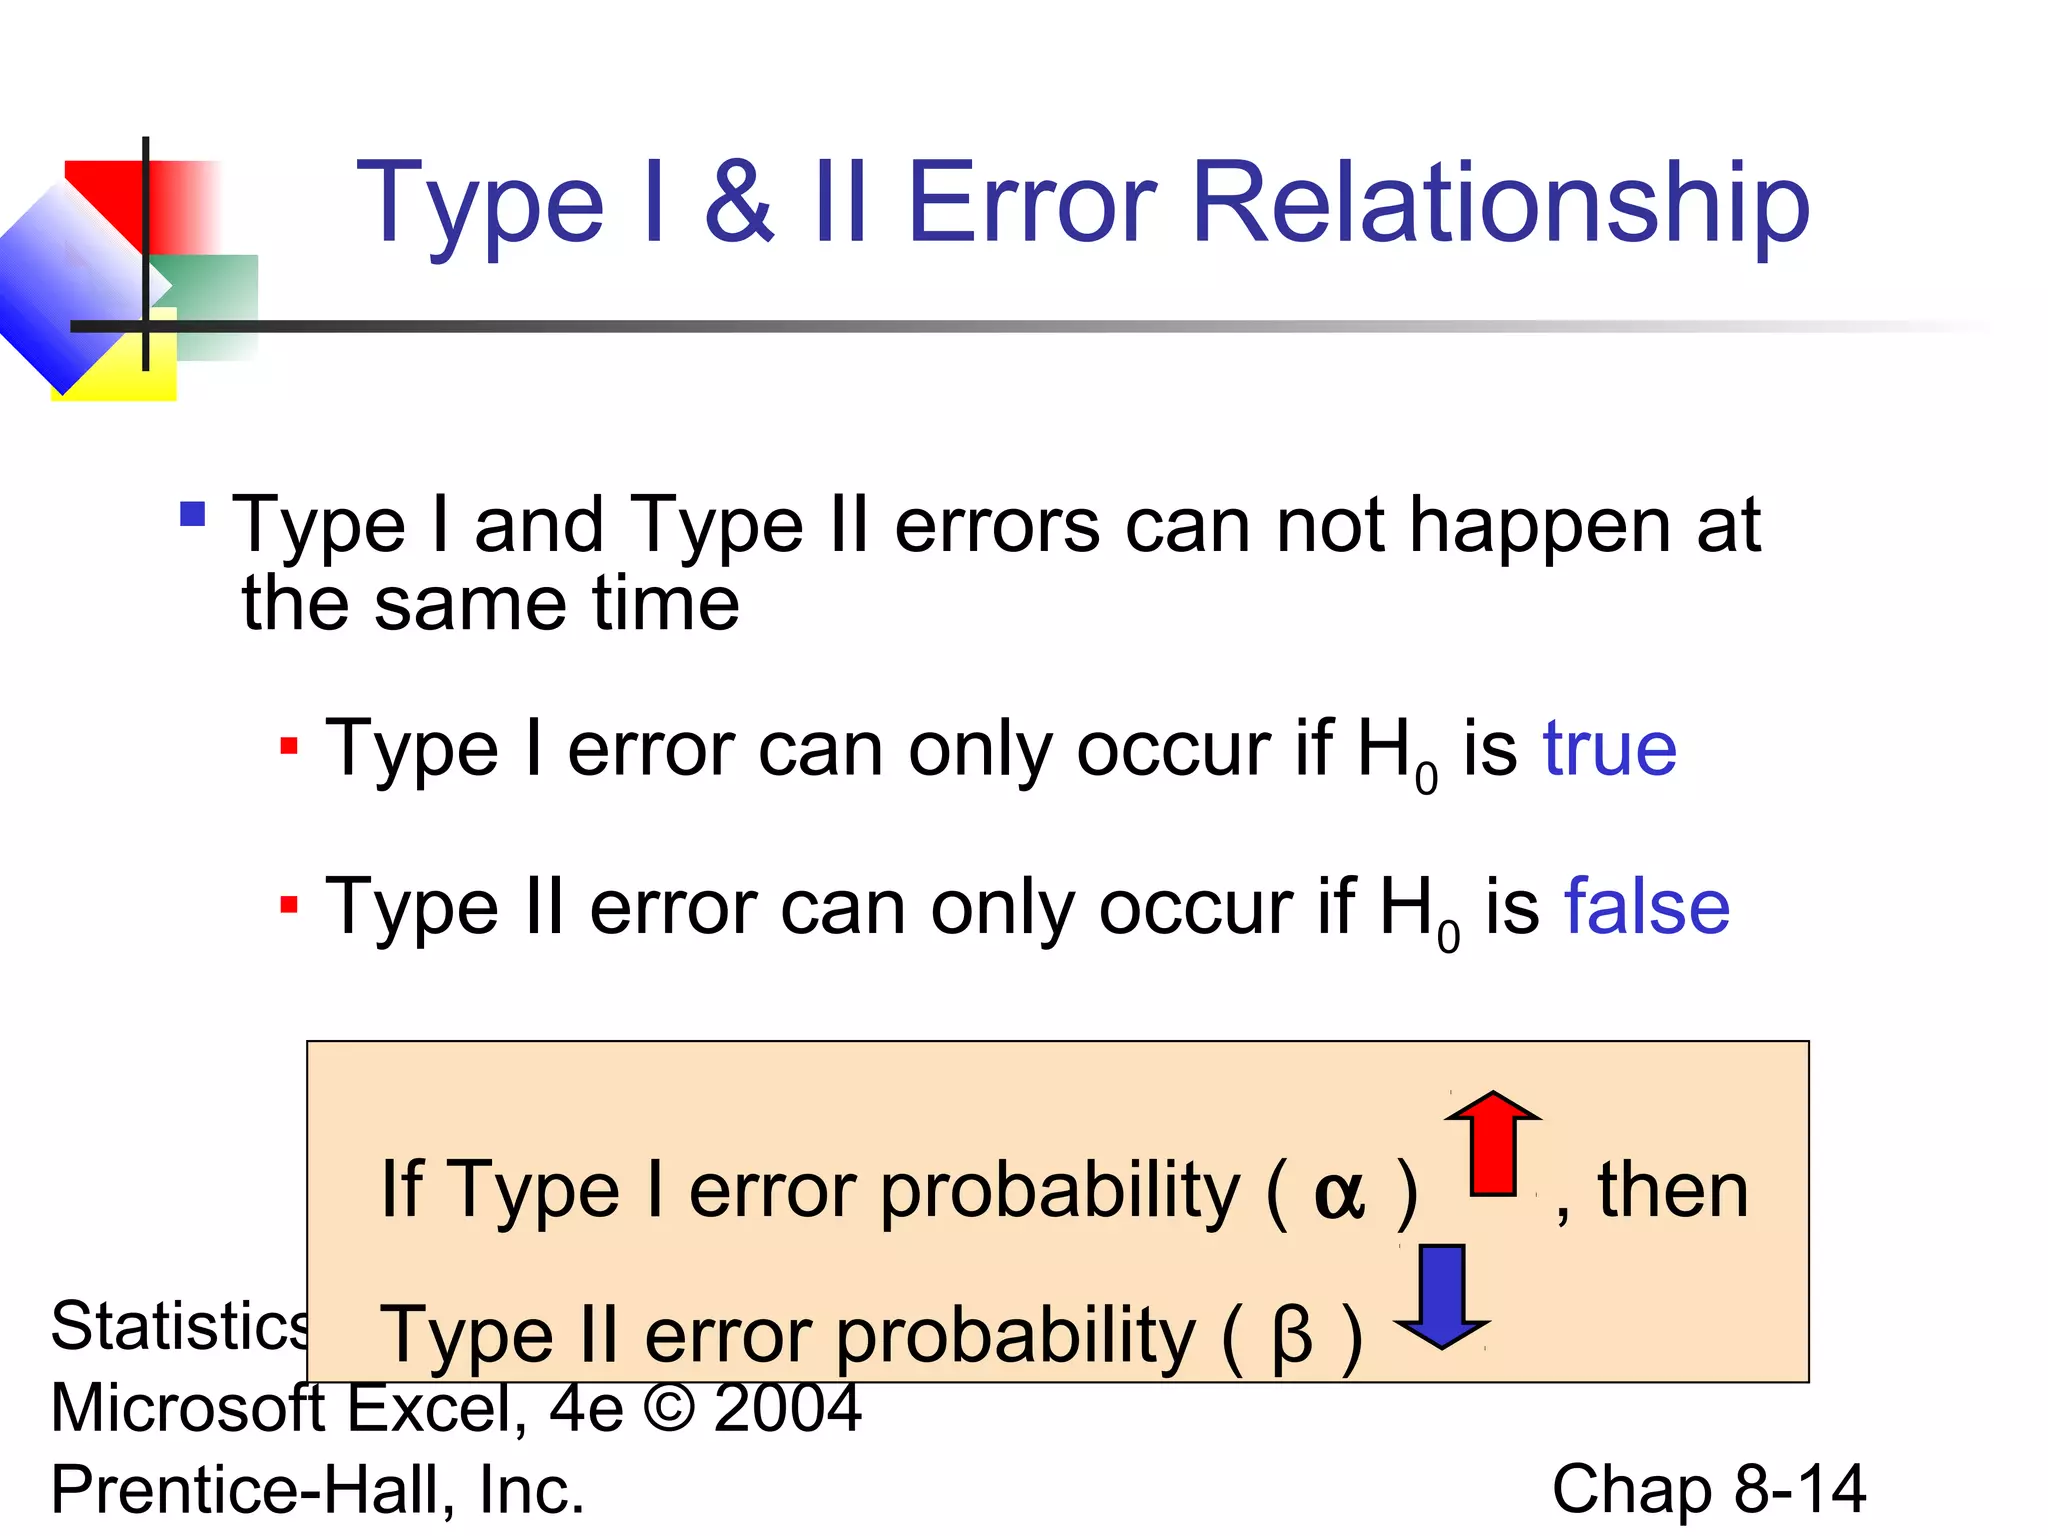
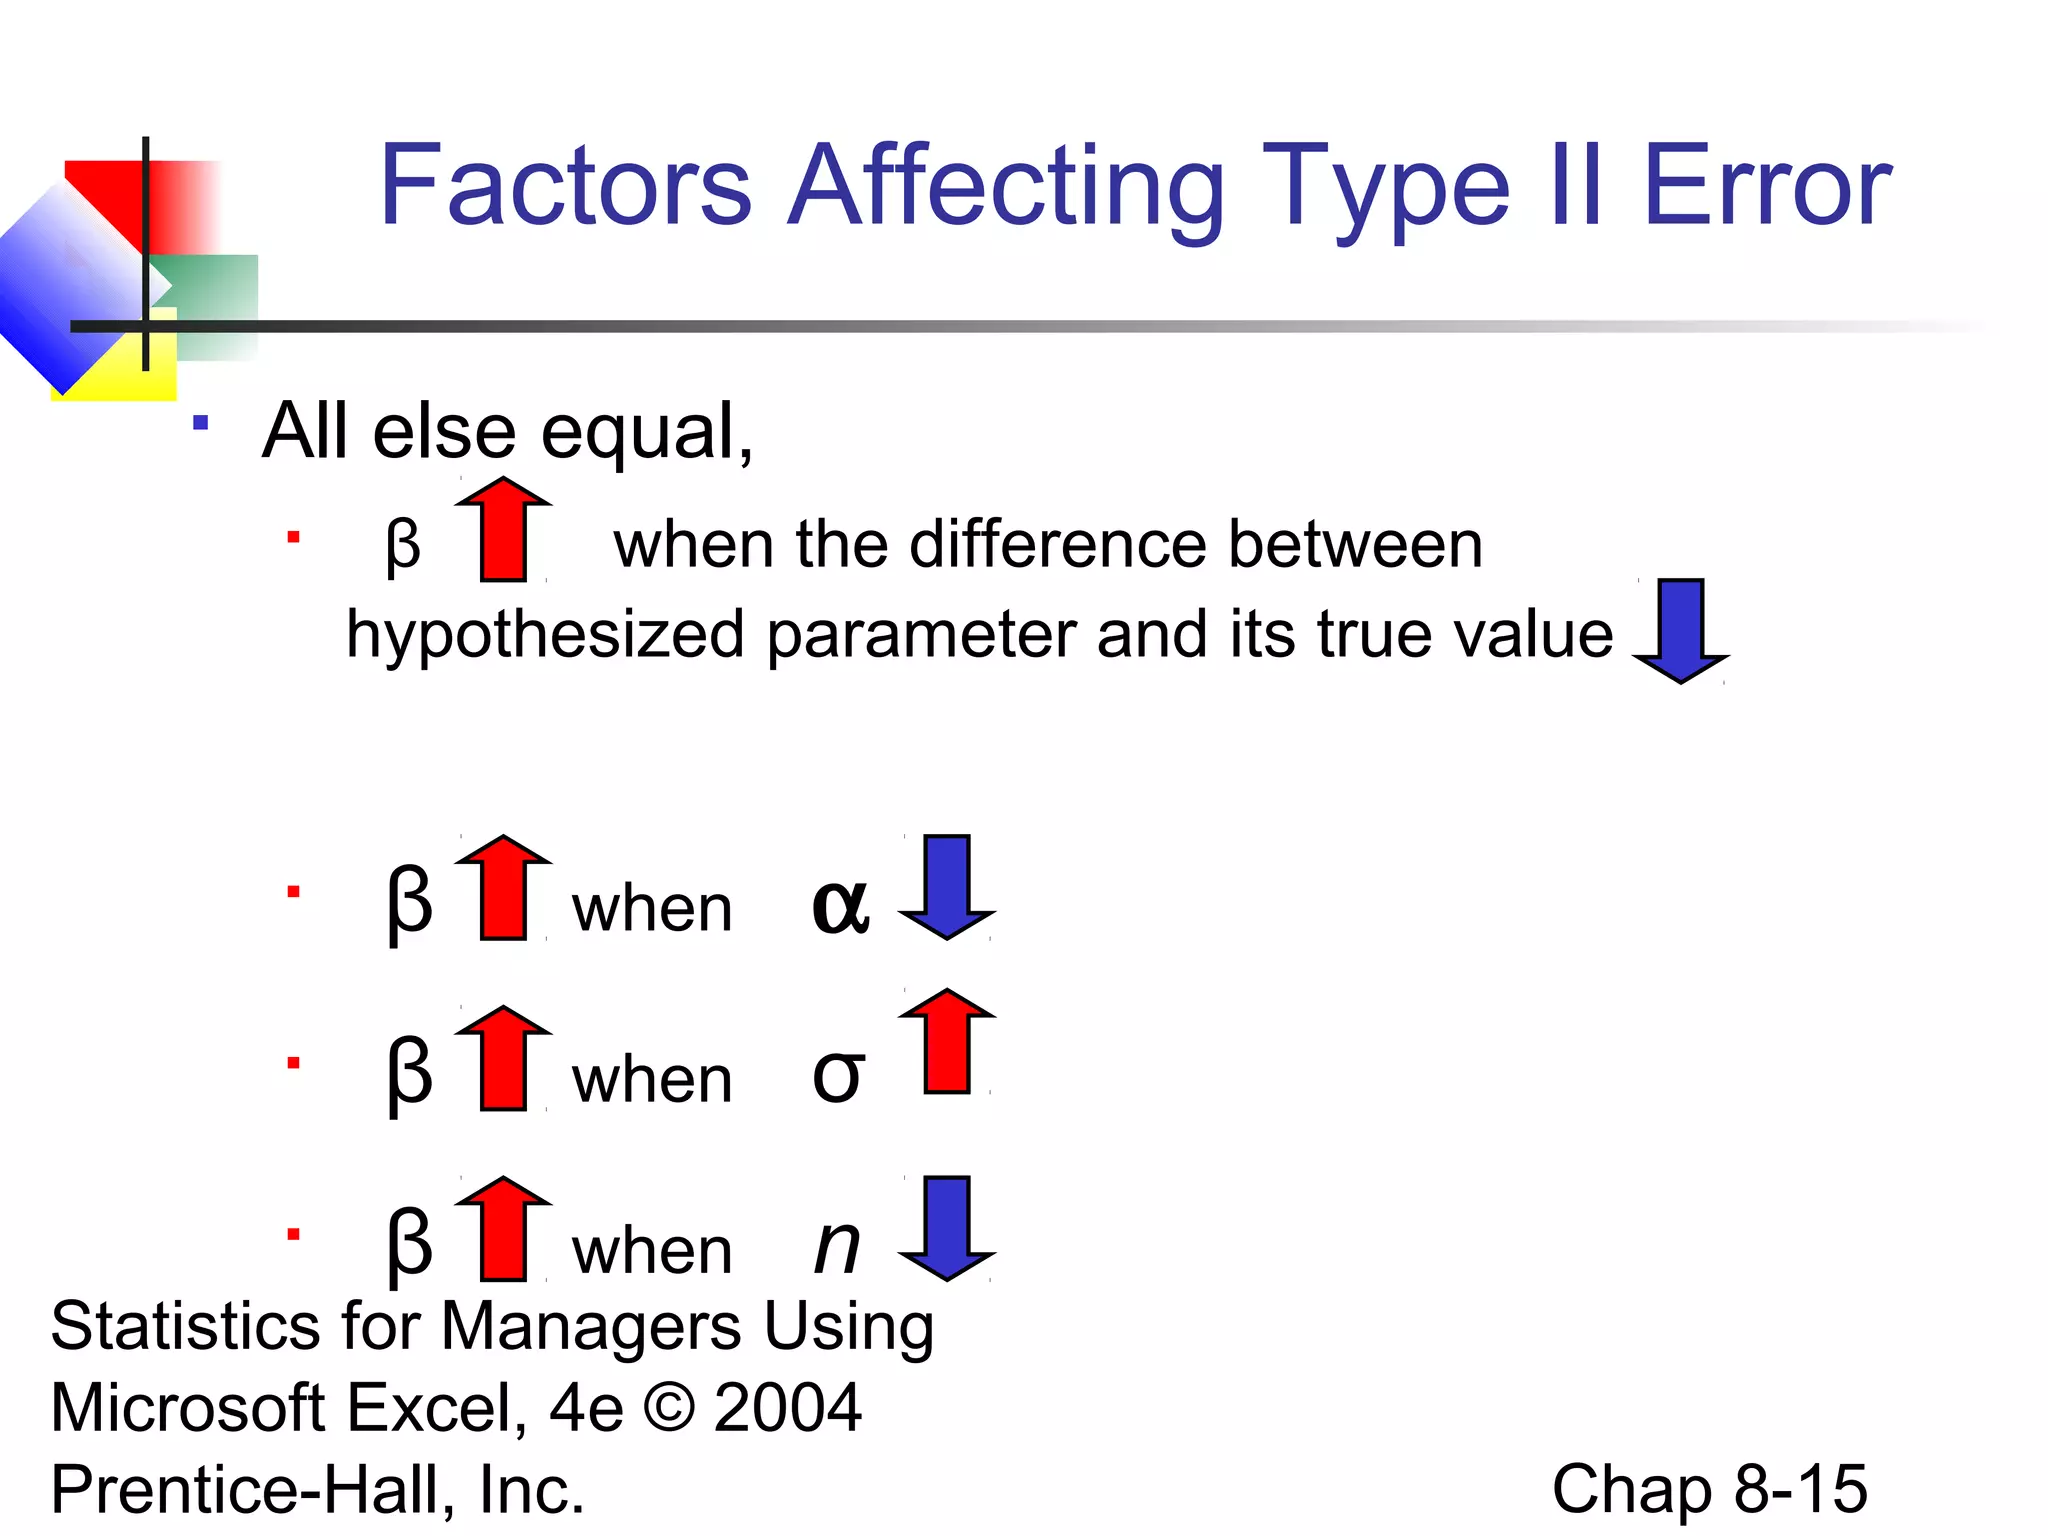
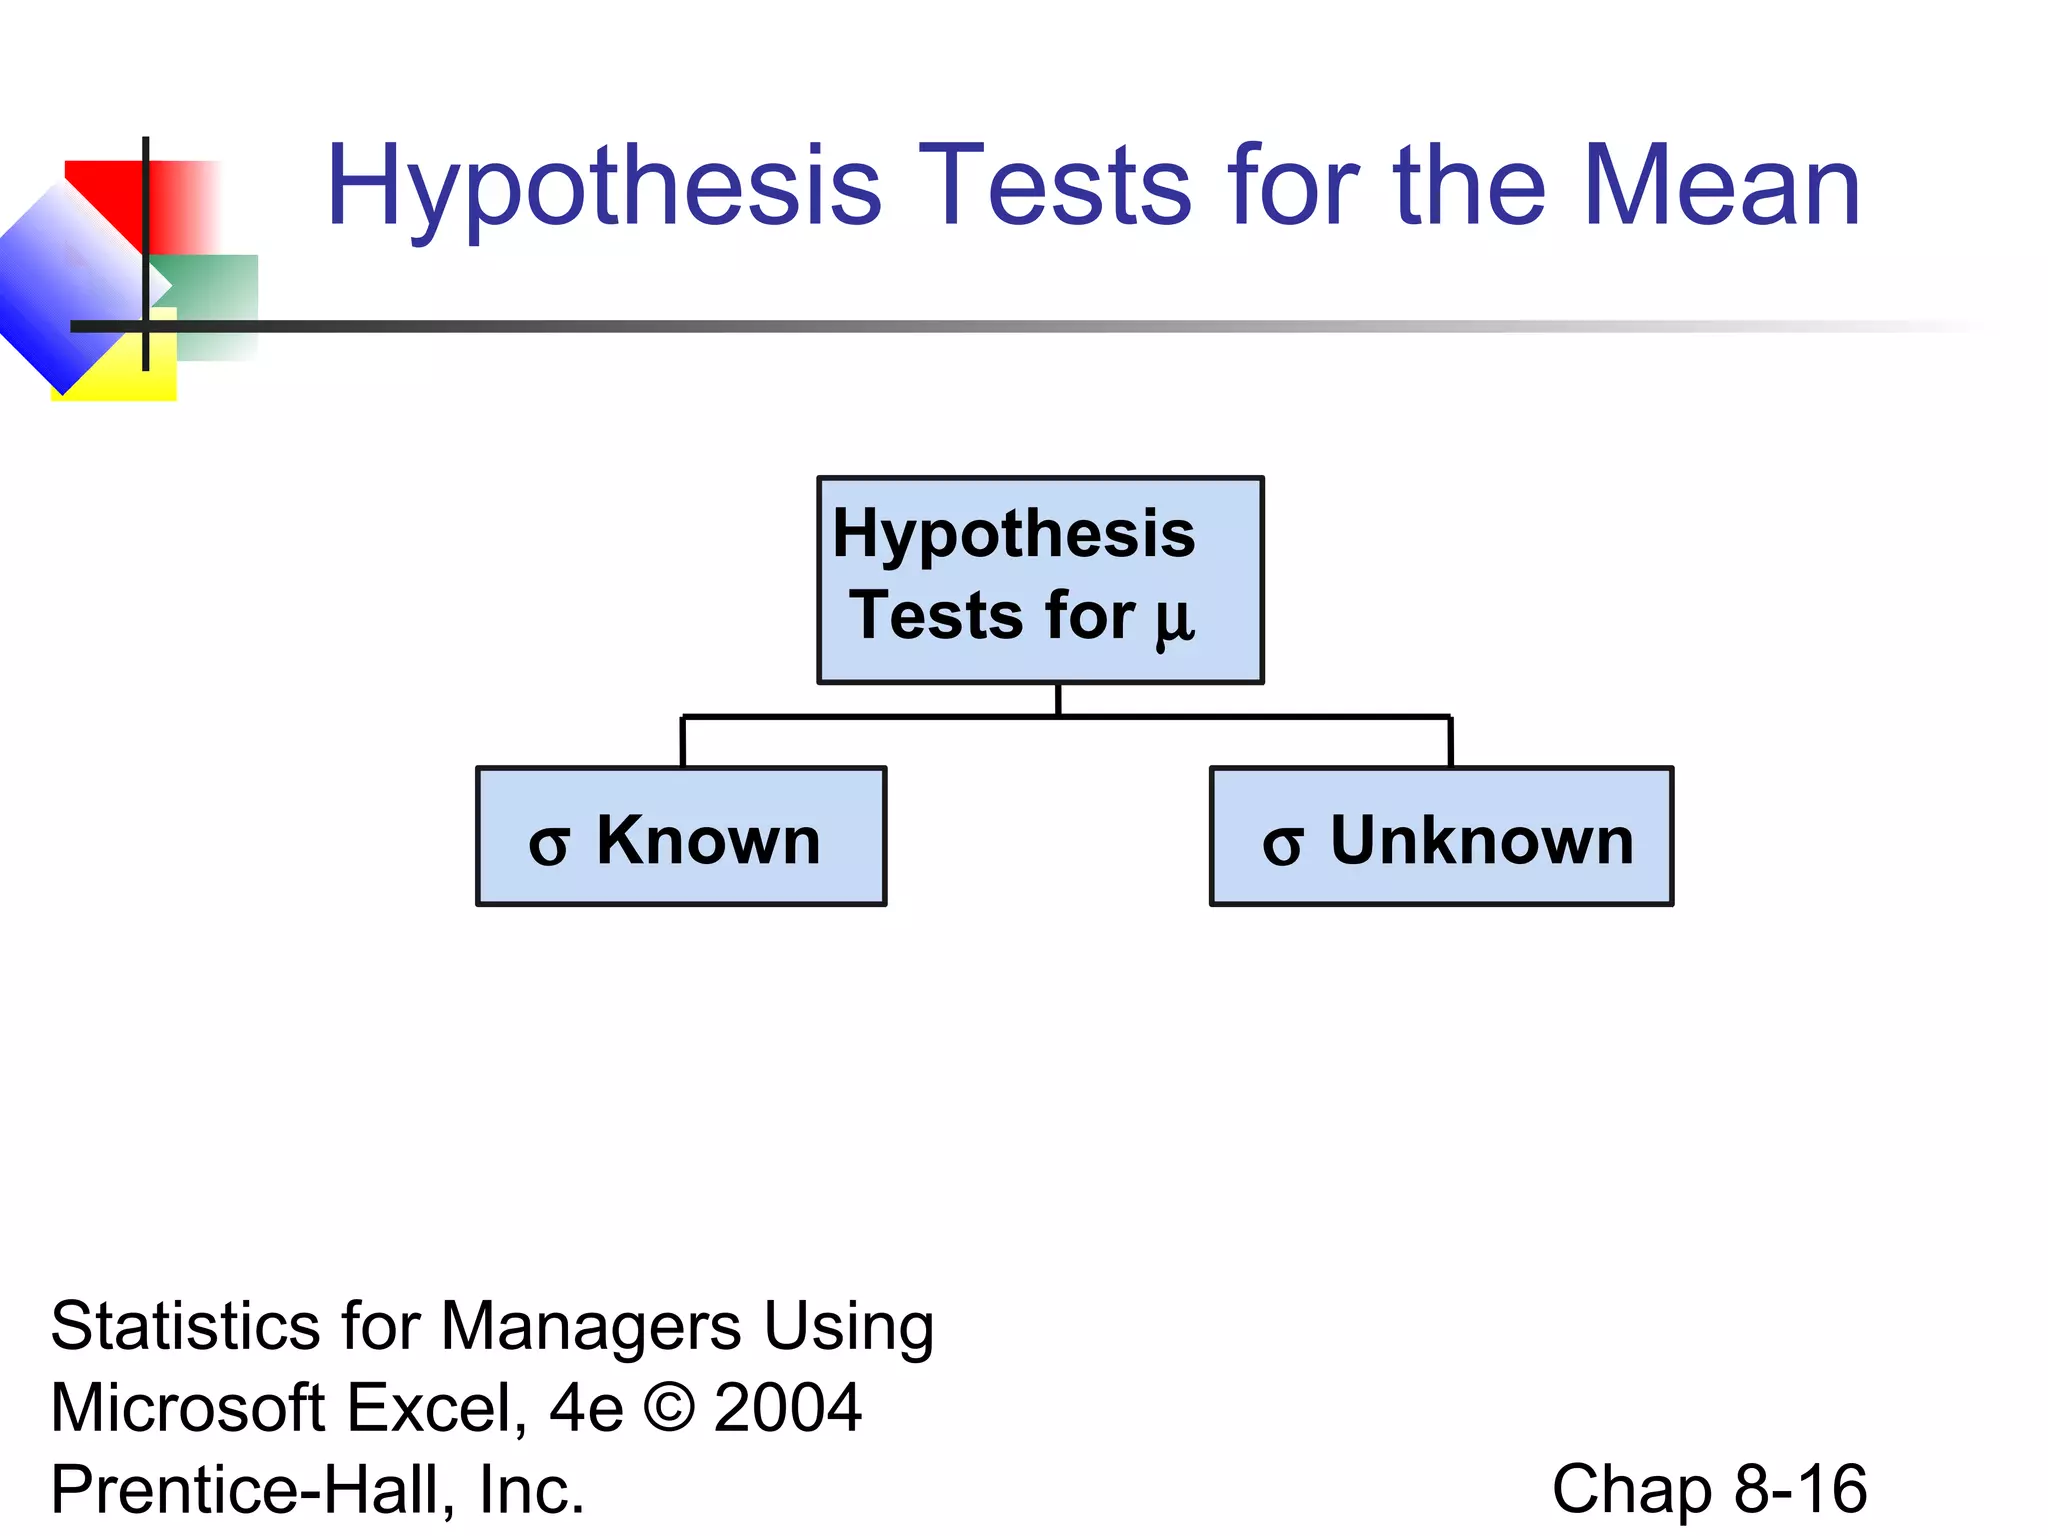
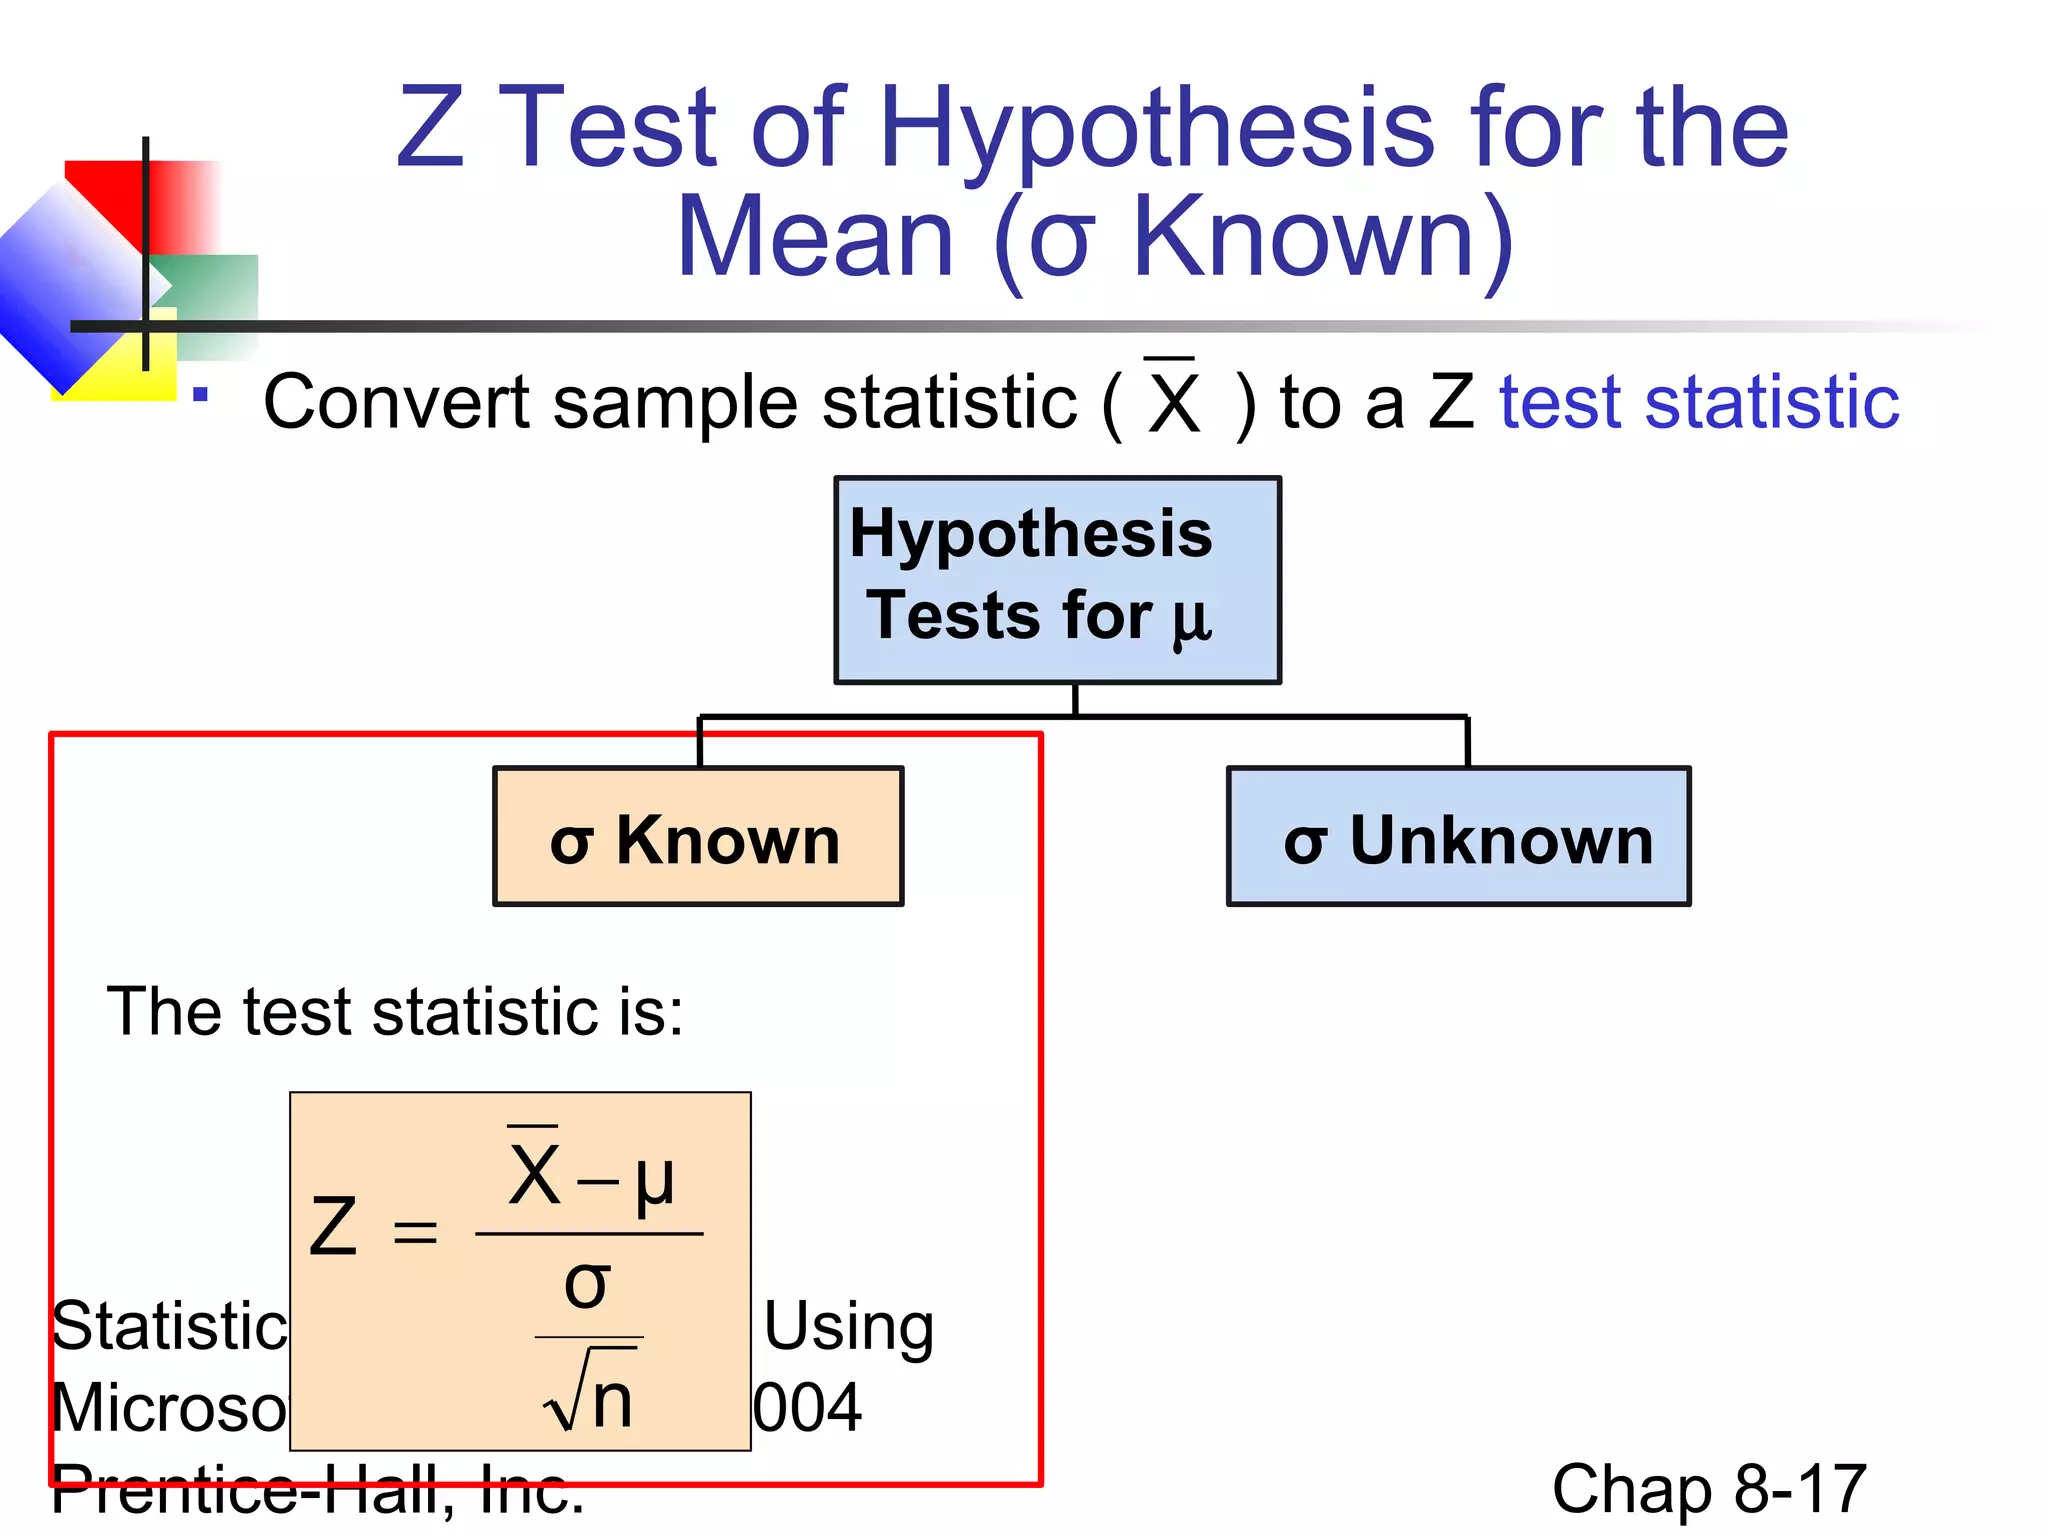
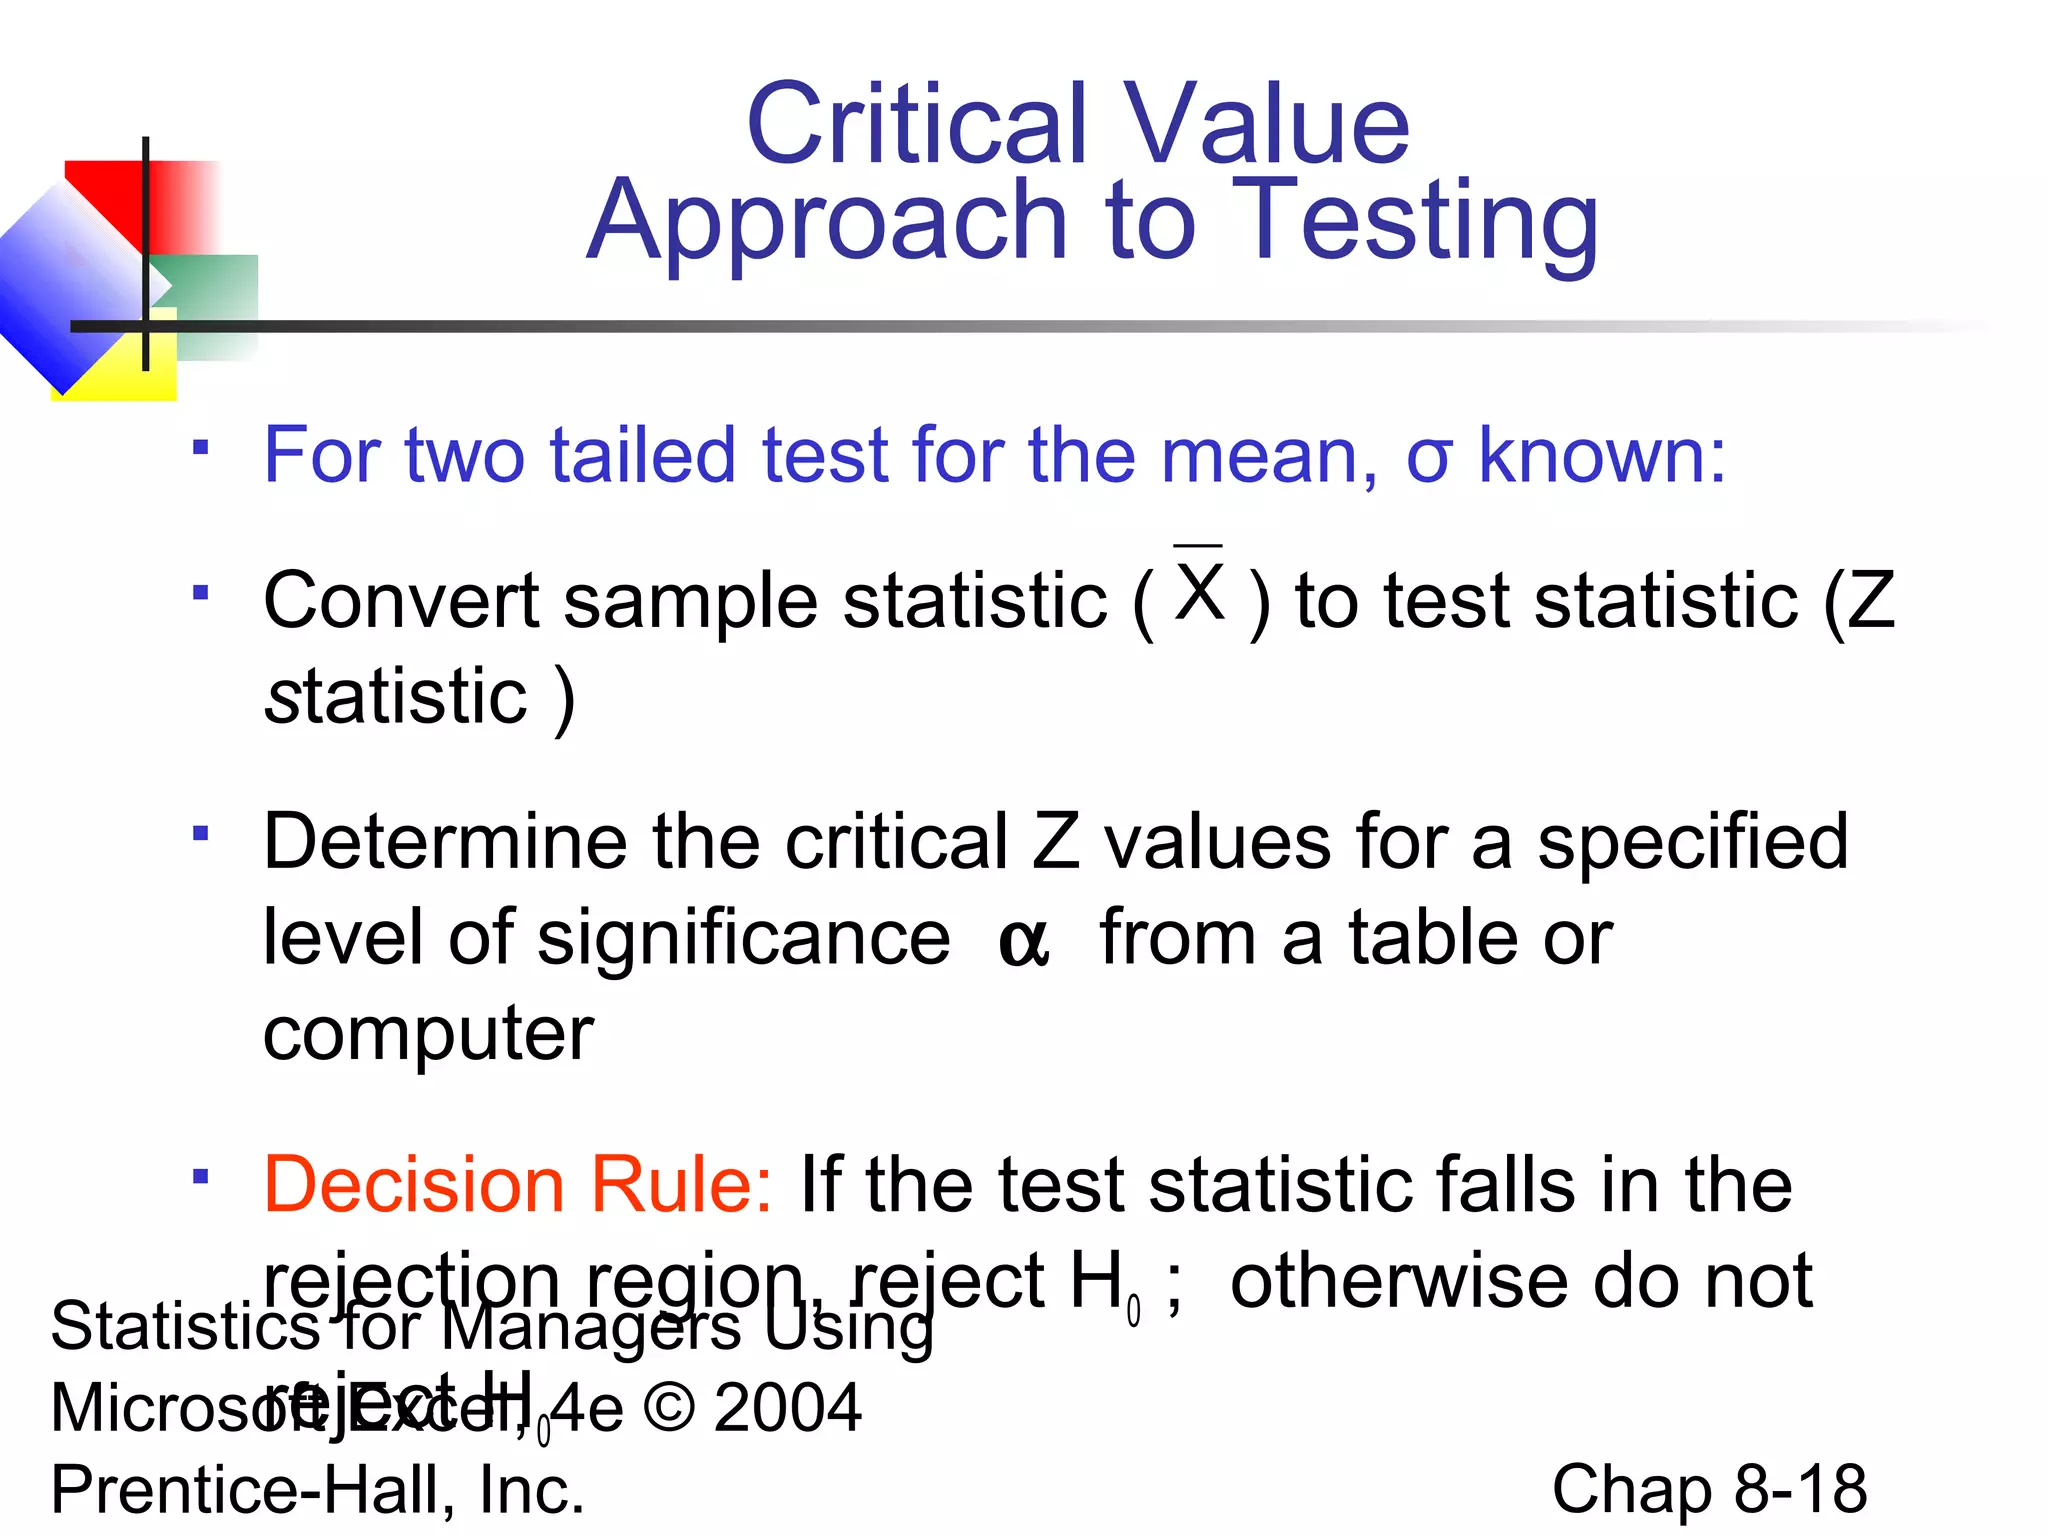
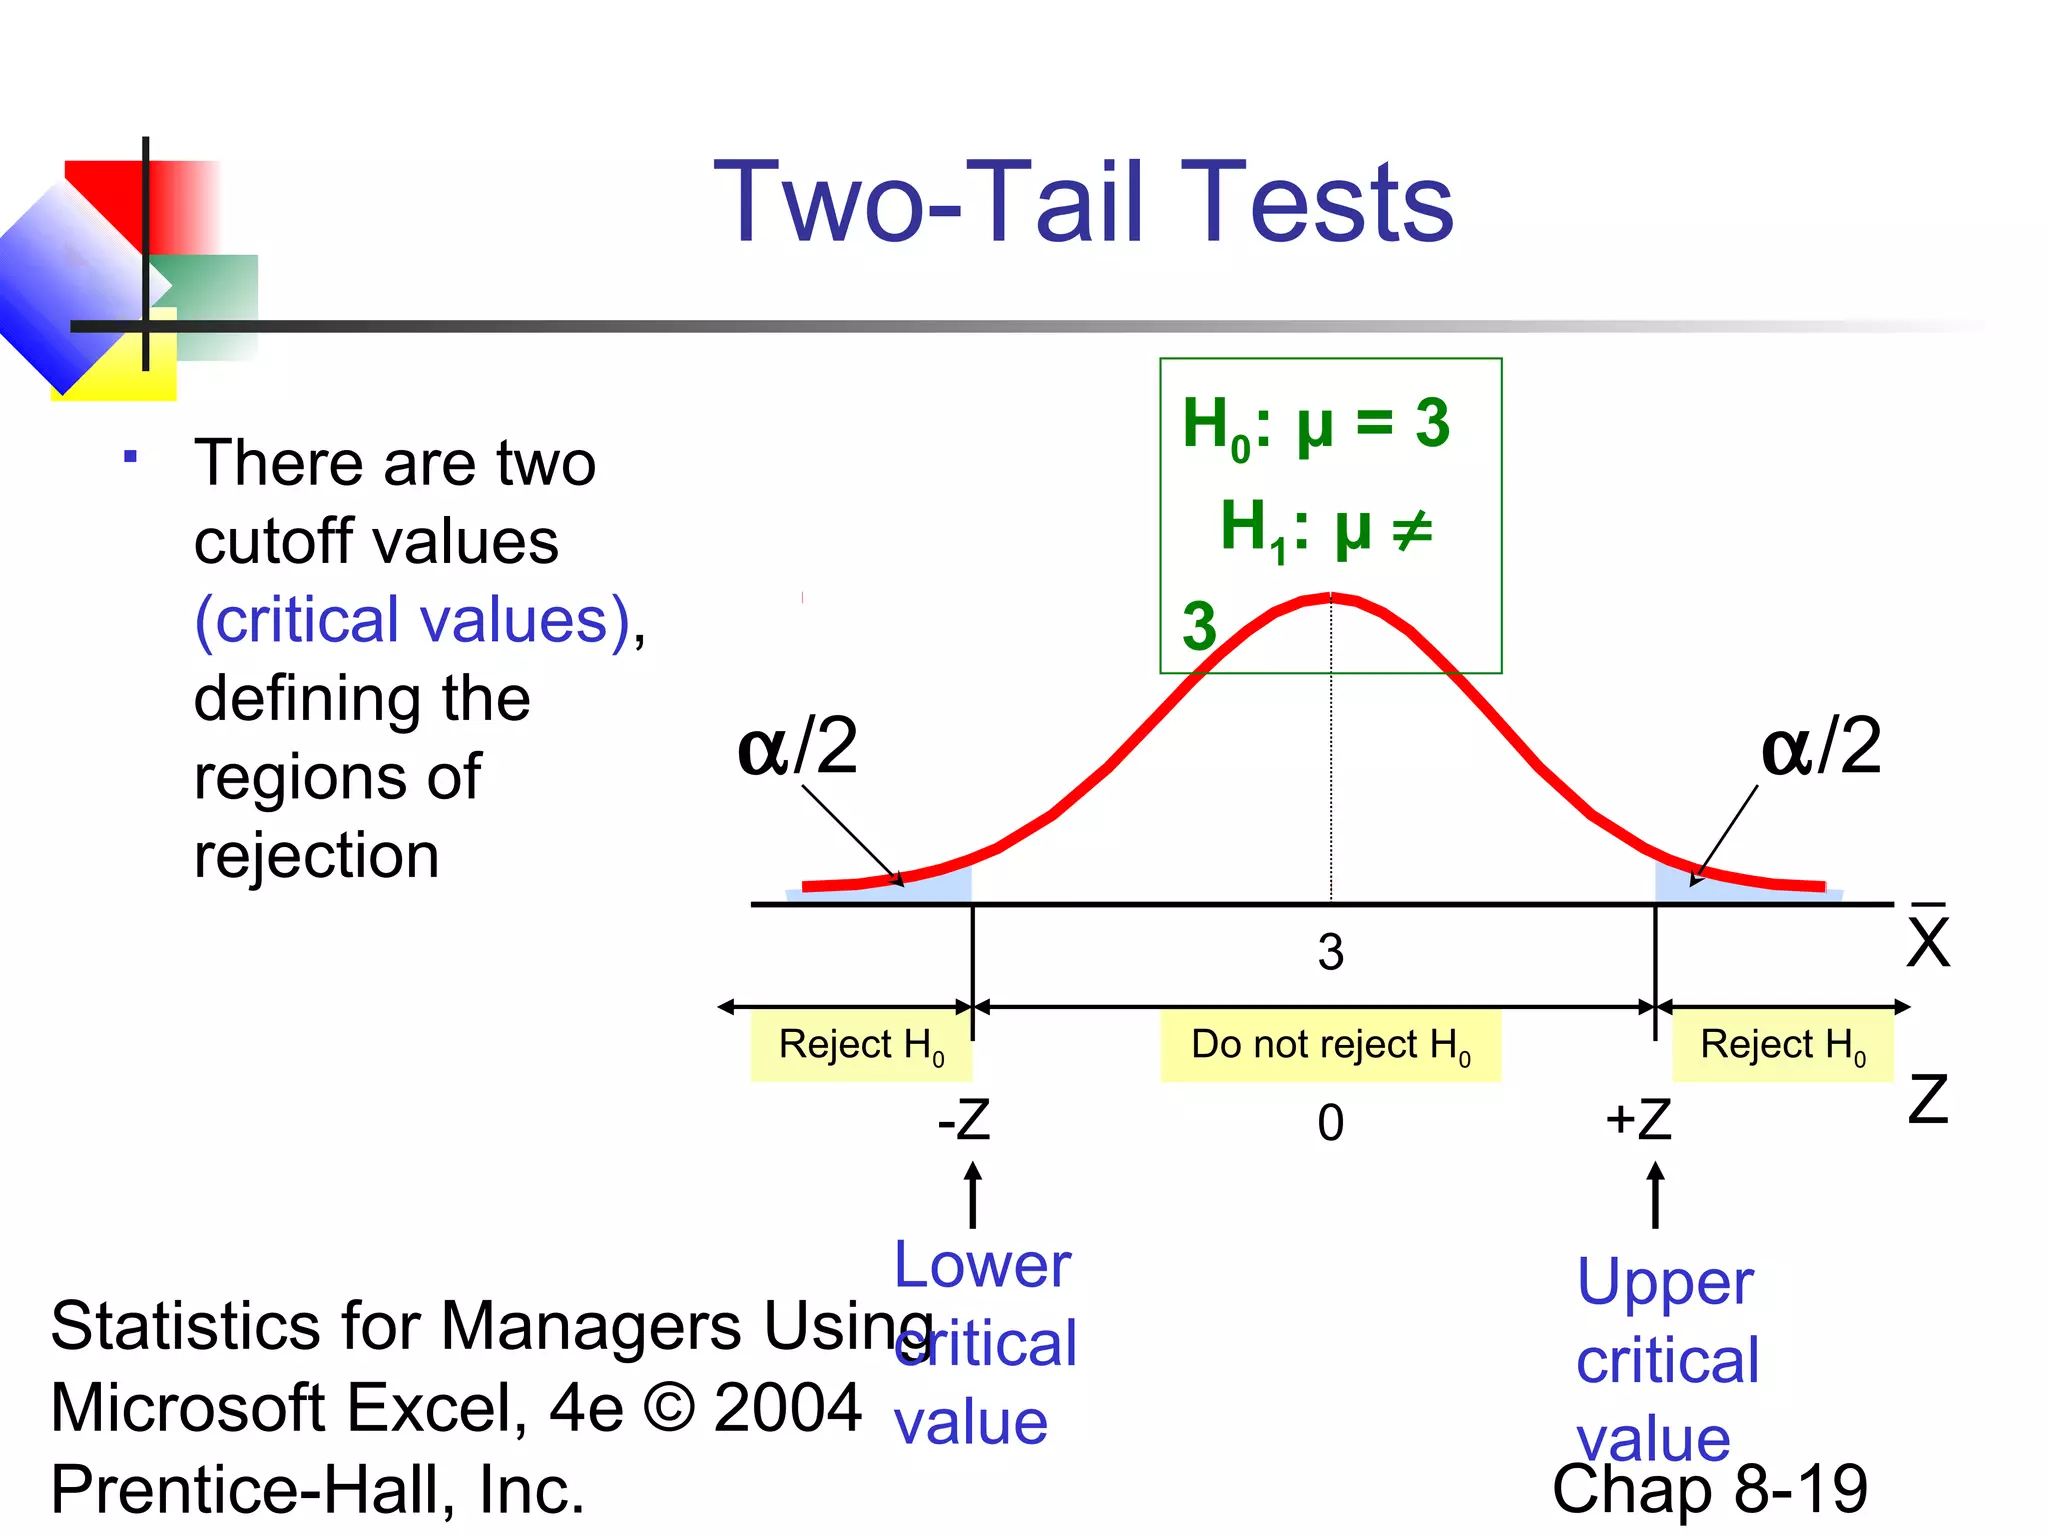
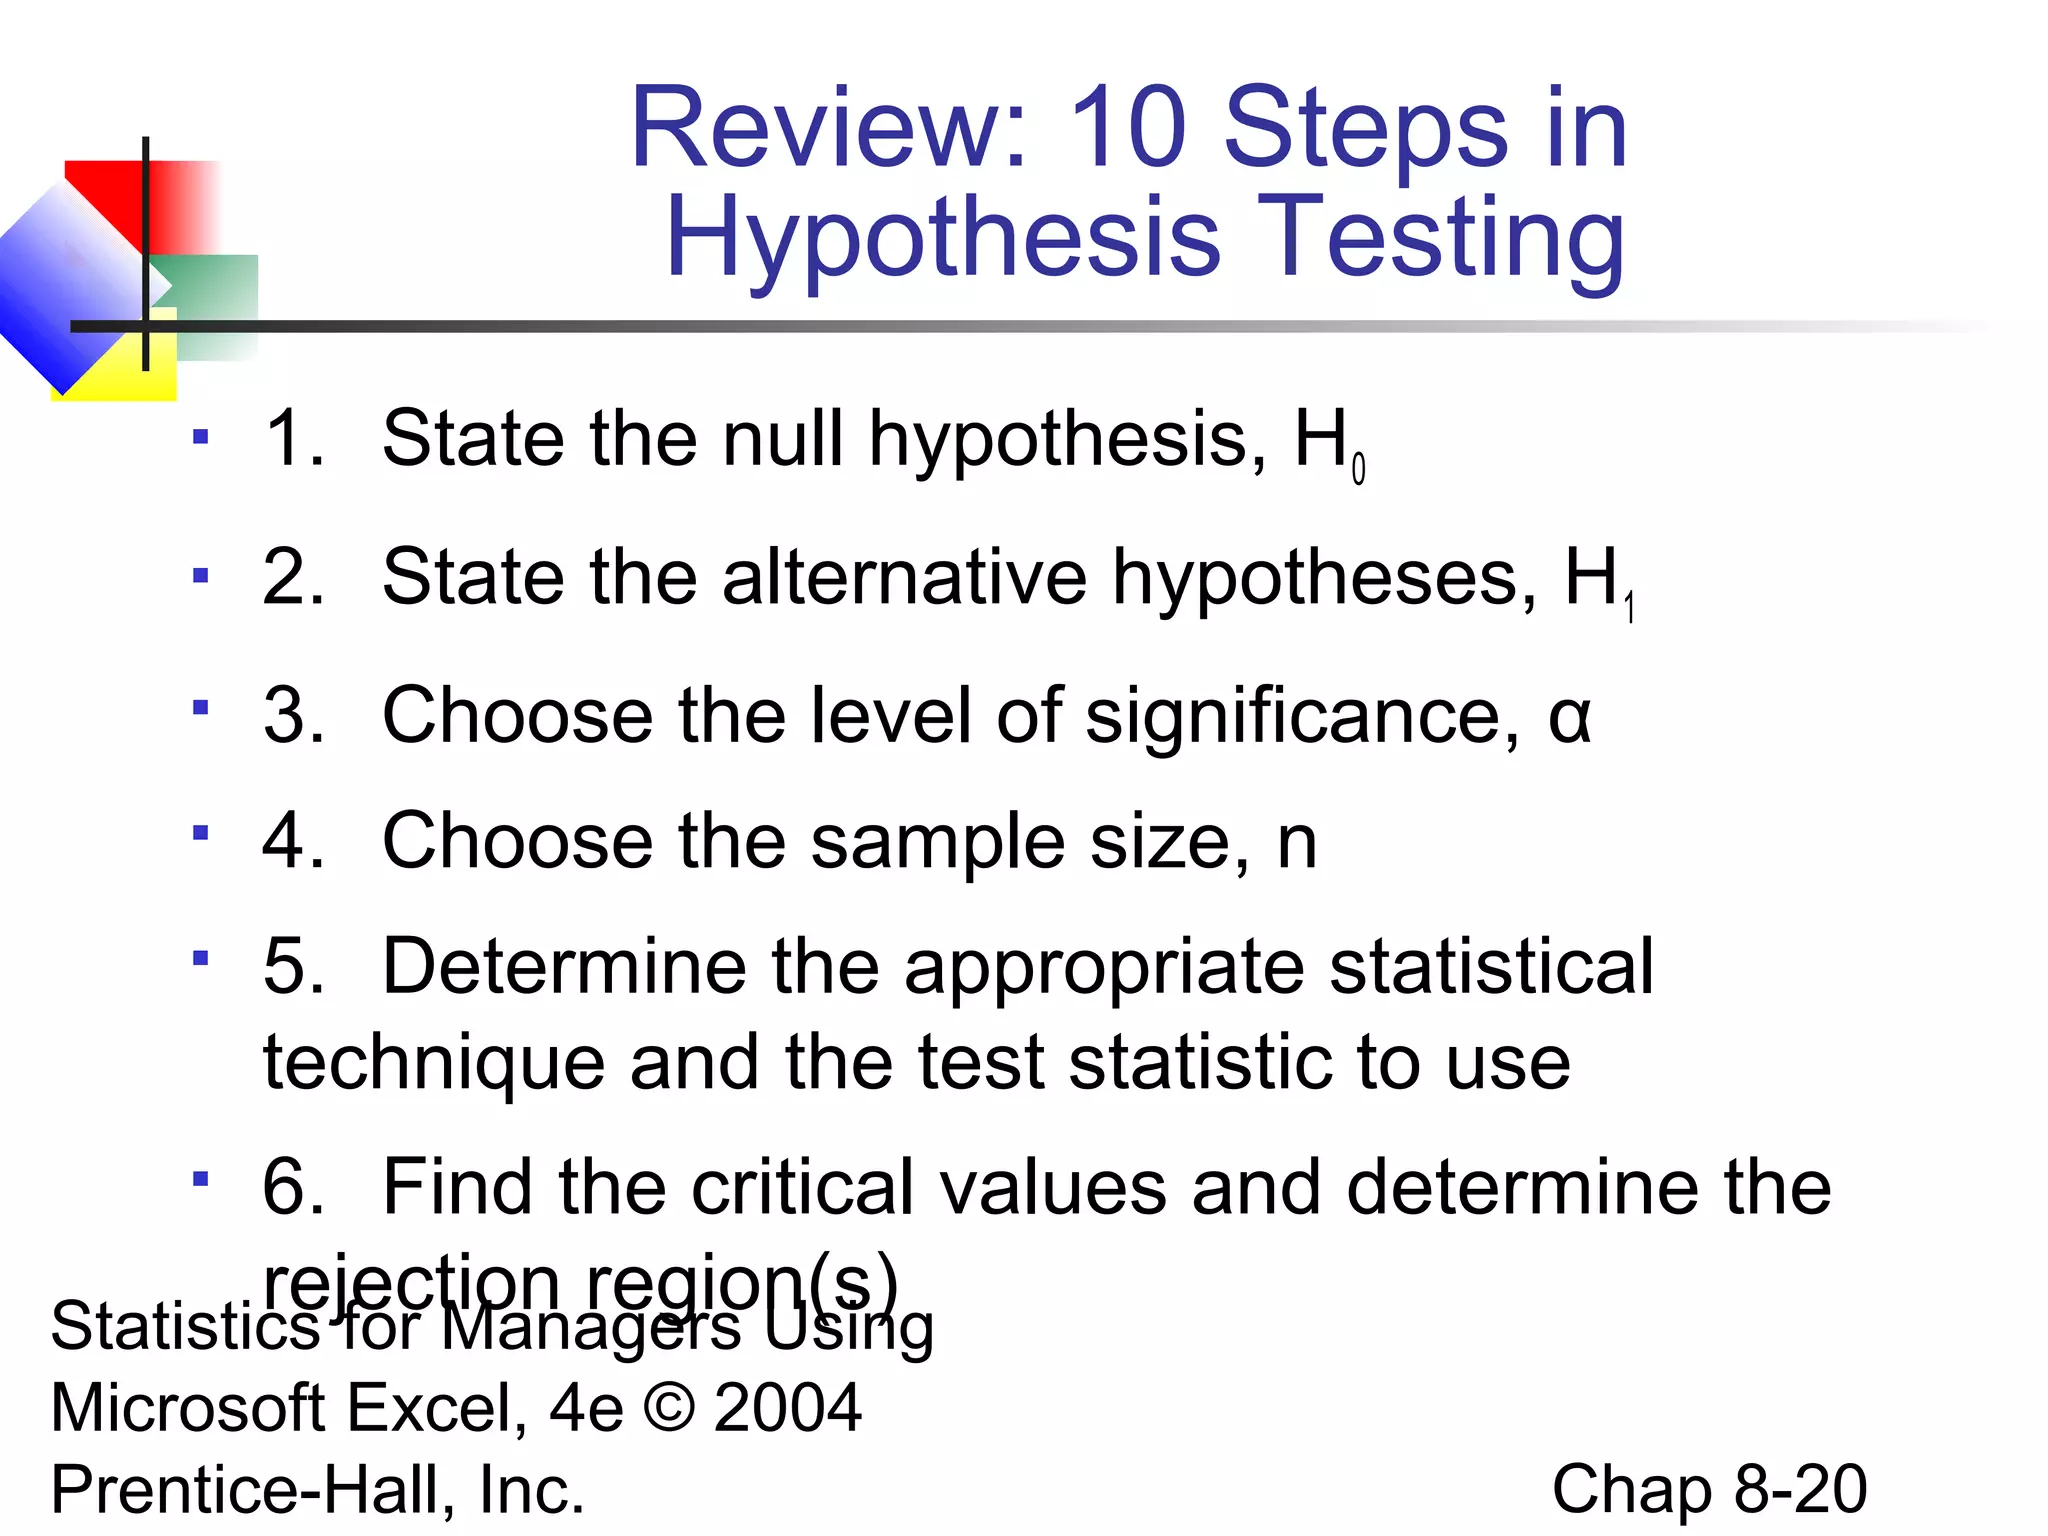
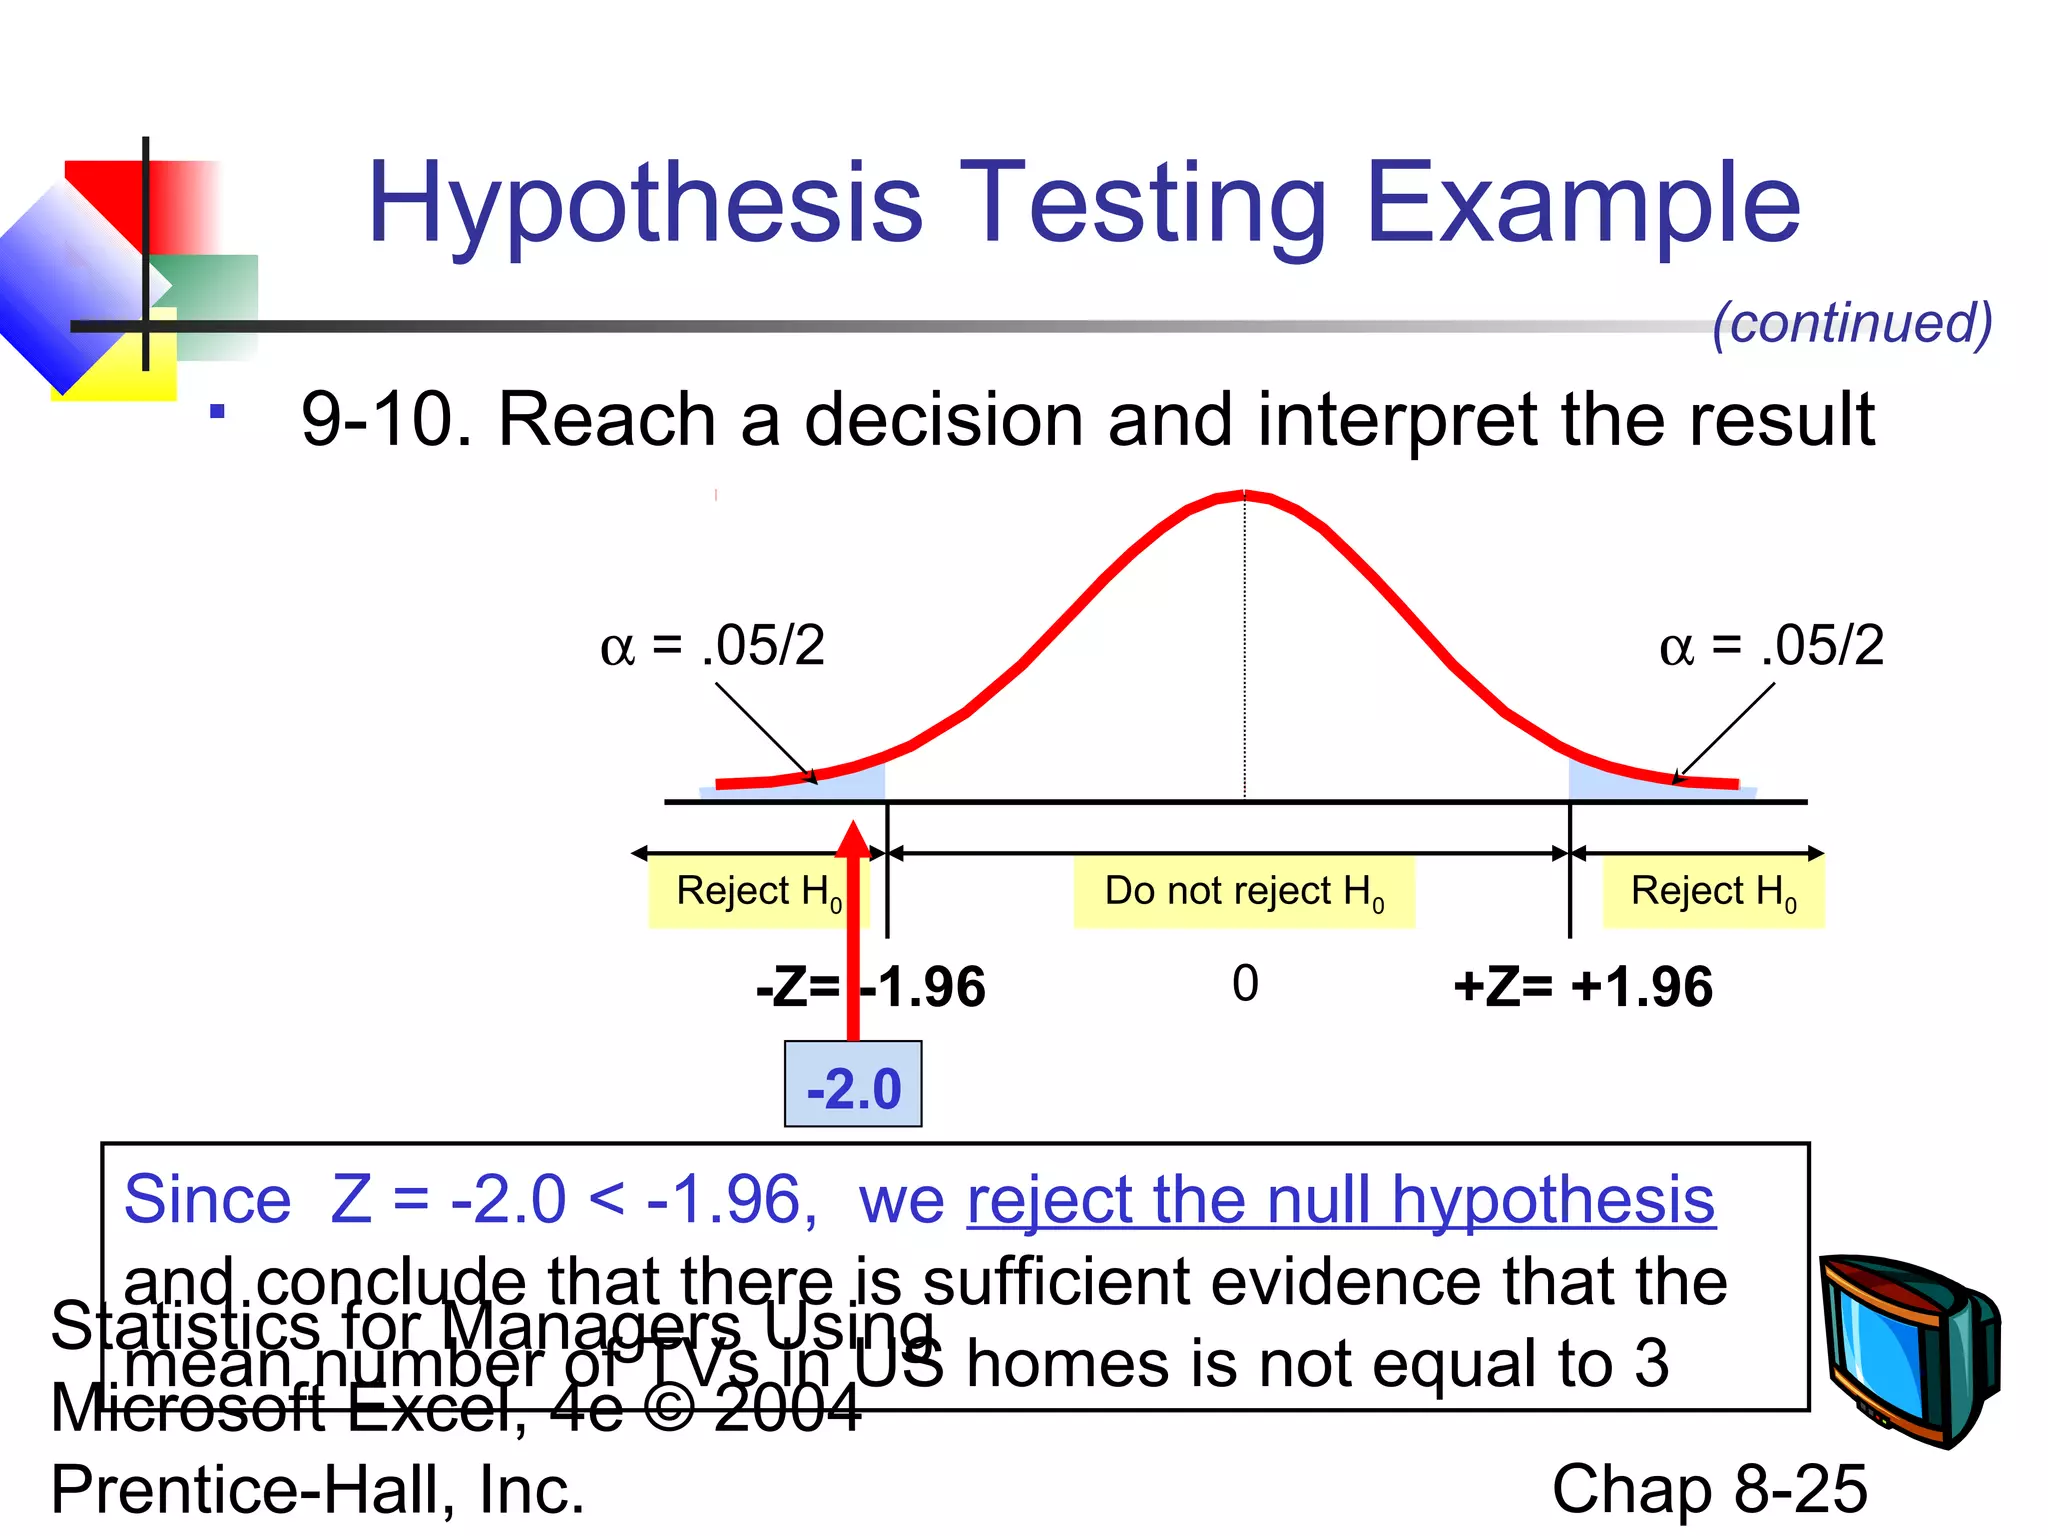
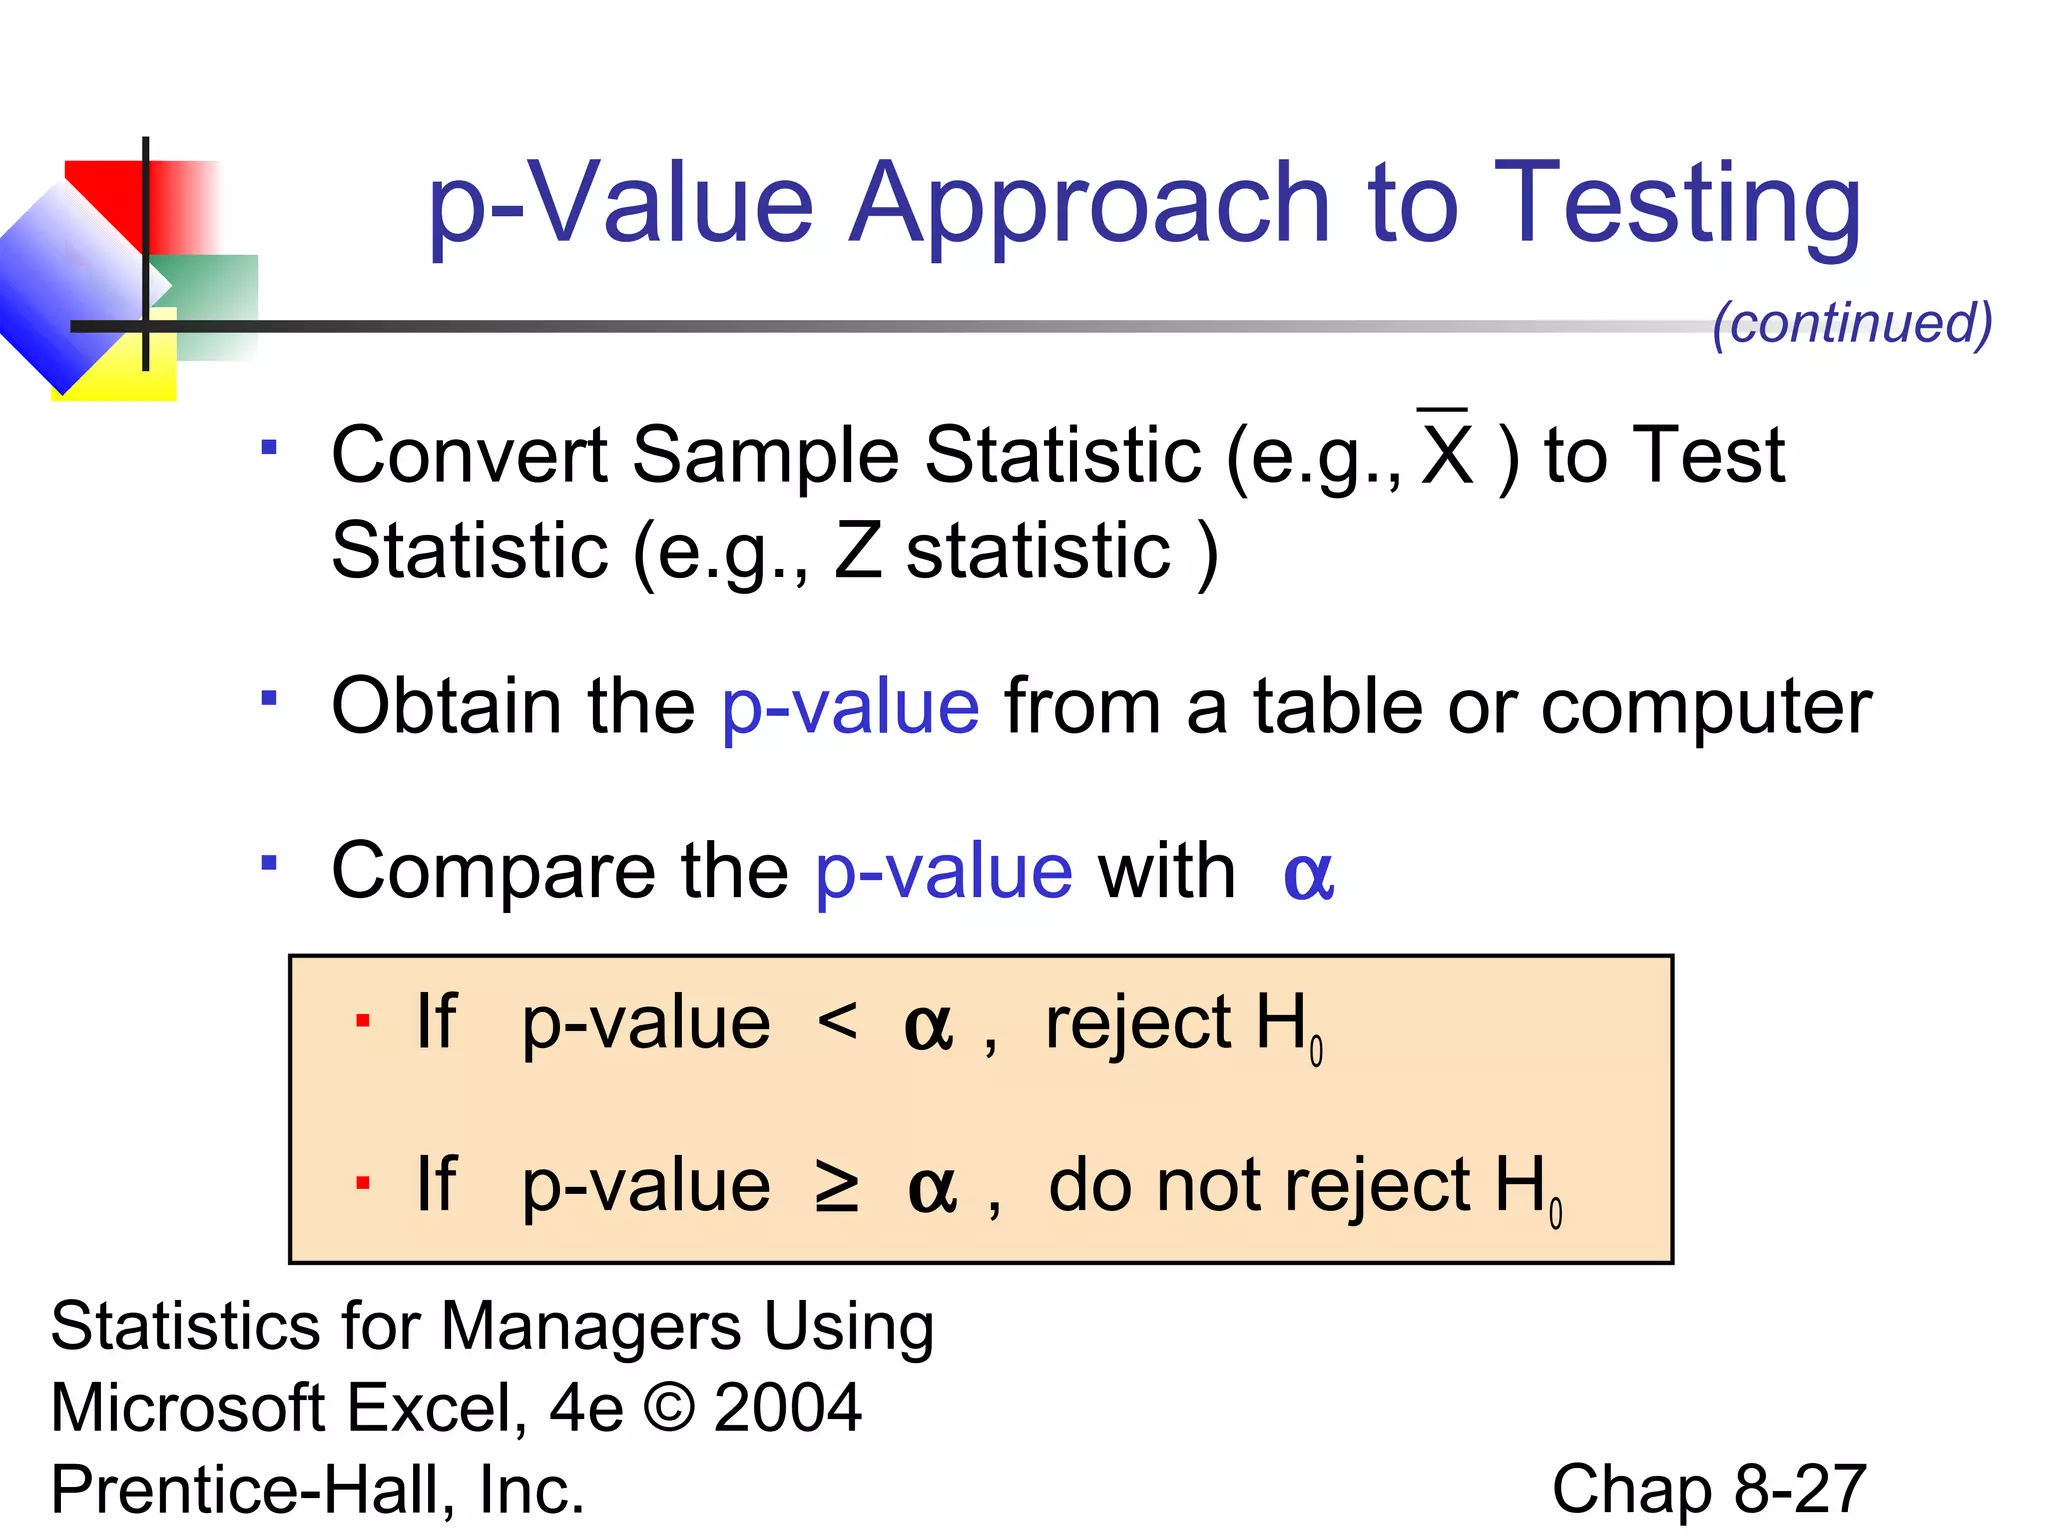
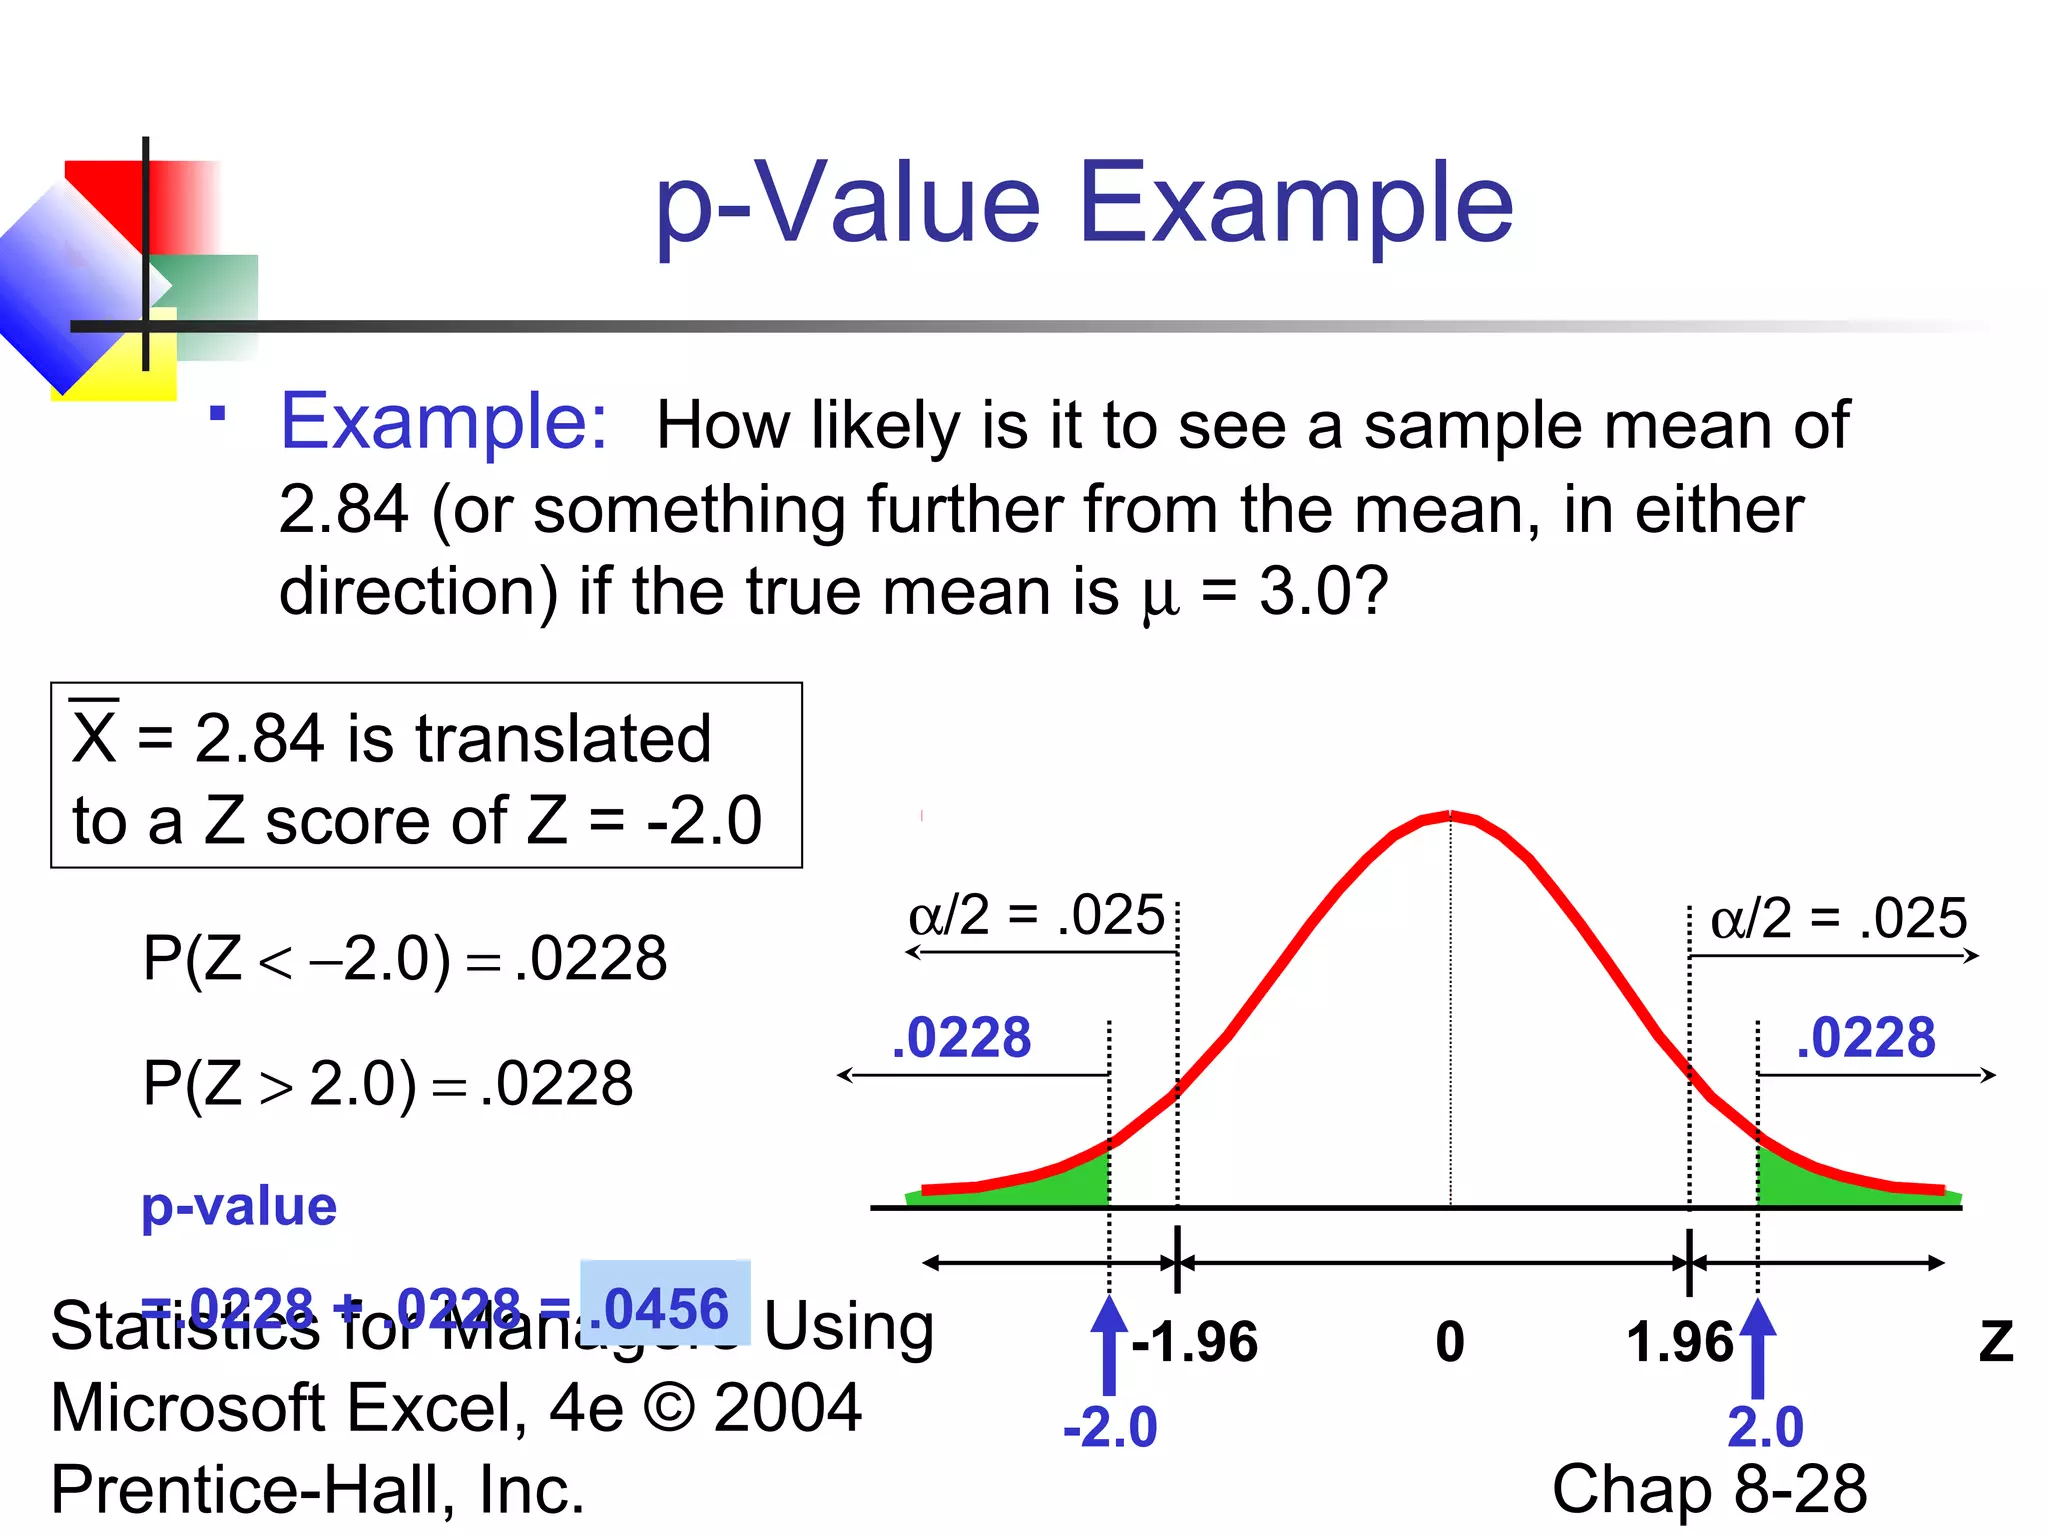
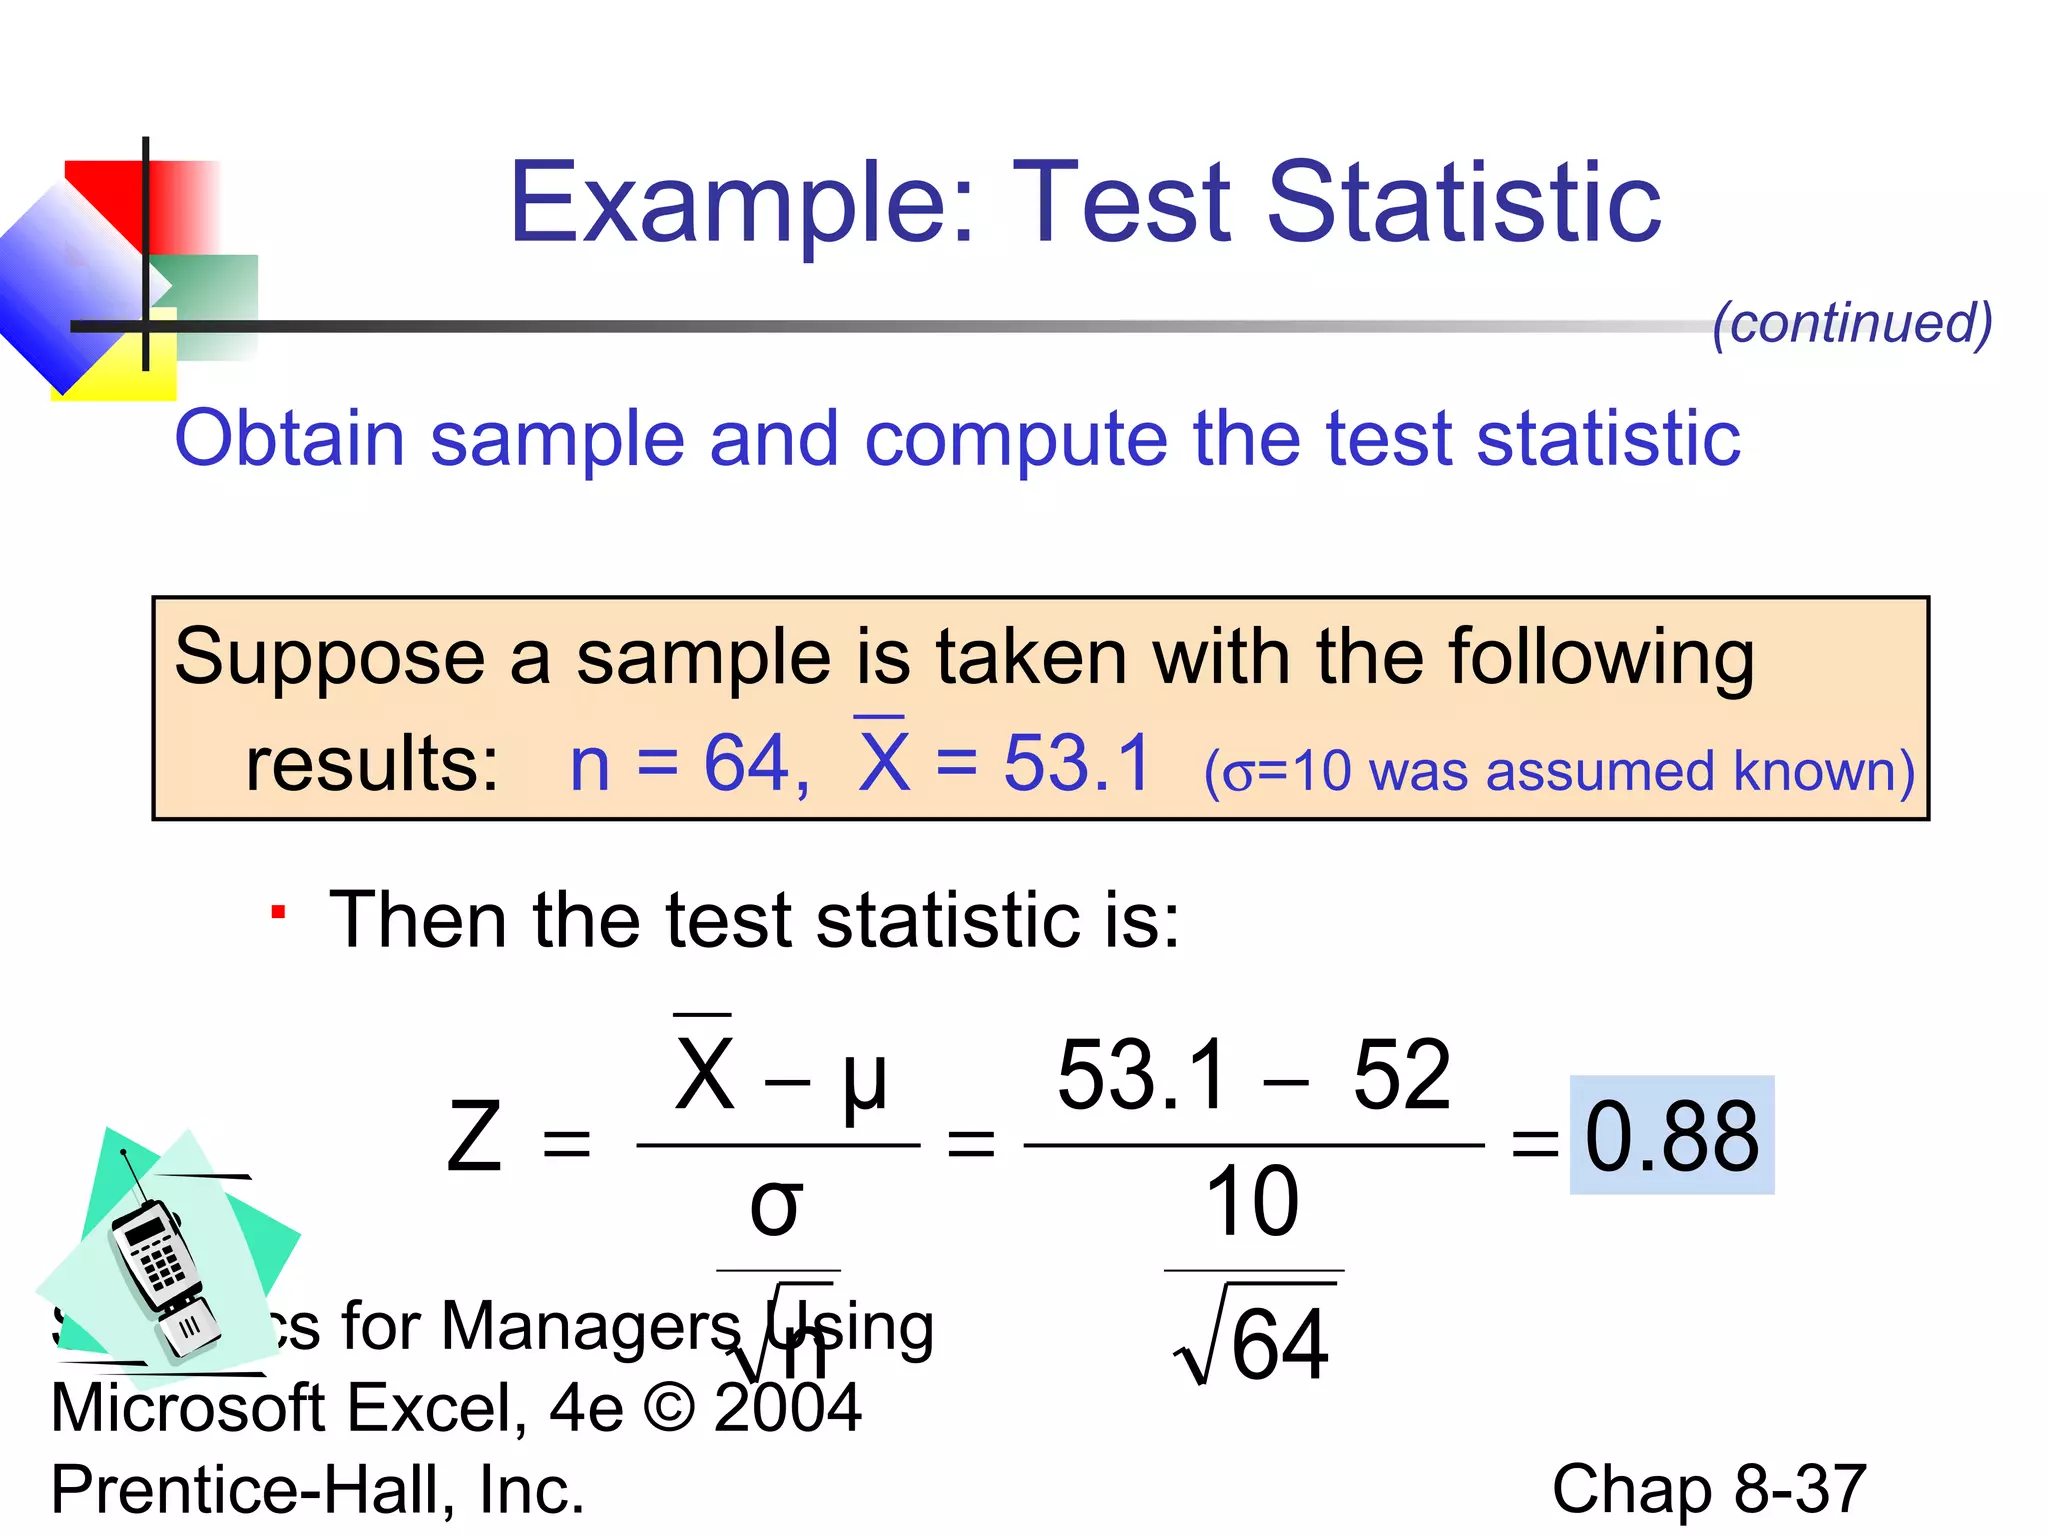
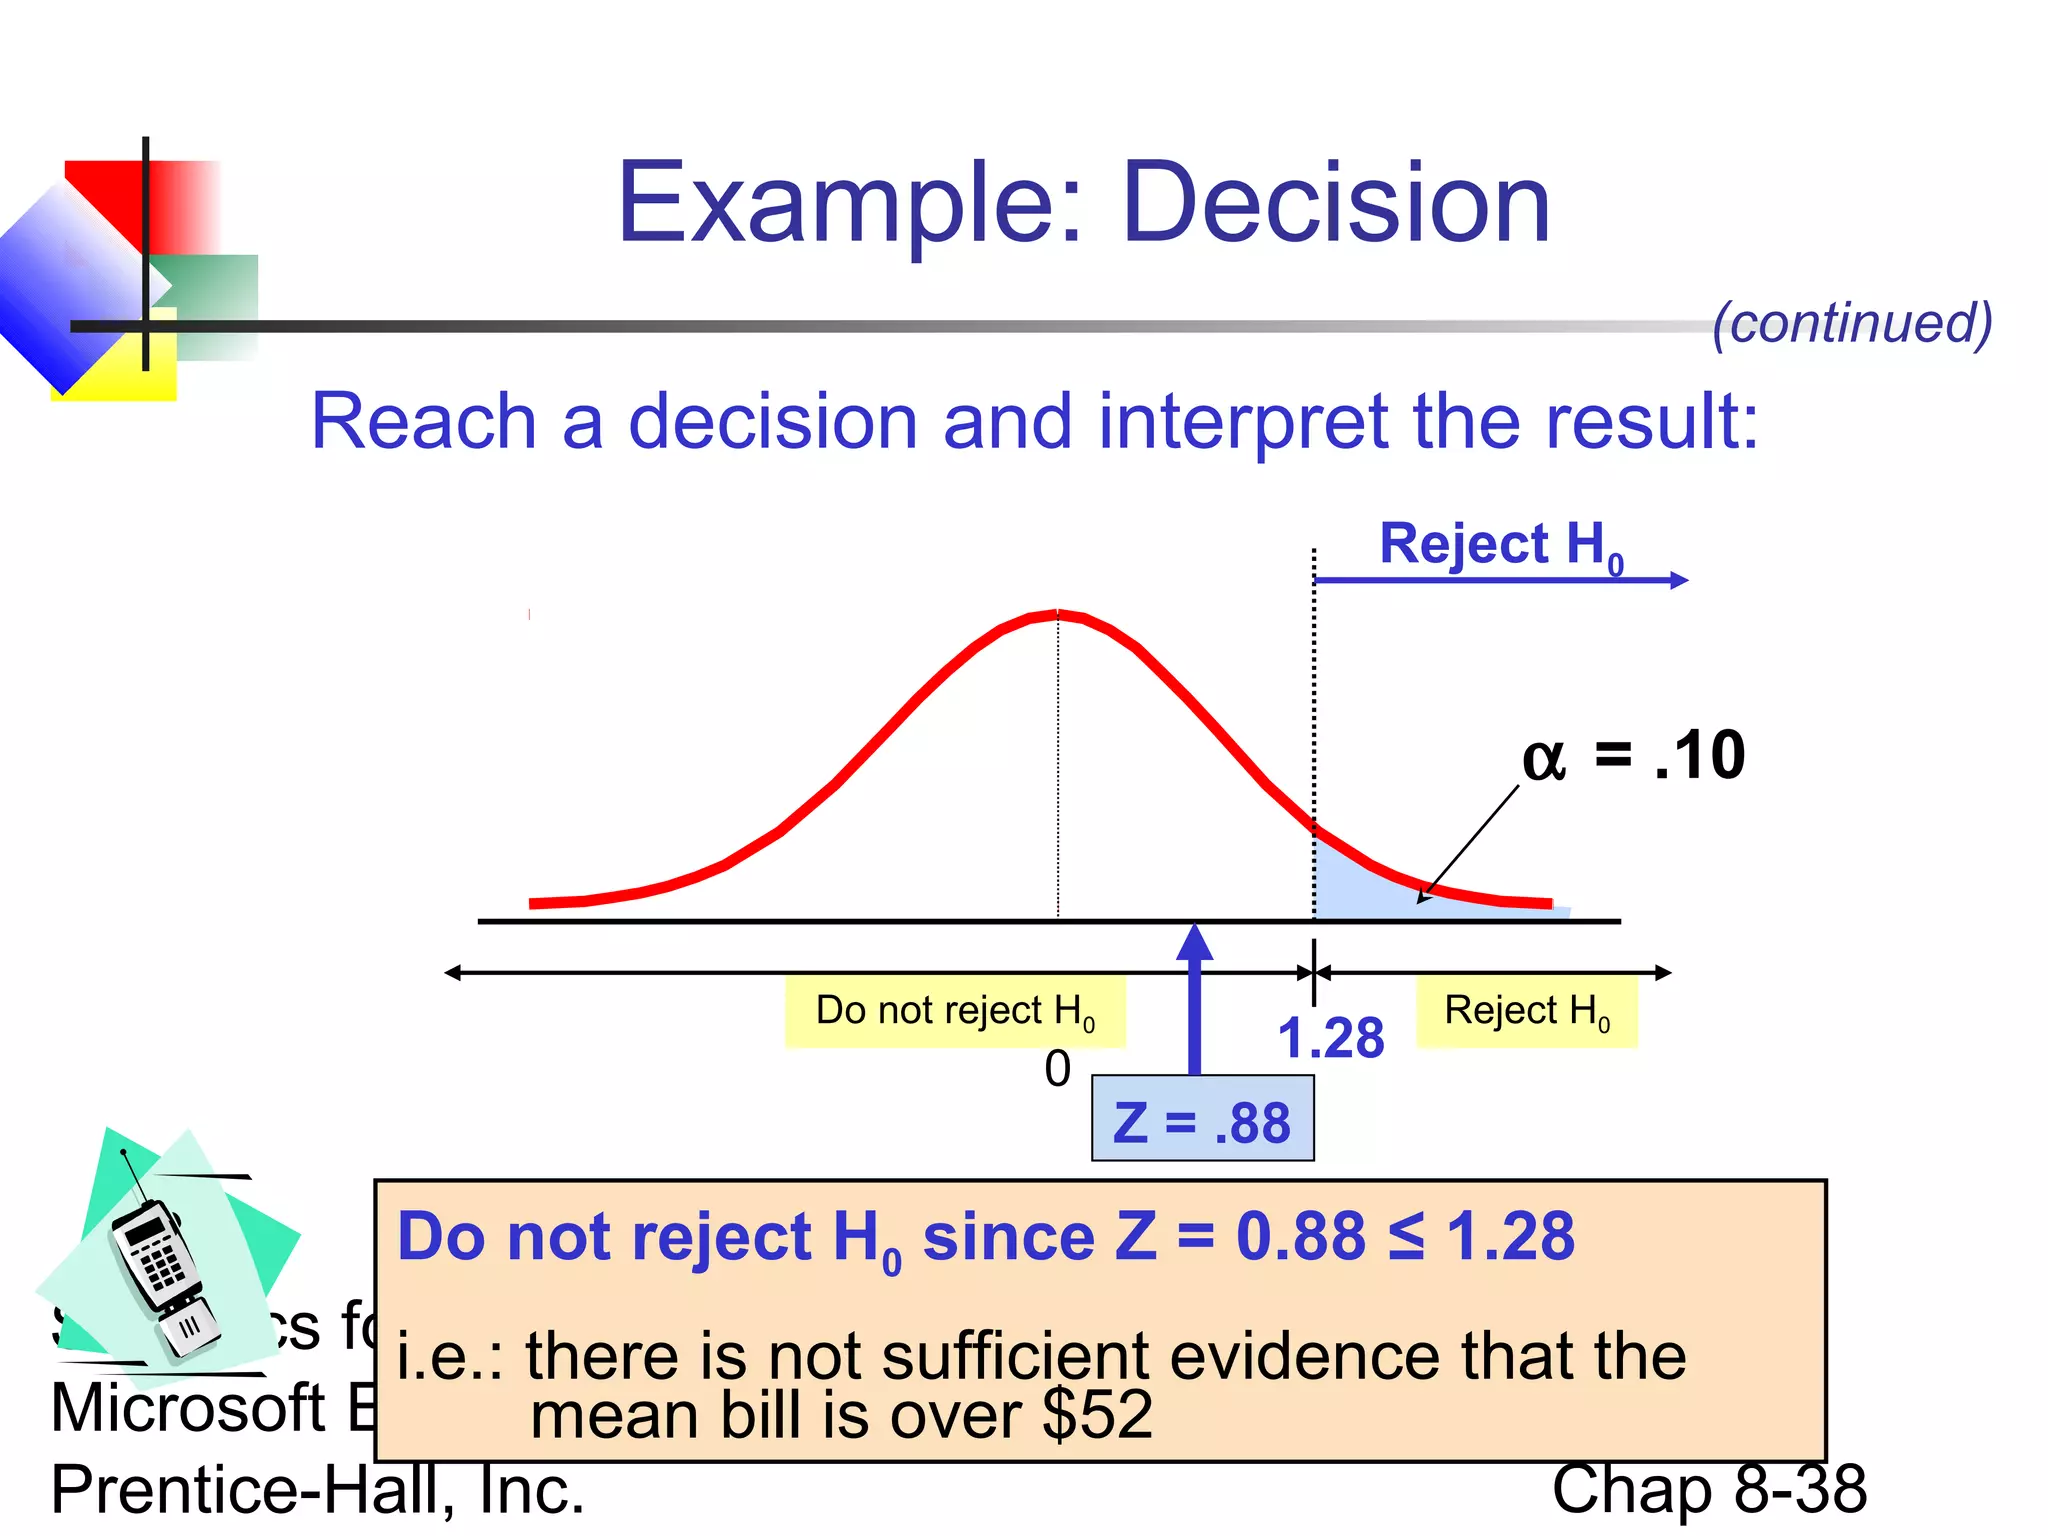
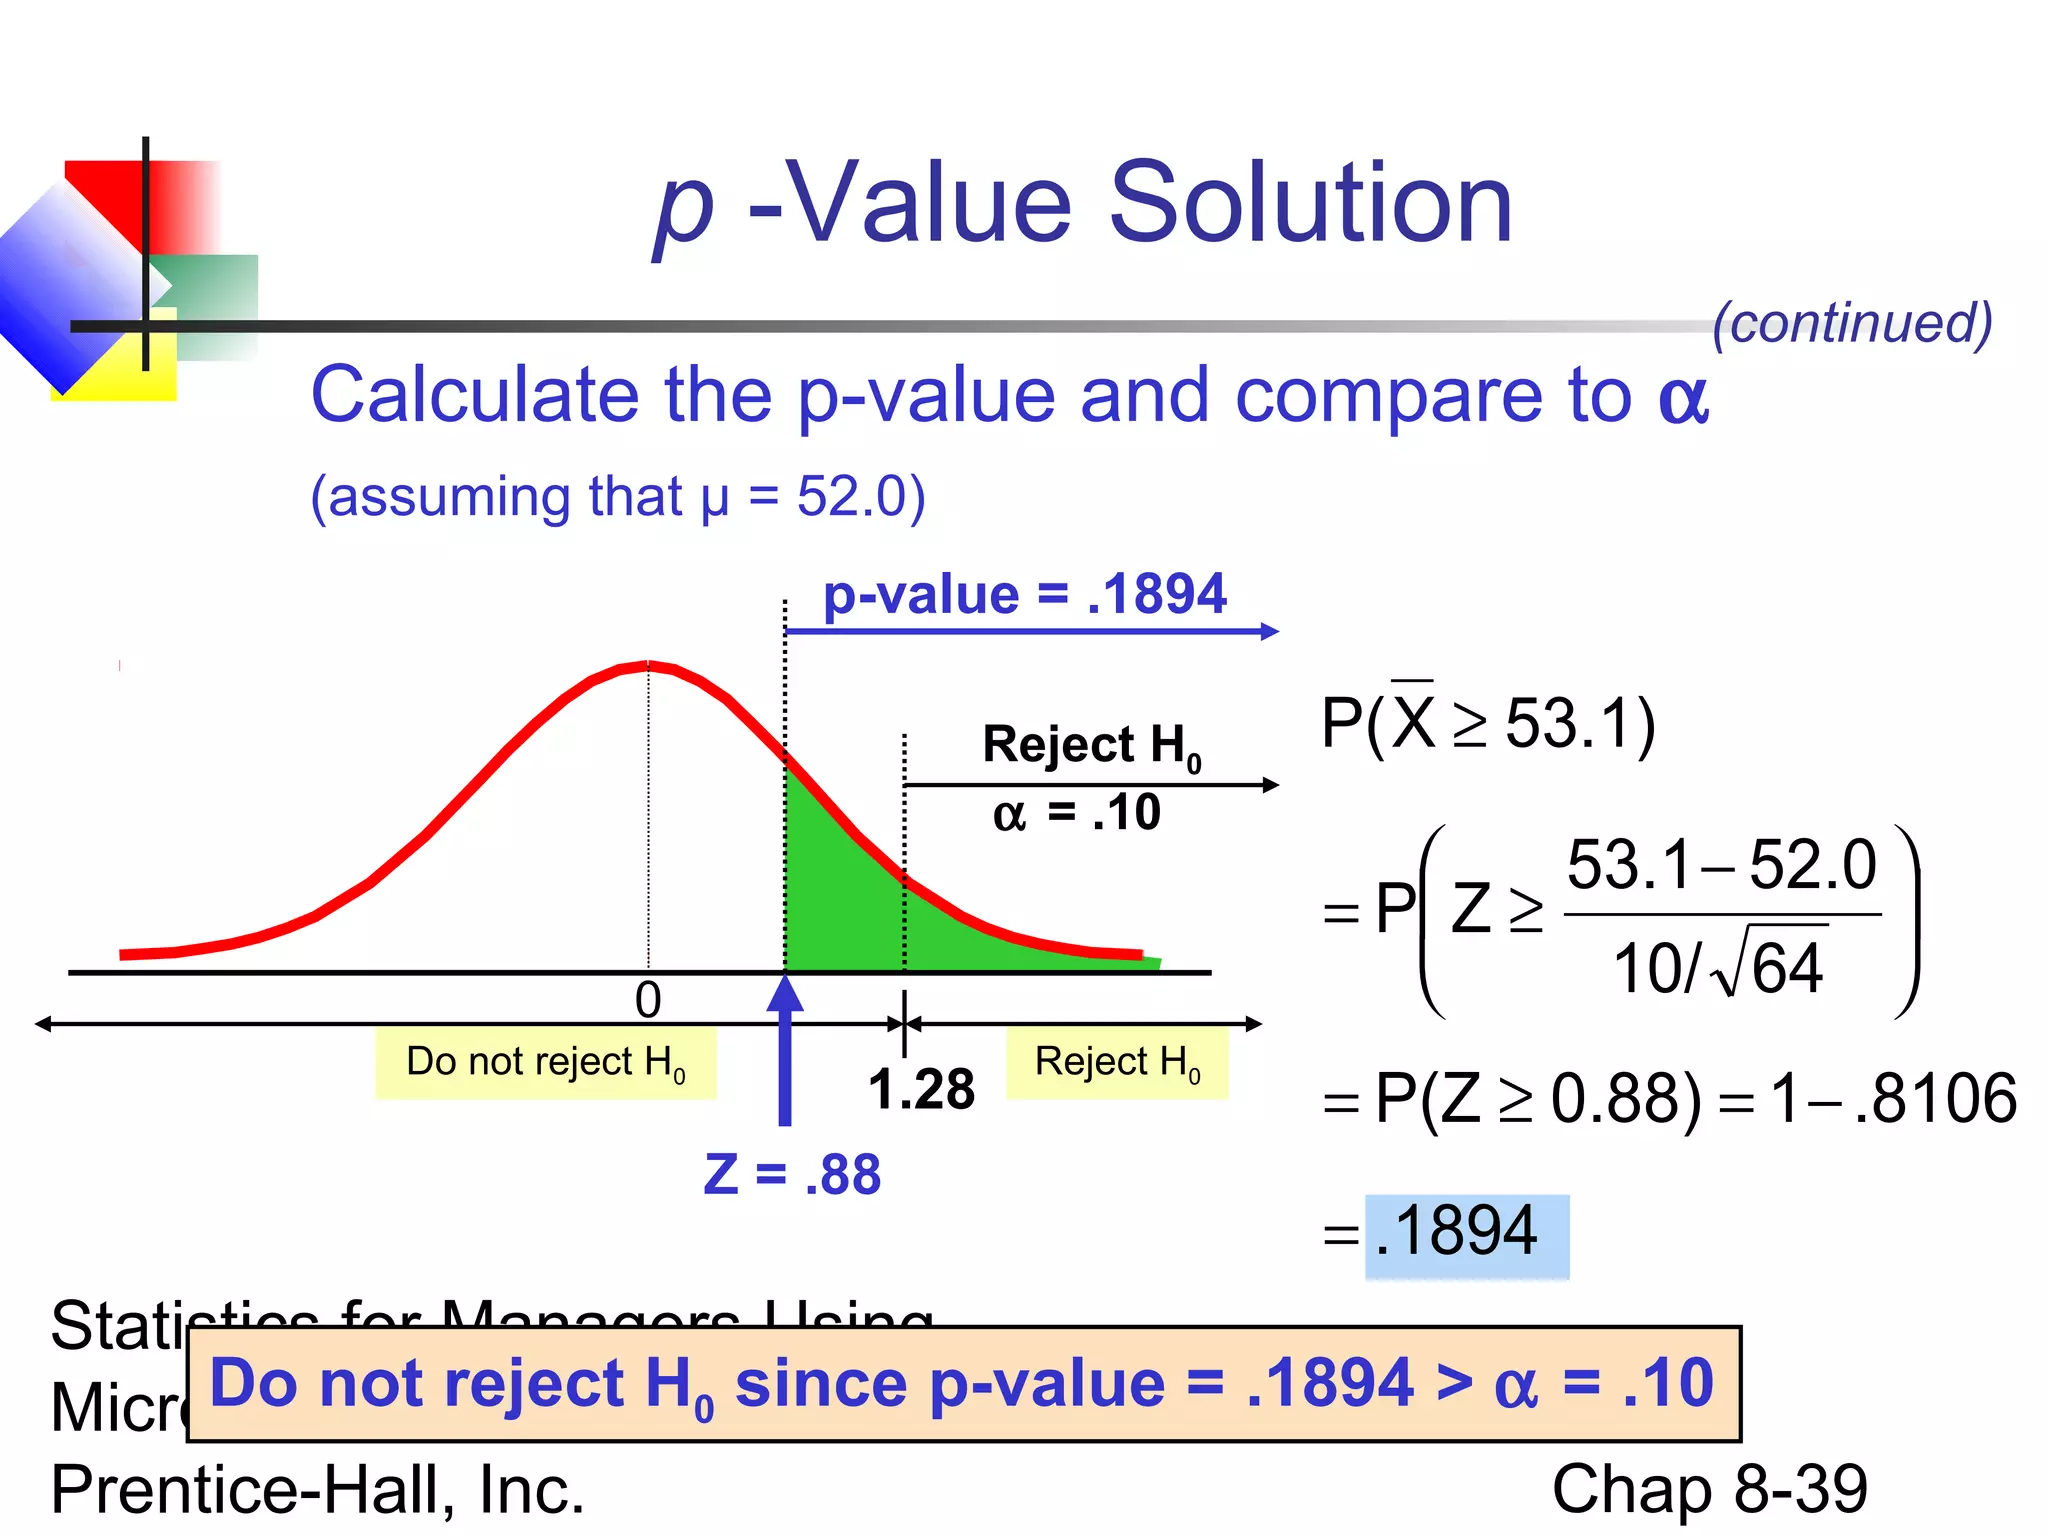
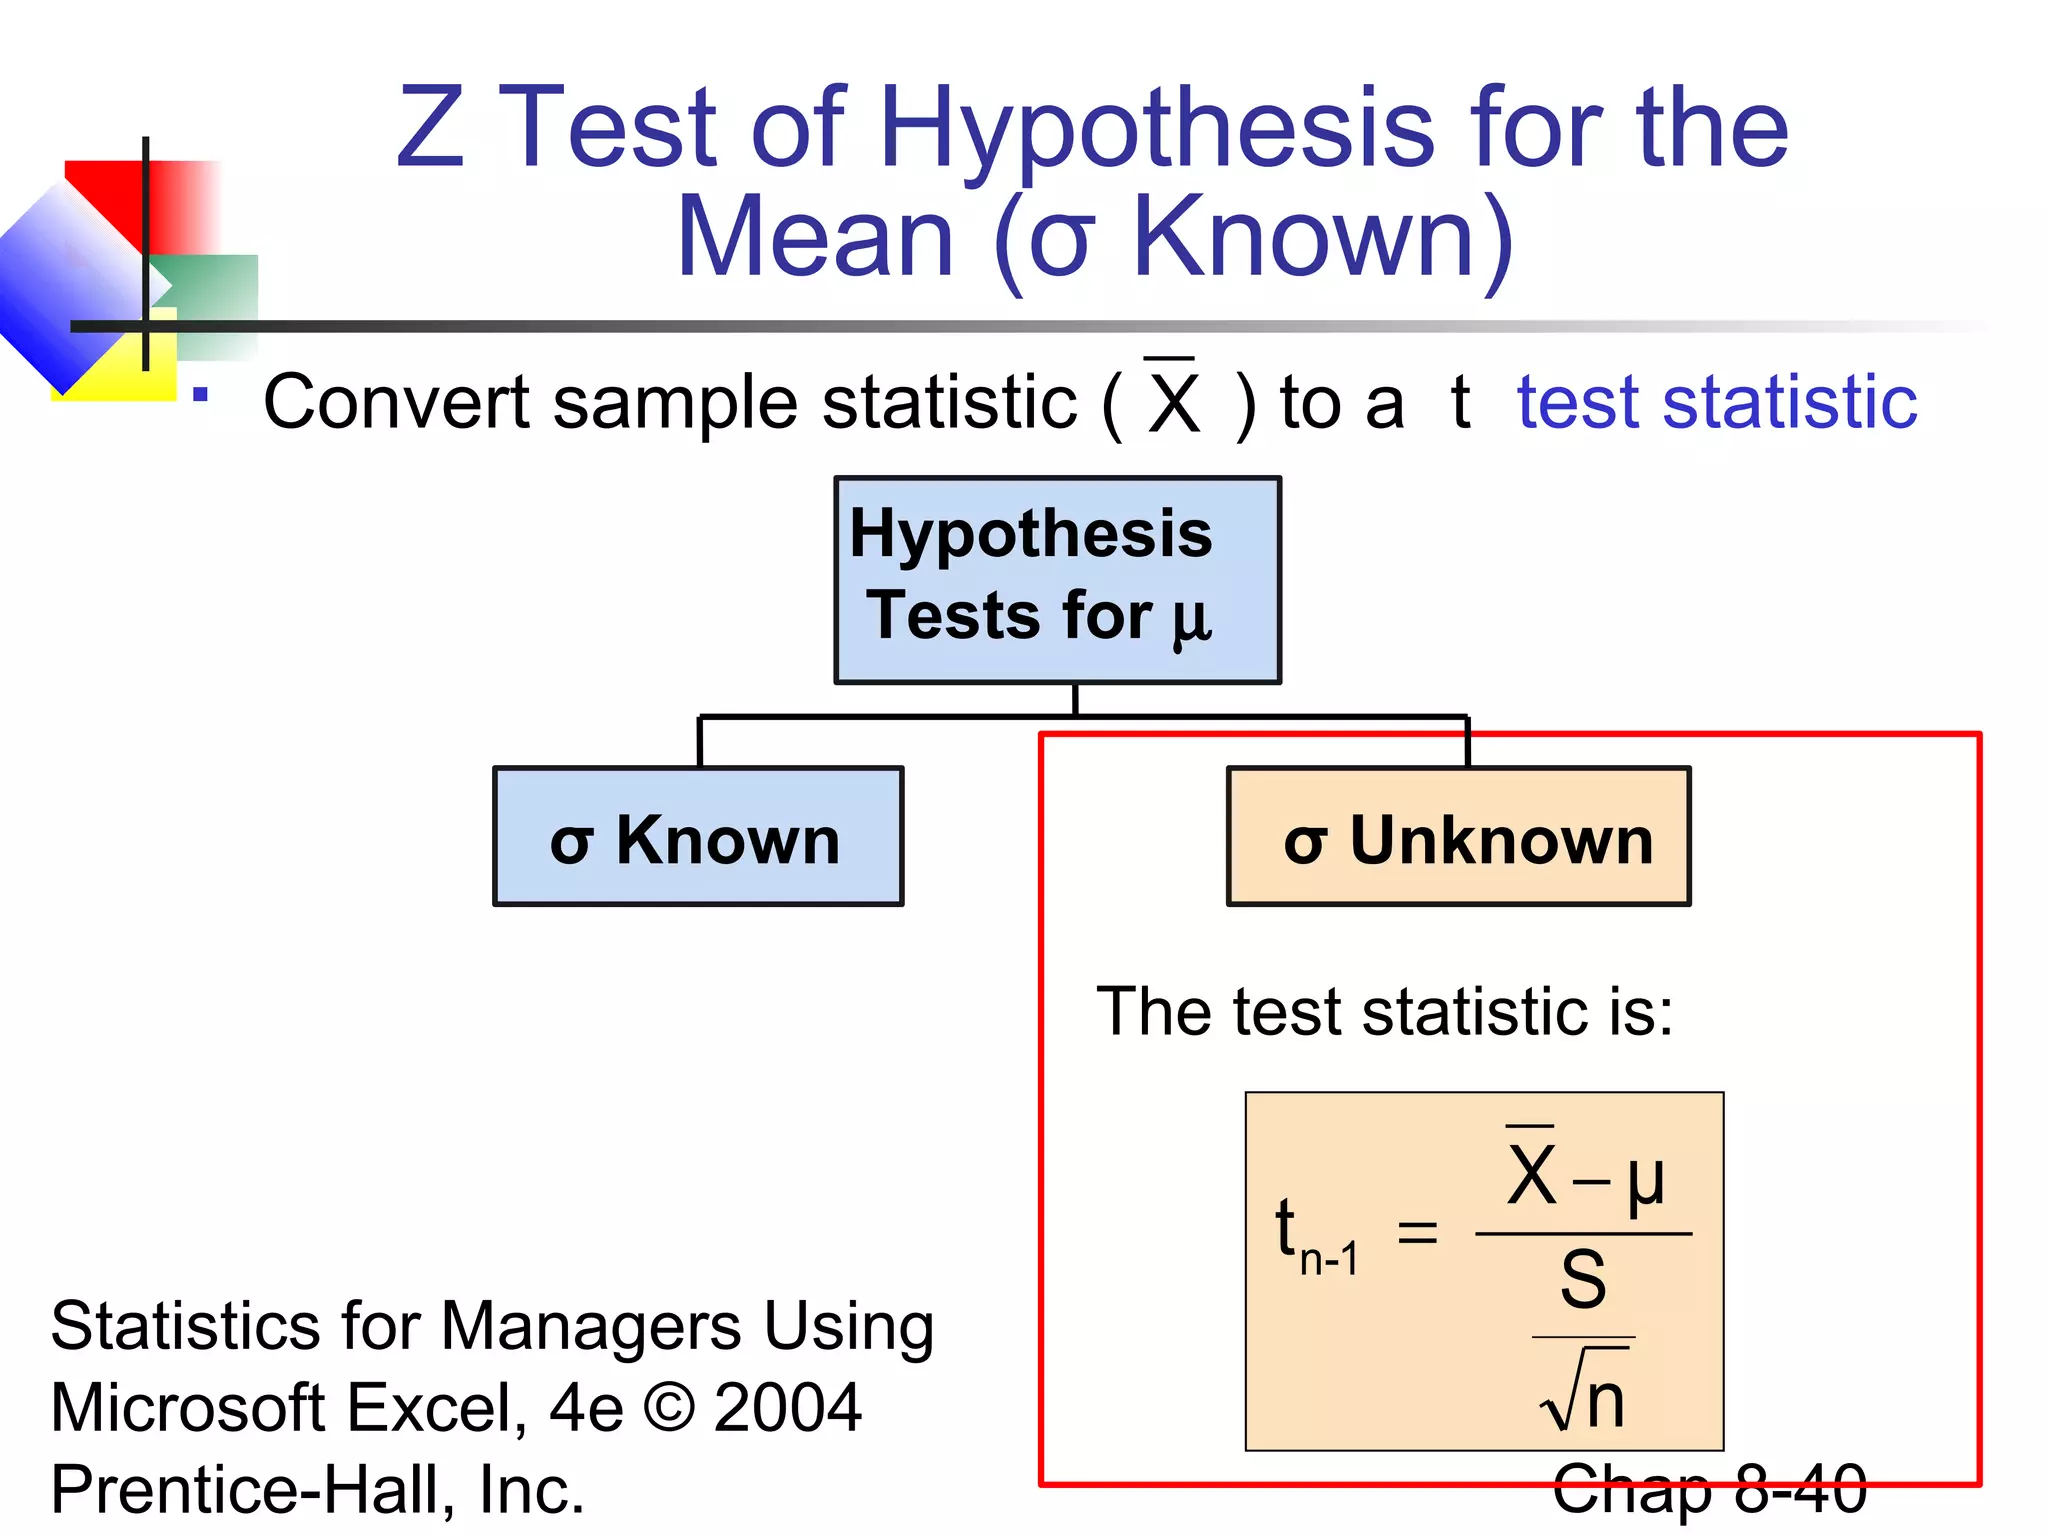
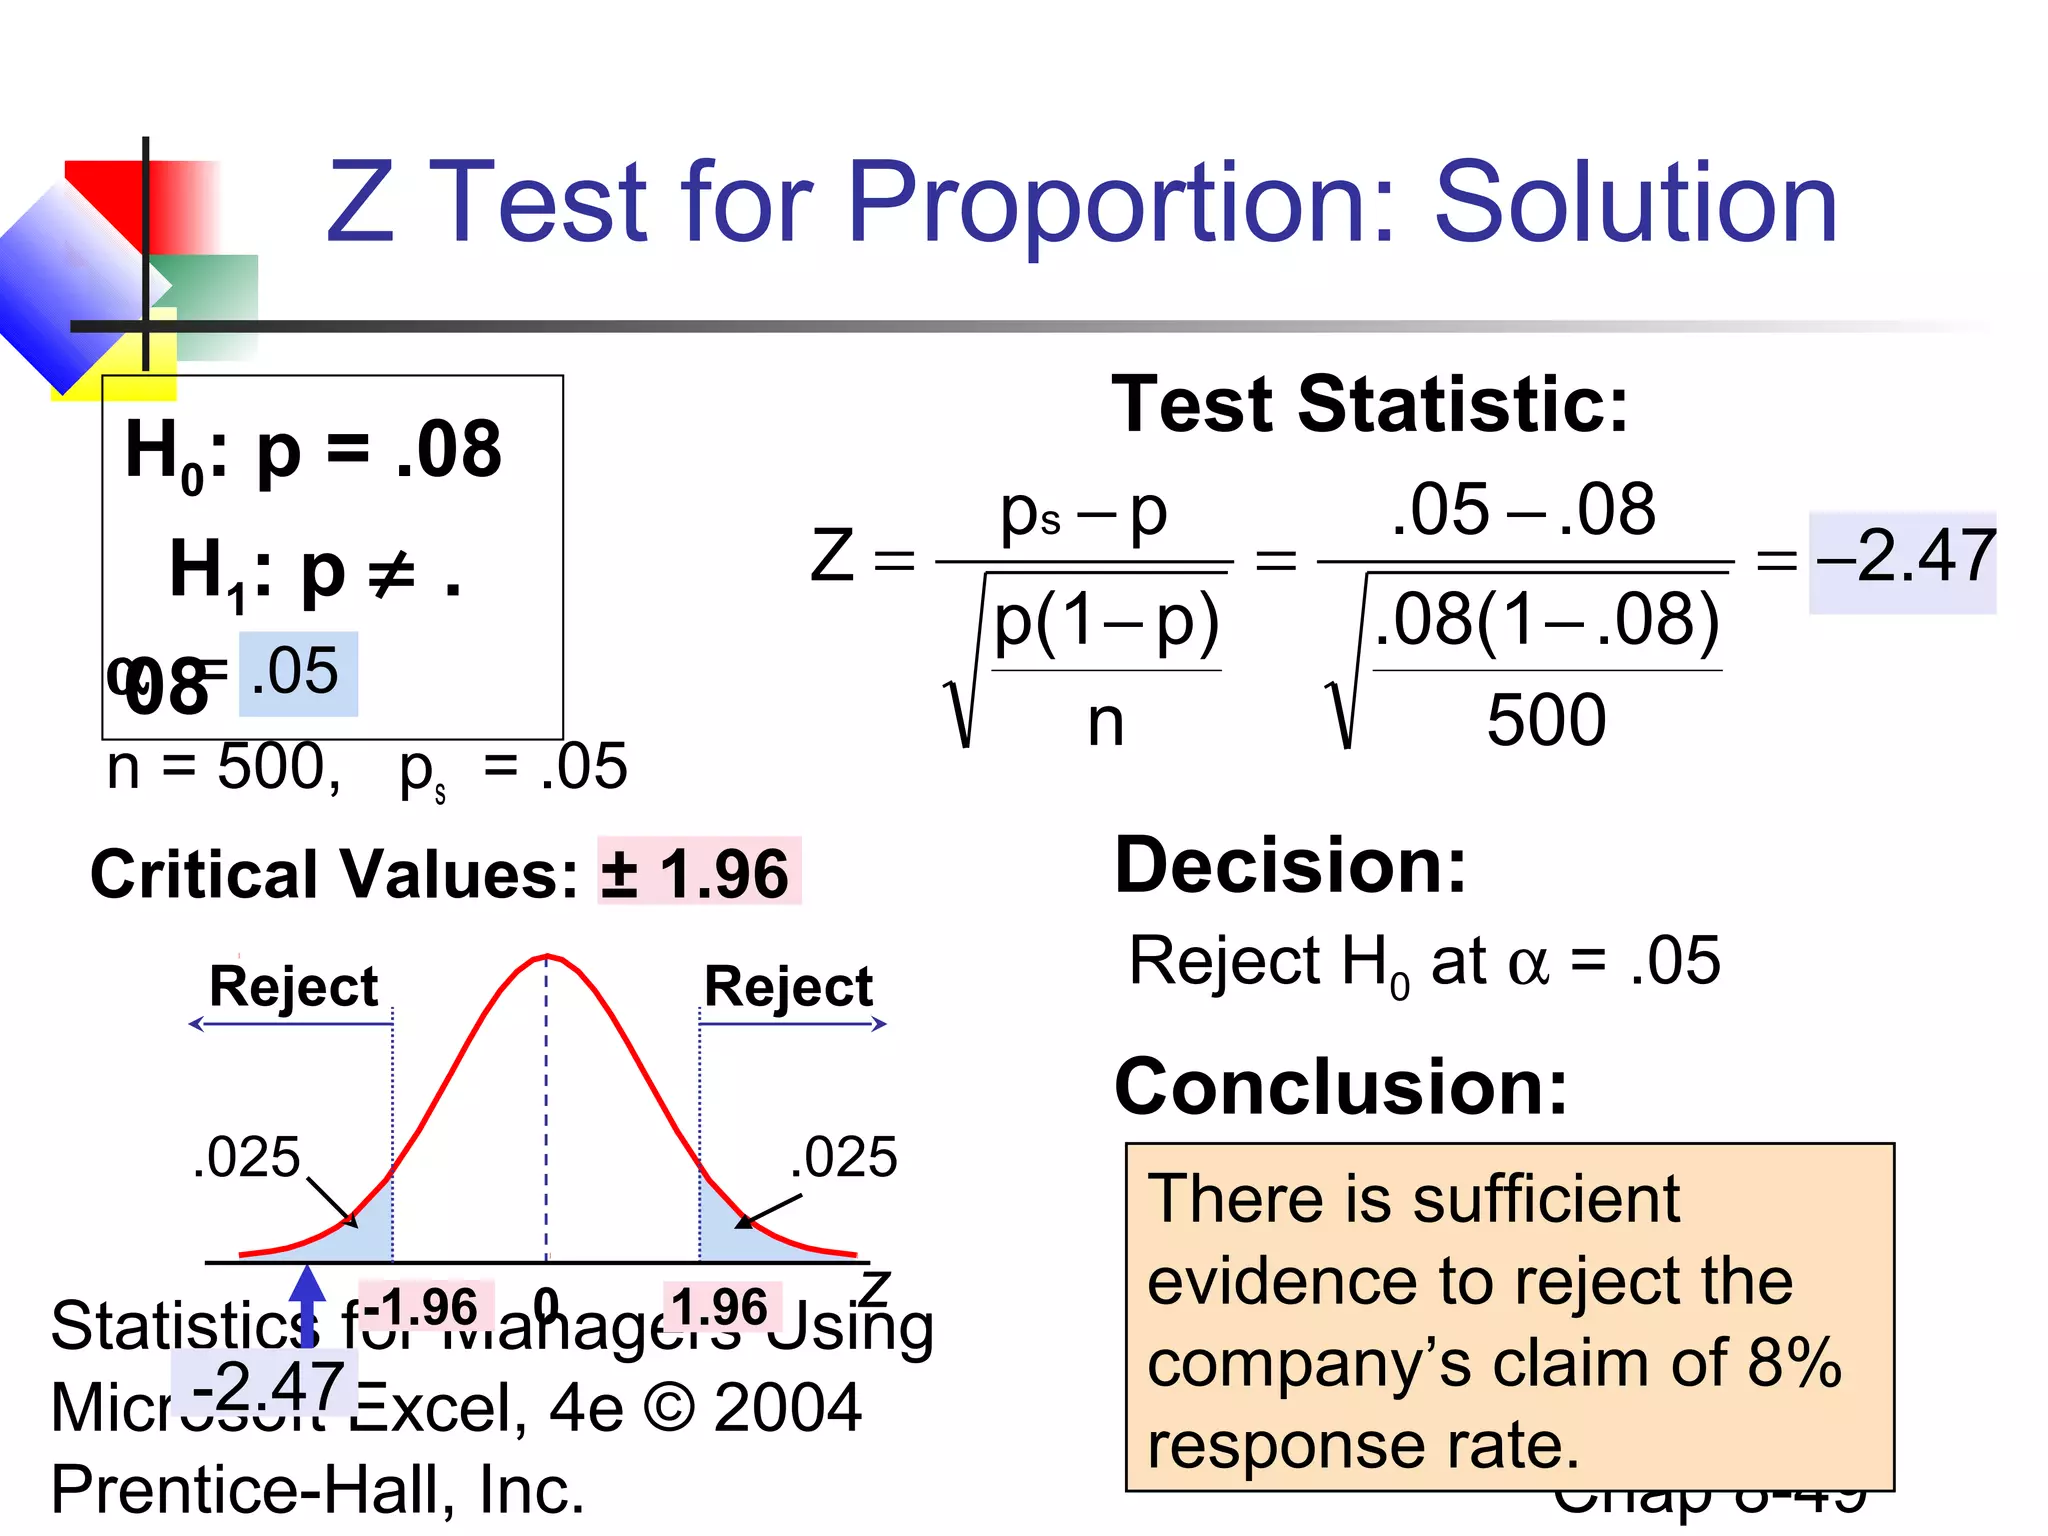
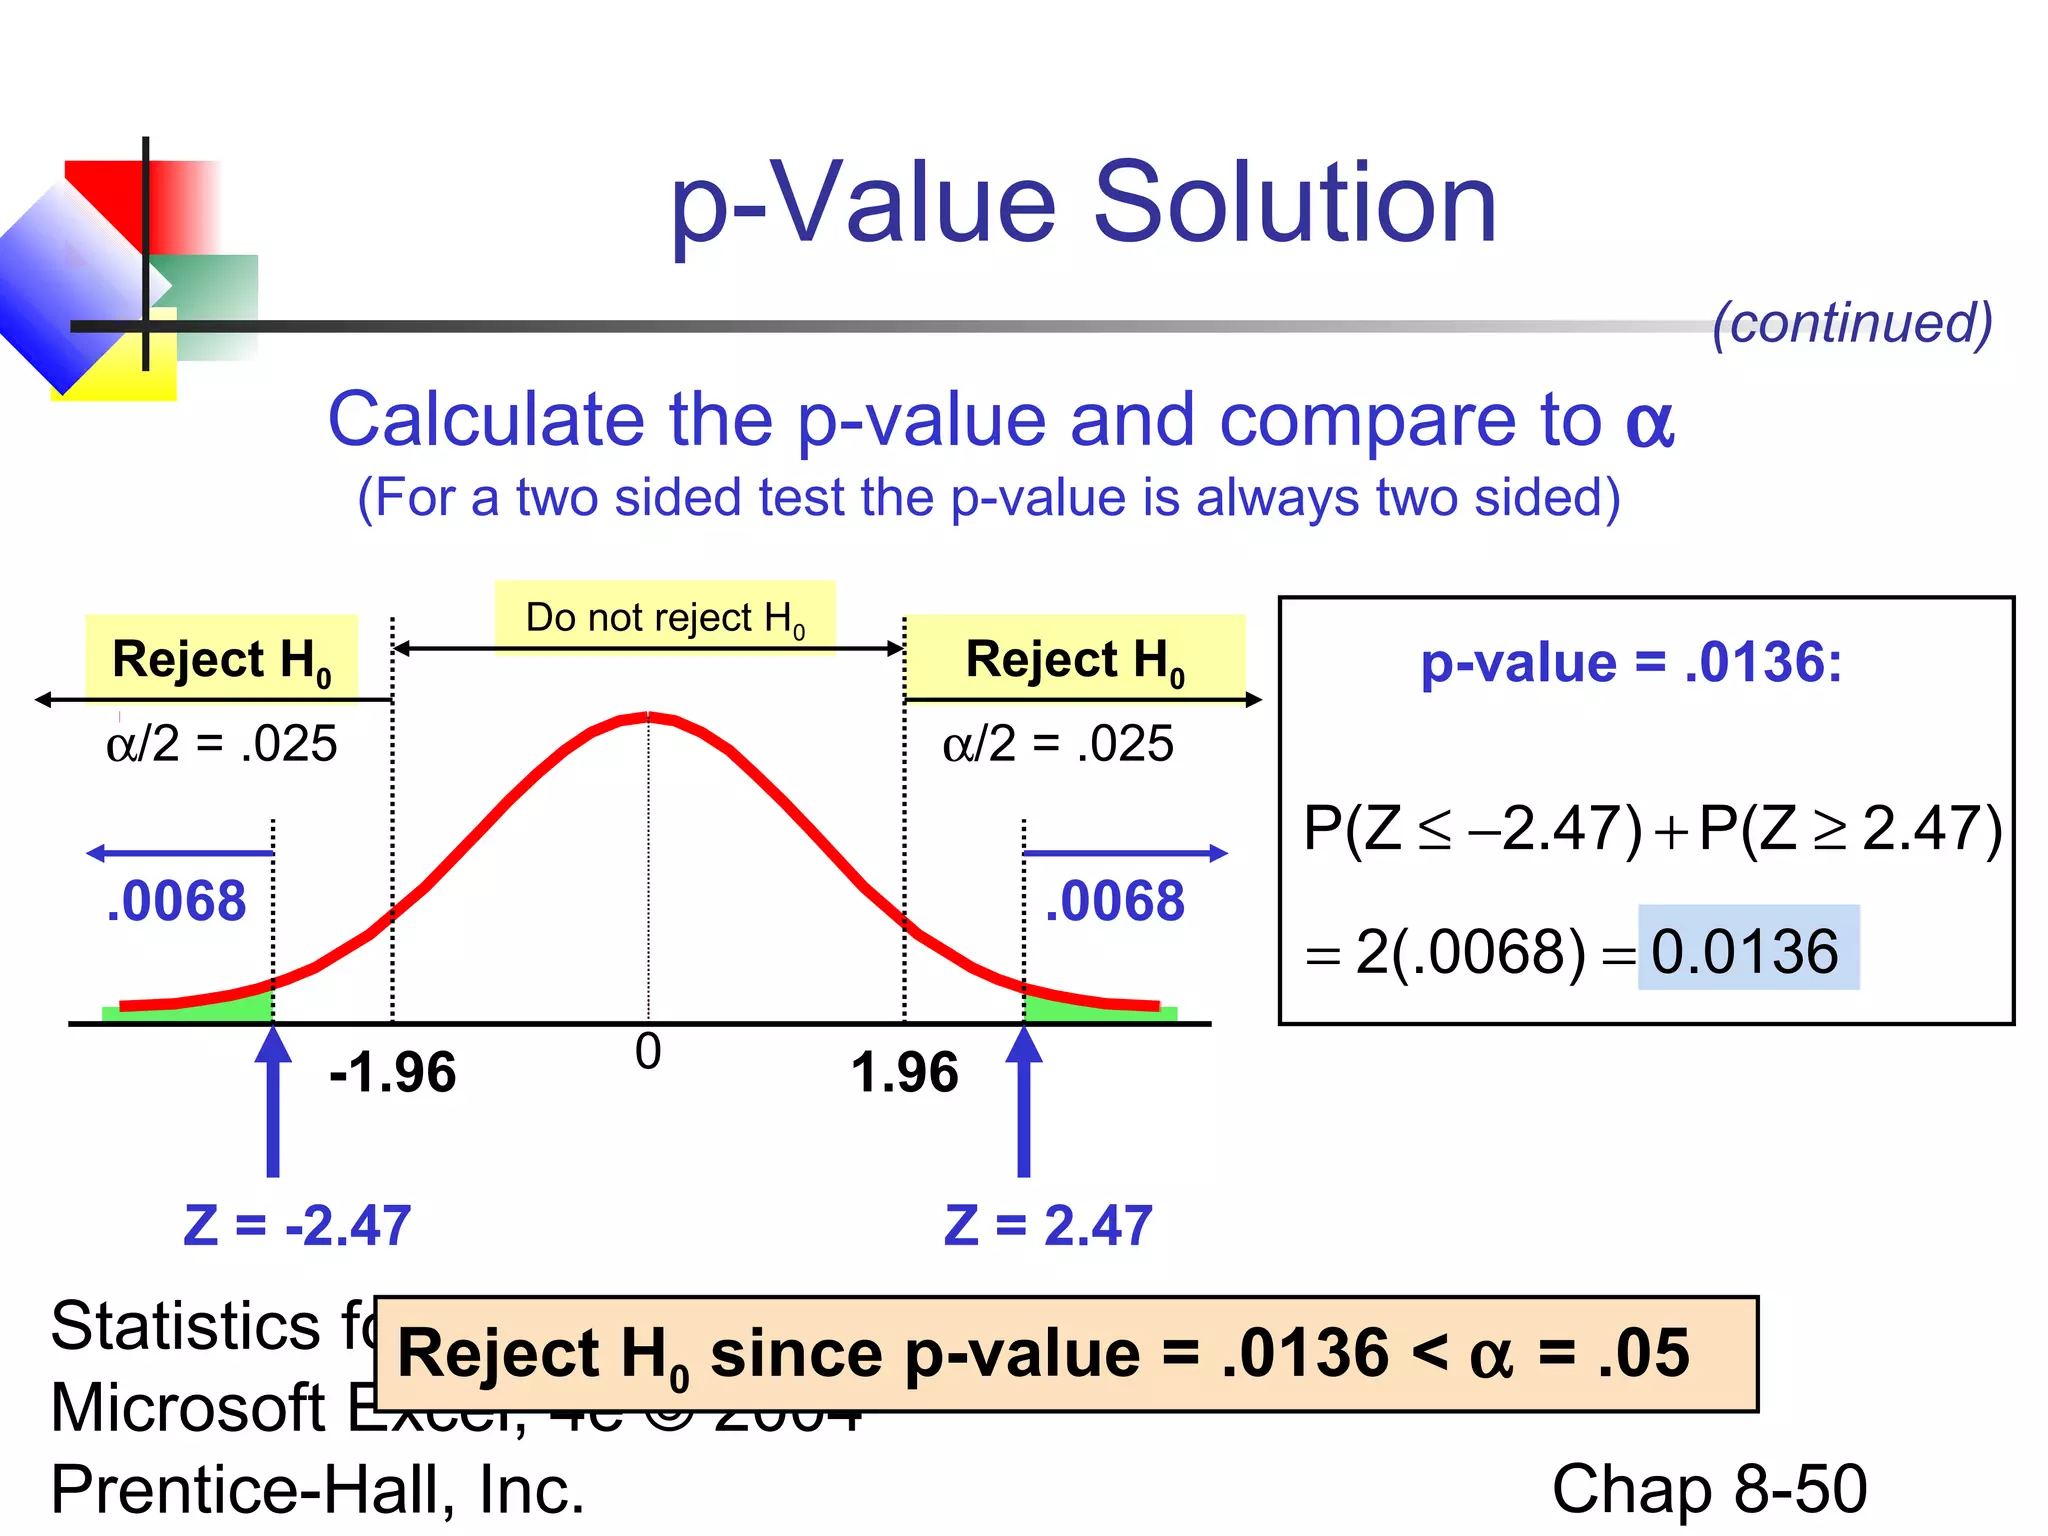

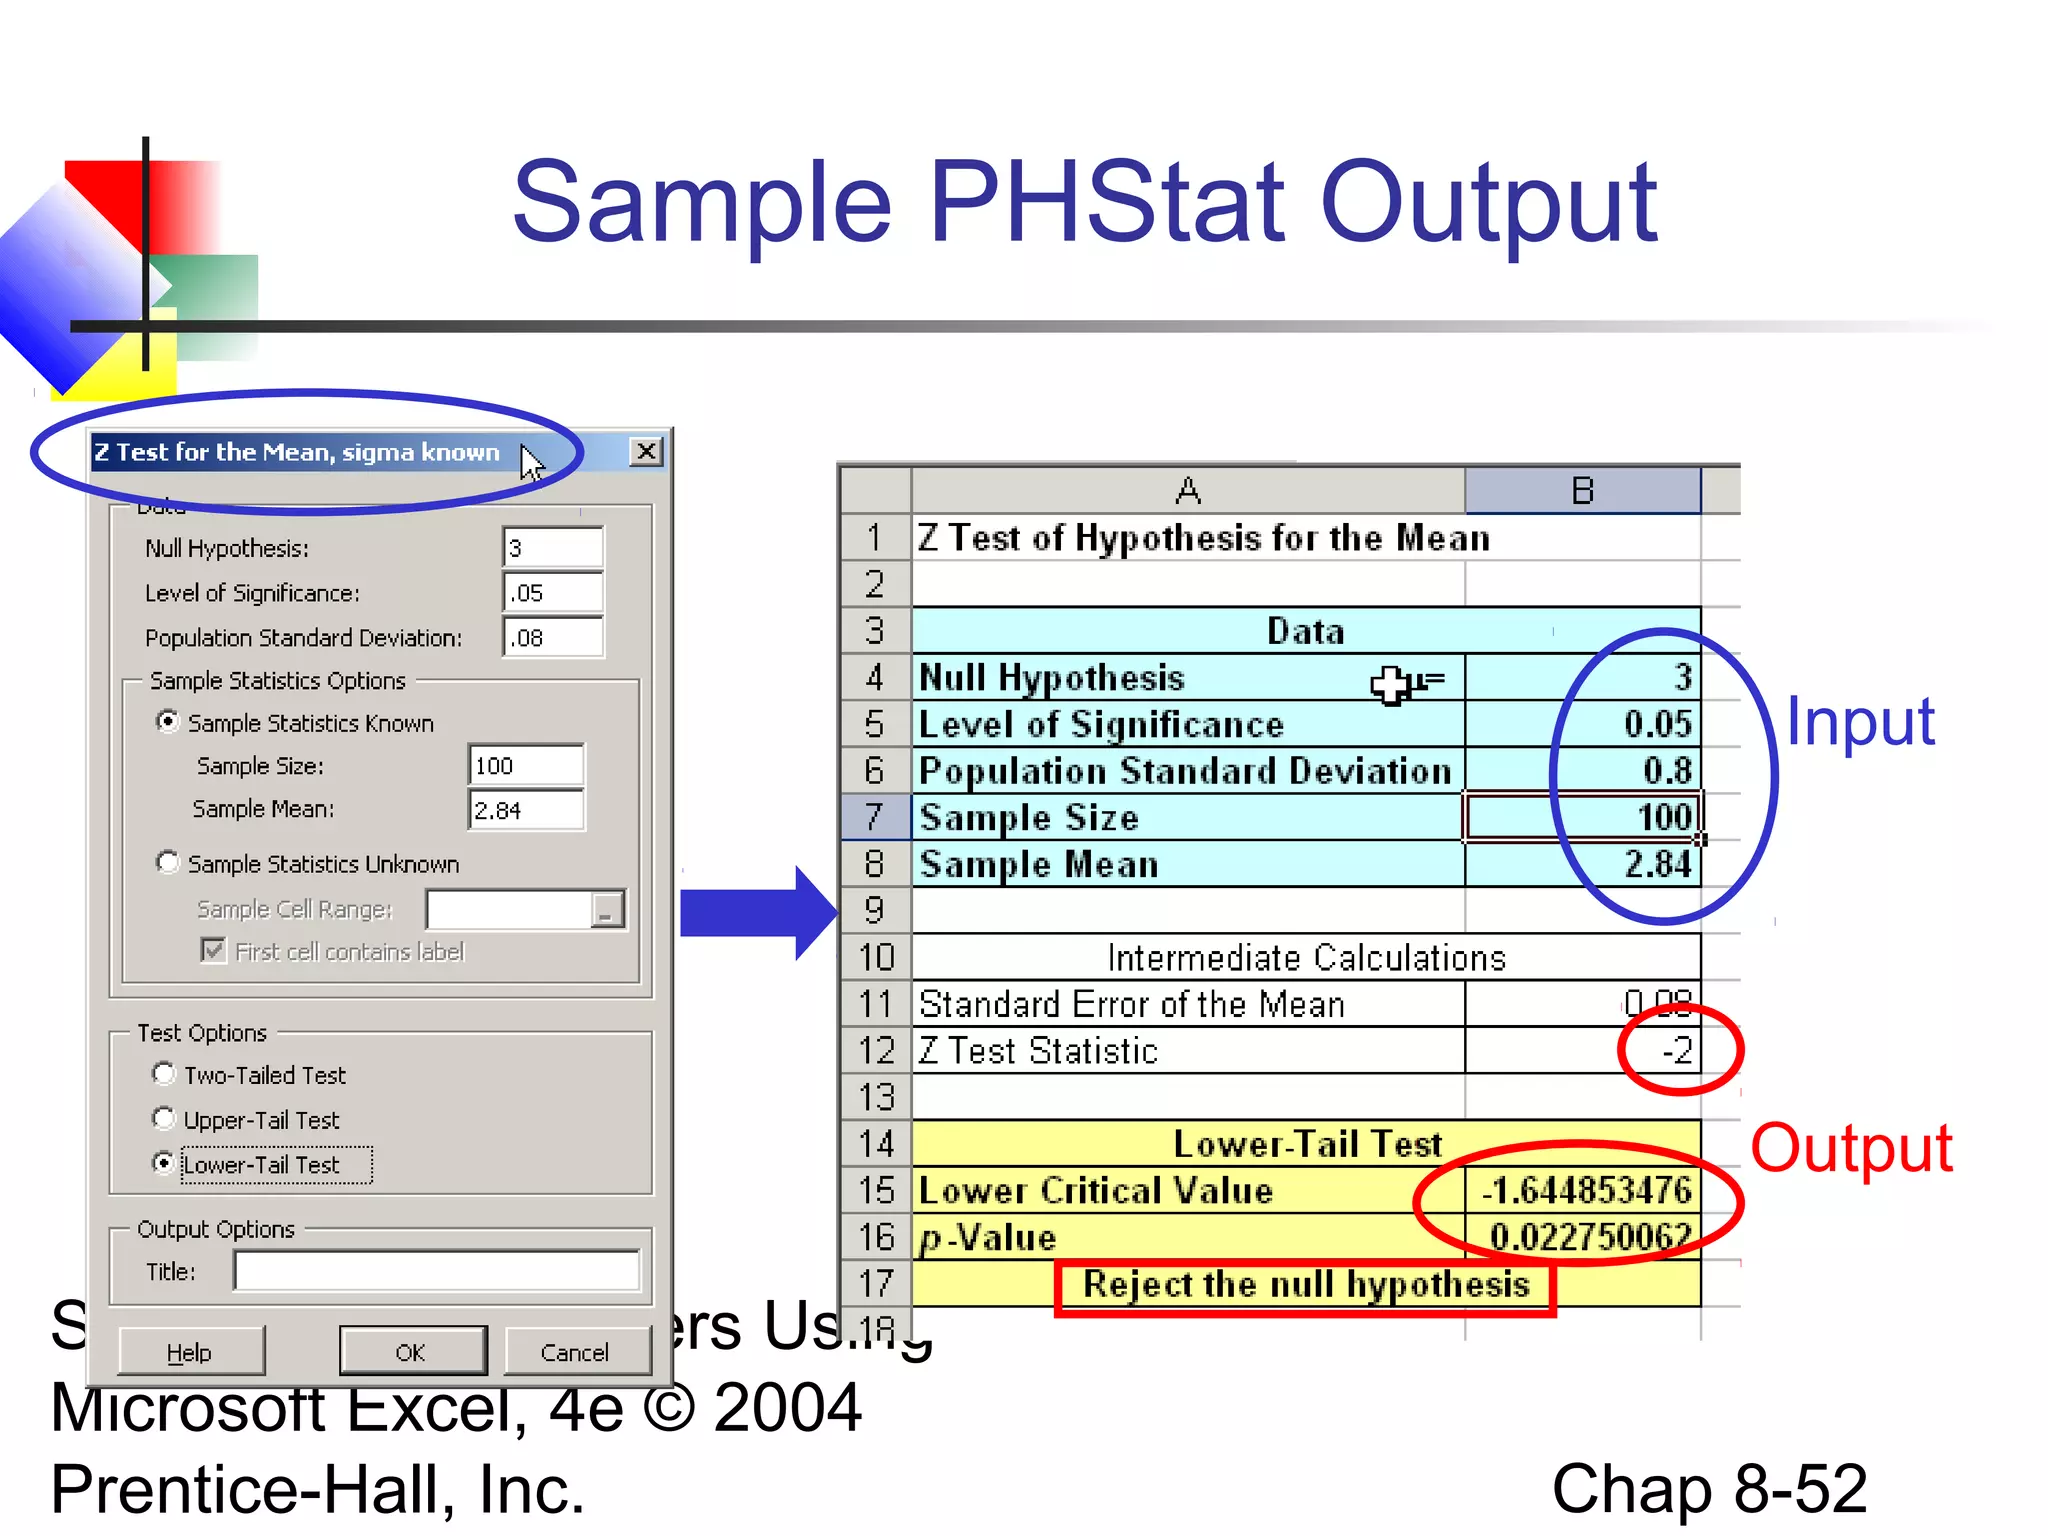

This chapter discusses fundamentals of hypothesis testing for one-sample tests. It covers: 1) Formulating the null and alternative hypotheses for tests involving a single population mean or proportion. 2) Using critical value and p-value approaches to test the null hypothesis, and defining Type I and Type II errors. 3) How to perform hypothesis tests for a single population mean when the population standard deviation is known or unknown.