Downloaded 245 times
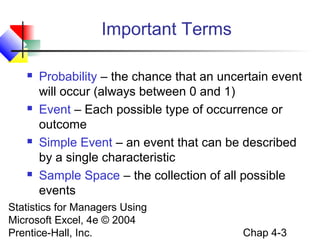
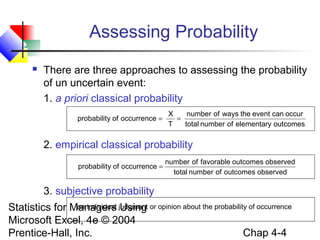
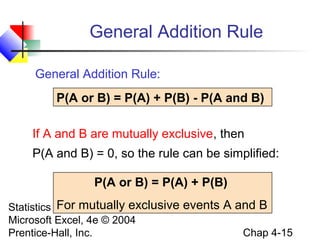
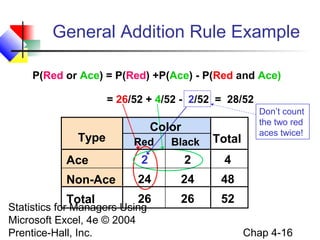
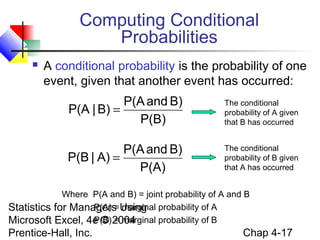
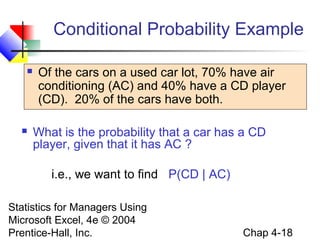
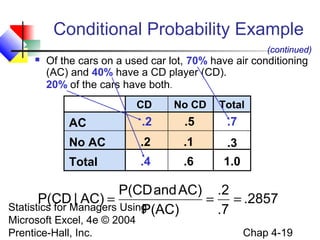
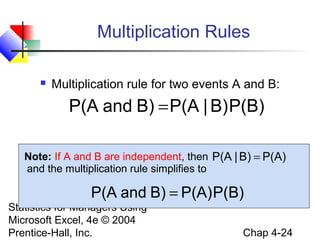
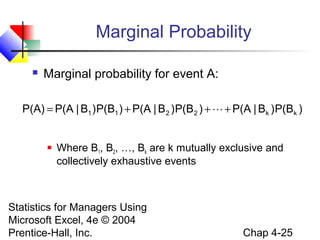
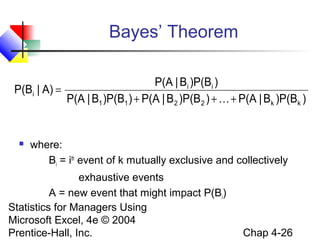
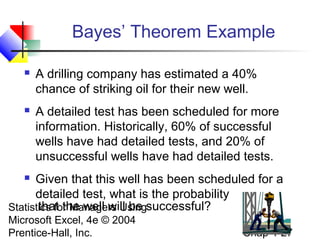
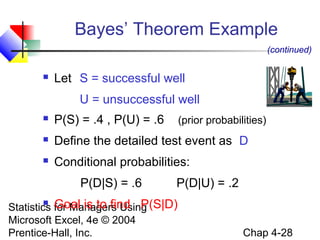
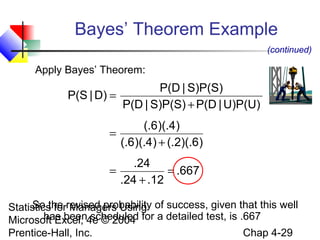
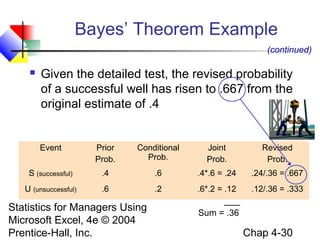
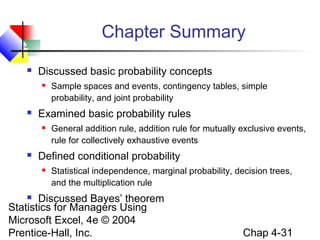

This chapter discusses basic probability concepts, including defining probability, sample spaces, simple and joint events, and assessing probability through classical and subjective approaches. It also covers key probability rules like the general addition rule, computing conditional probabilities, statistical independence, and Bayes' theorem. The goals are to explain these fundamental probability topics, show how to apply common probability rules, and determine if events are statistically independent or dependent.


![Getting Started with Apache Spark: Big Data Made Simple [Free Meetup]](https://cdn.slidesharecdn.com/ss_thumbnails/apachesparkgettingstarted-260203175547-8361bcc3-thumbnail.jpg?width=640&height=640&fit=bounds)


