Downloaded 200 times


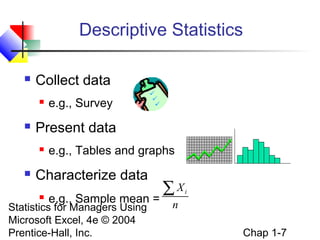
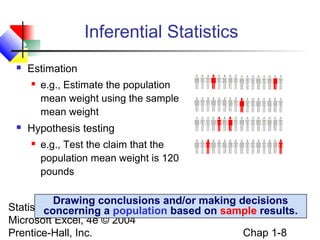
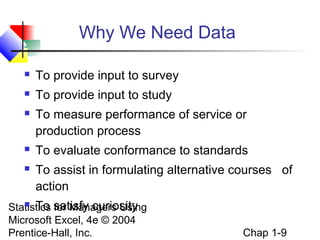
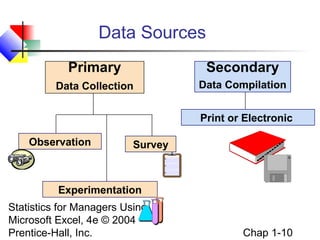
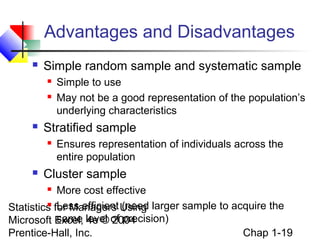
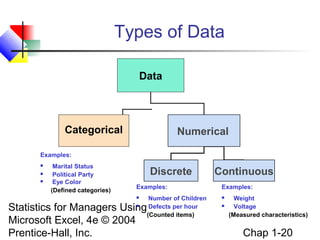
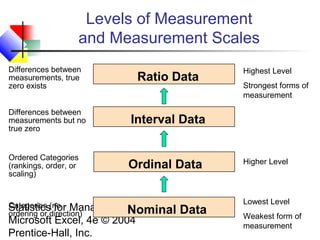
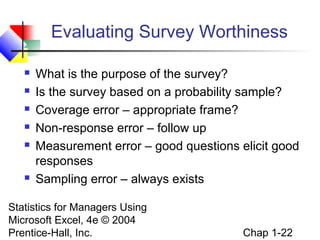


This chapter introduces fundamental statistical concepts for managers. It defines key terms like population, sample, and parameter and discusses descriptive and inferential statistics. The chapter outlines different data collection methods and sampling techniques, including probability and non-probability samples. It also covers data types, levels of measurement, evaluating survey quality, and sources of survey error. The goal is to explain why understanding statistics is important for managers to analyze data and make informed decisions.


![Getting Started with Apache Spark: Big Data Made Simple [Free Meetup]](https://cdn.slidesharecdn.com/ss_thumbnails/apachesparkgettingstarted-260203175547-8361bcc3-thumbnail.jpg?width=640&height=640&fit=bounds)


