Downloaded 113 times
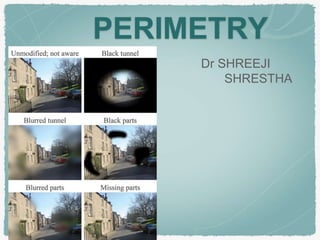


Dr. Shreeji Shrestha provides an overview of perimetry, beginning with an introduction to the visual field and its importance in mapping disorders of the optic nerve and visual pathway. The document then discusses different types of perimetry, including kinetic, static, bedside, and formal perimetry. Key terms used in perimetry are defined, such as threshold, isopter, and decibel. Factors that can affect sensitivity are reviewed. Common visual field defects seen in conditions like glaucoma and their progression are described. Emerging techniques like short wavelength automated perimetry and frequency doubling technology are also summarized.


