Download as PDF, PPTX


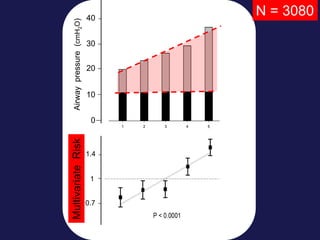


![P < 0.0001
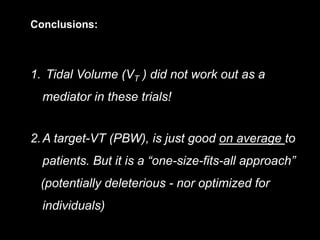
Odds-ratioforBarotrauma
(adjusted*)
*: pre-adjusted for age, APACHE/SAPS risk, arterial-pH, P/F ratio and study-trial
(multivariate logistic regression where both ∆P and VT co-participate in Model-1)
Odds for Barotrauma across quintiles of ∆P or VT:
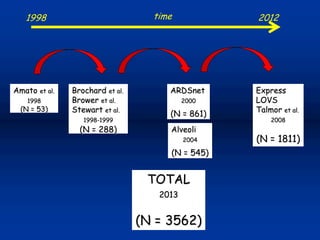
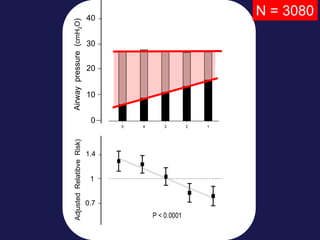
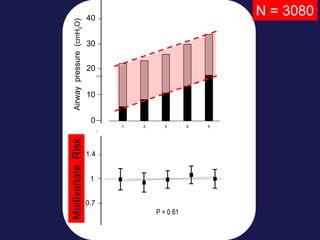
- Combined population of ARDS ( N = 3080 )
Figure 2d:
4 8 12 16 20 24 28
0.6
1.0
1.4
1.8
2.2
P < 0.0001
Driving-pressure (∆P, cmH2O)
Odds-ratioforBarotrauma
(adjusted*)
*: pre-adjusted for age, APACHE/SAPS risk, arterial-pH, P/F ratio and study-trial
(VT and ∆P co-participating in model-1 )
4 6 8 10 12
0.6
1.0
1.4
1.8
2.2
P = 0.87
Tidal-Volume (VT , mL/kg.PBW)
Odds-ratioforBarotrauma
(adjusted*)
*: pre-adjusted for age, APACHE/SAPS risk, arterial-pH, P/F ratio and study-trial
(VT and ∆P co-participating in model-1)
Driving-pressure (∆P, cmH2O)
4 8 12 16 20 24 28
Tidal-Volume (VT , mL/kg[PBW] )
4 6 12108
P < 0.0001 P = 0.87](https://image.slidesharecdn.com/whydrivingpressurematters-final3-180605081623/85/Mechanical-Ventilation-in-Critical-Care-Why-driving-pressure-matters-28-320.jpg)
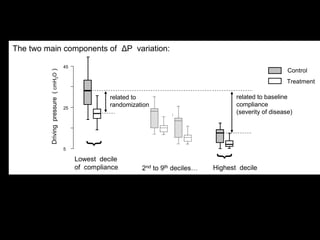

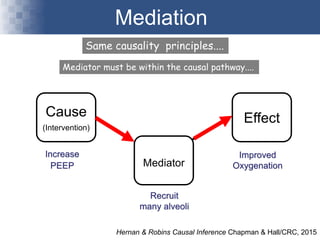
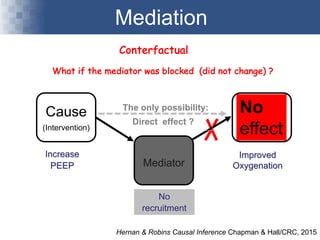
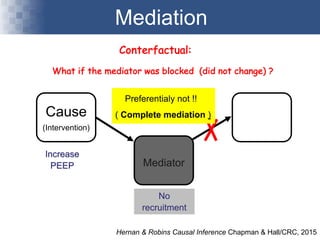
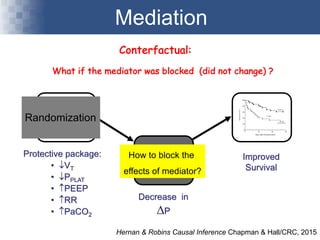
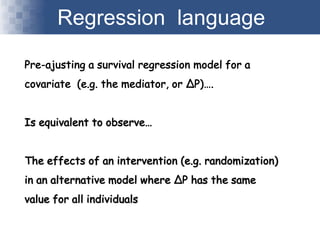
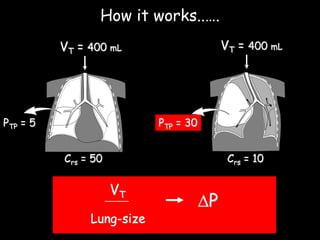


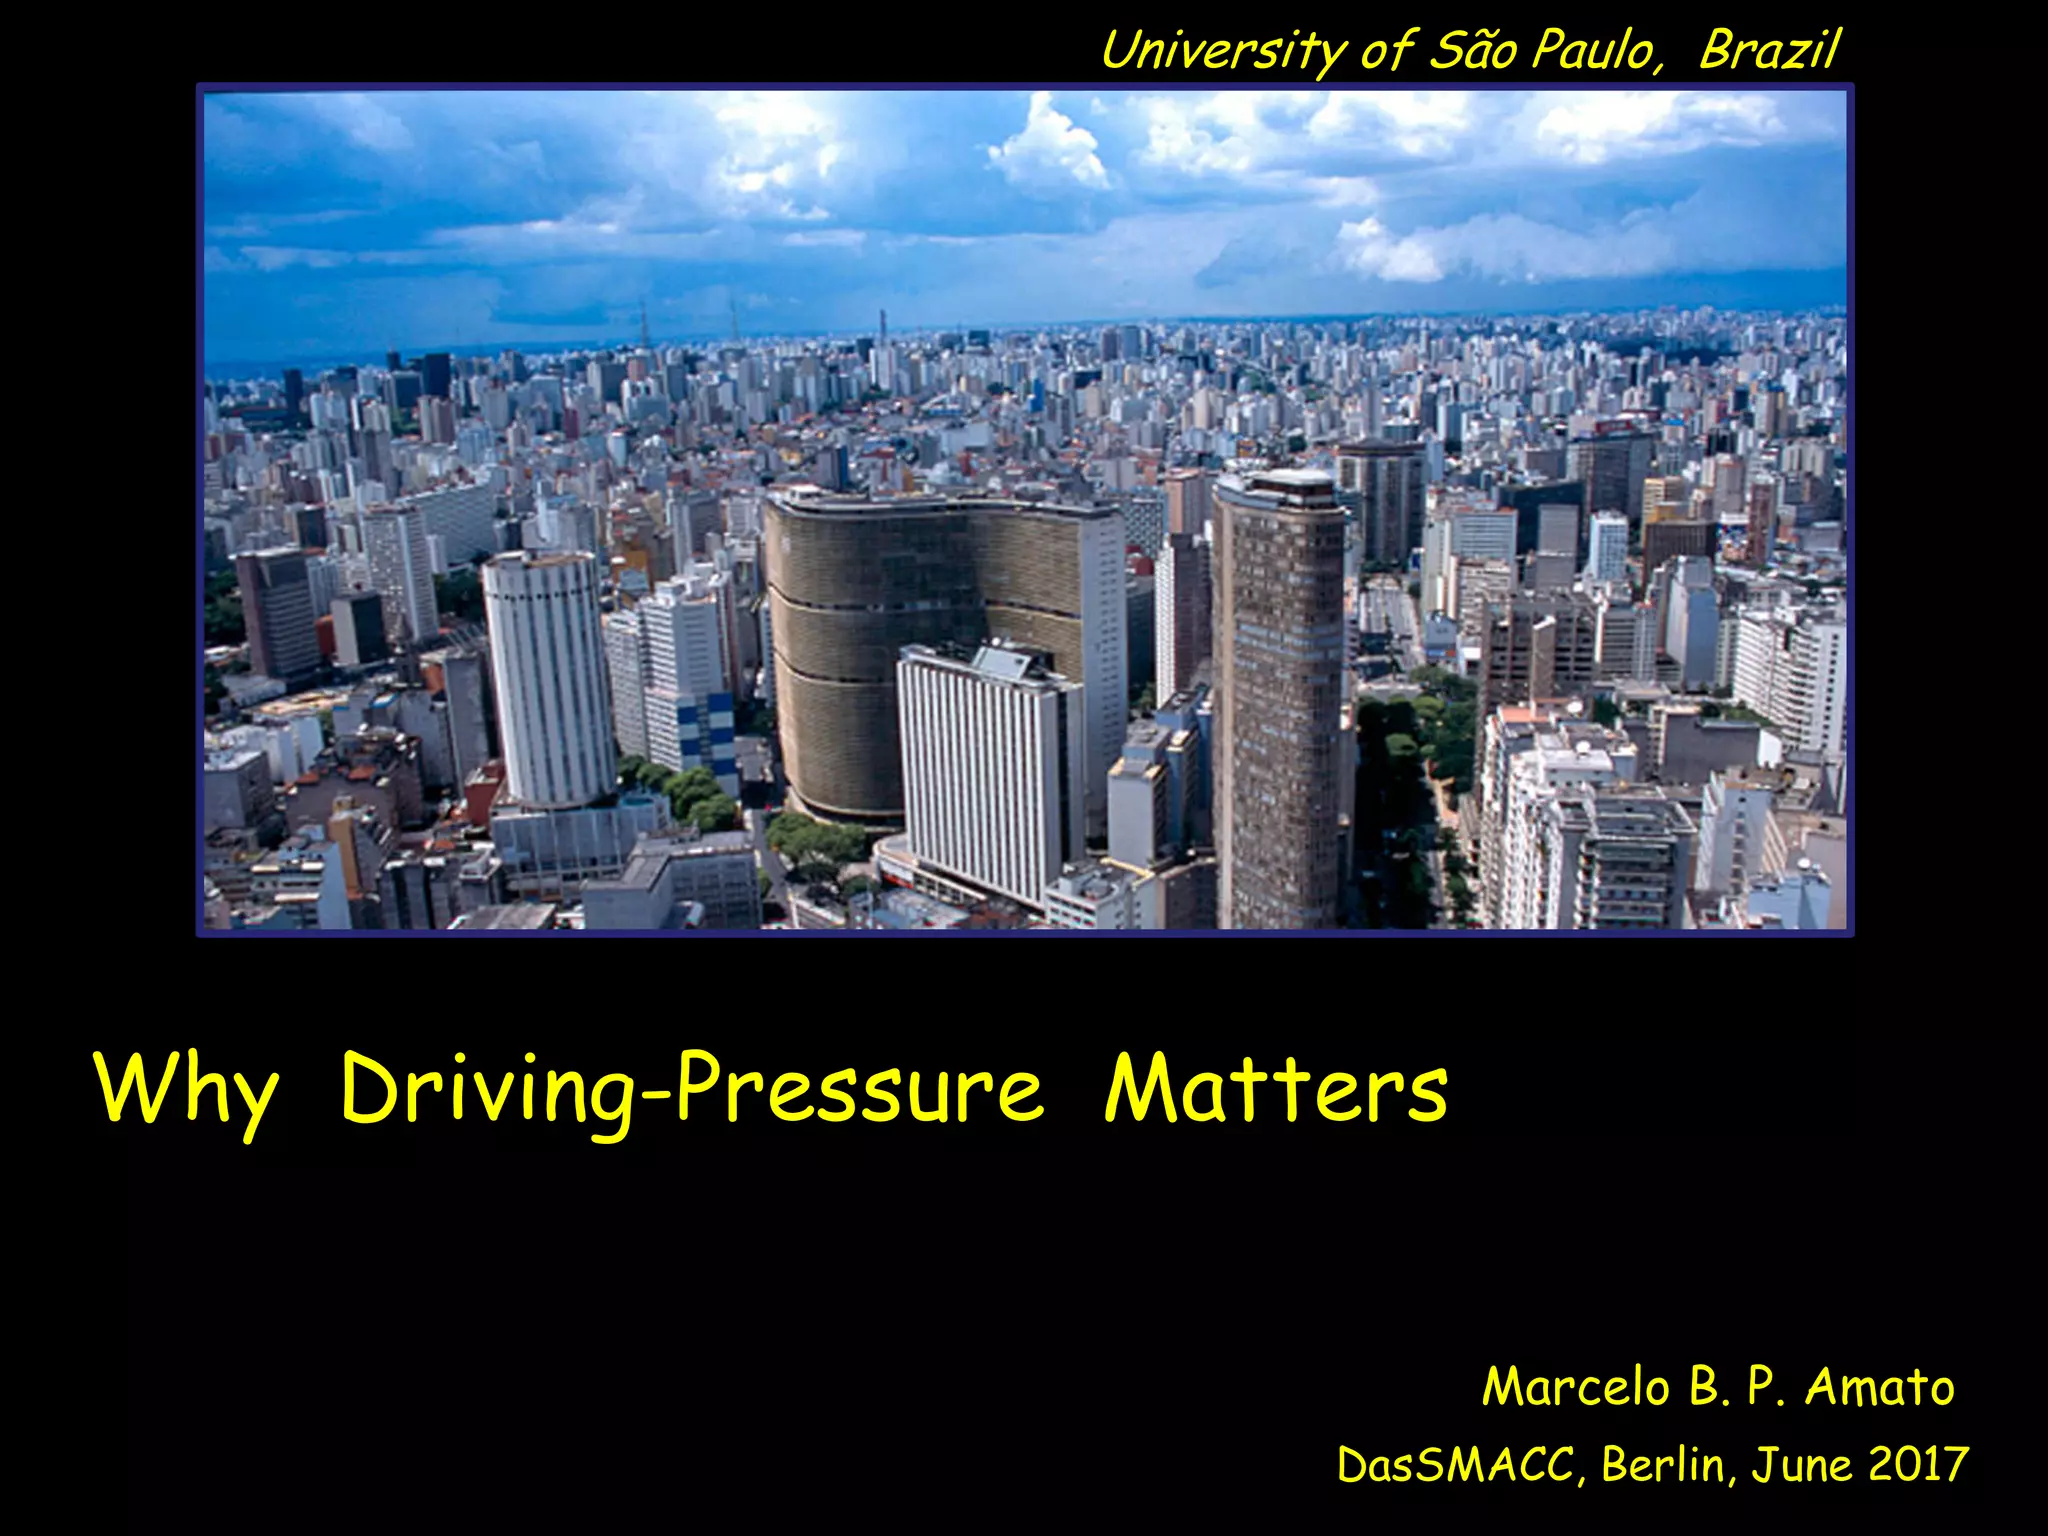
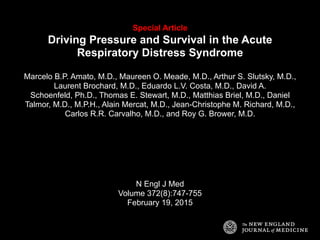
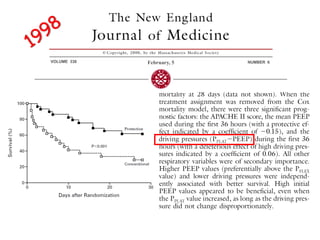
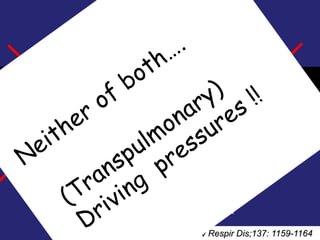
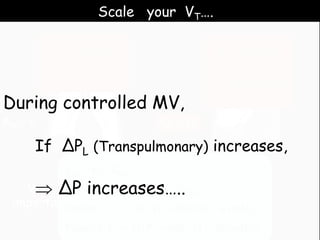
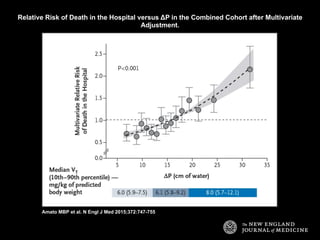
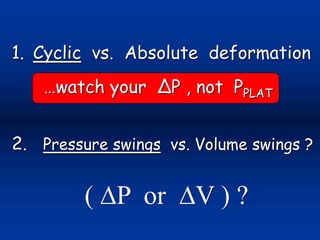
The document discusses the significance of driving pressure in the management of patients with acute respiratory distress syndrome (ARDS), emphasizing its correlation with survival outcomes. It presents a series of studies and observations that indicate the need to monitor driving pressure rather than solely relying on plateau pressure during mechanical ventilation. Key findings suggest that tidal volume does not act as a mediator in improving patient outcomes, which challenges traditional one-size-fits-all ventilation strategies.


![ONFH[AVN HIP] -TRIPLE REGIME -A NOVAL SURGICAL CONCEPT .pptx](https://cdn.slidesharecdn.com/ss_thumbnails/onfhavnhip2026koaconcalicutdrgokuldevdrmashraf-260210064517-213ec005-thumbnail.jpg?width=640&height=640&fit=bounds)


