Downloaded 174 times
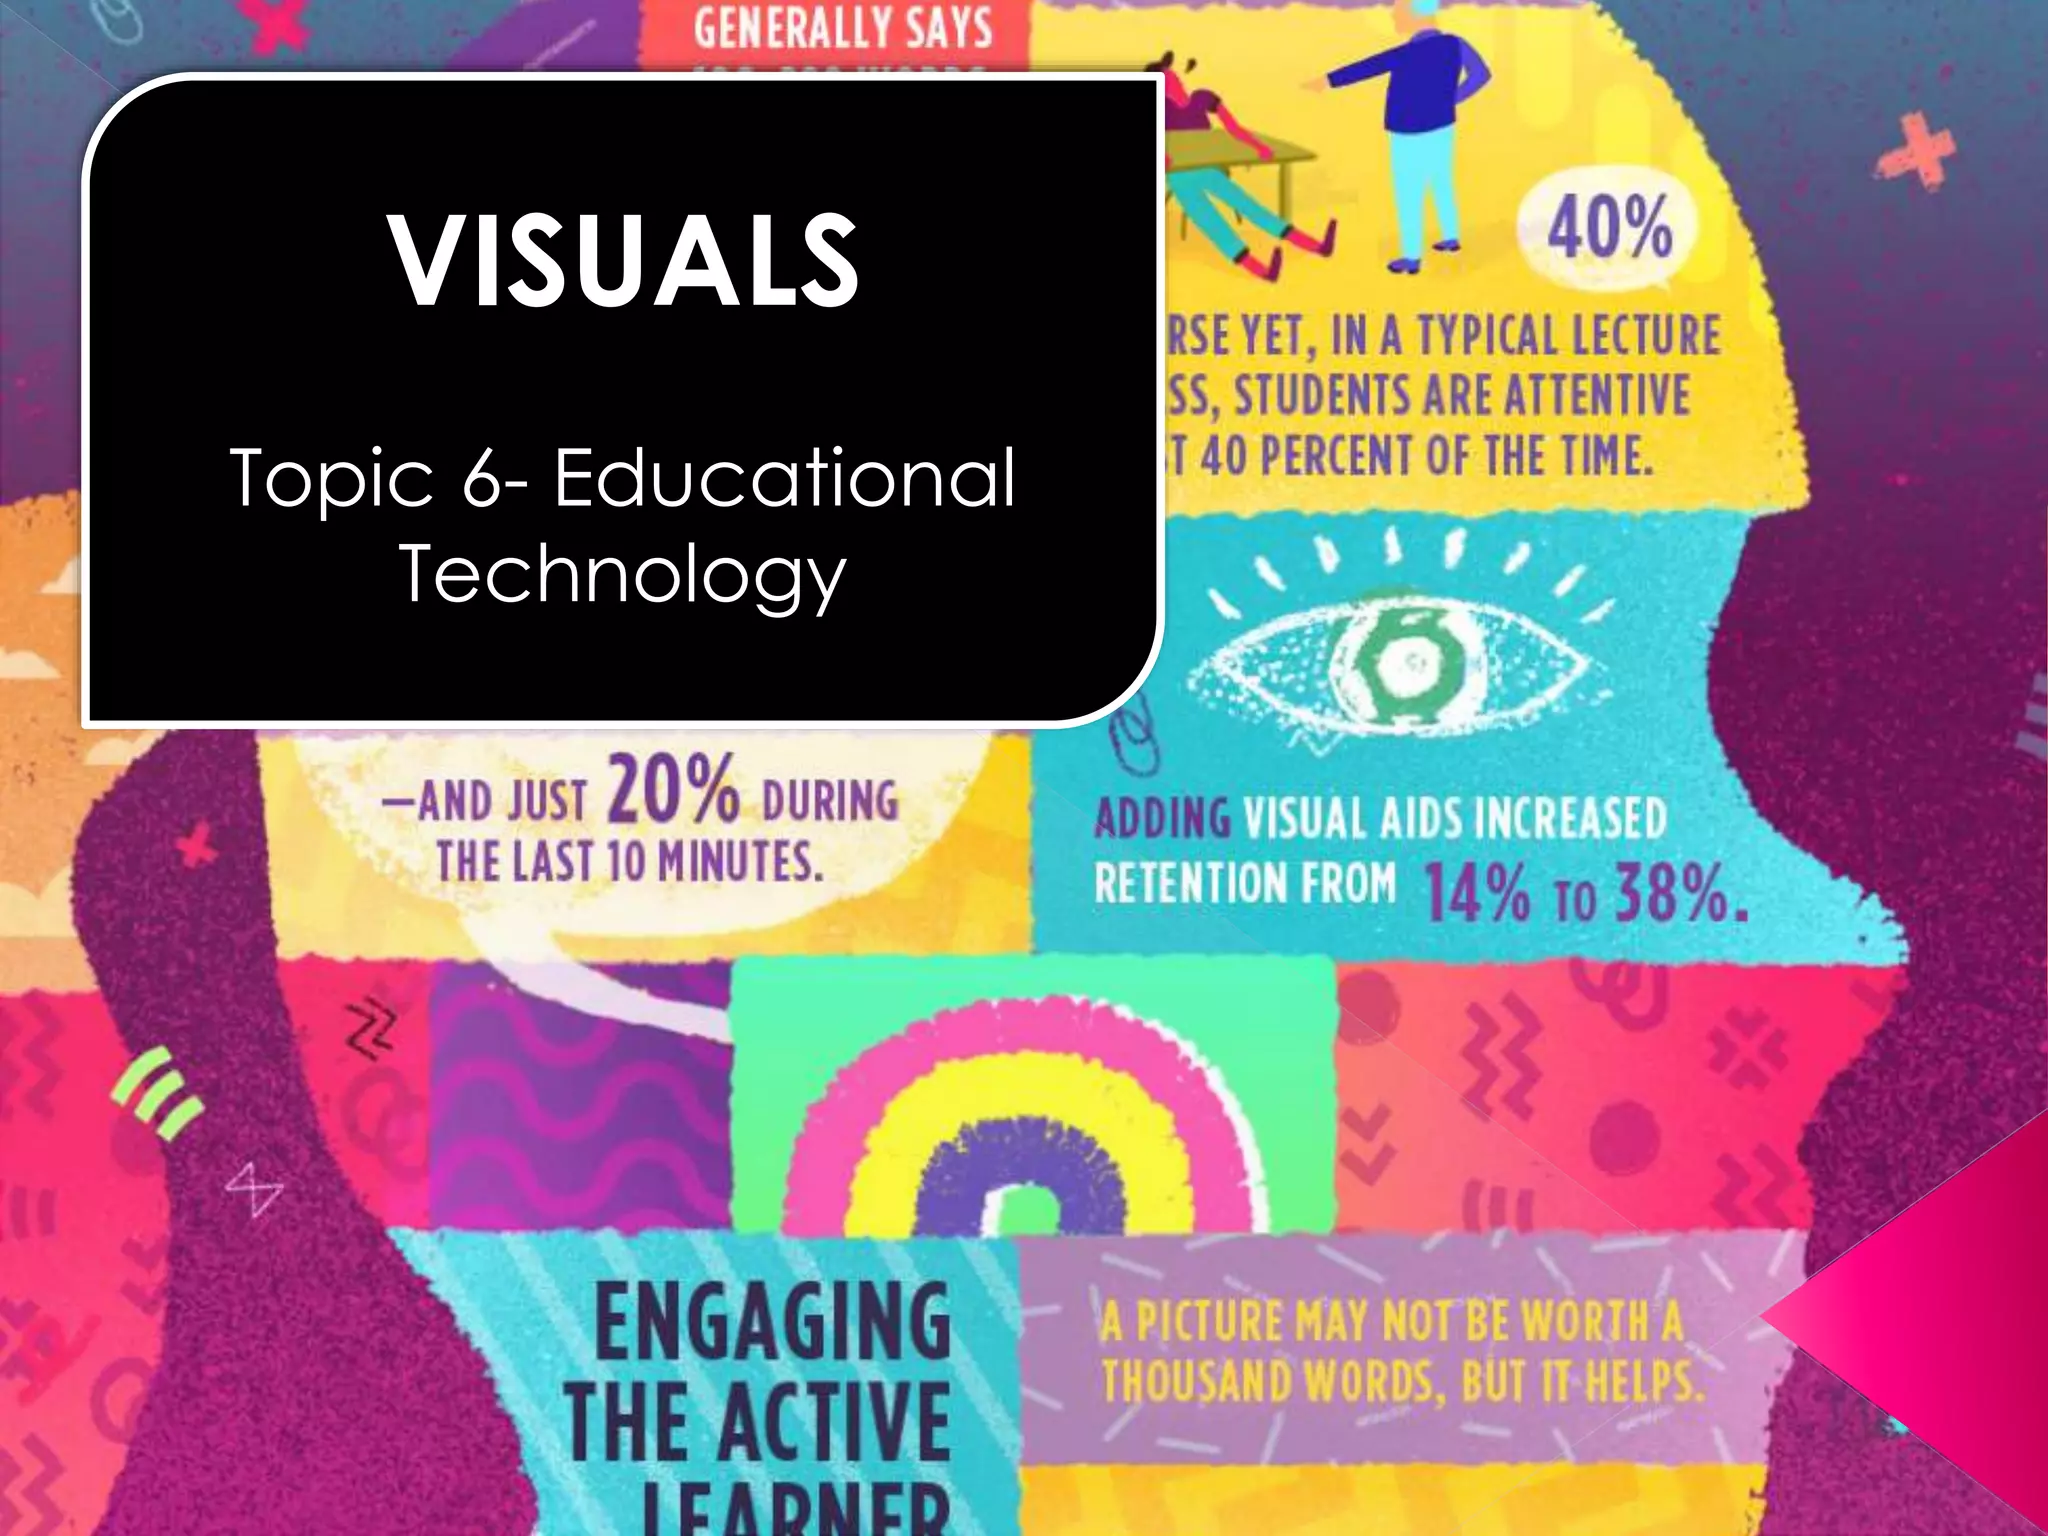
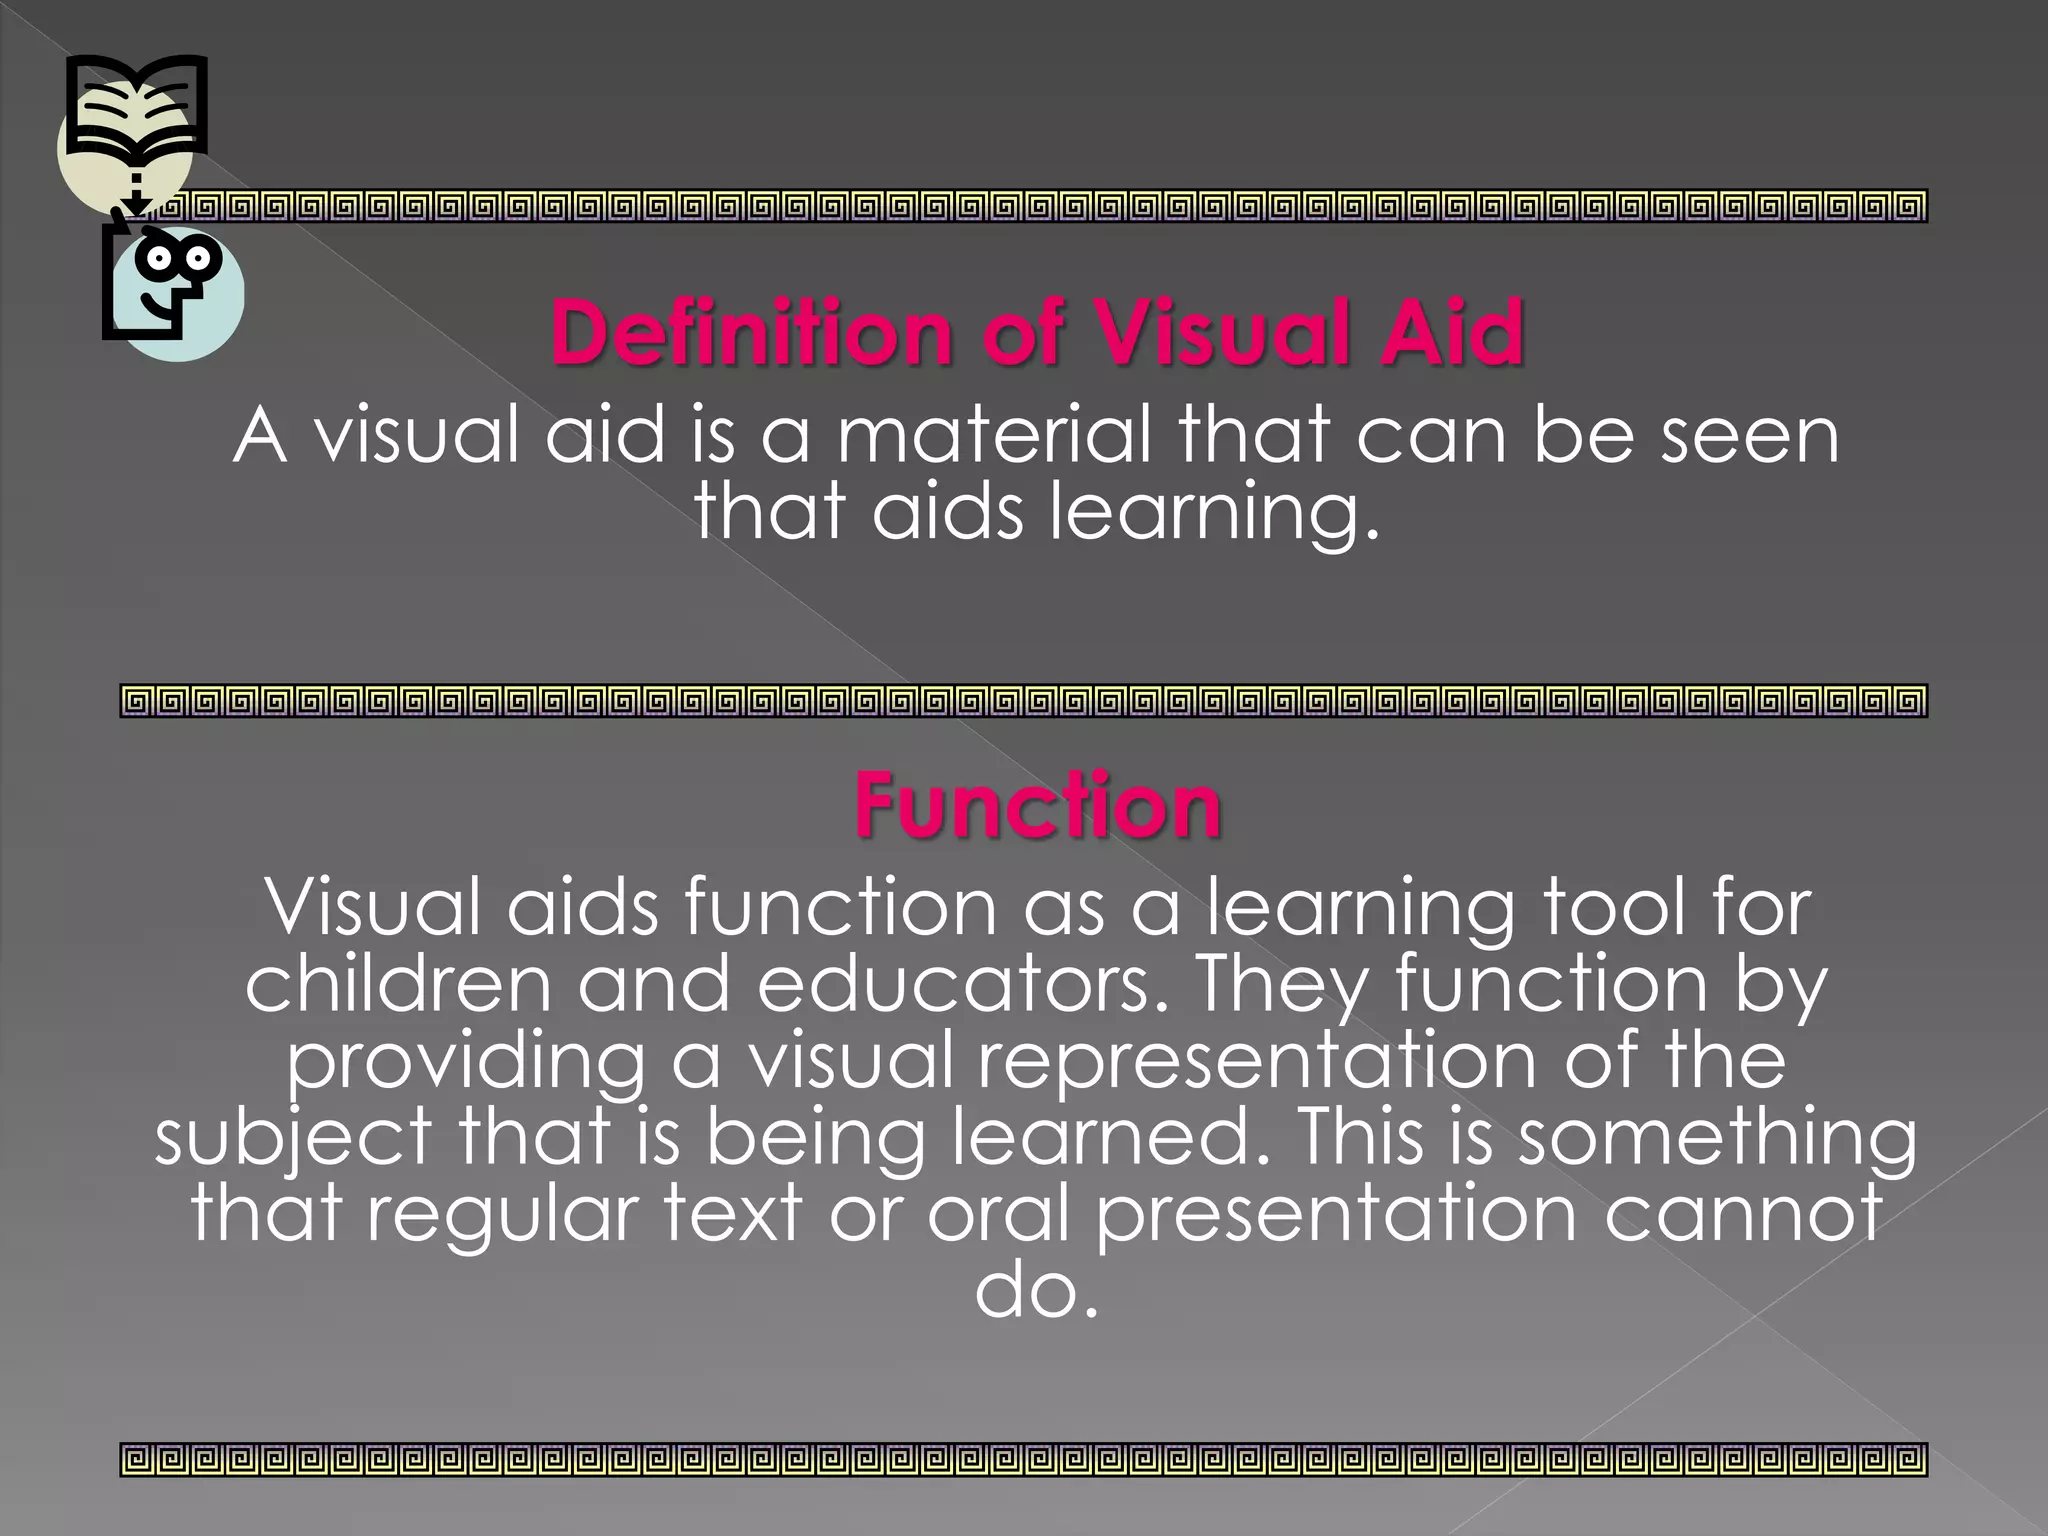
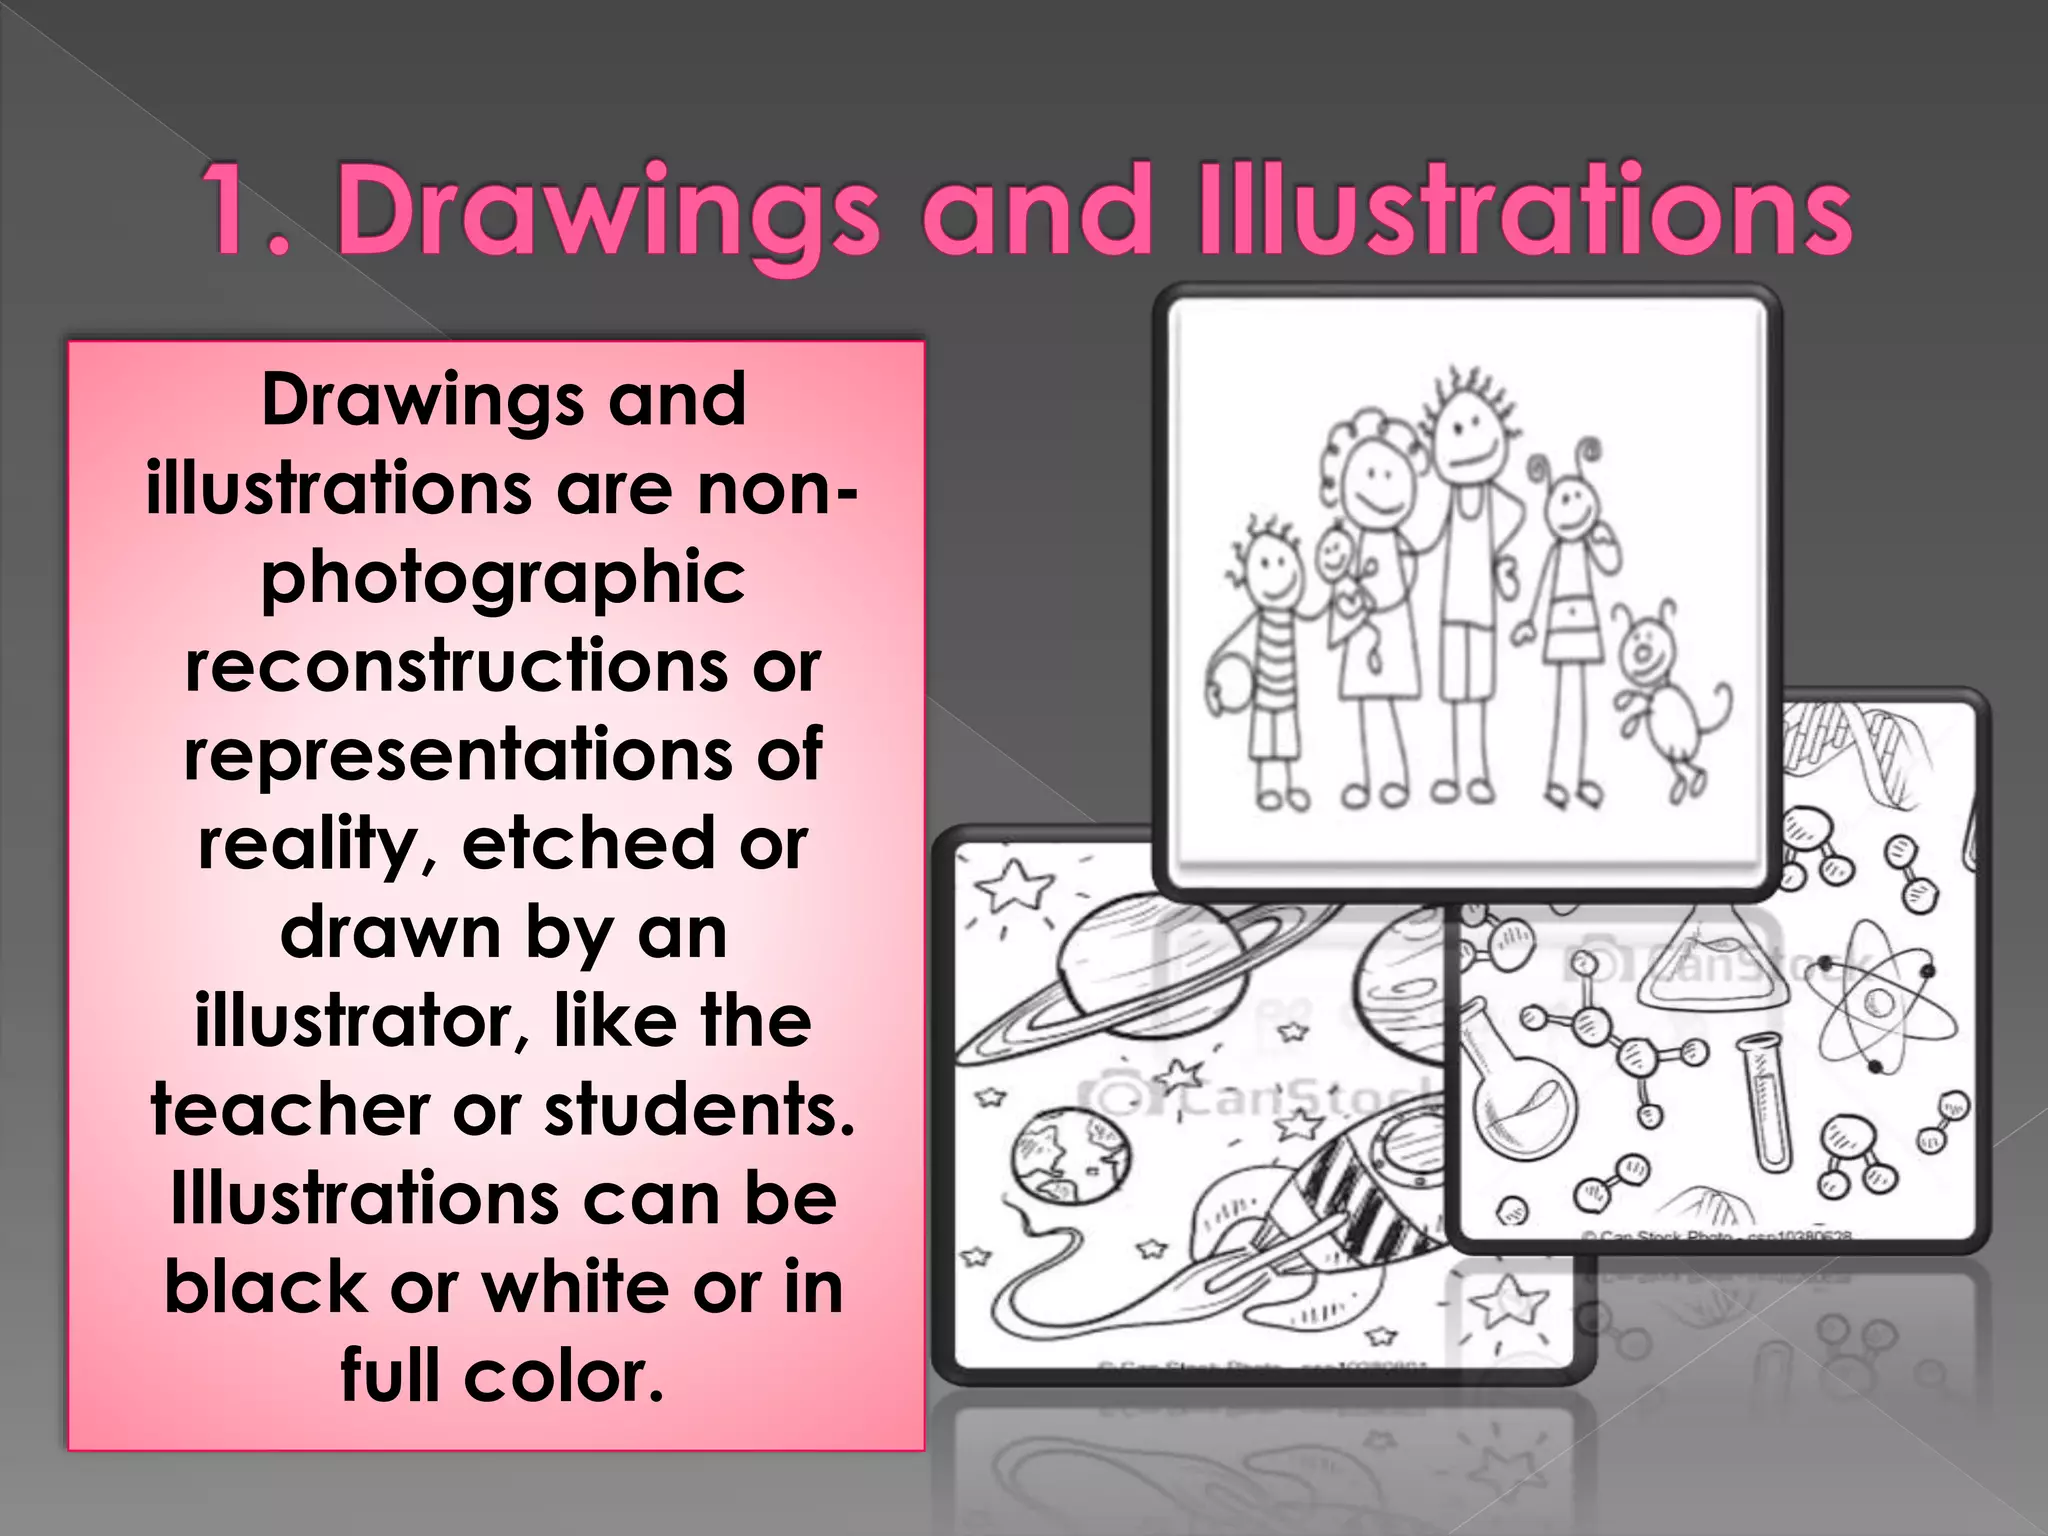
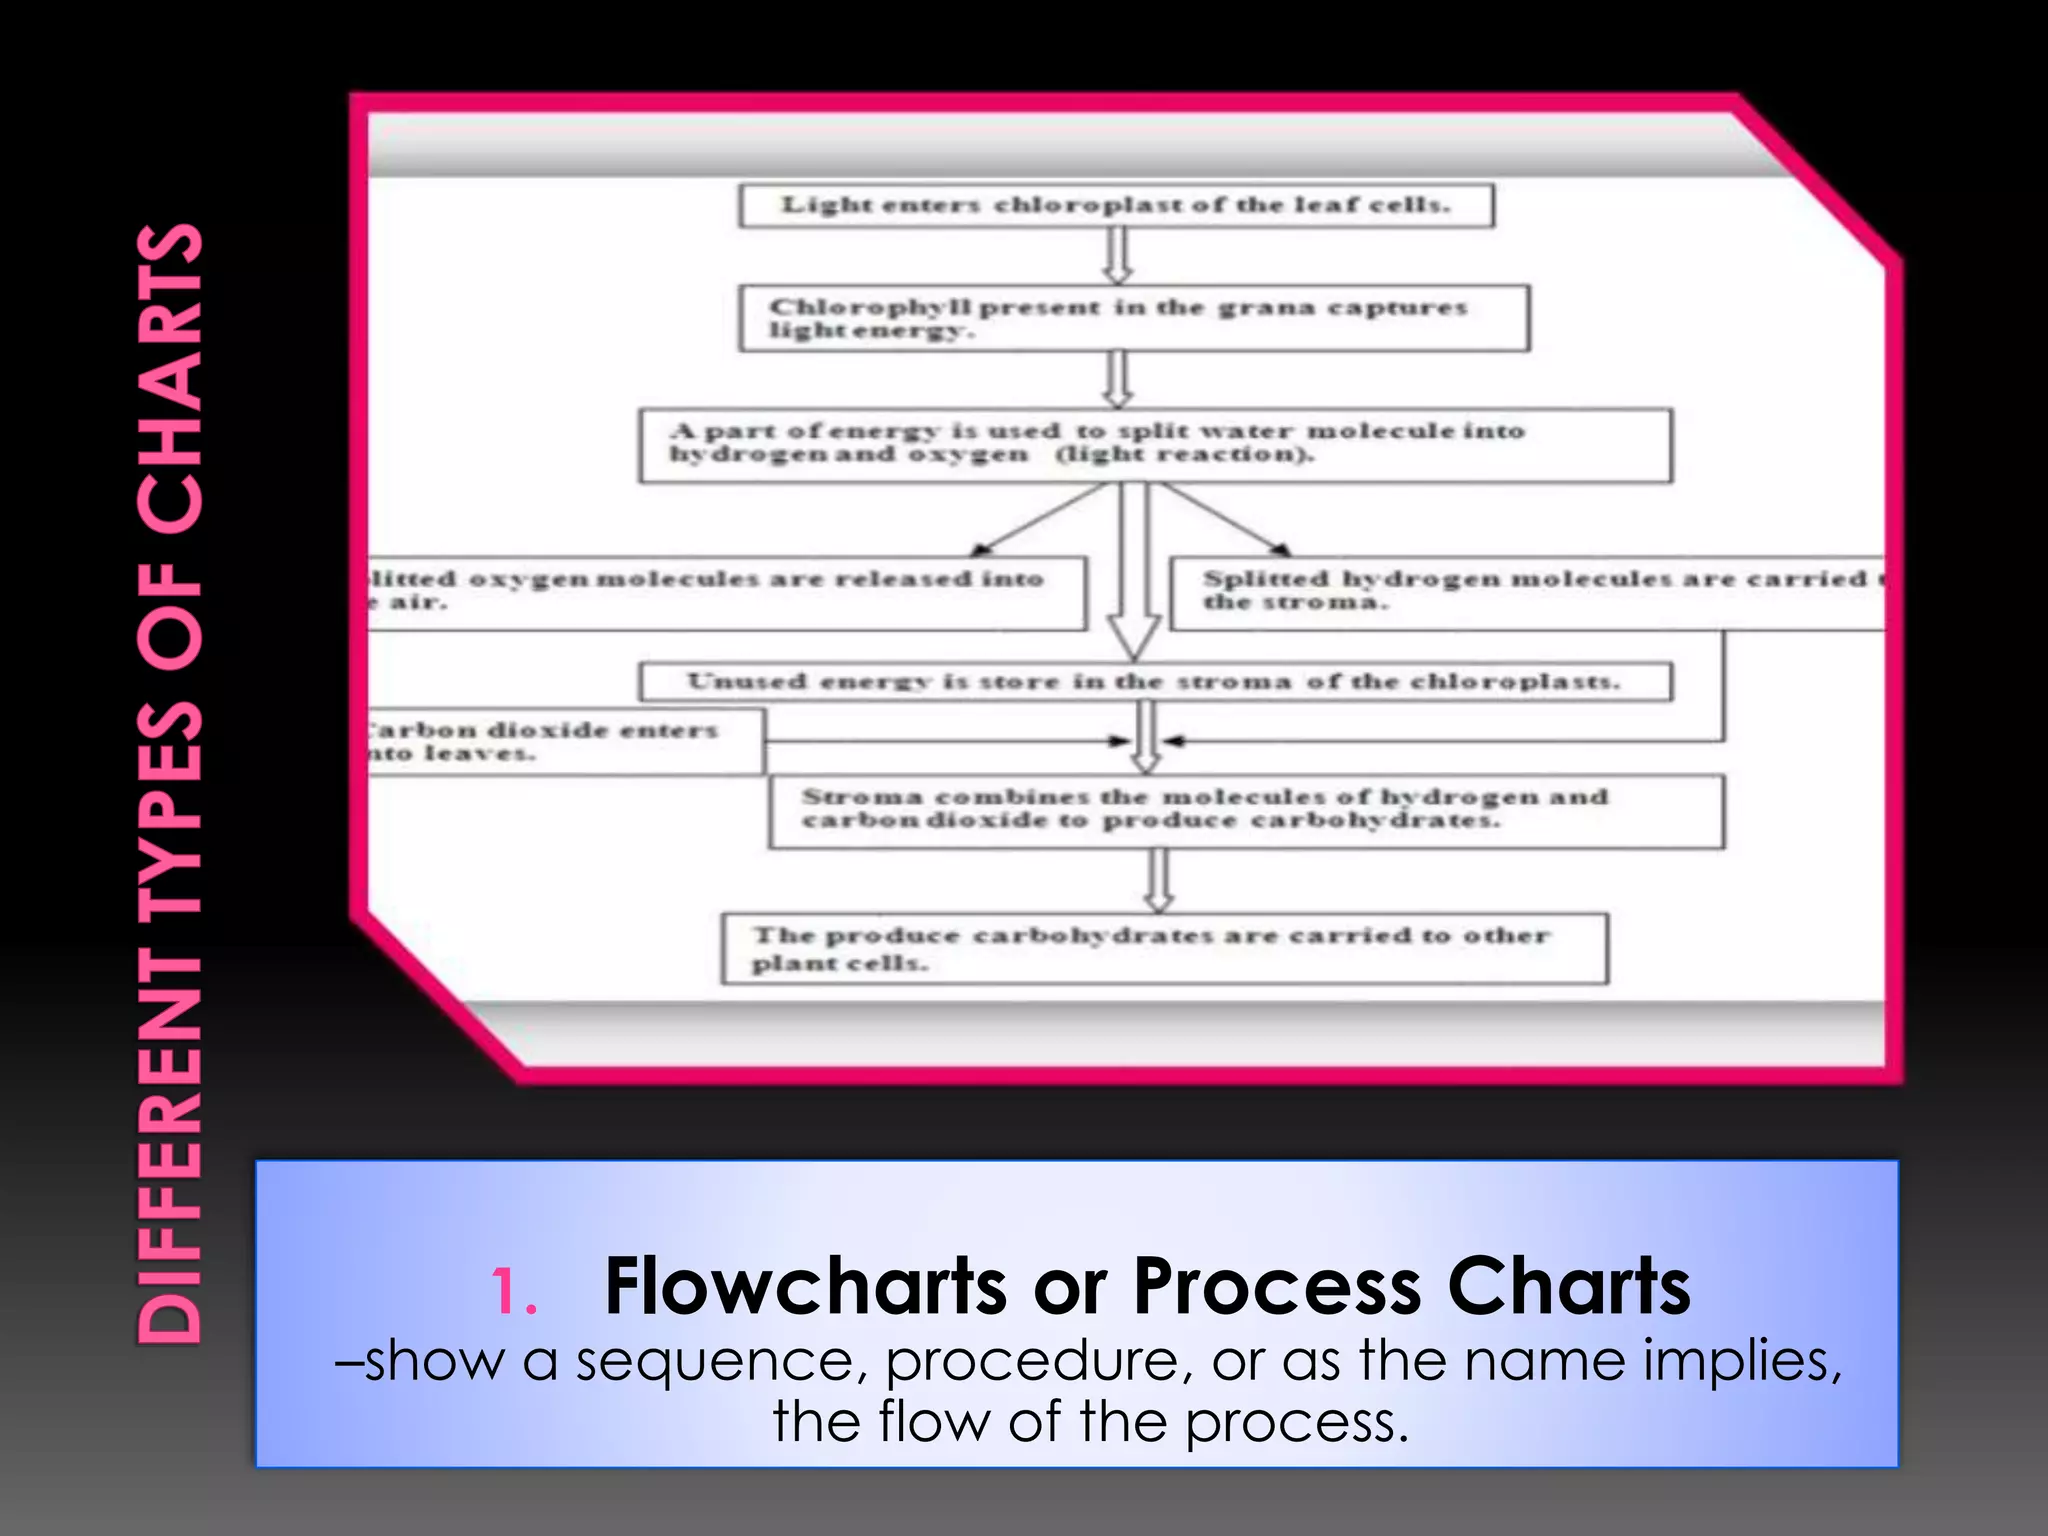
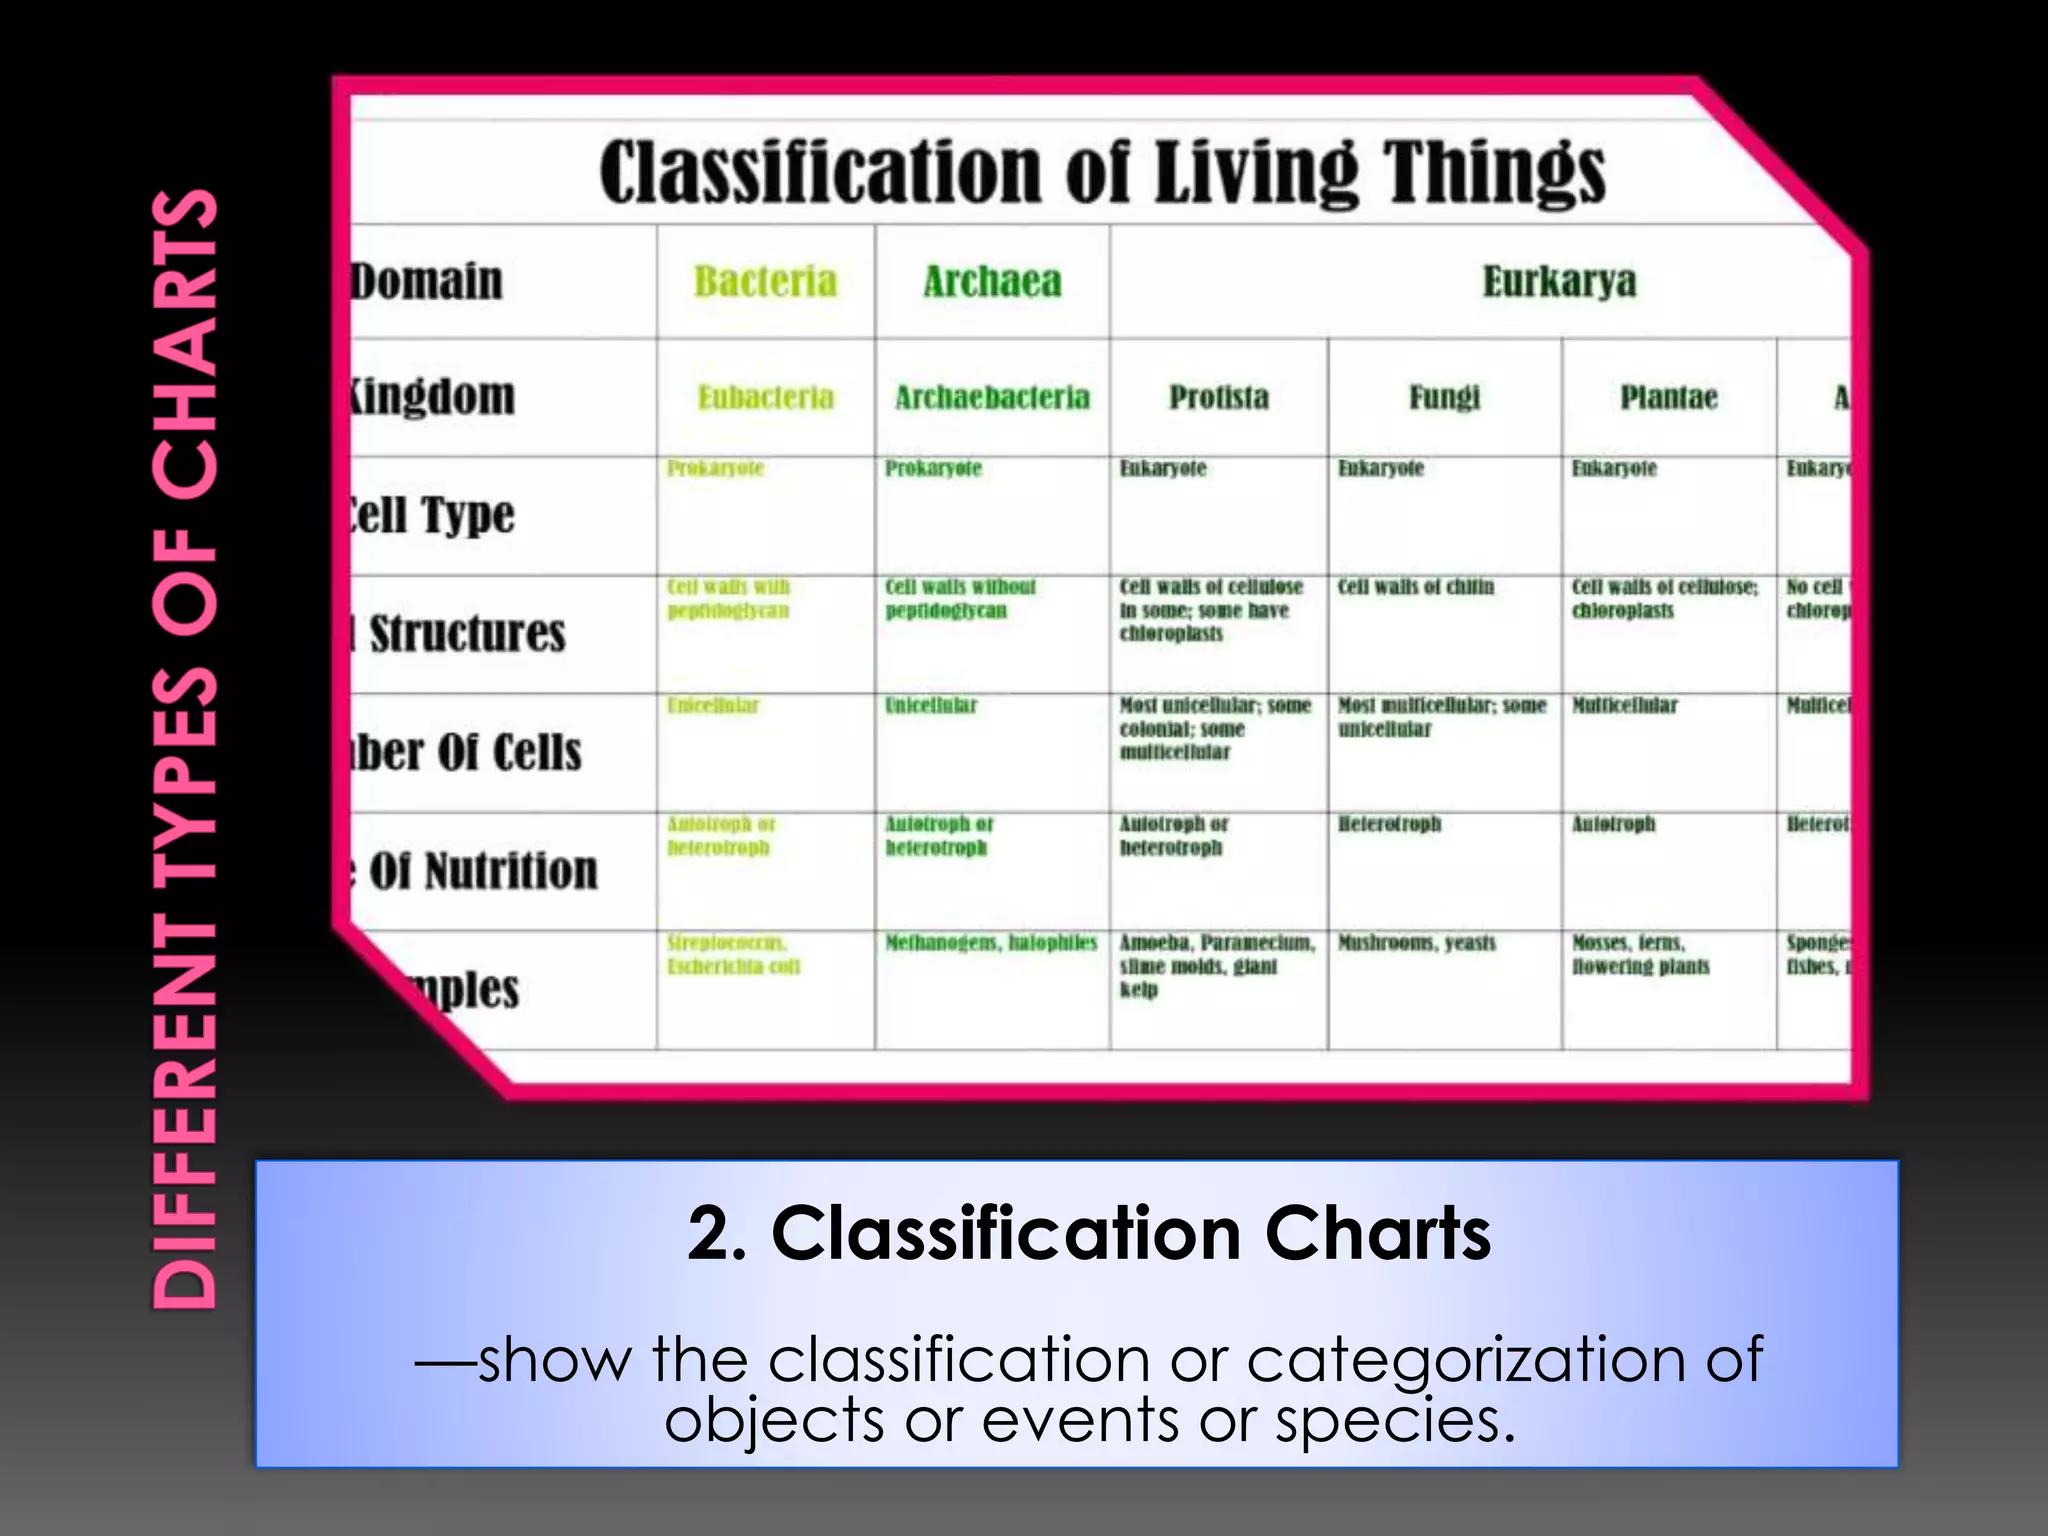
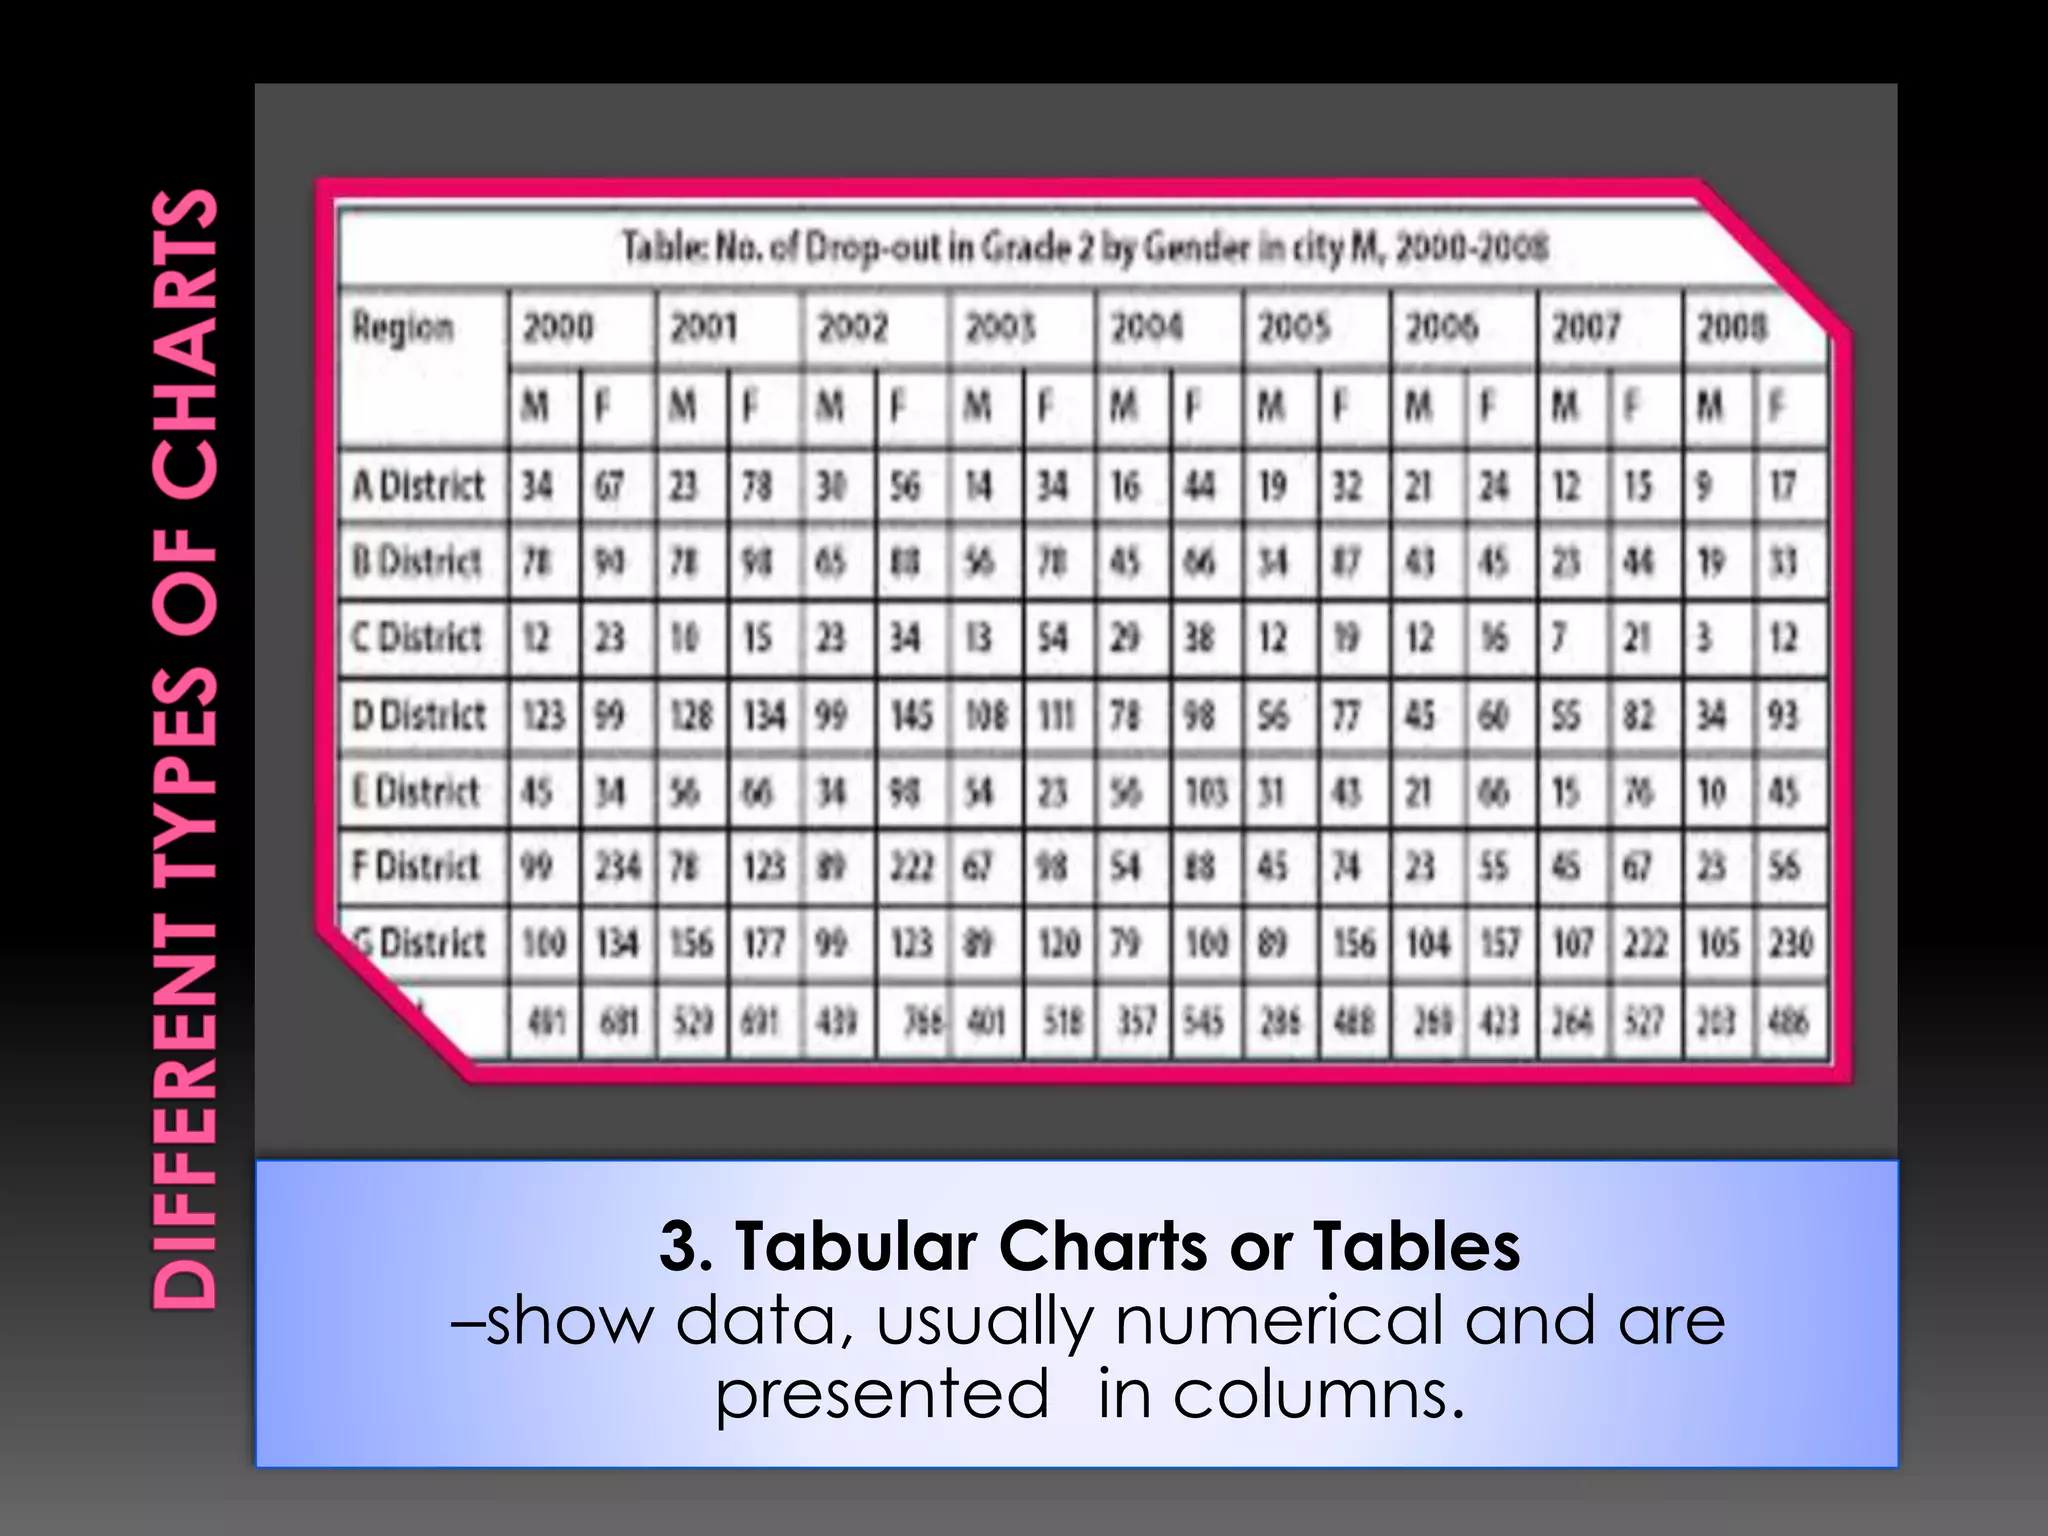
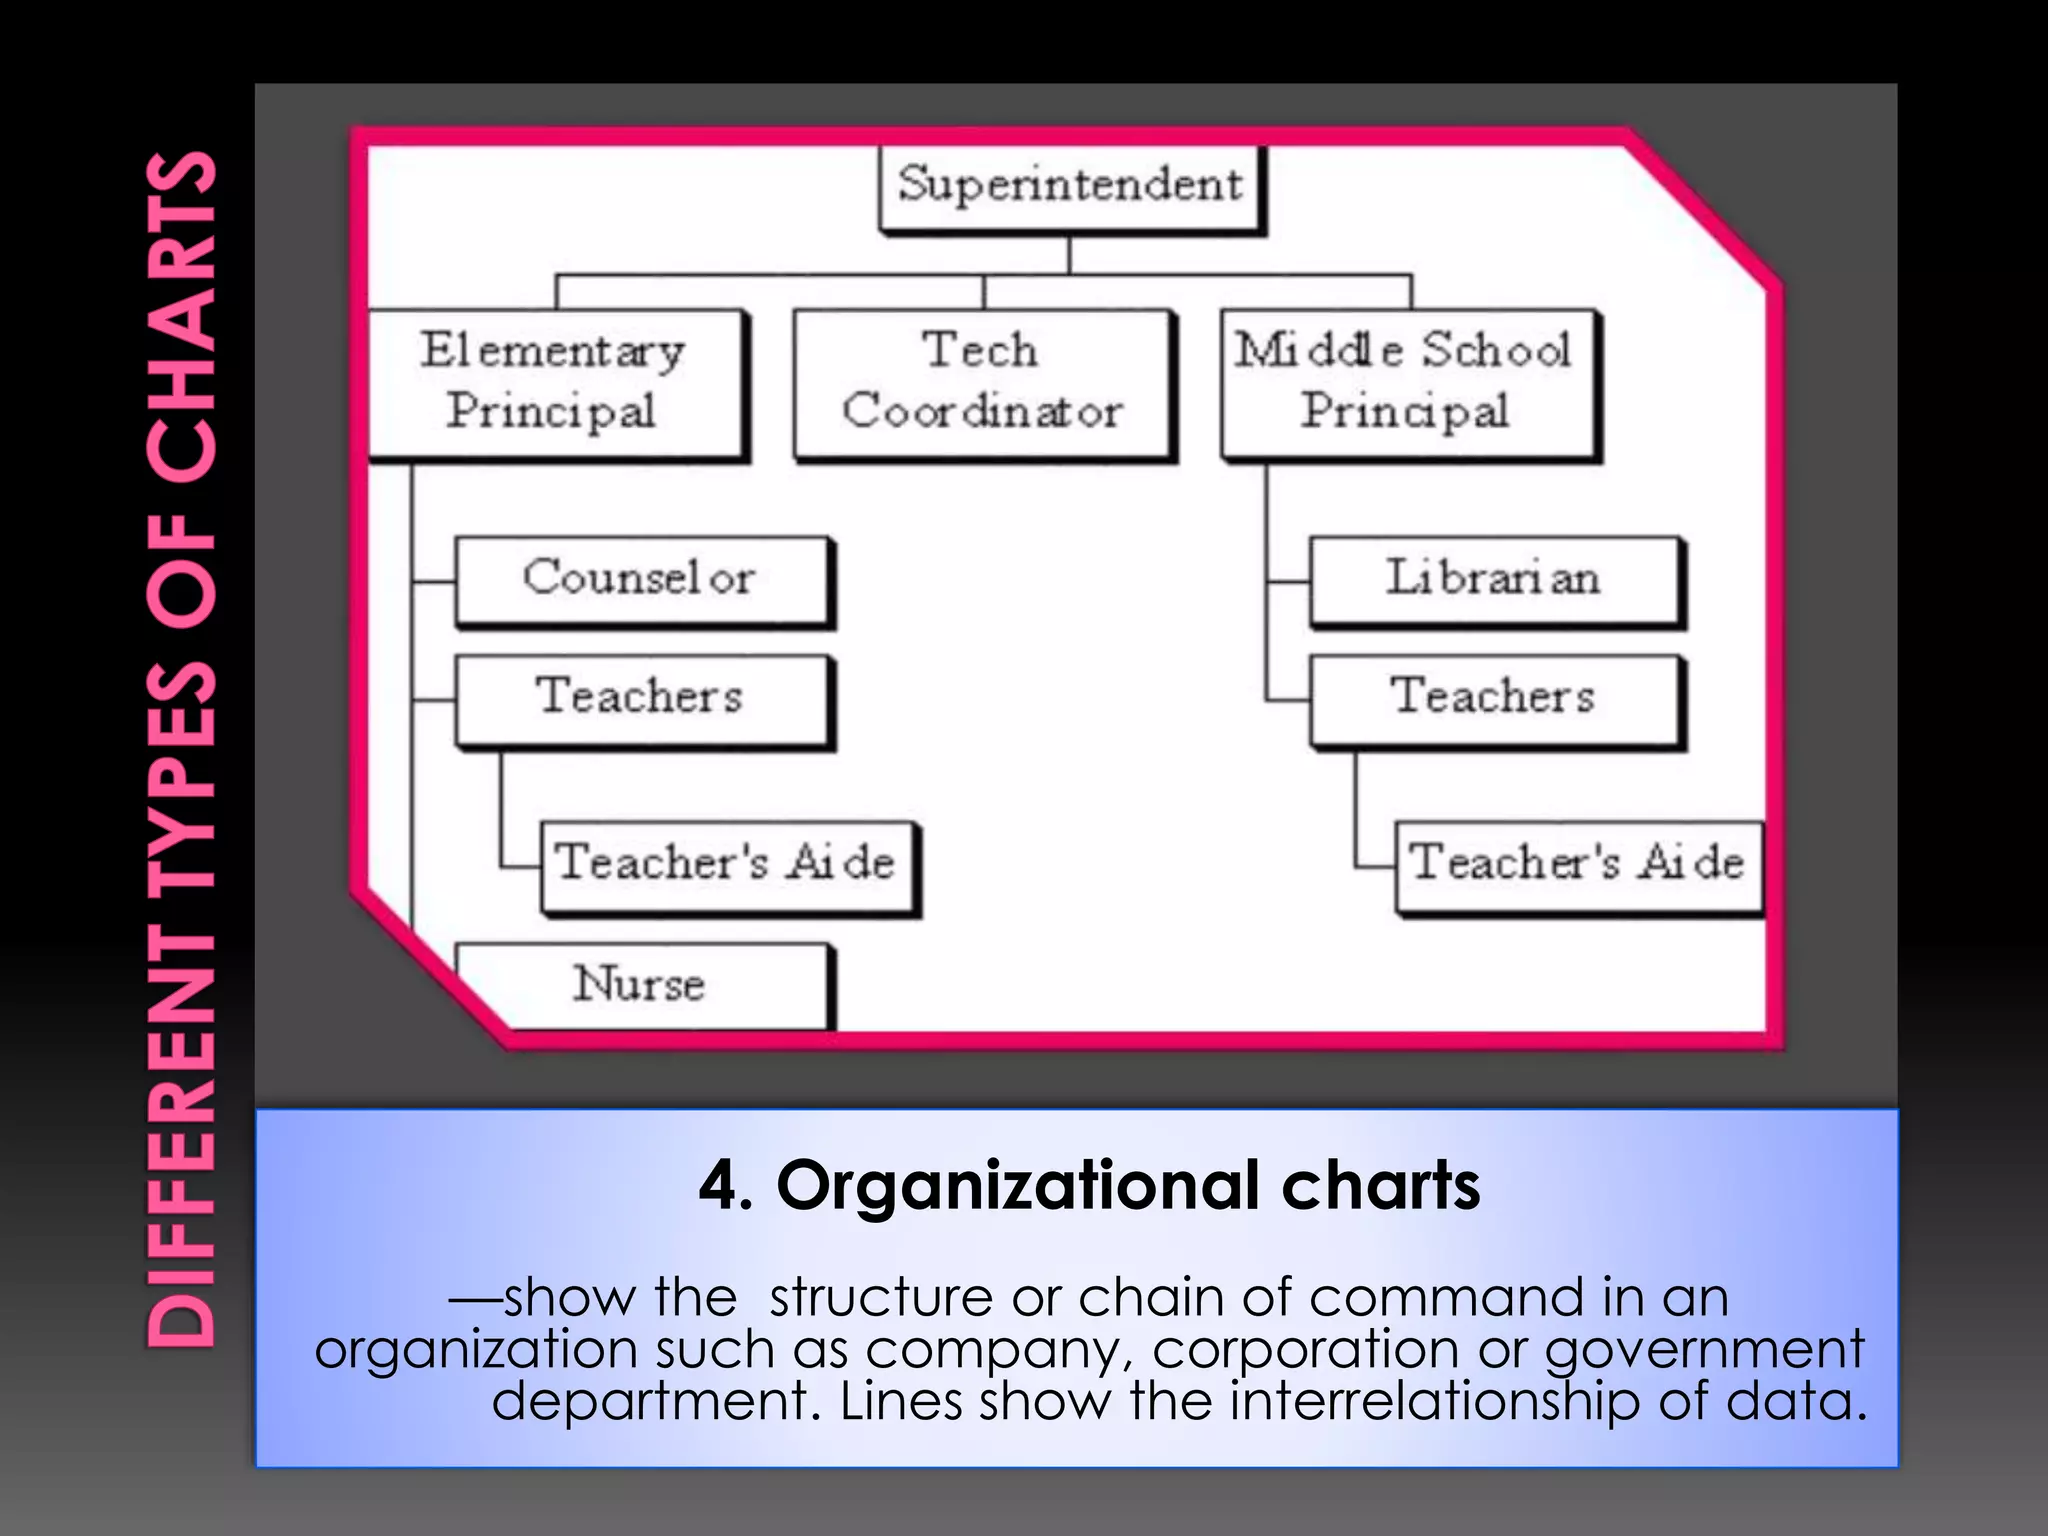
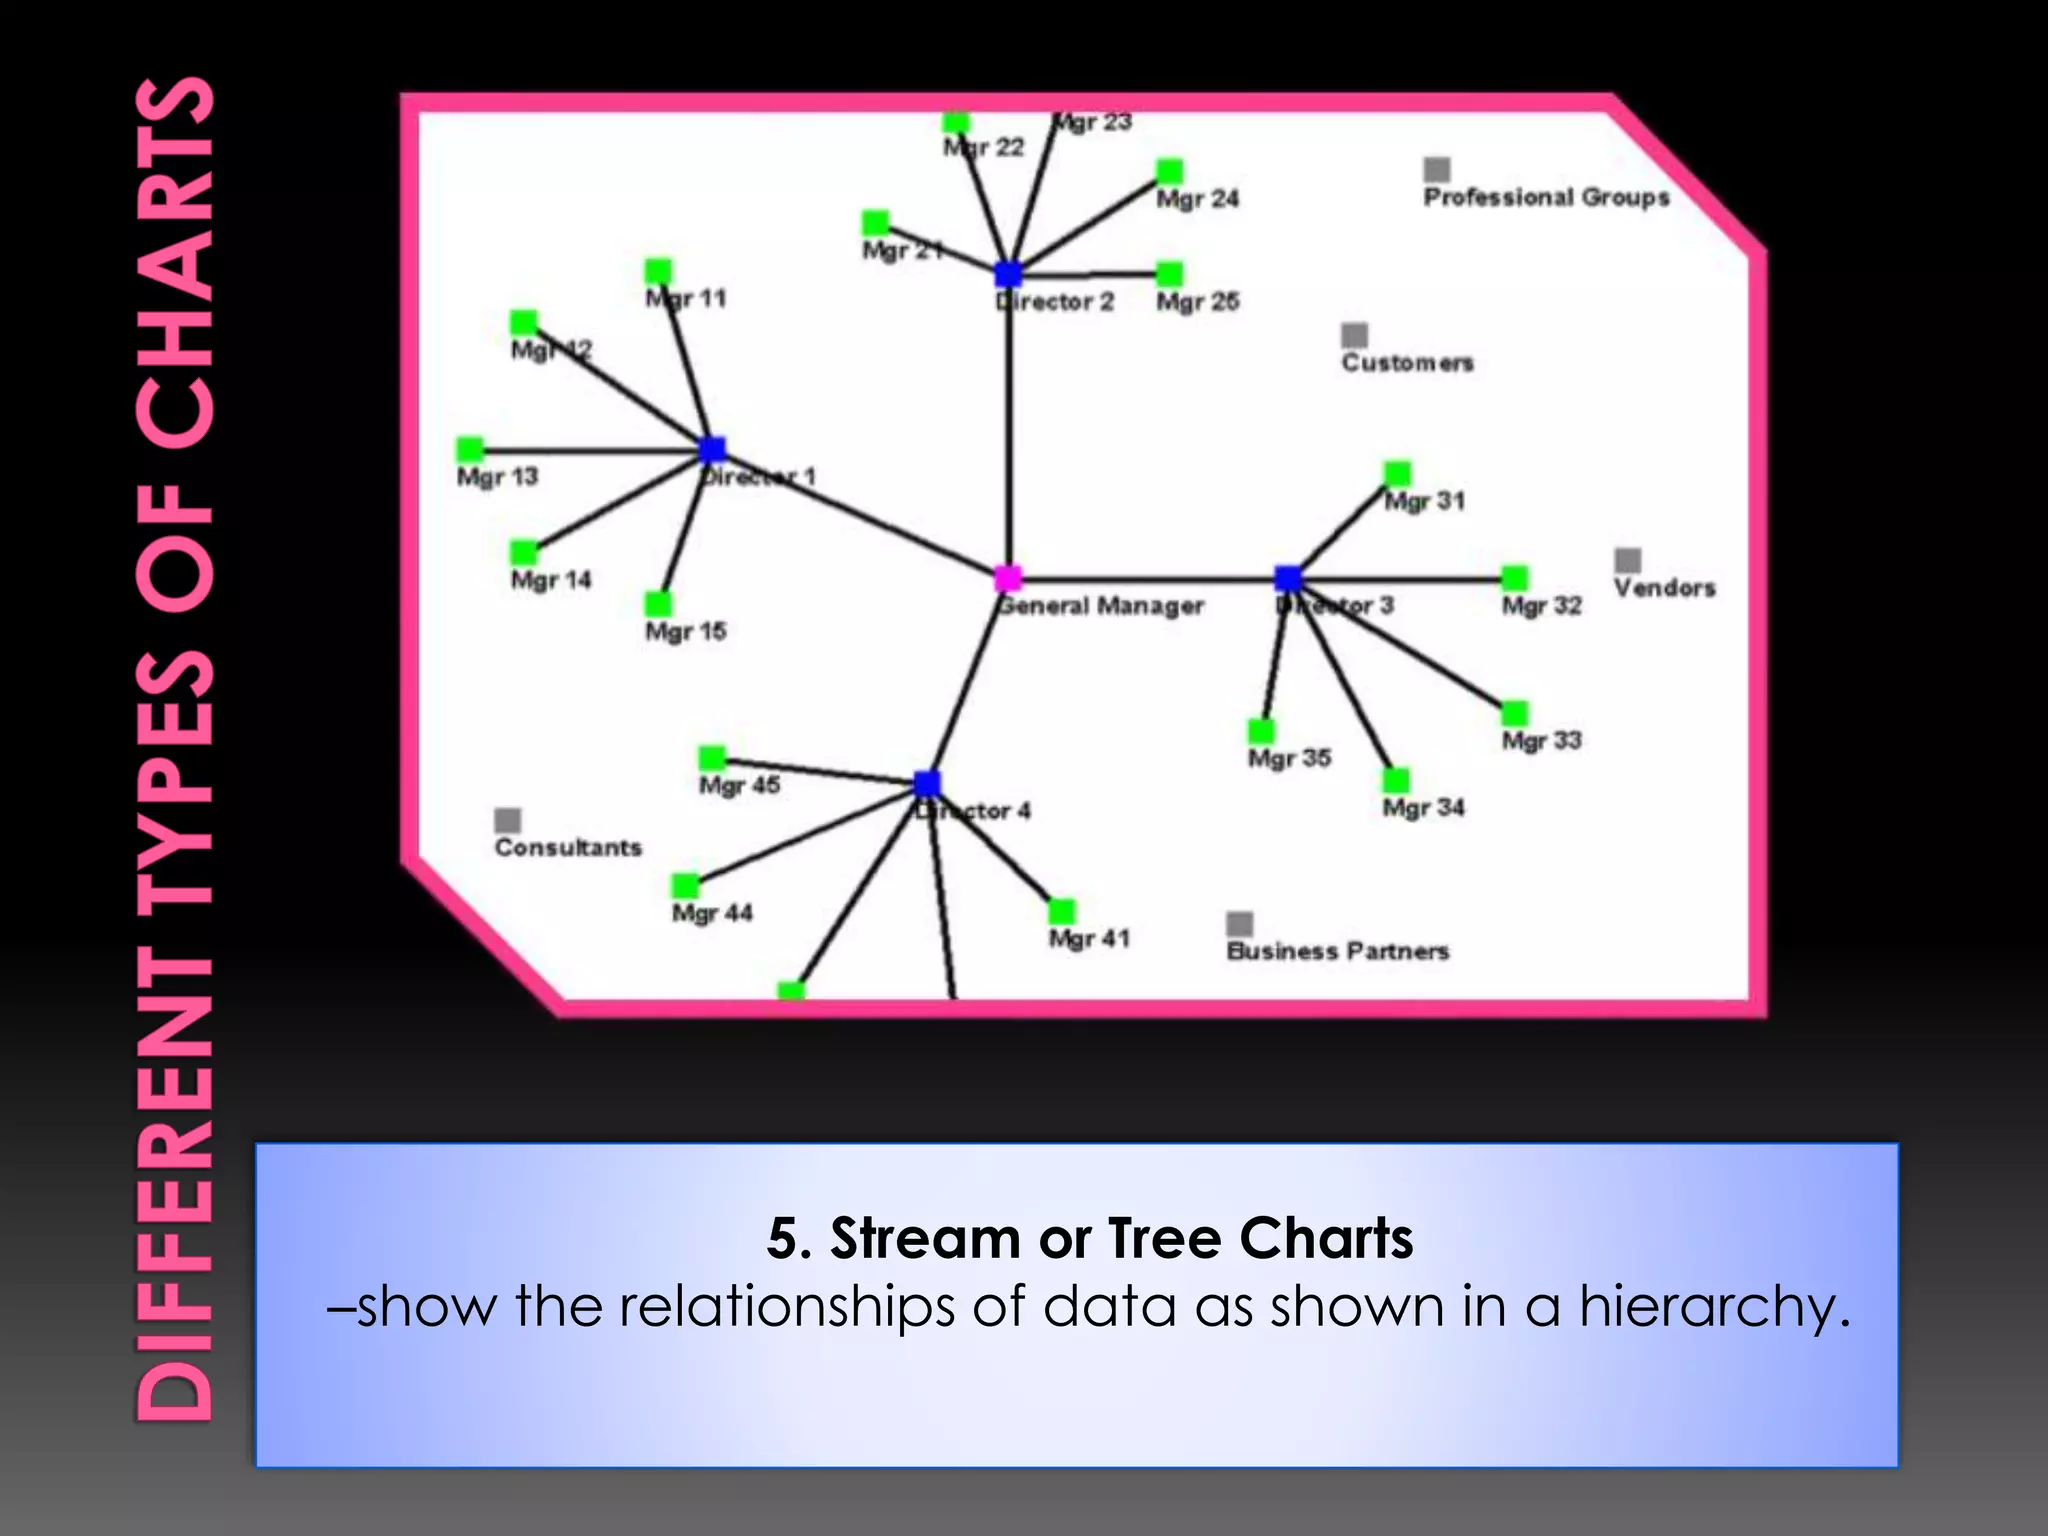
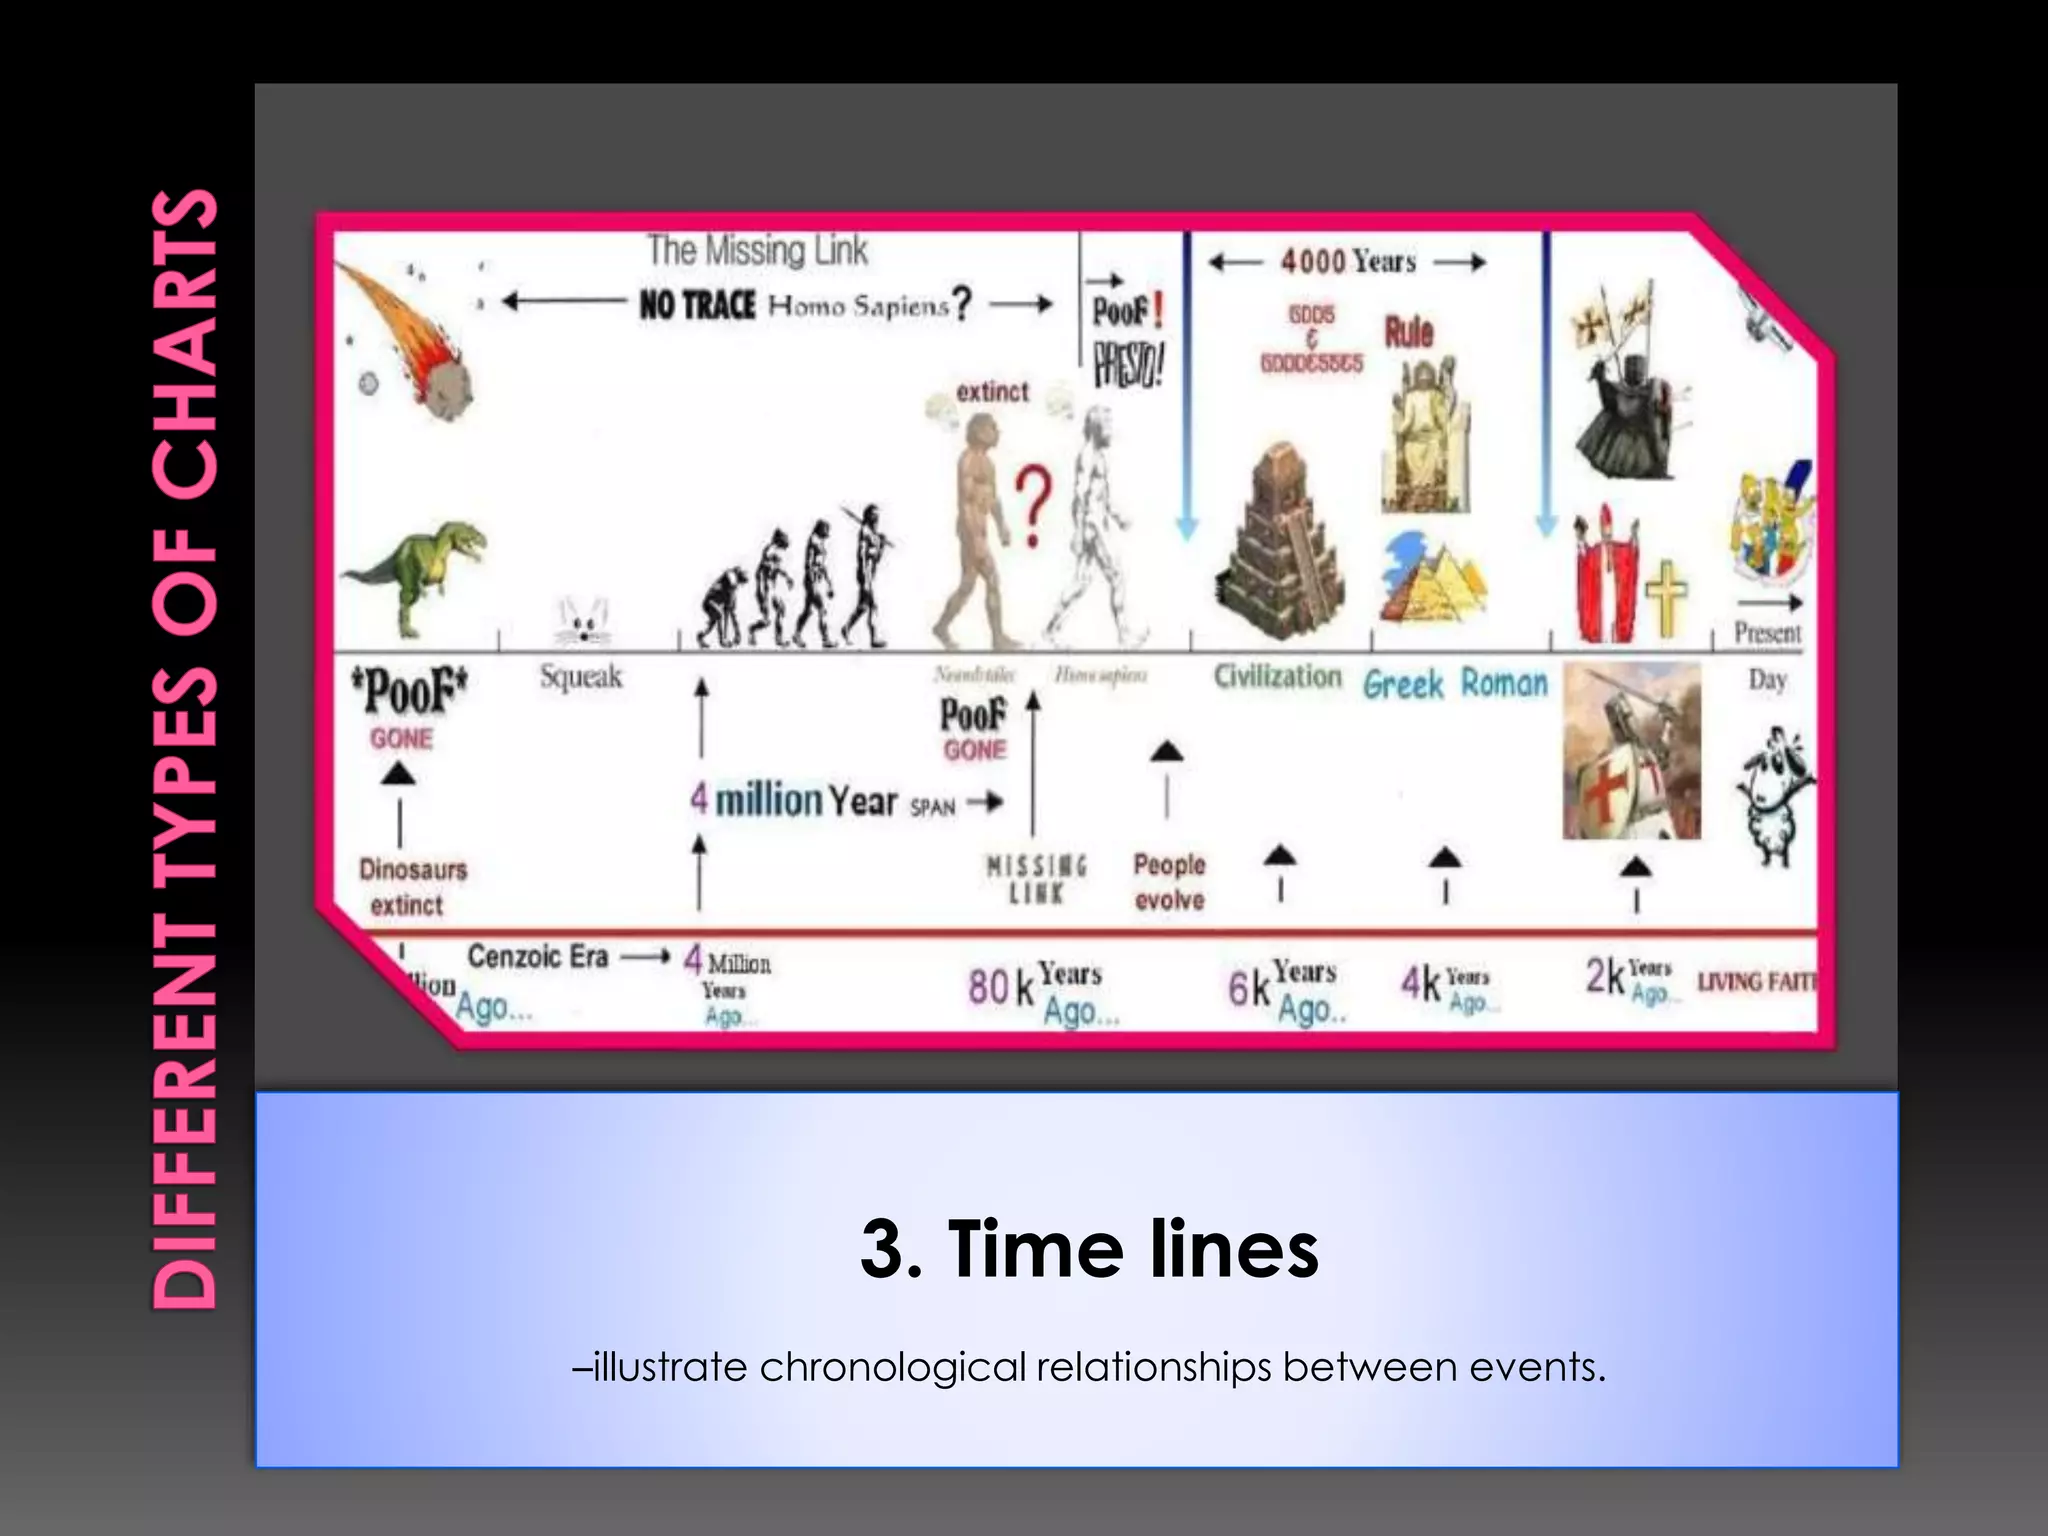
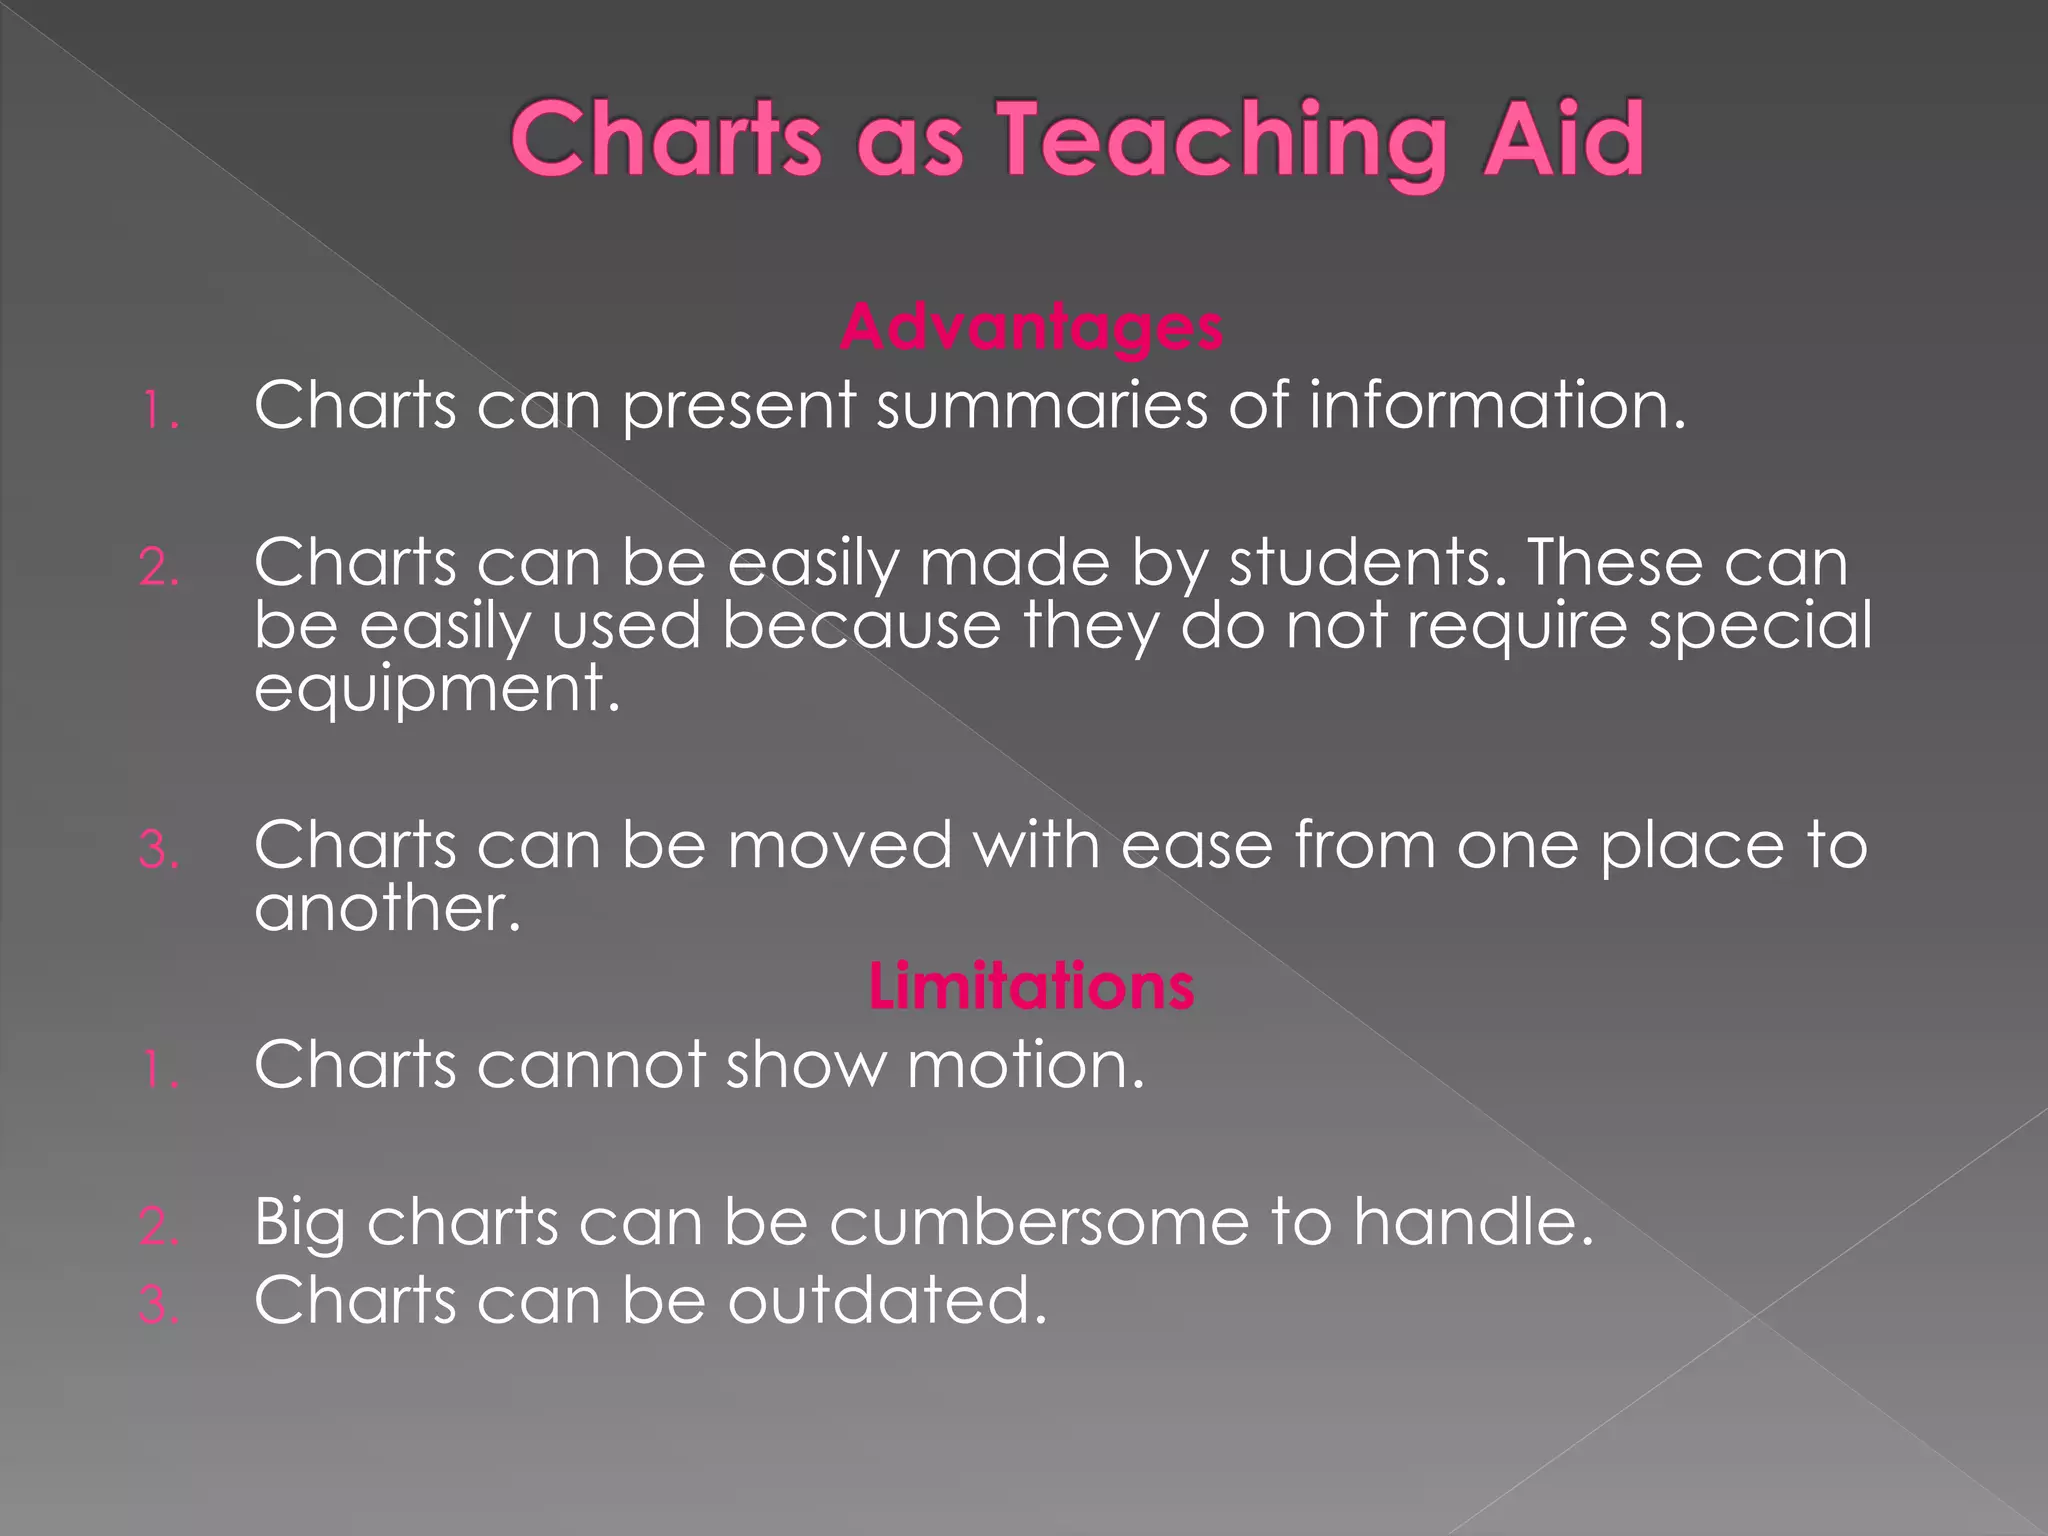
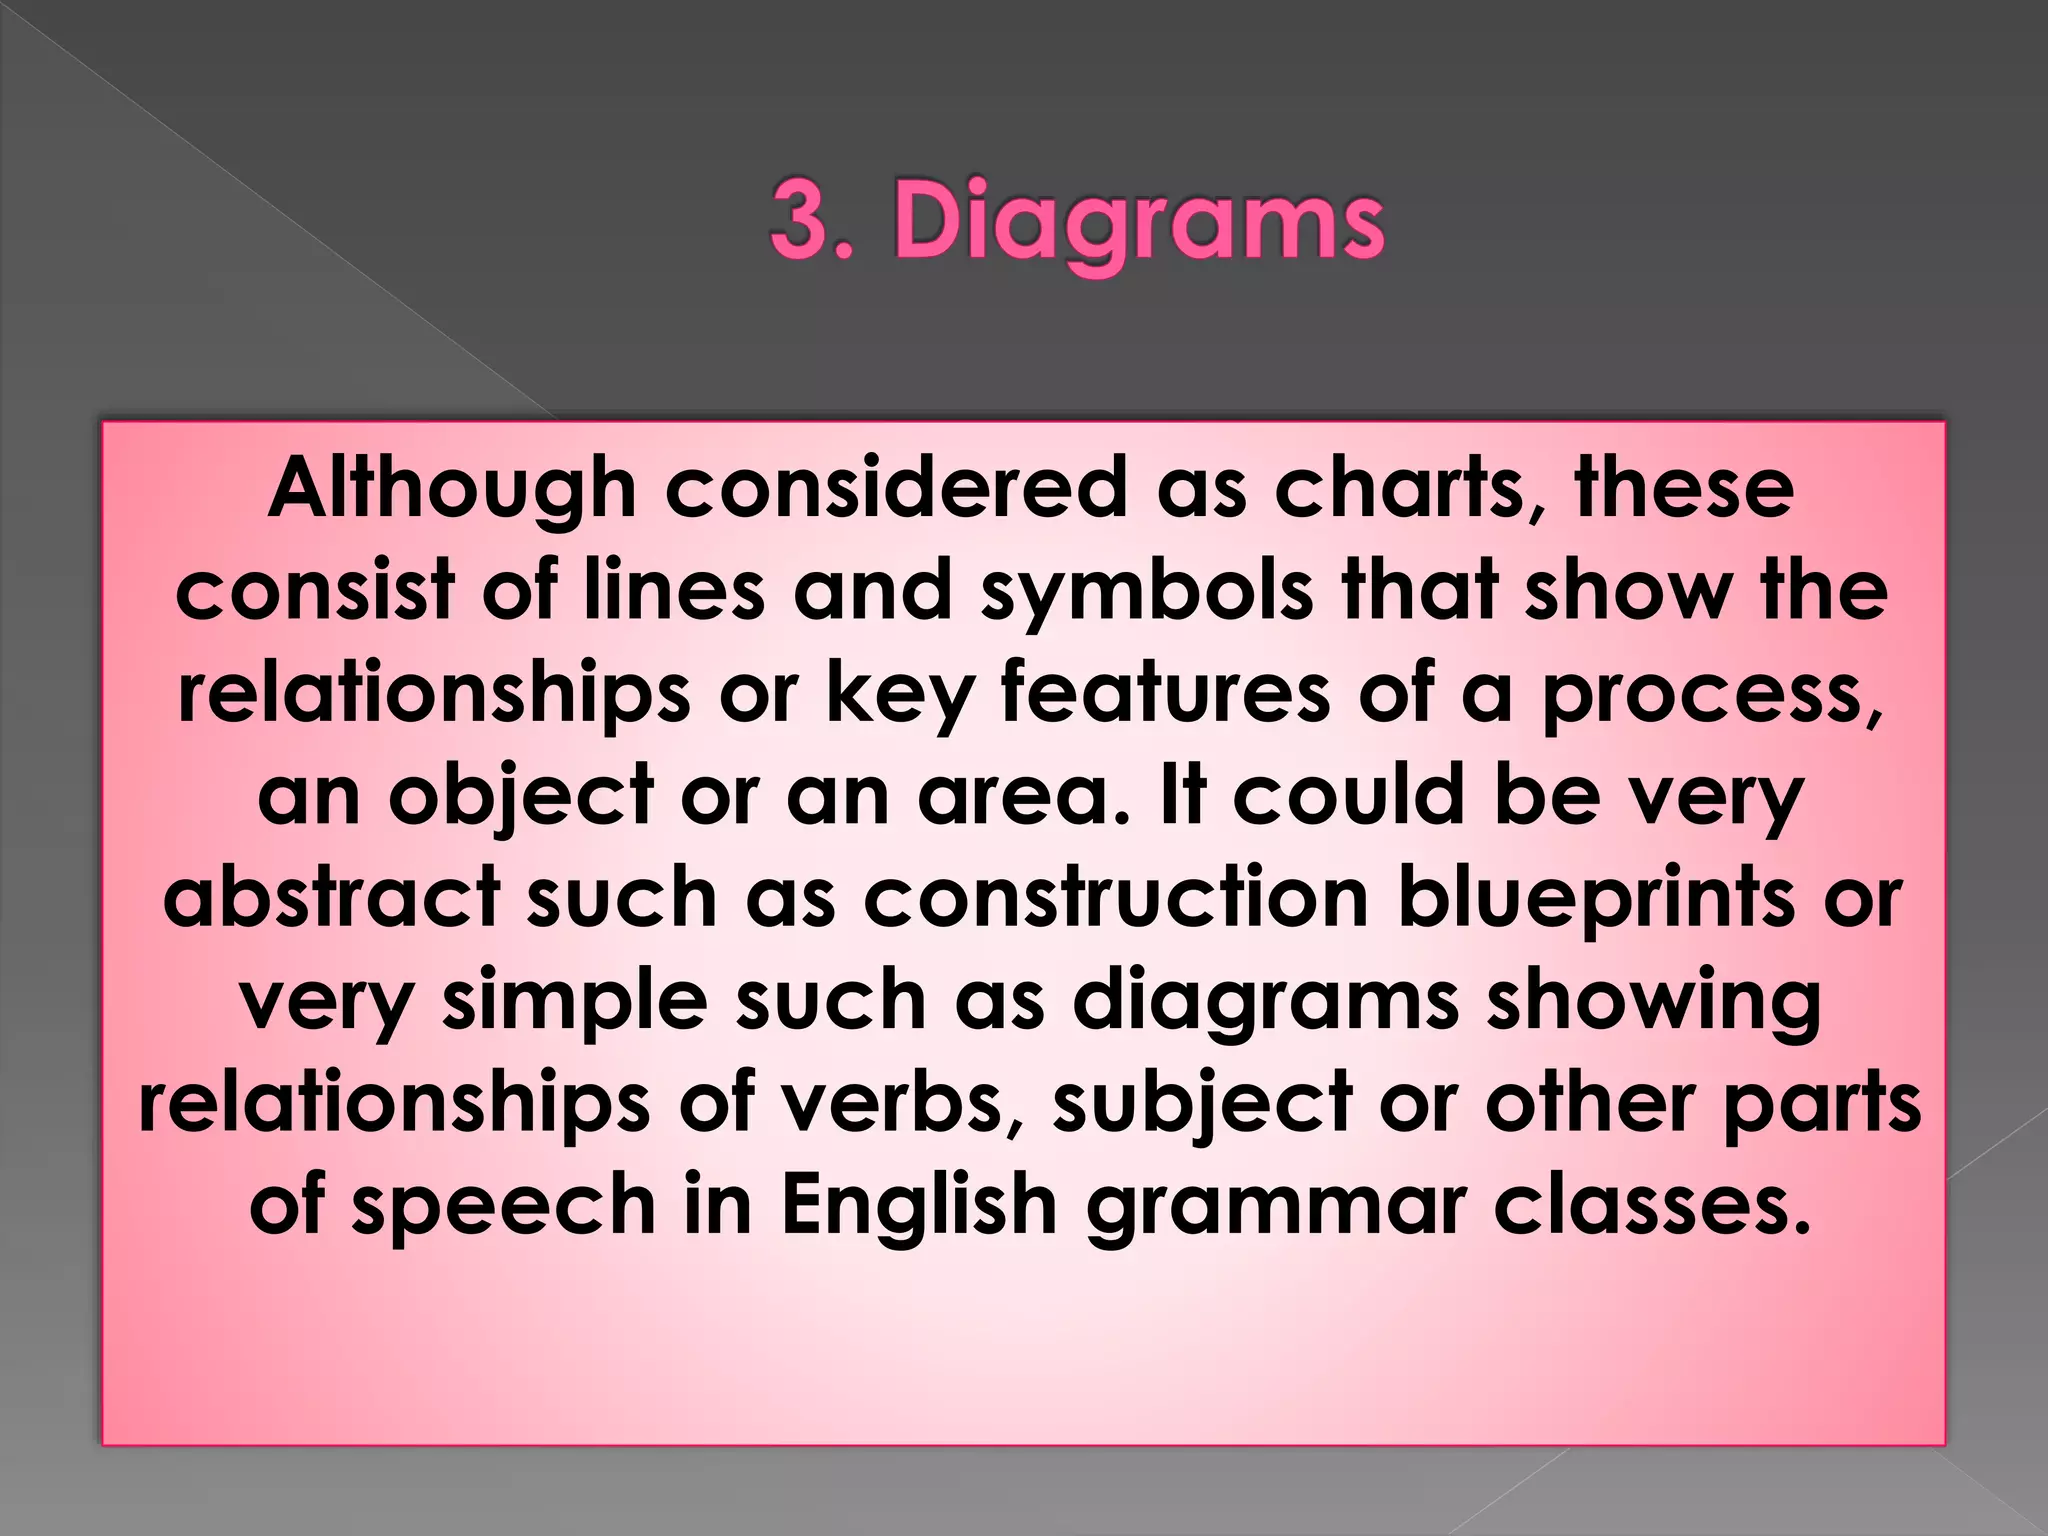
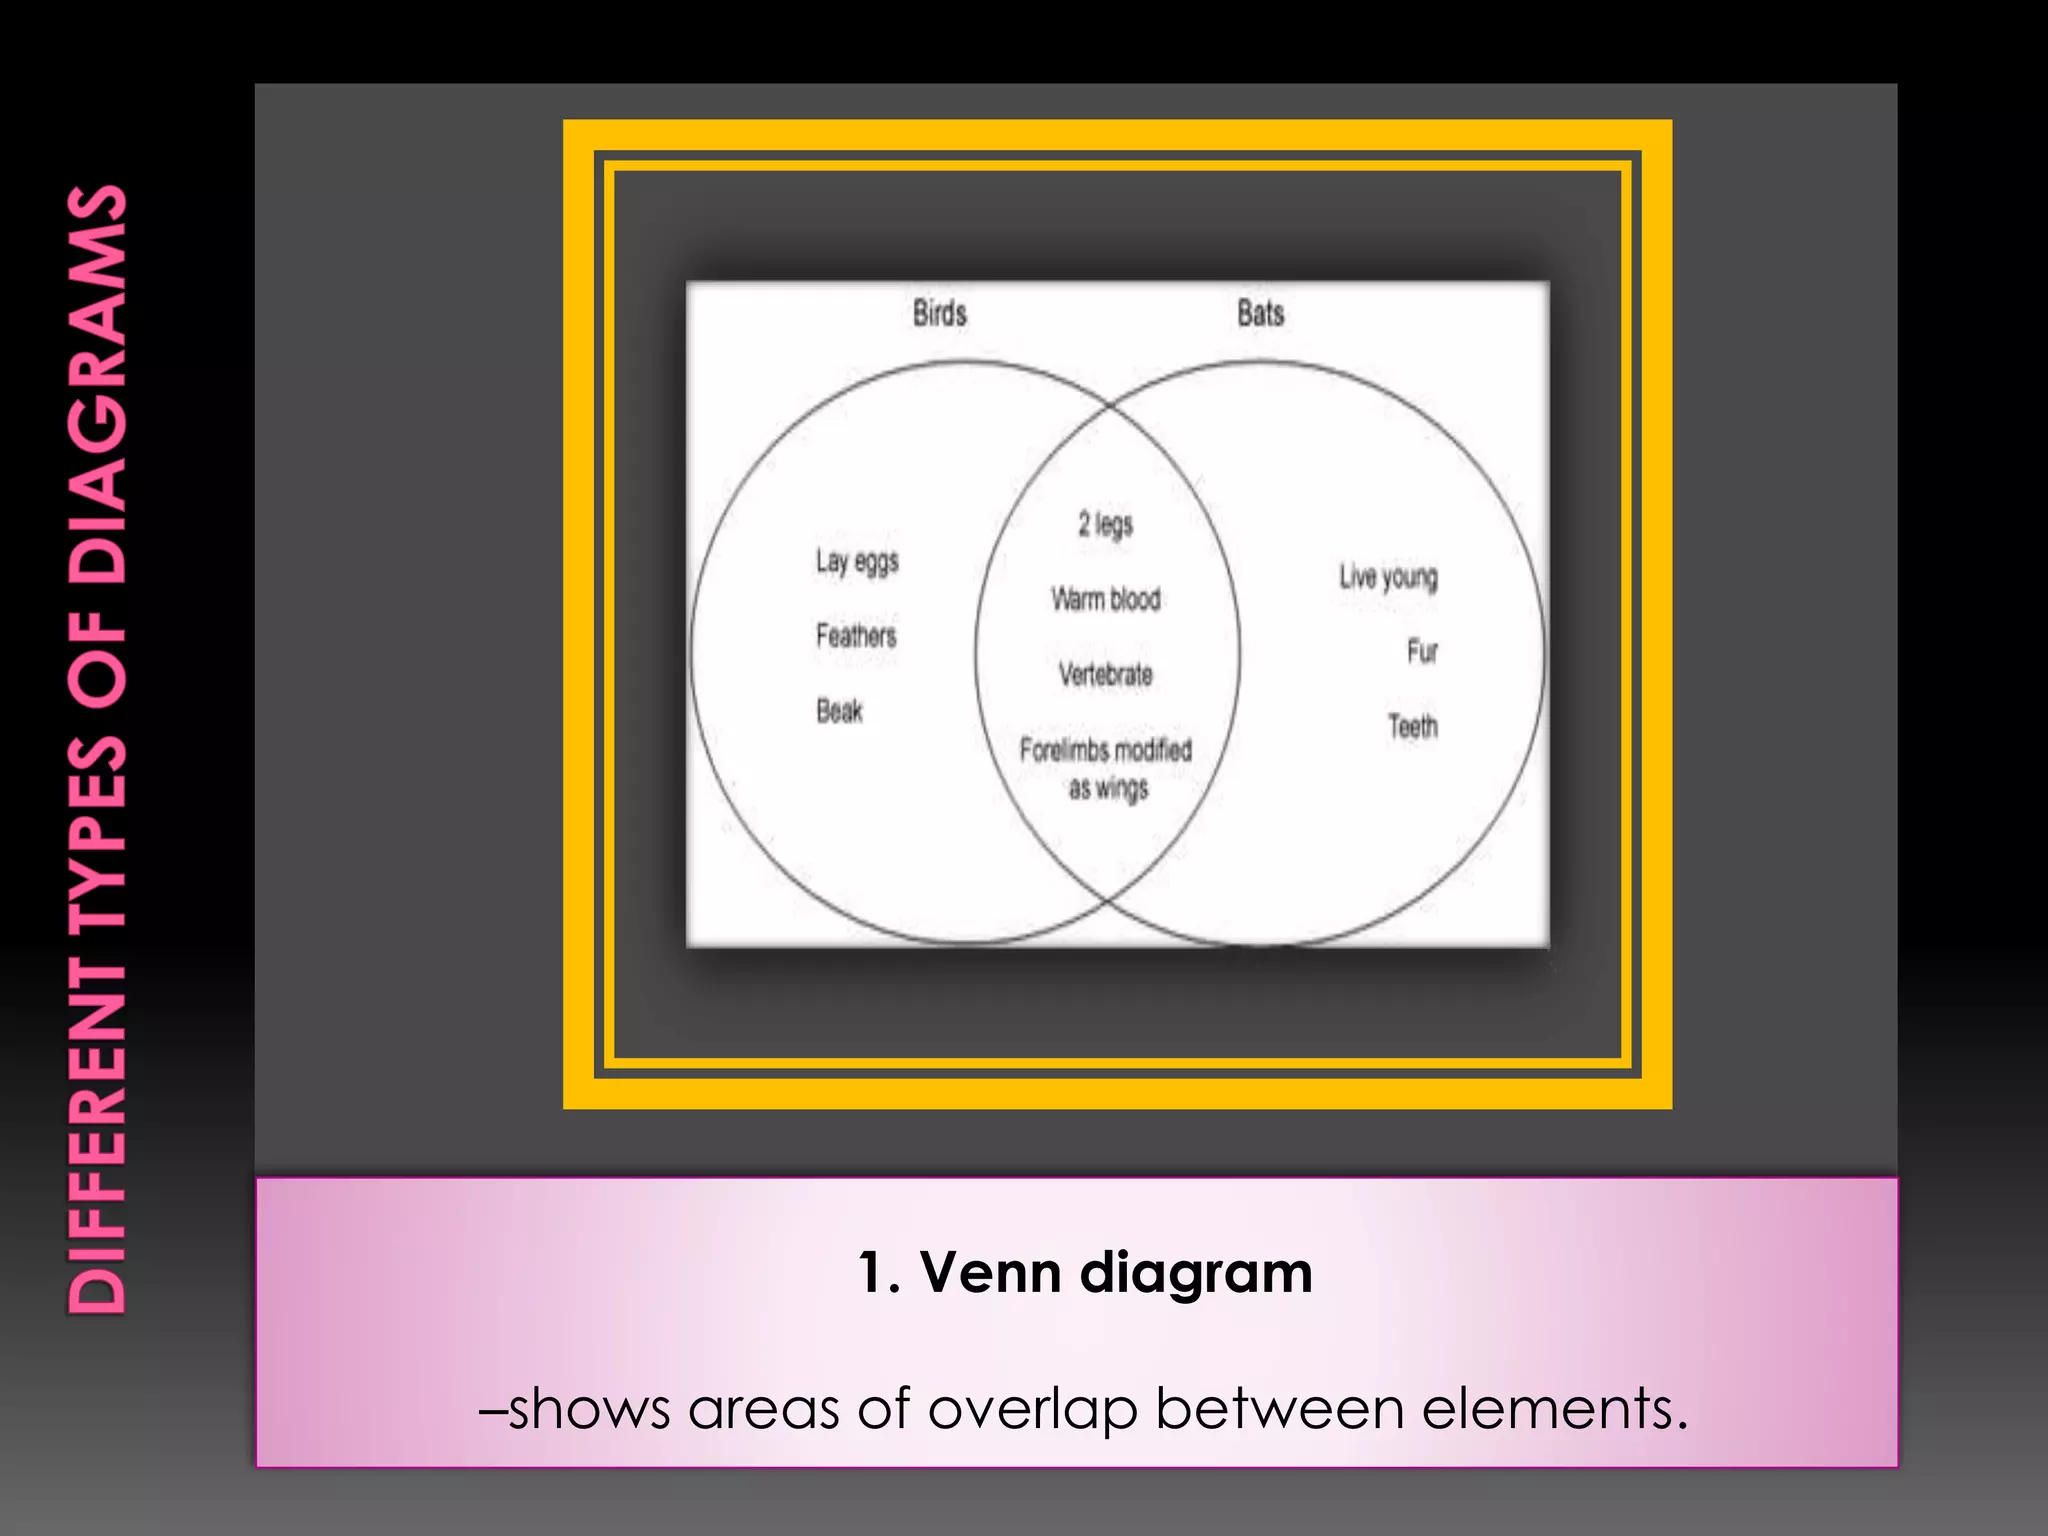
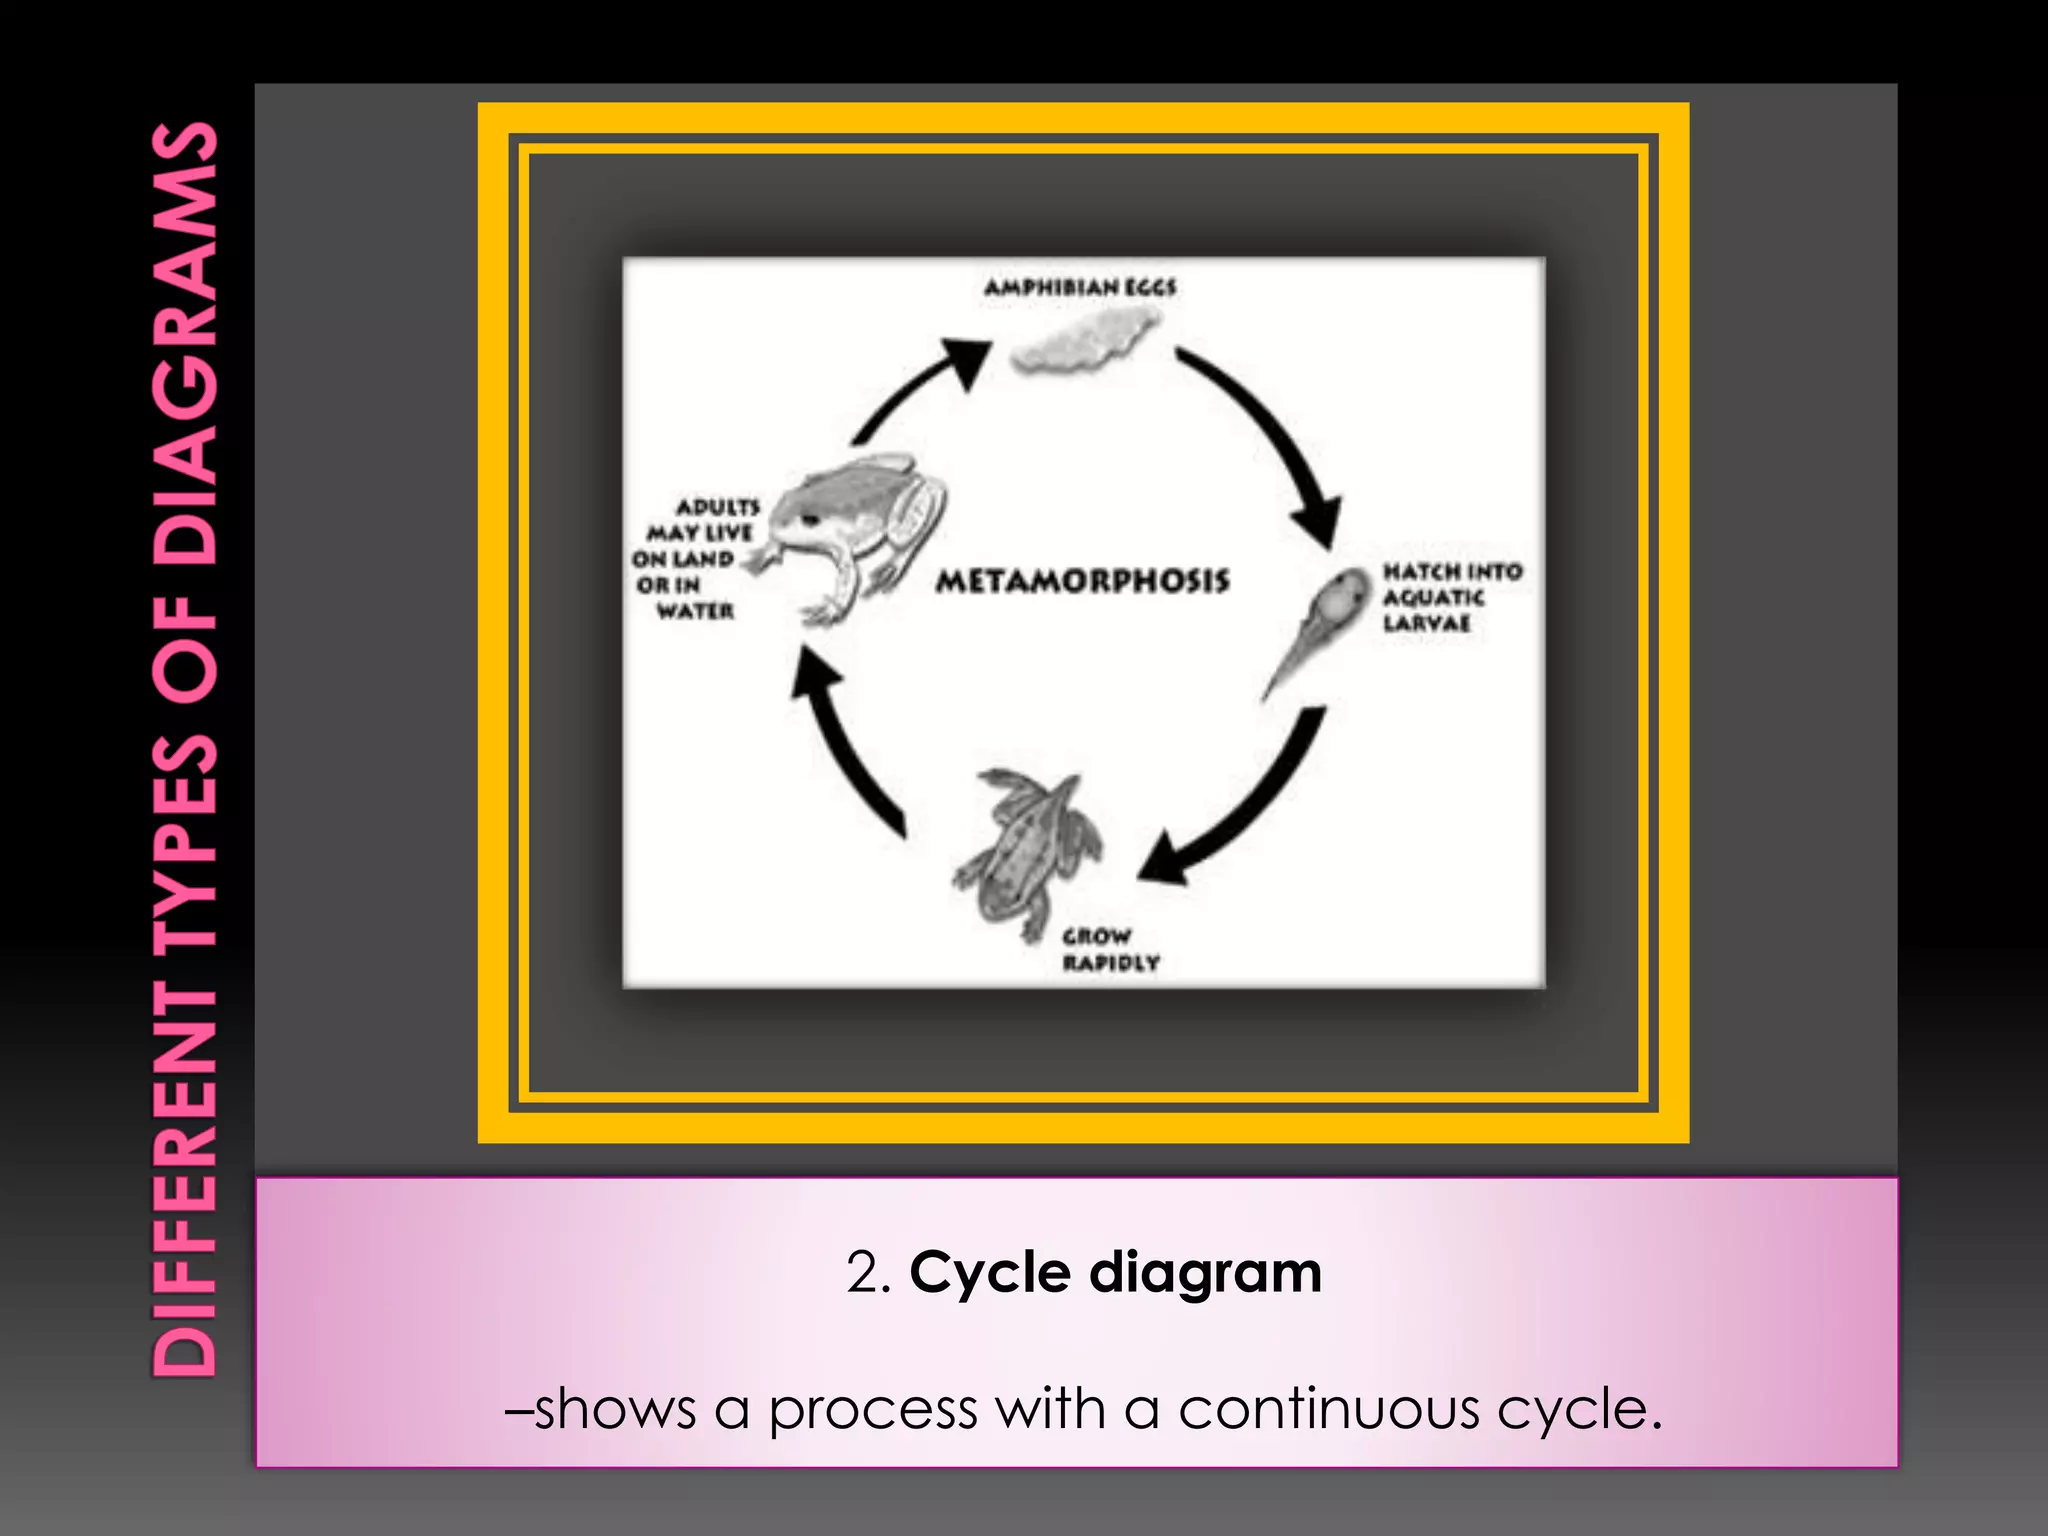
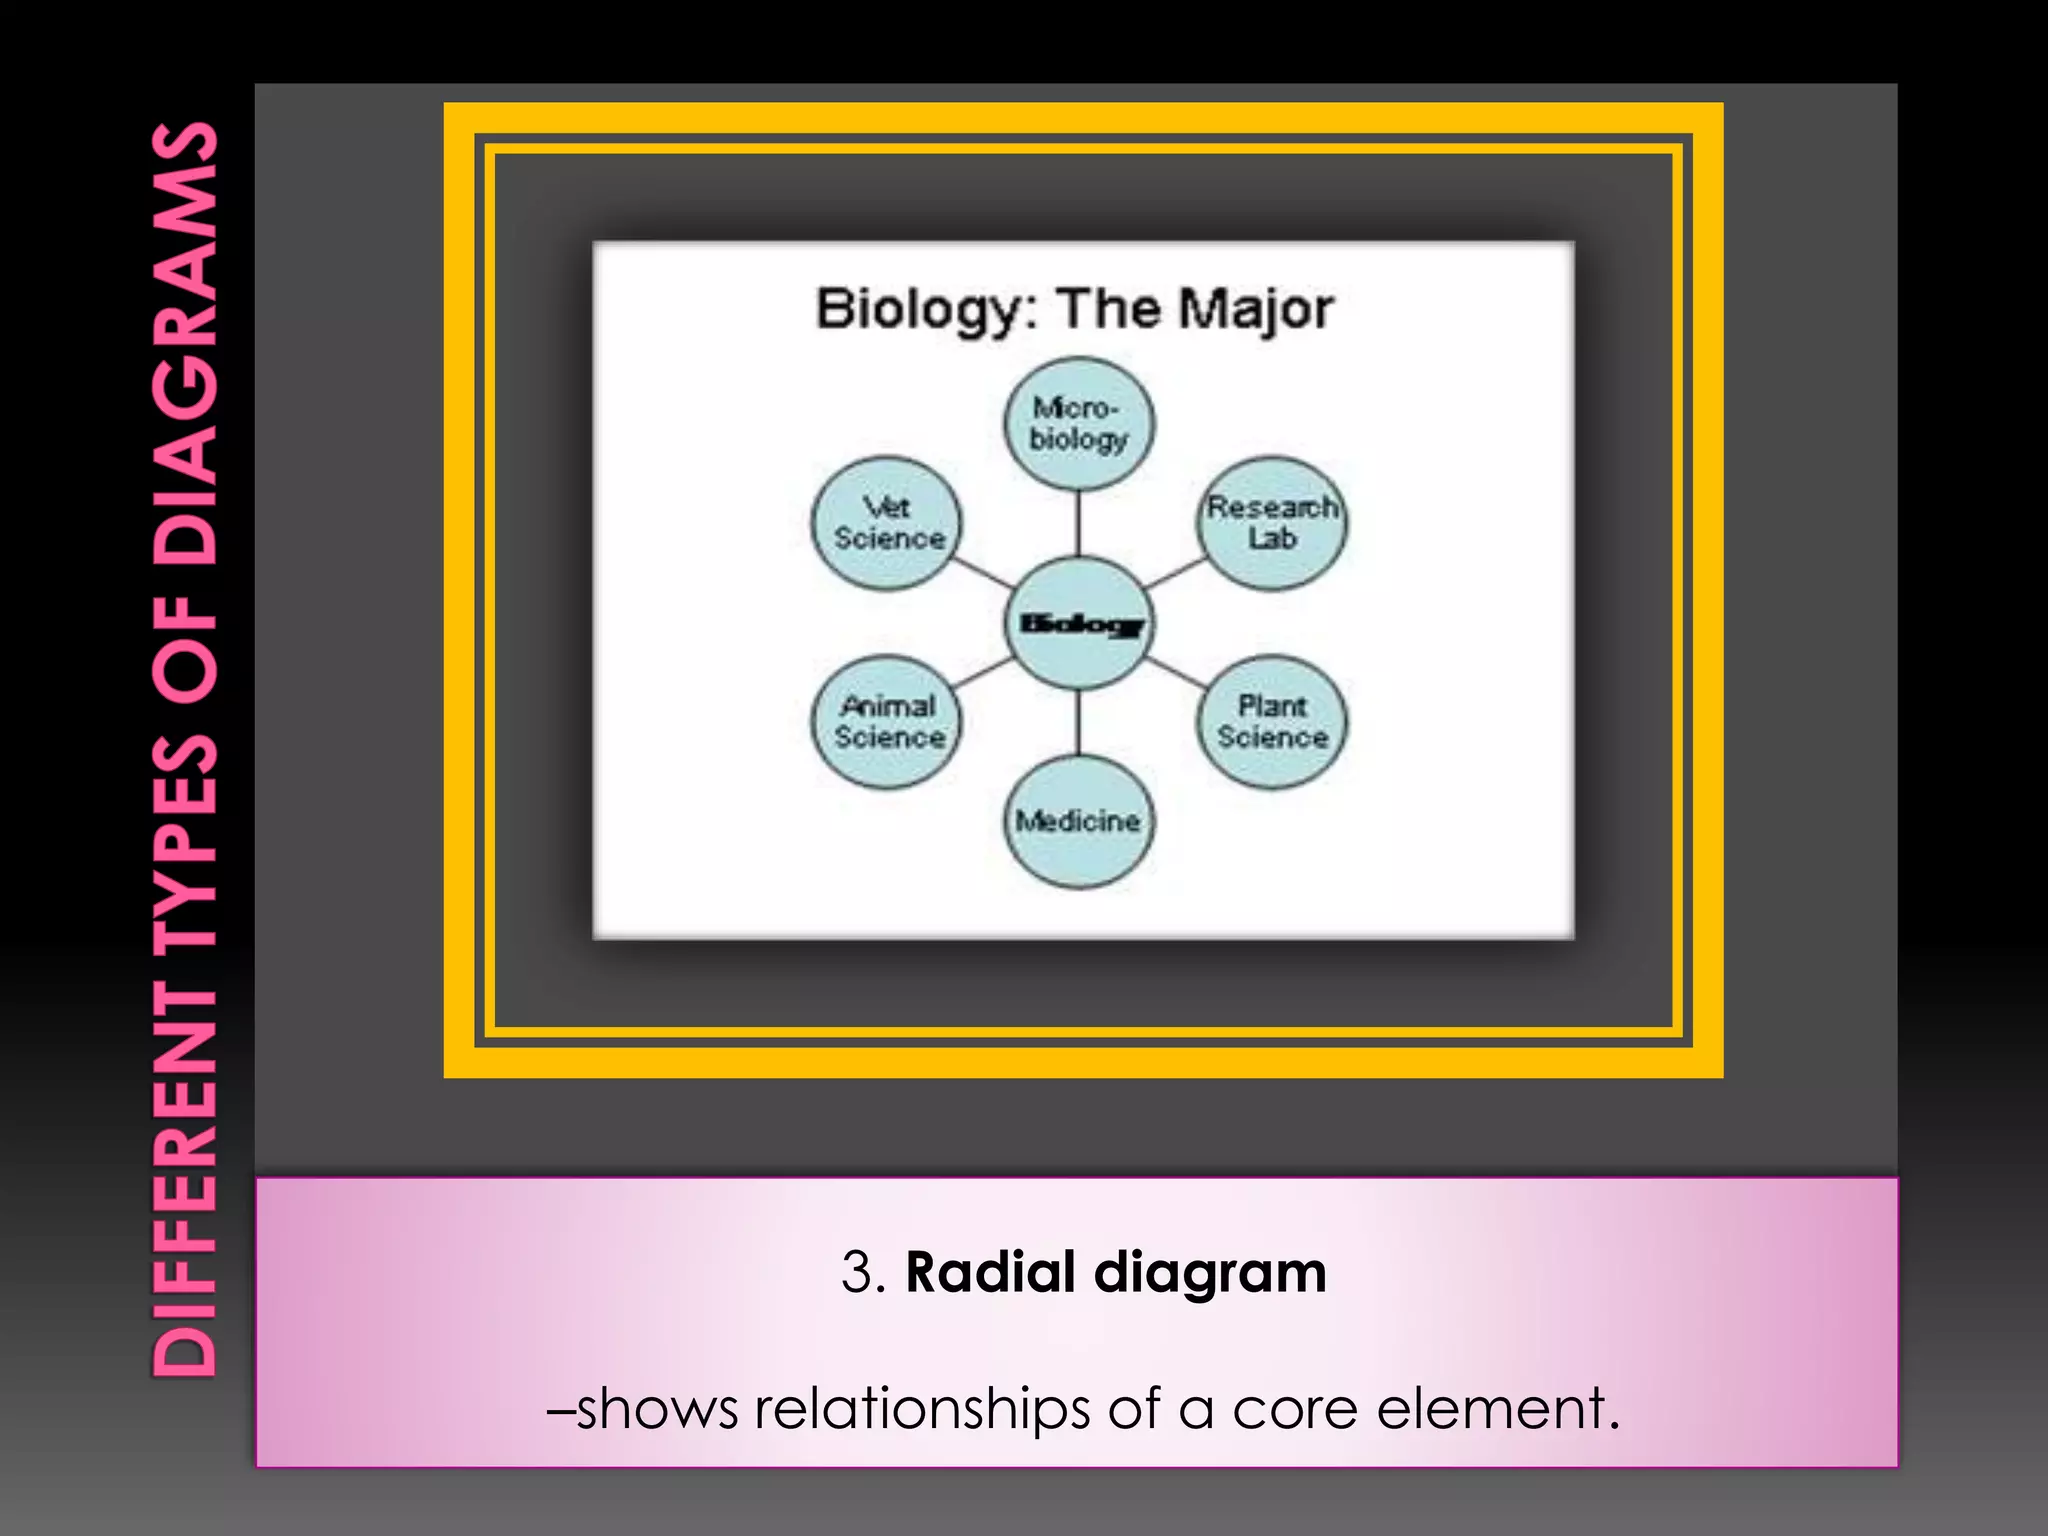
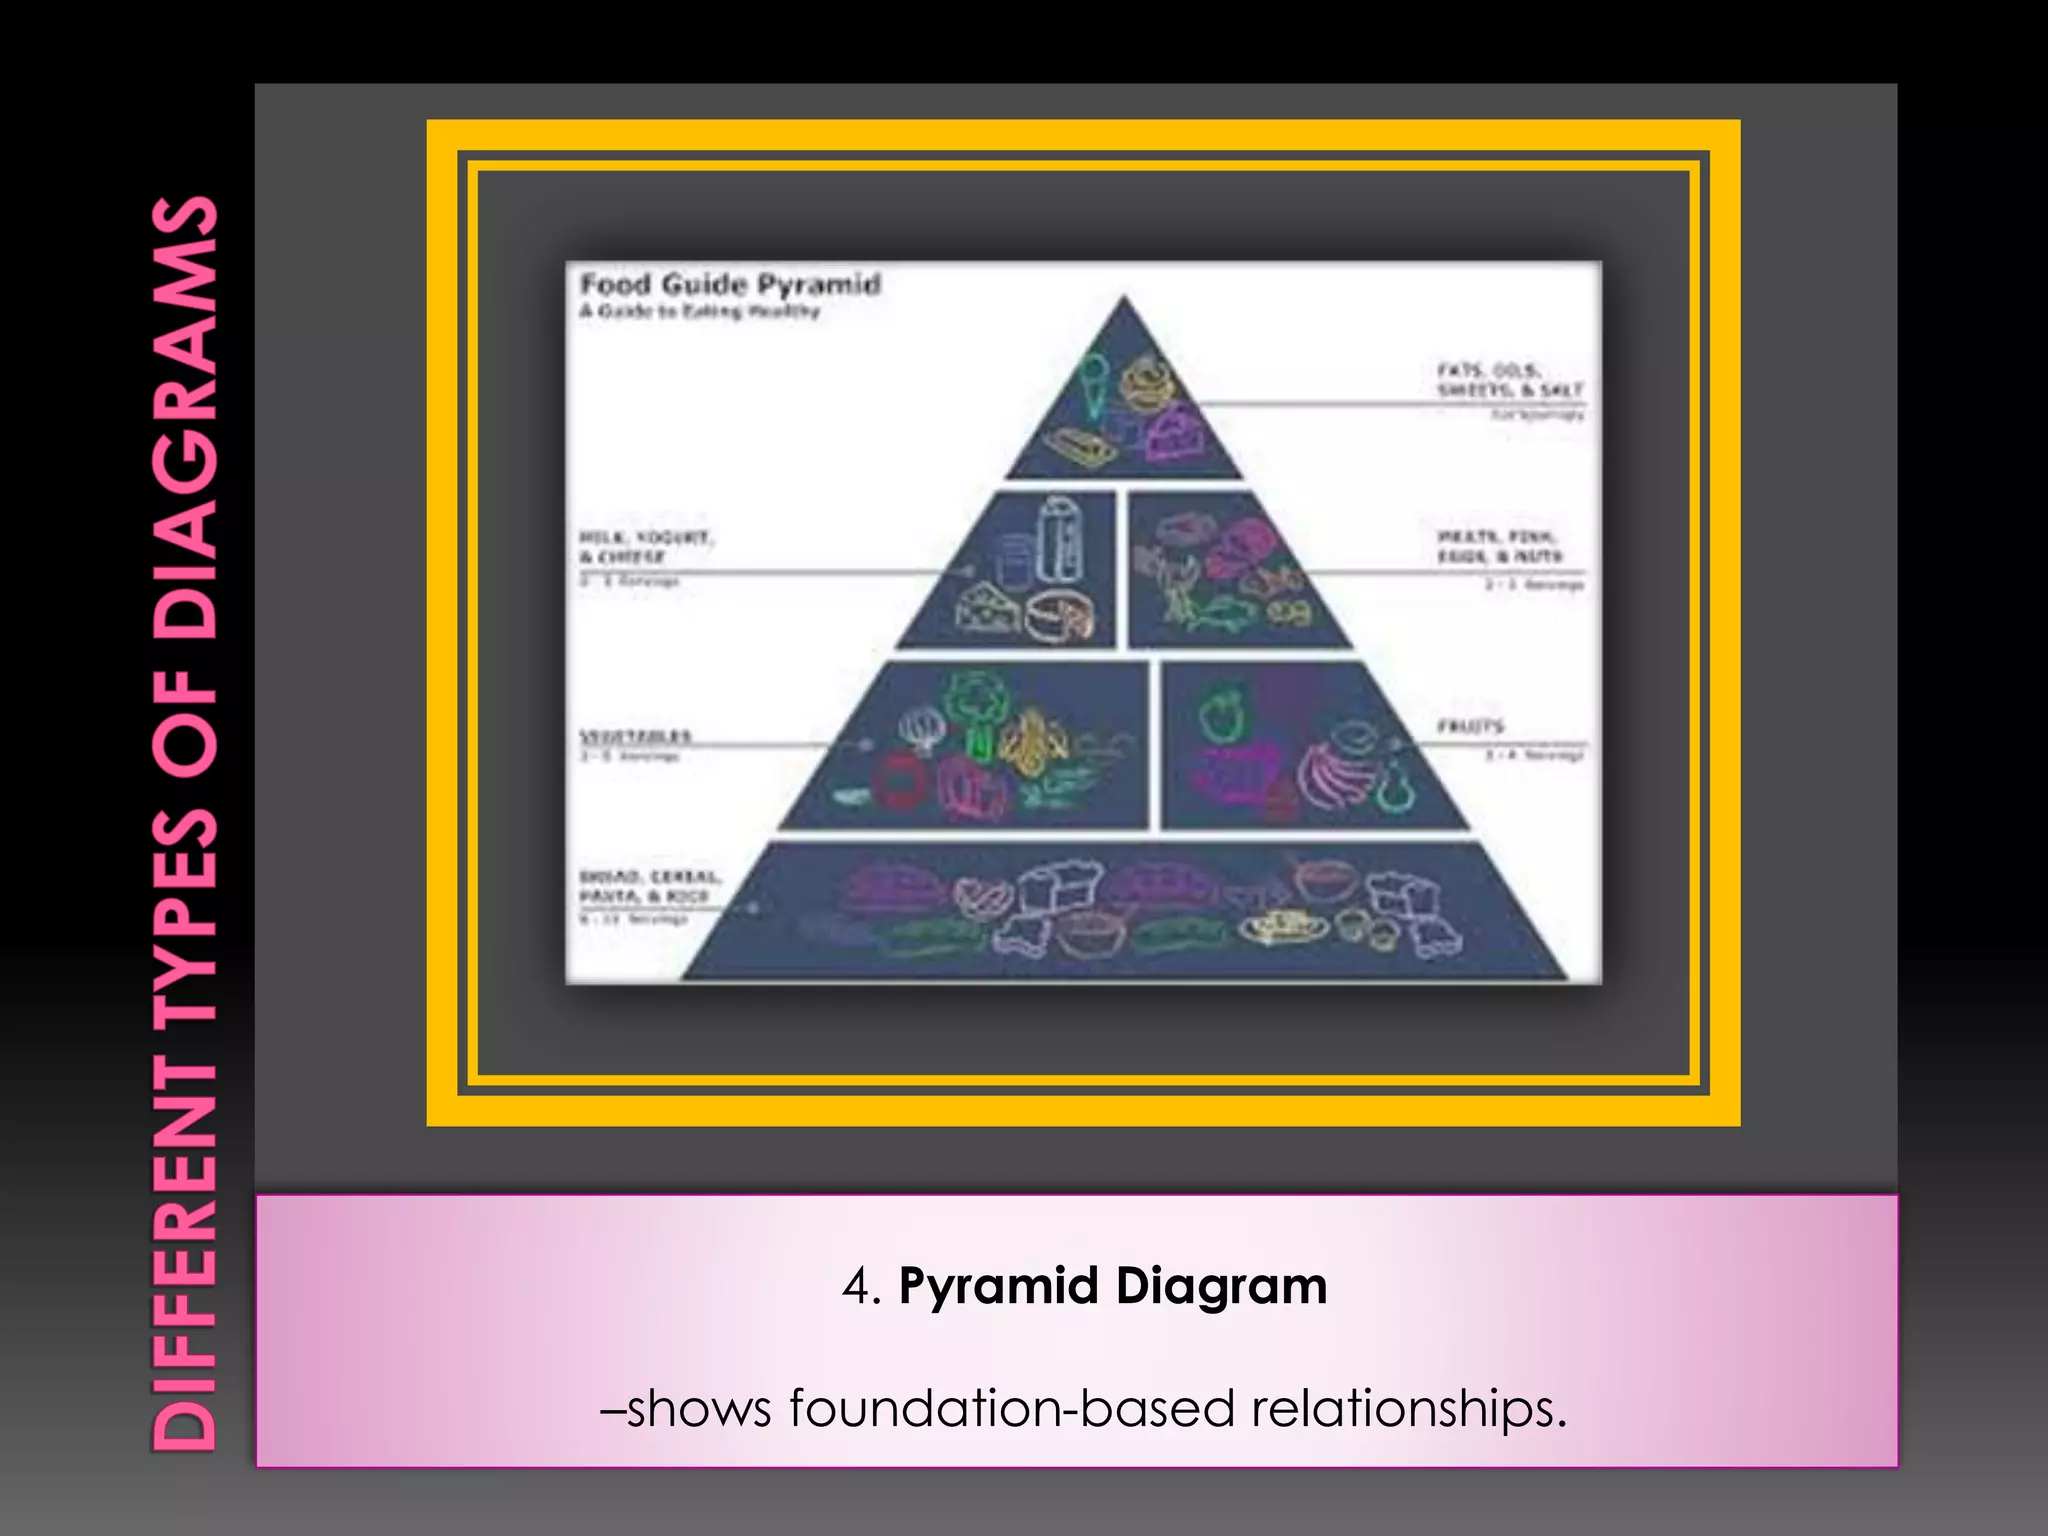
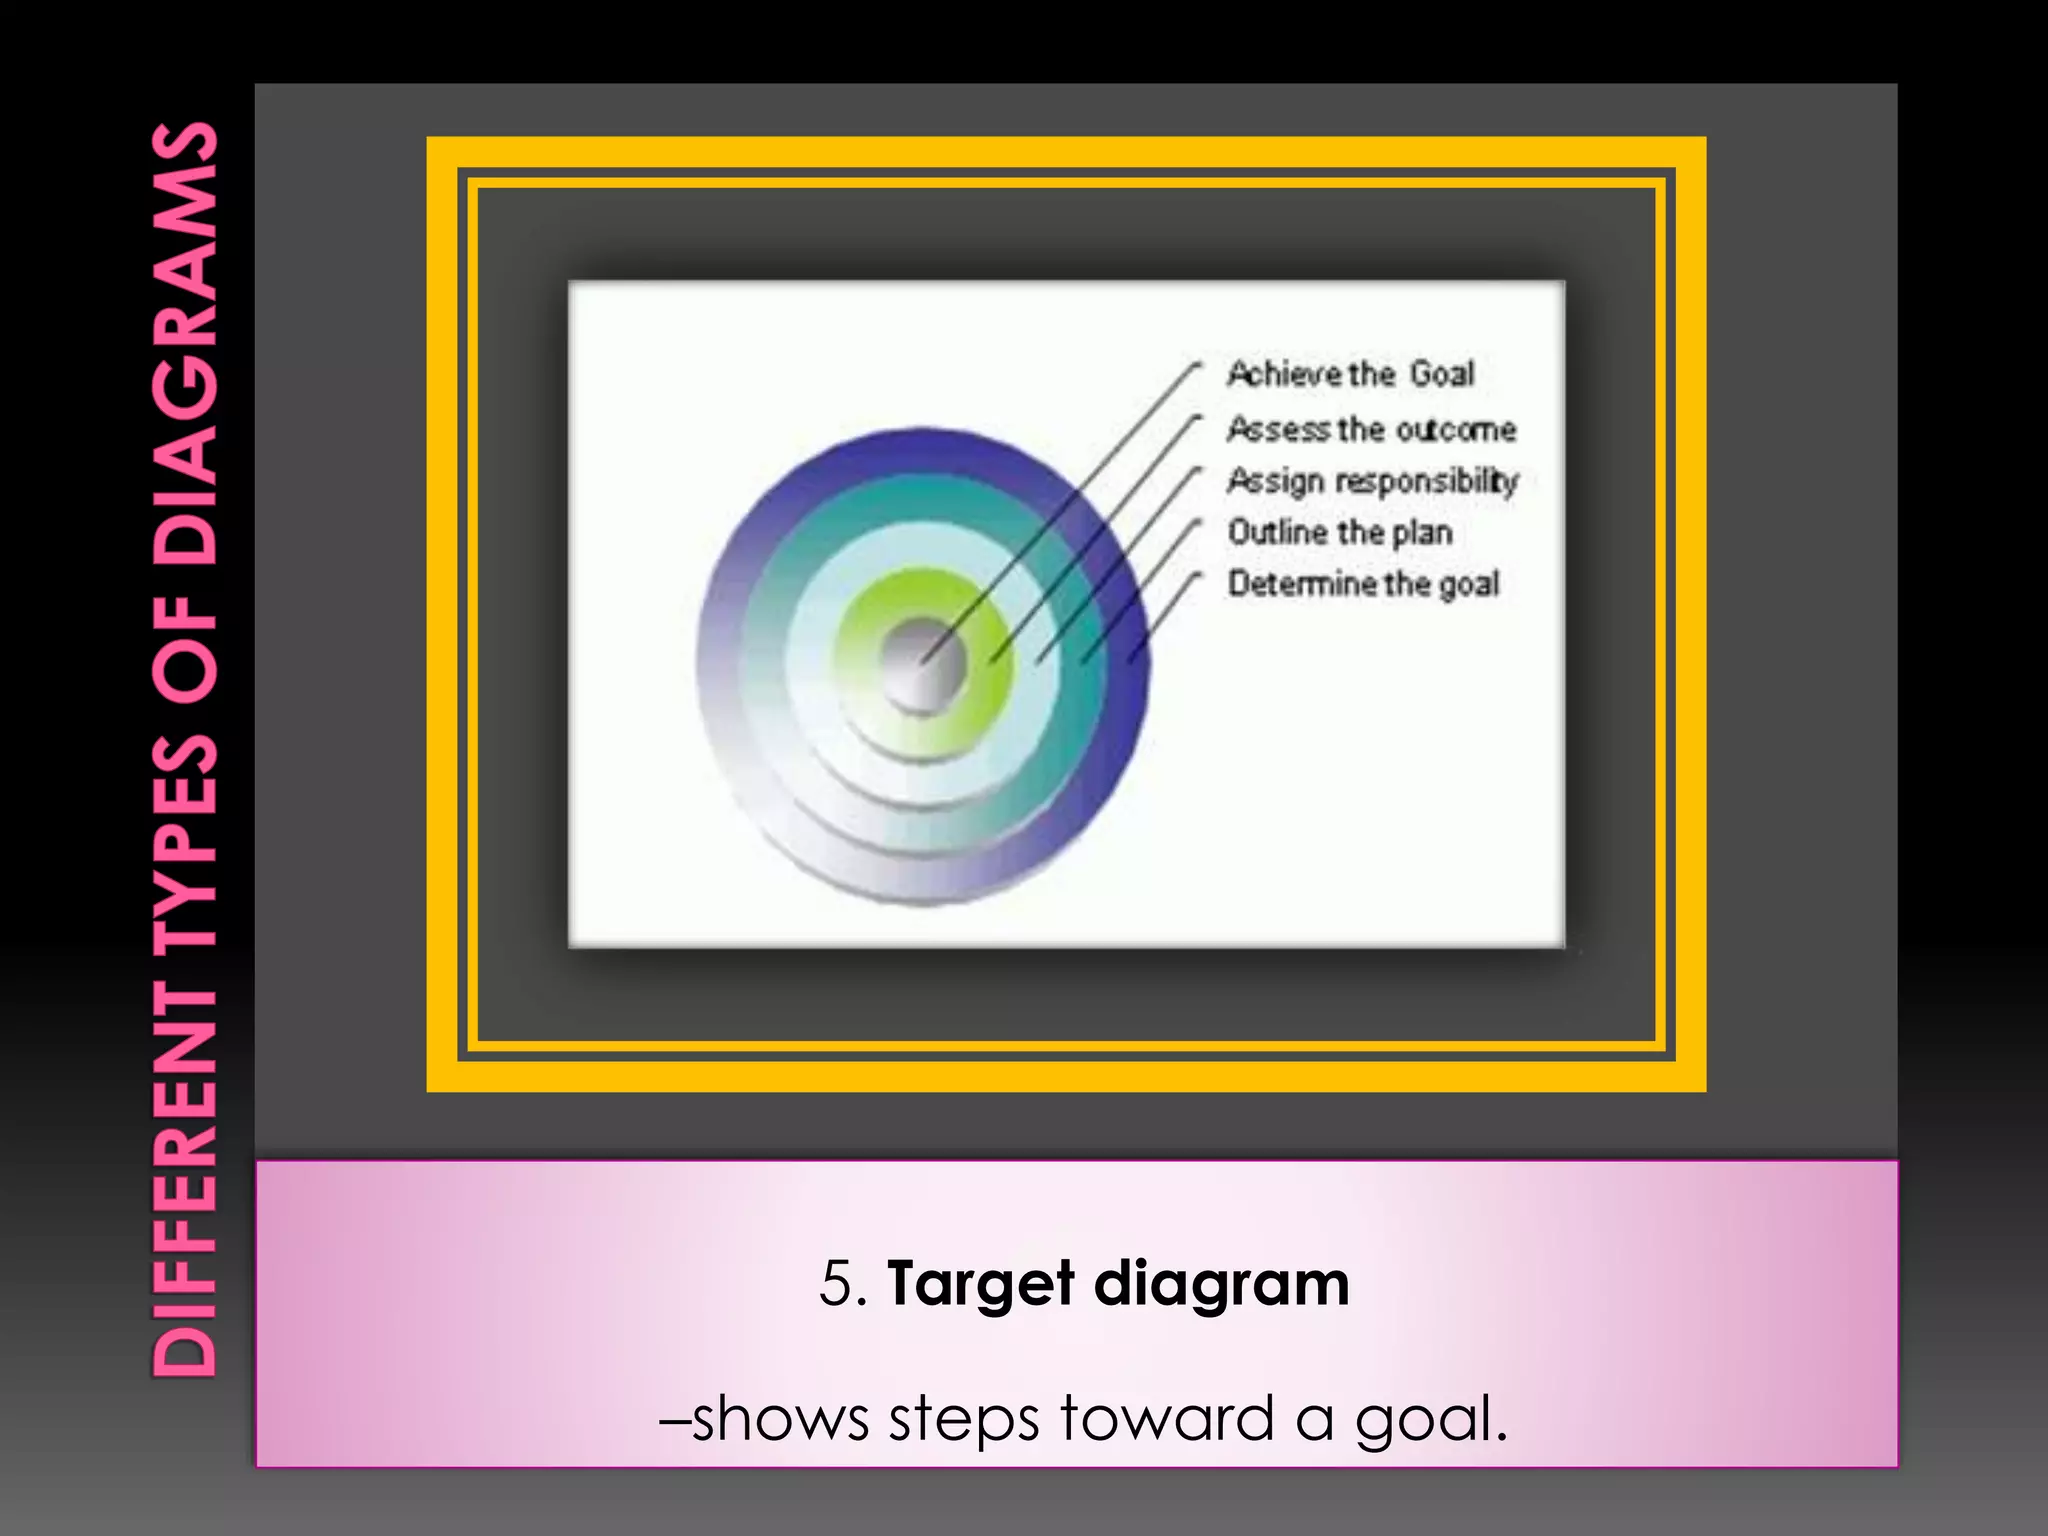
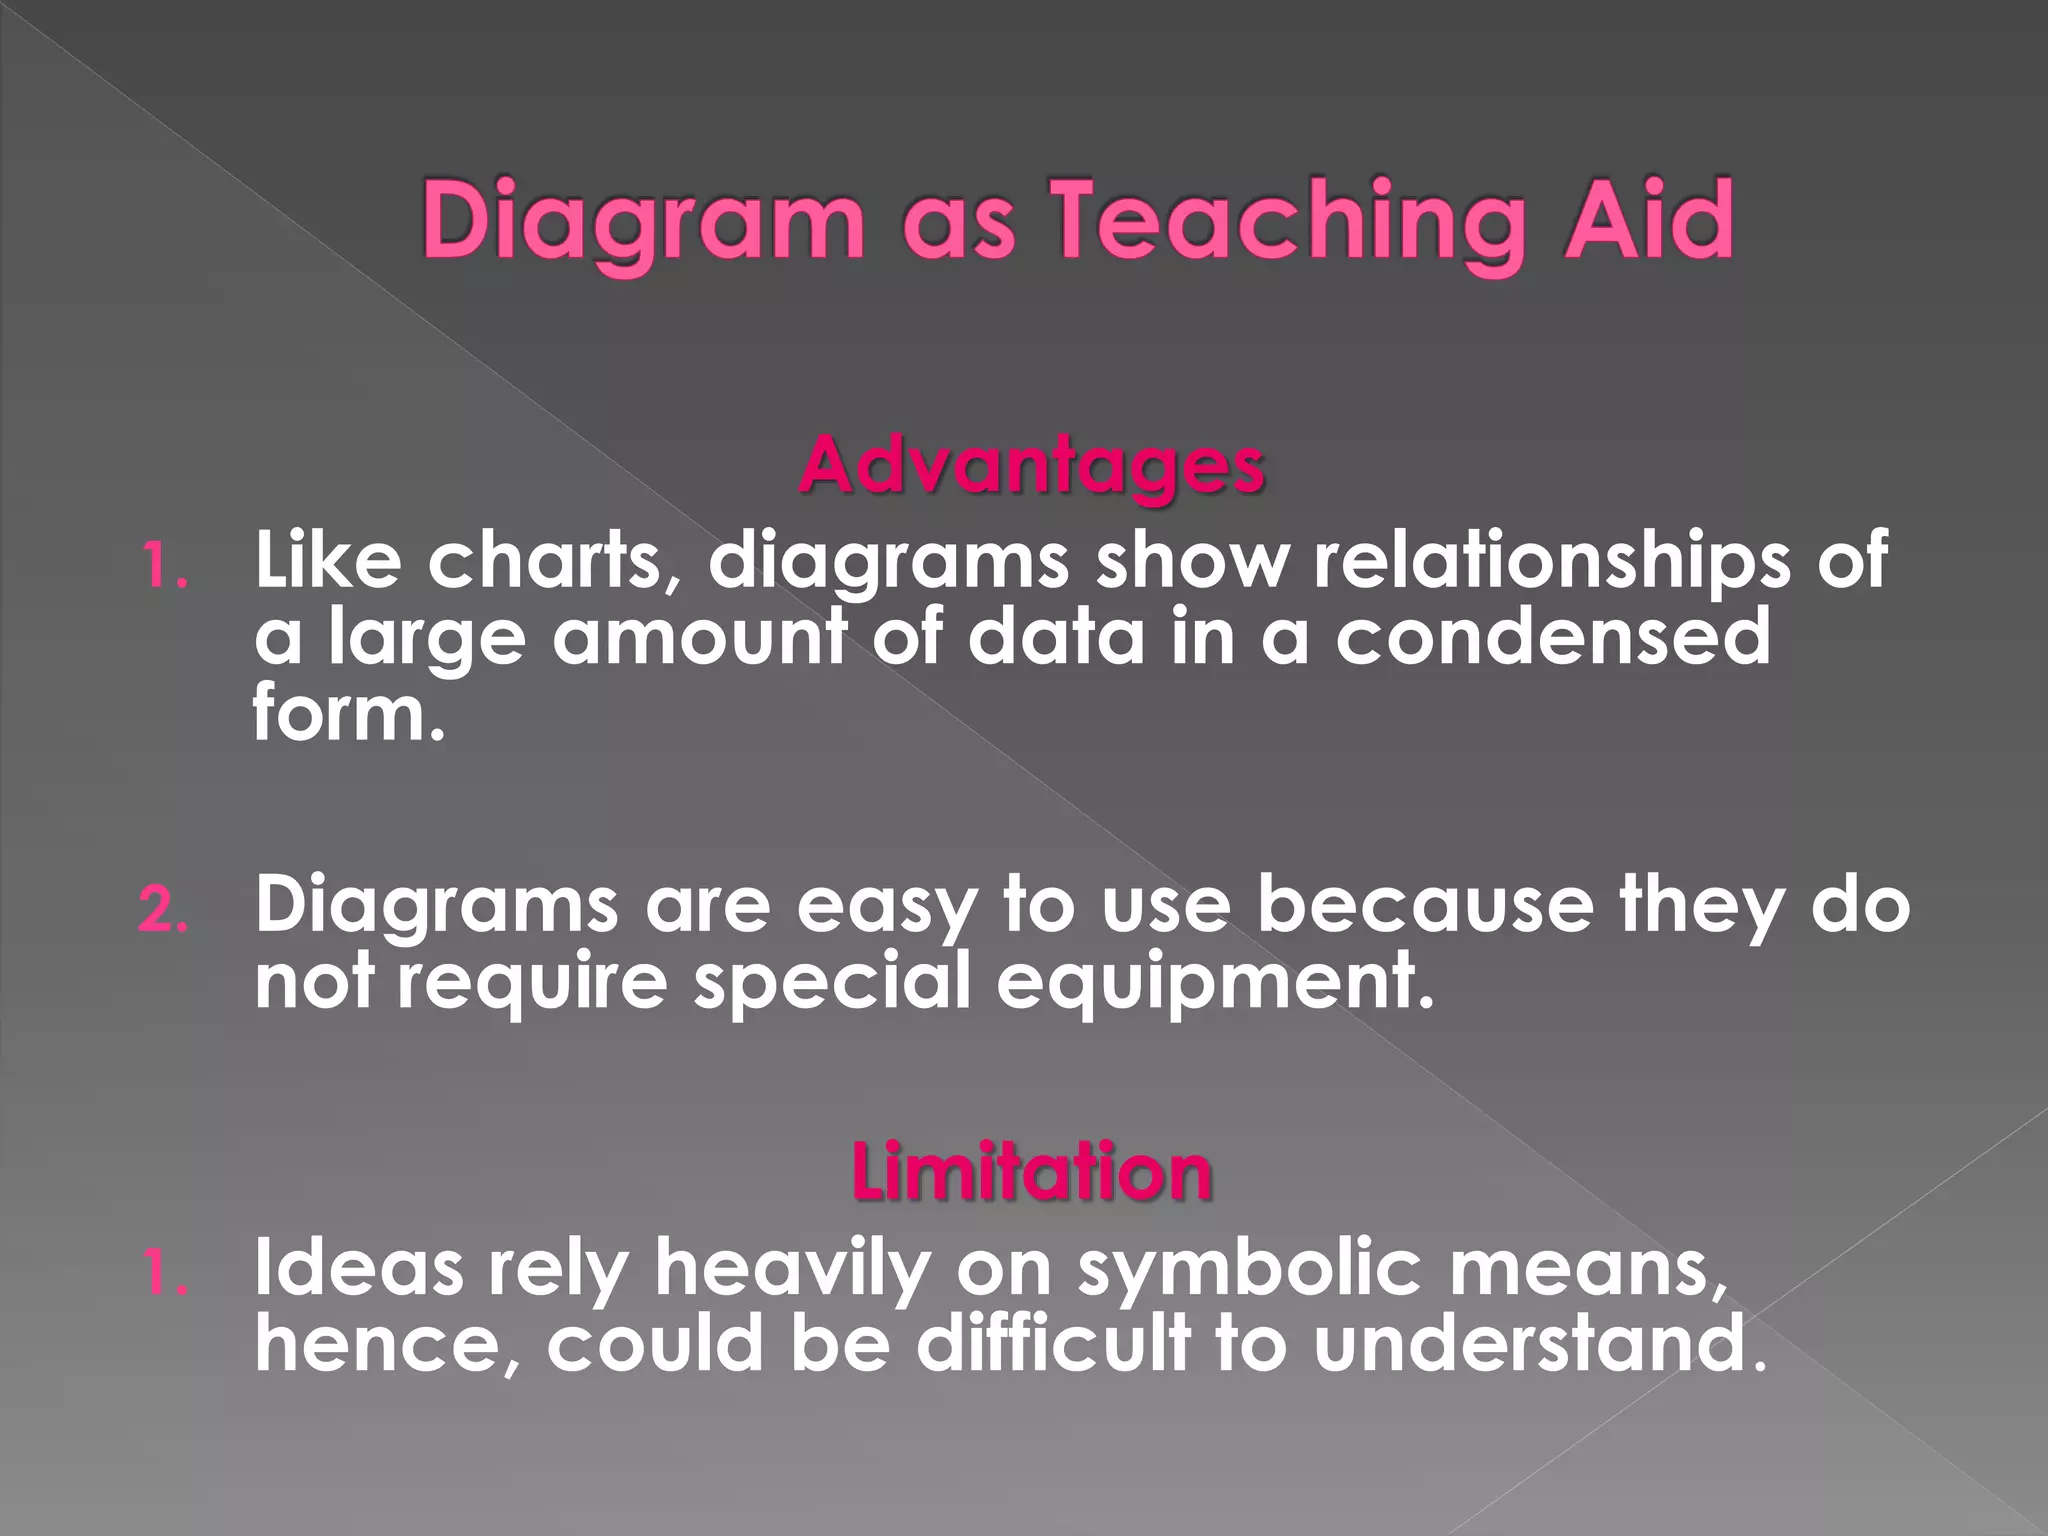
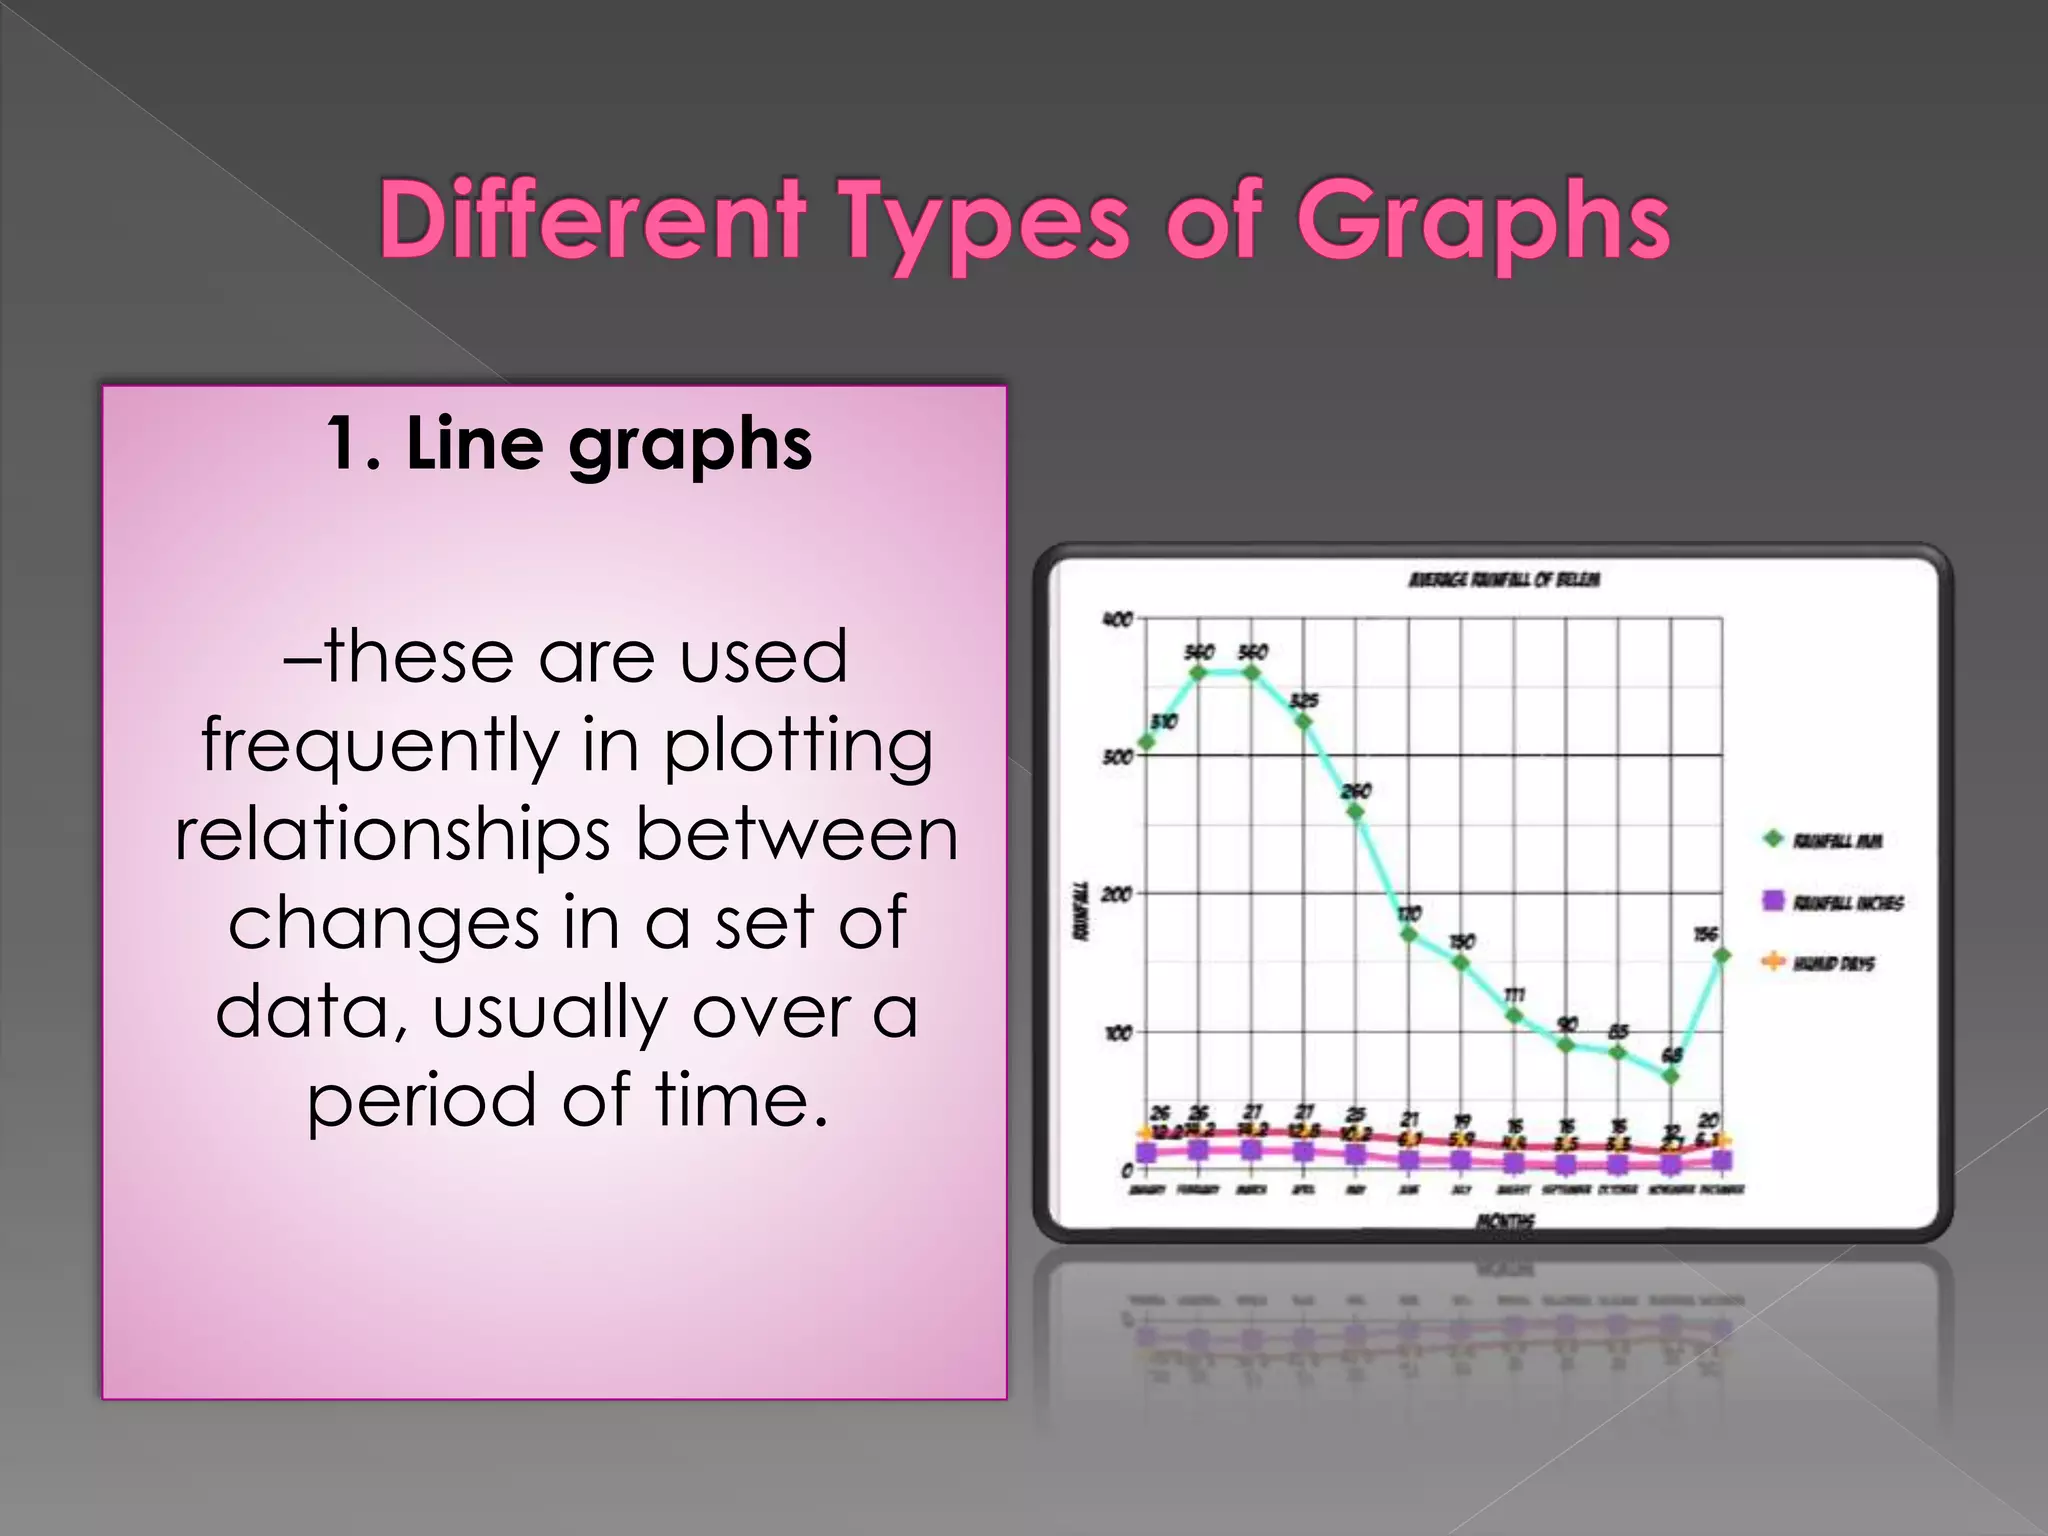
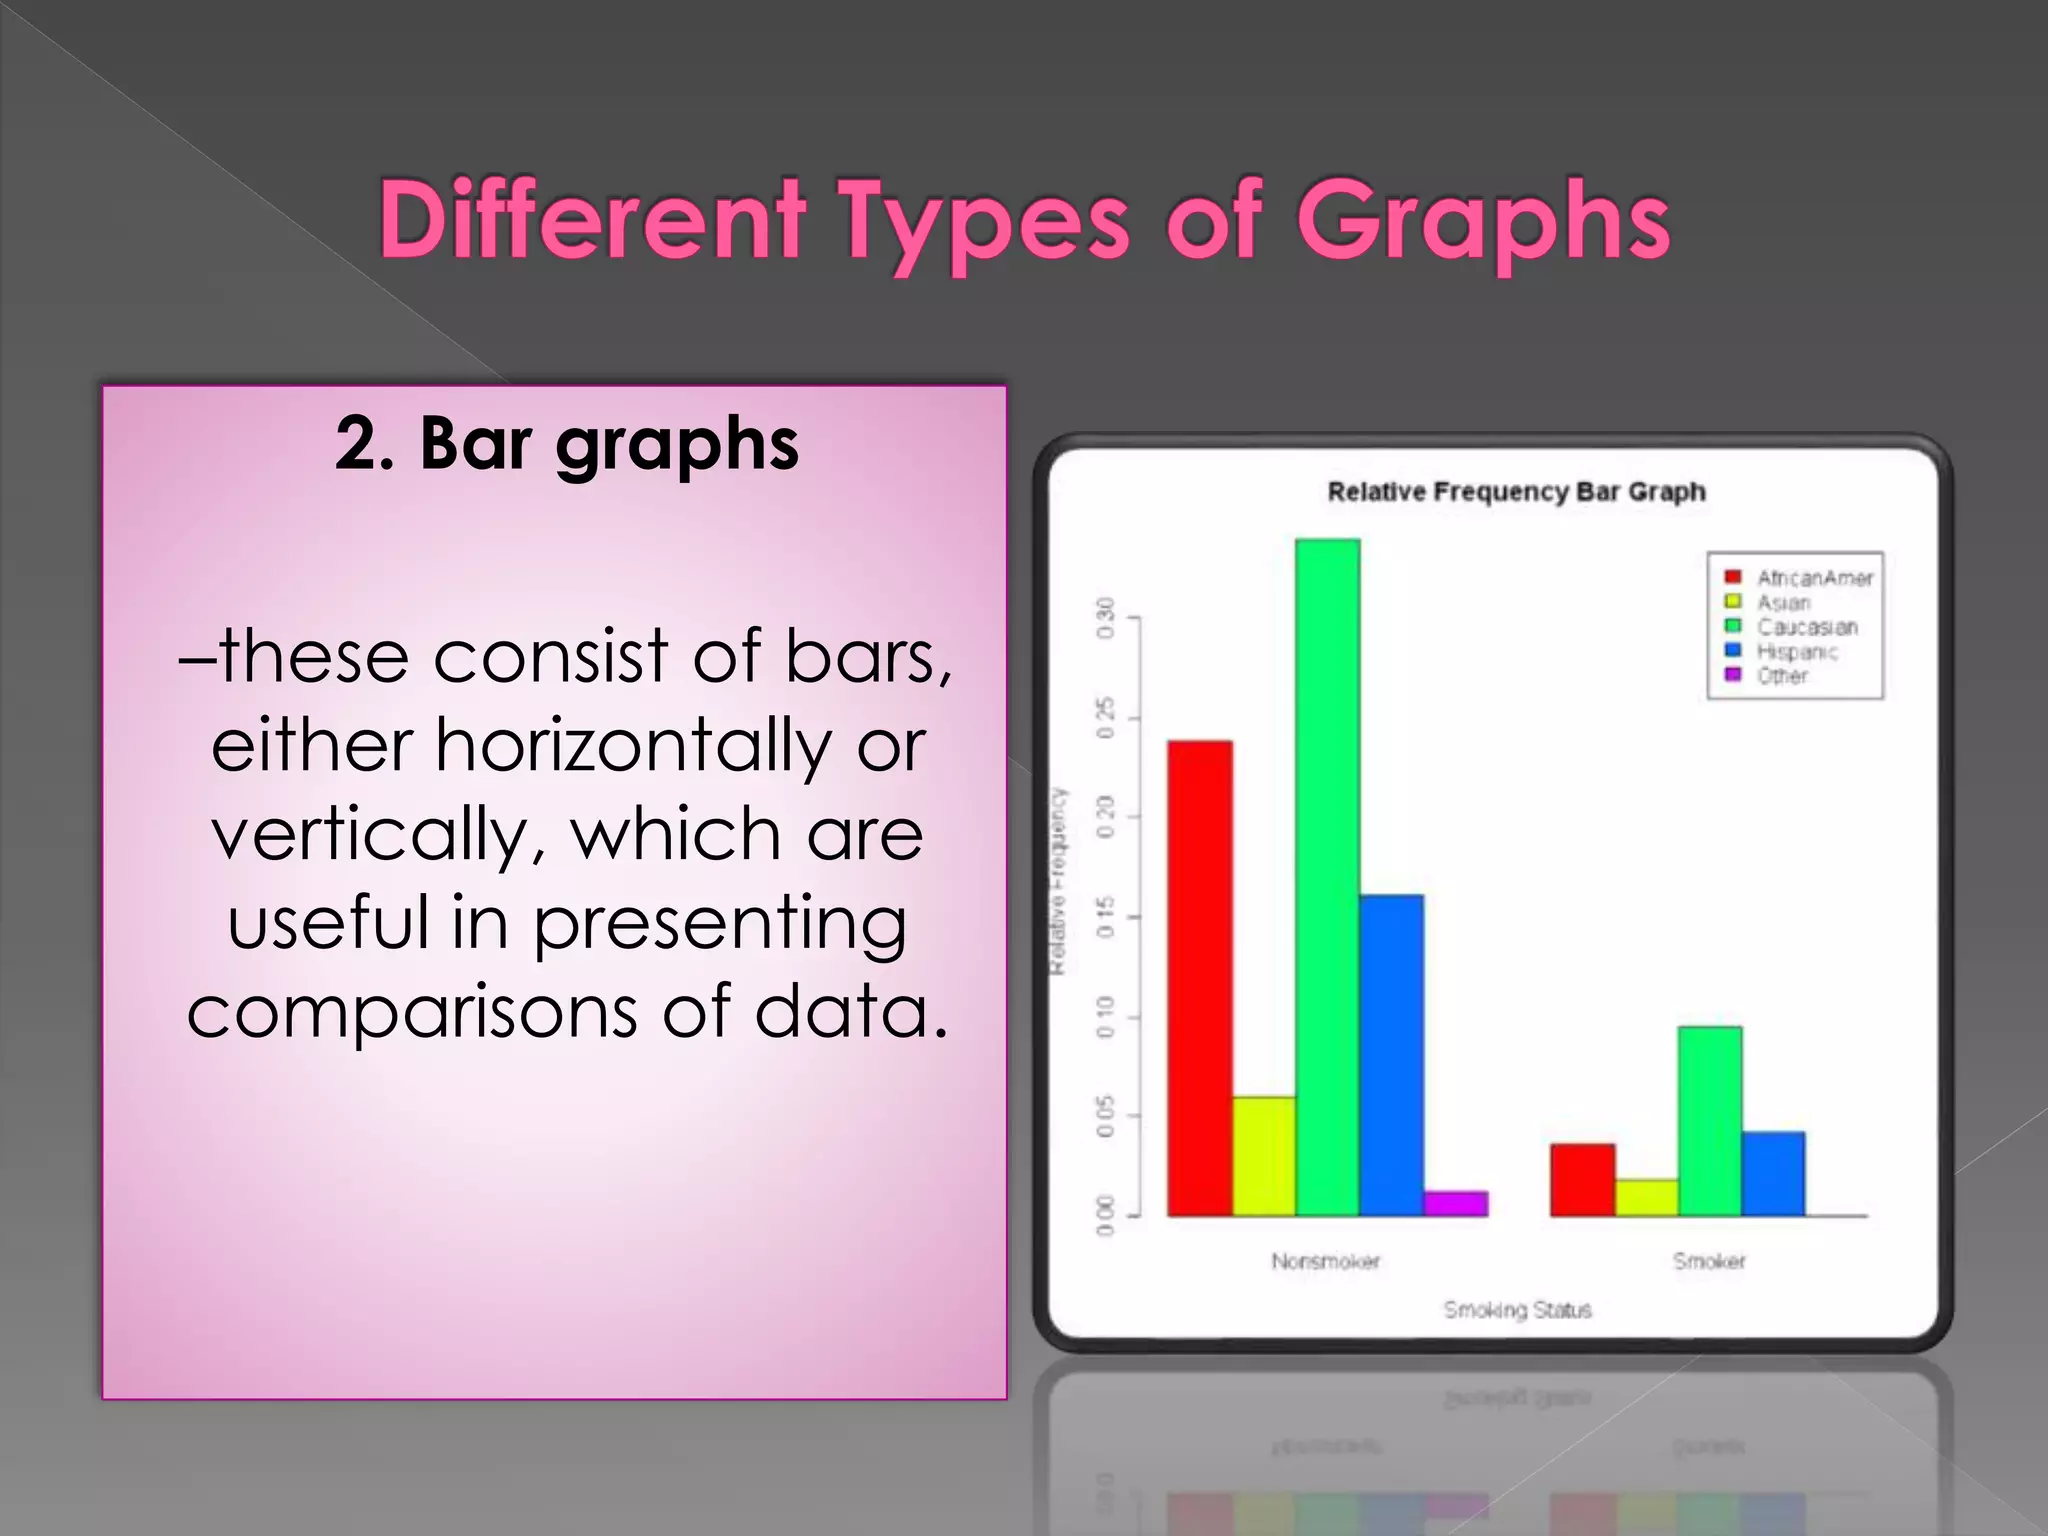
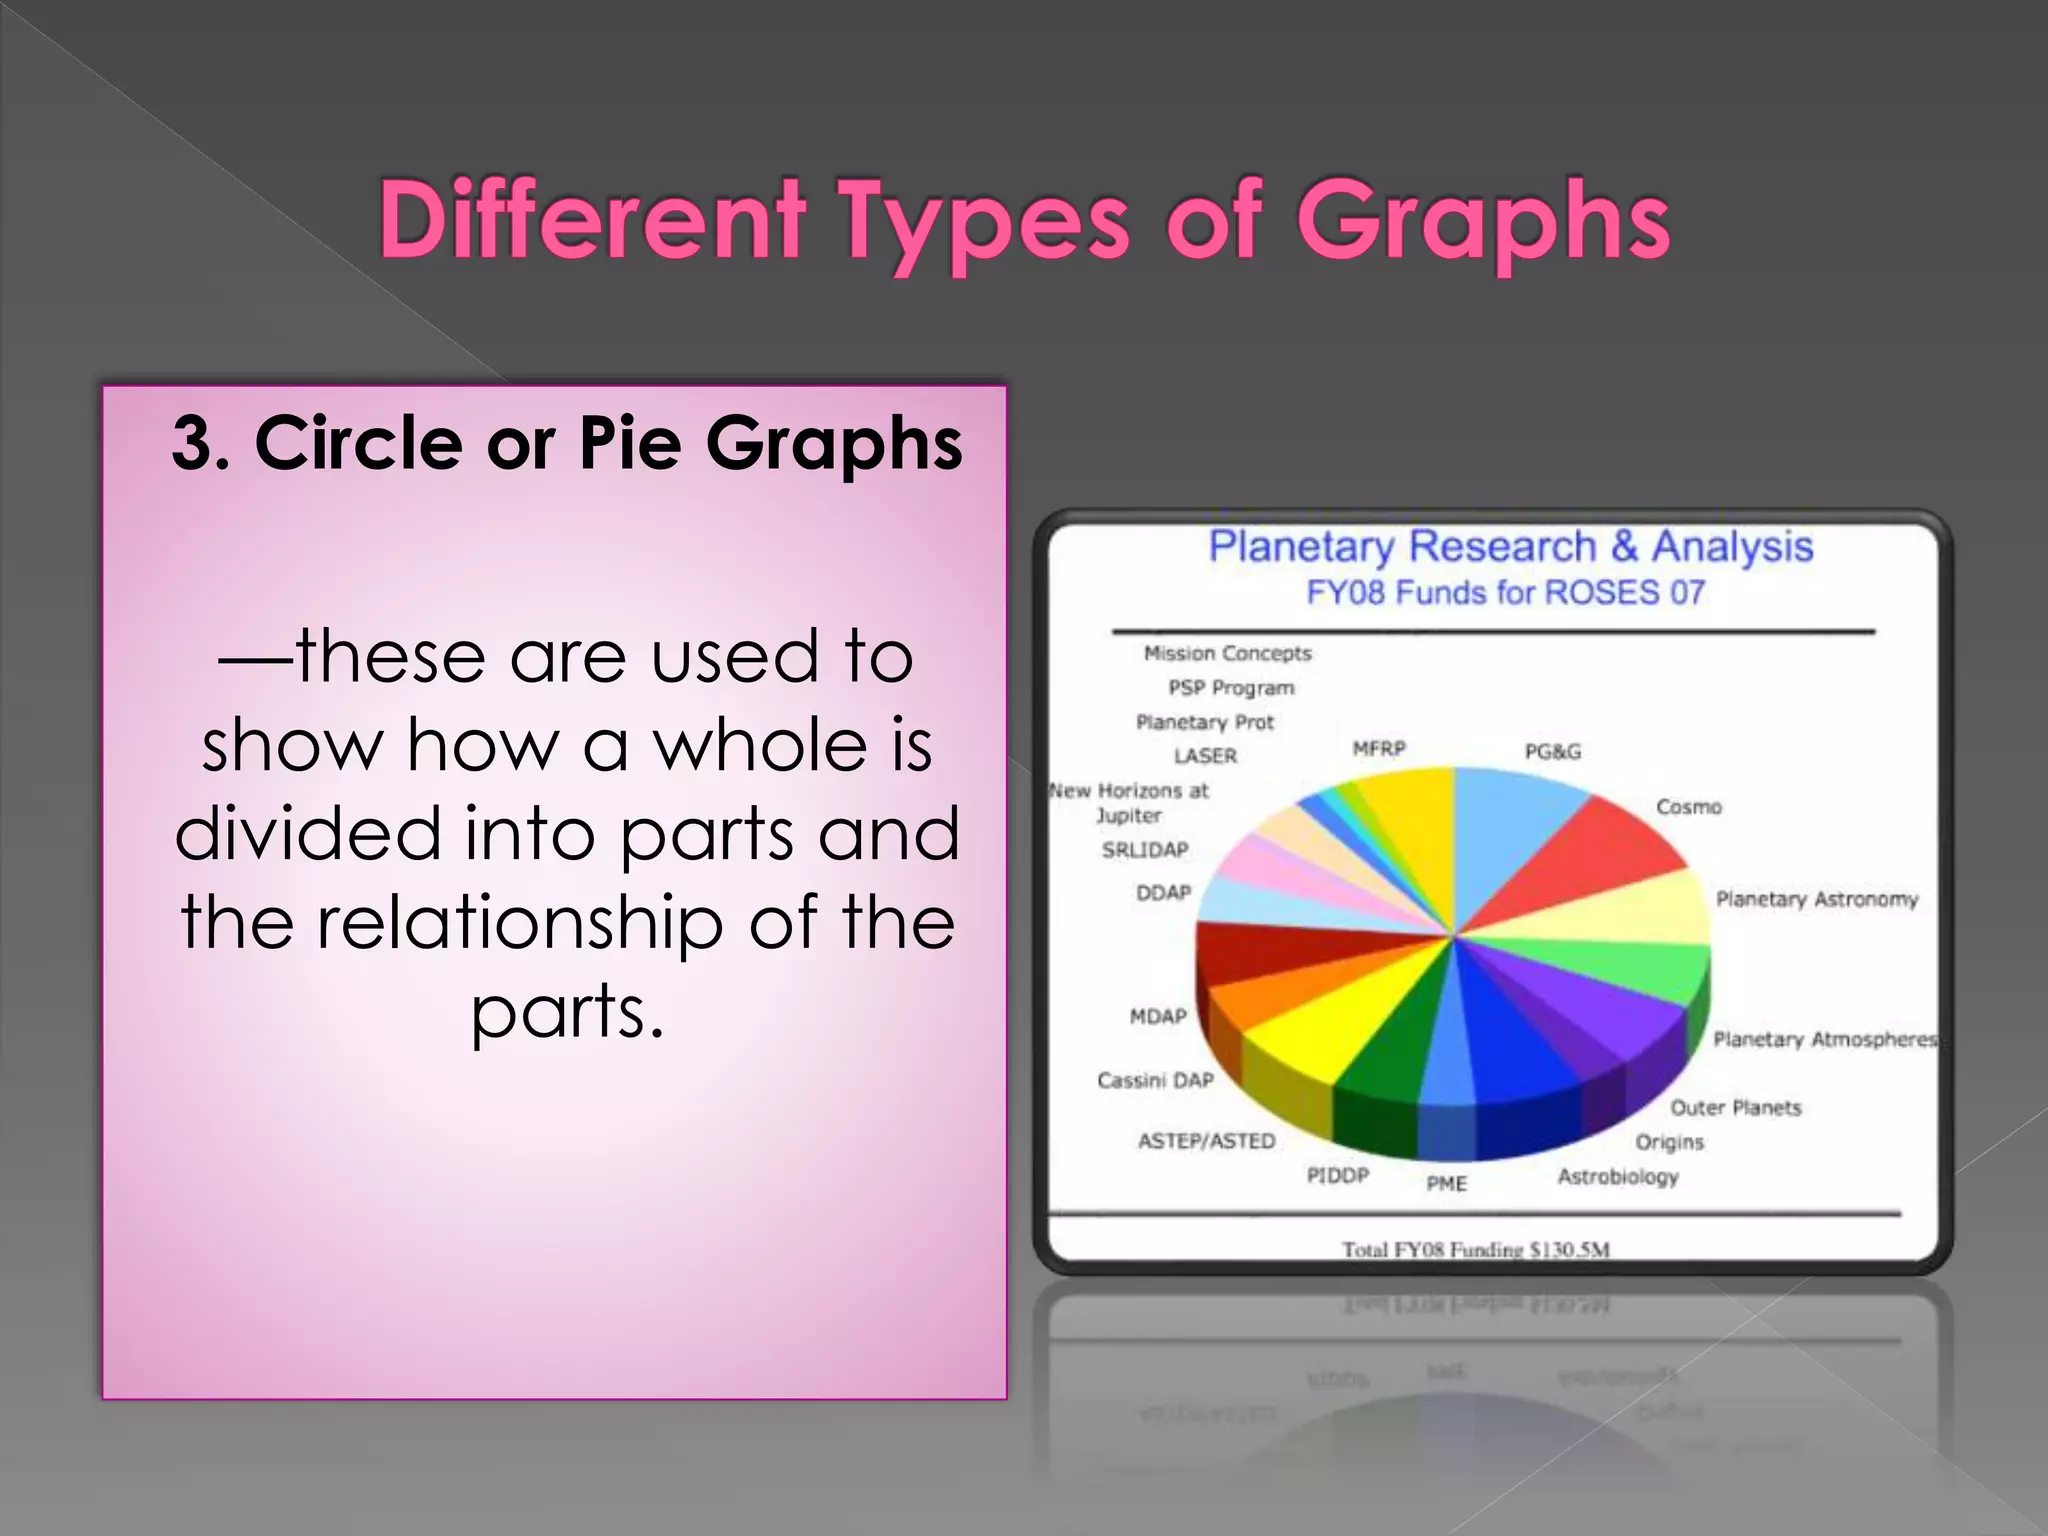
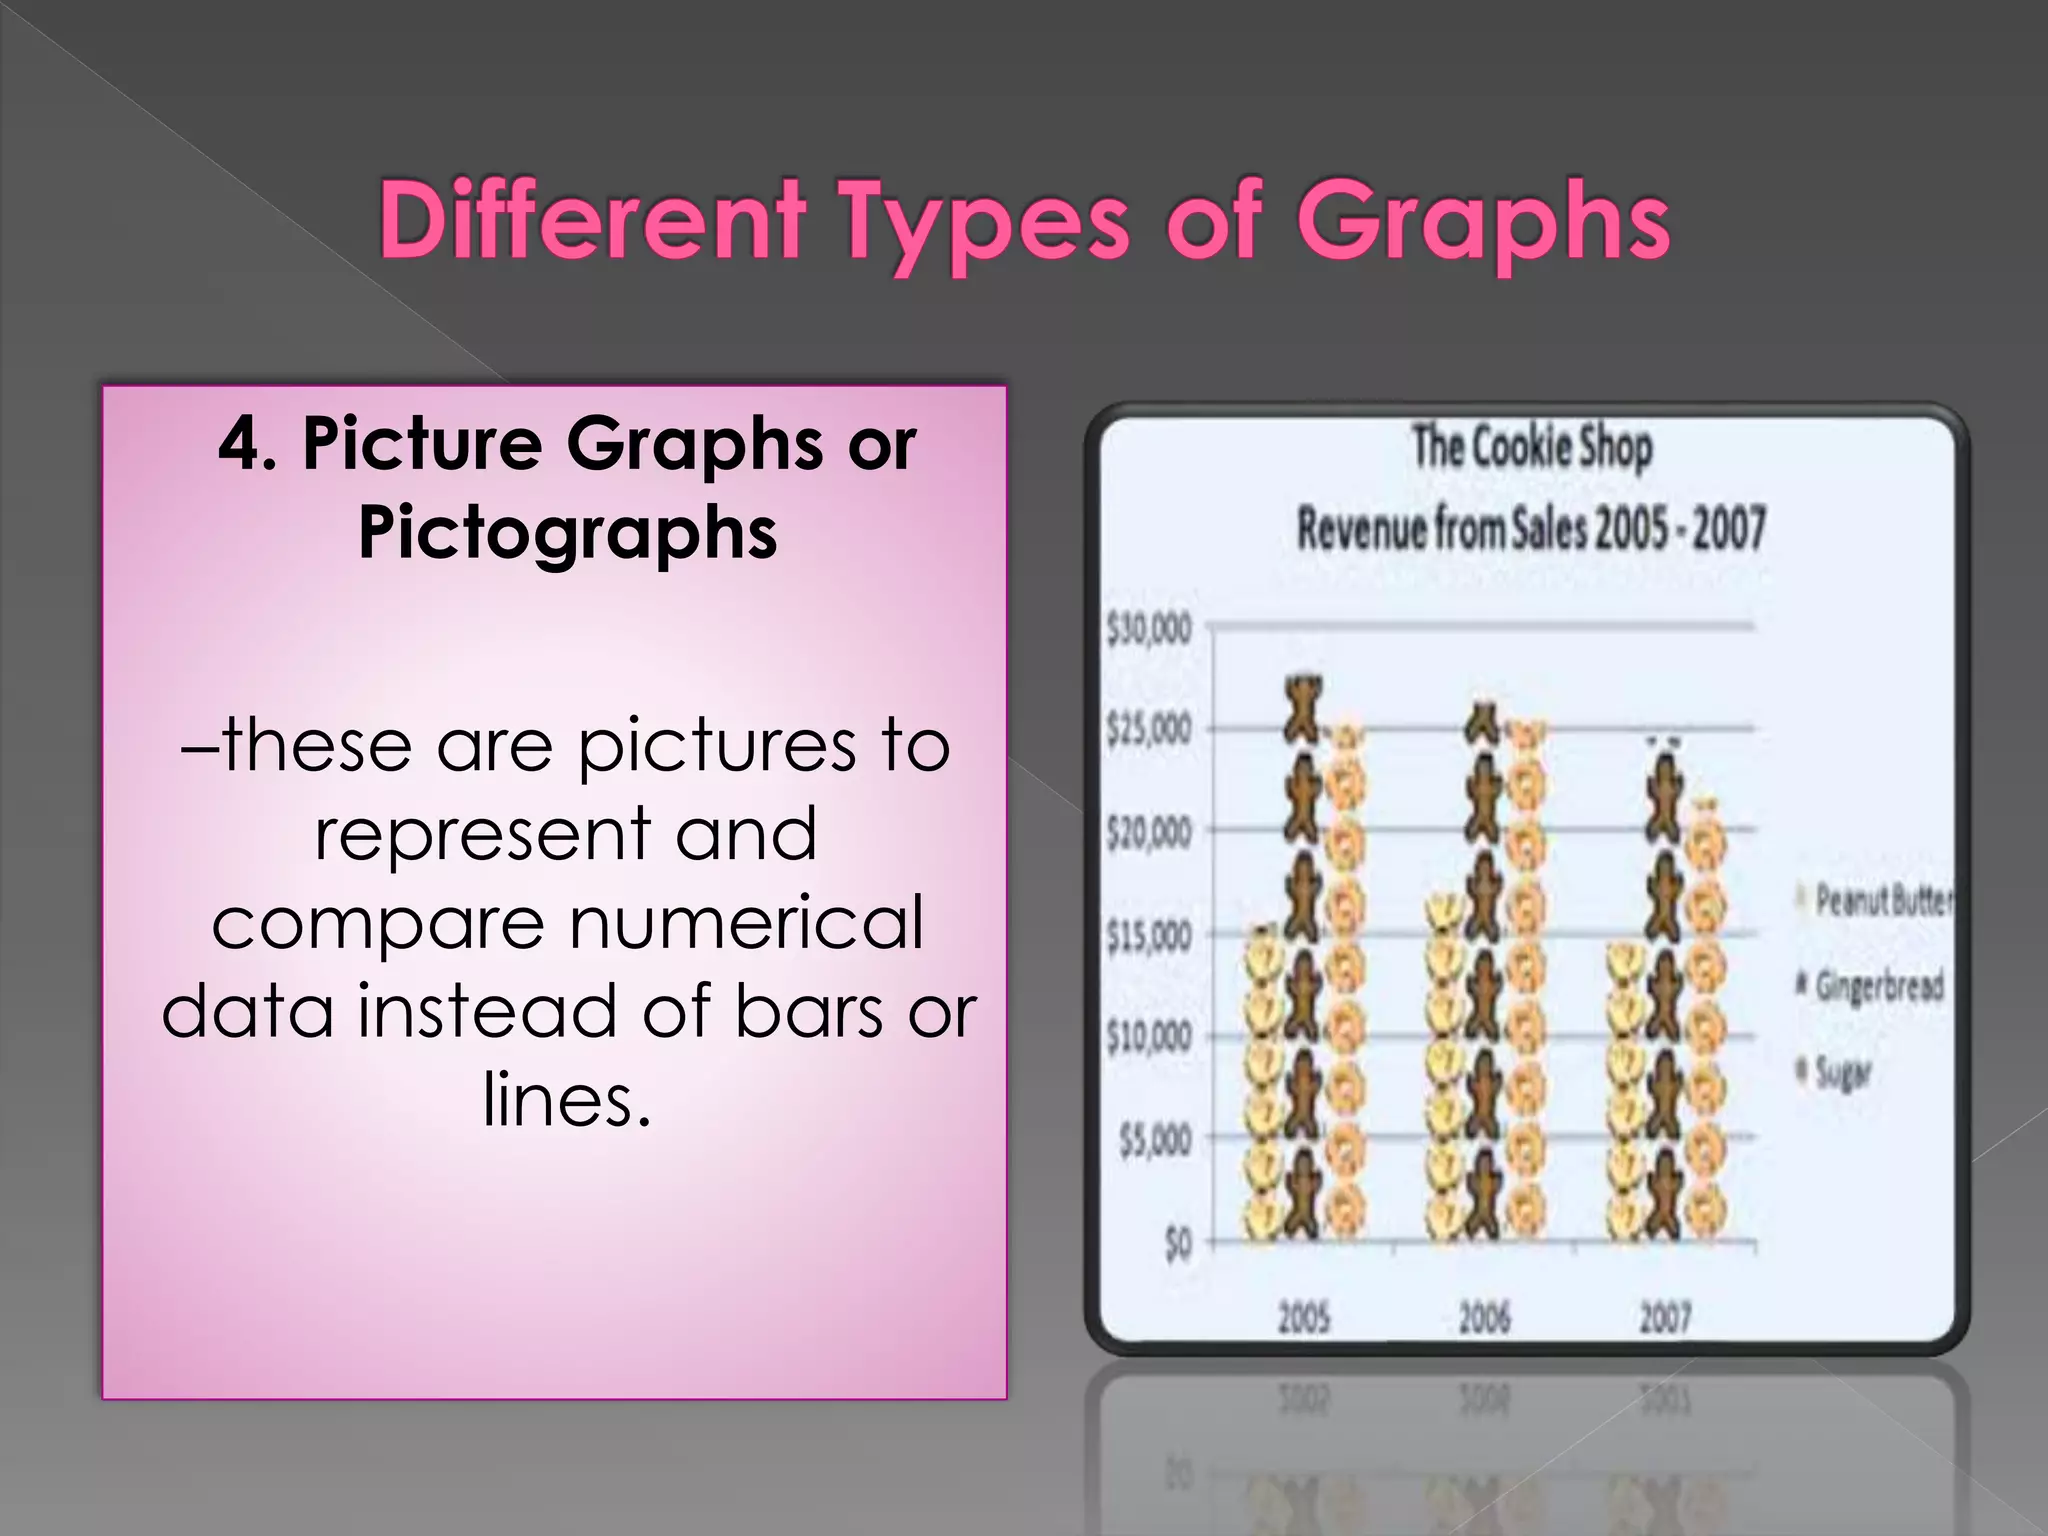
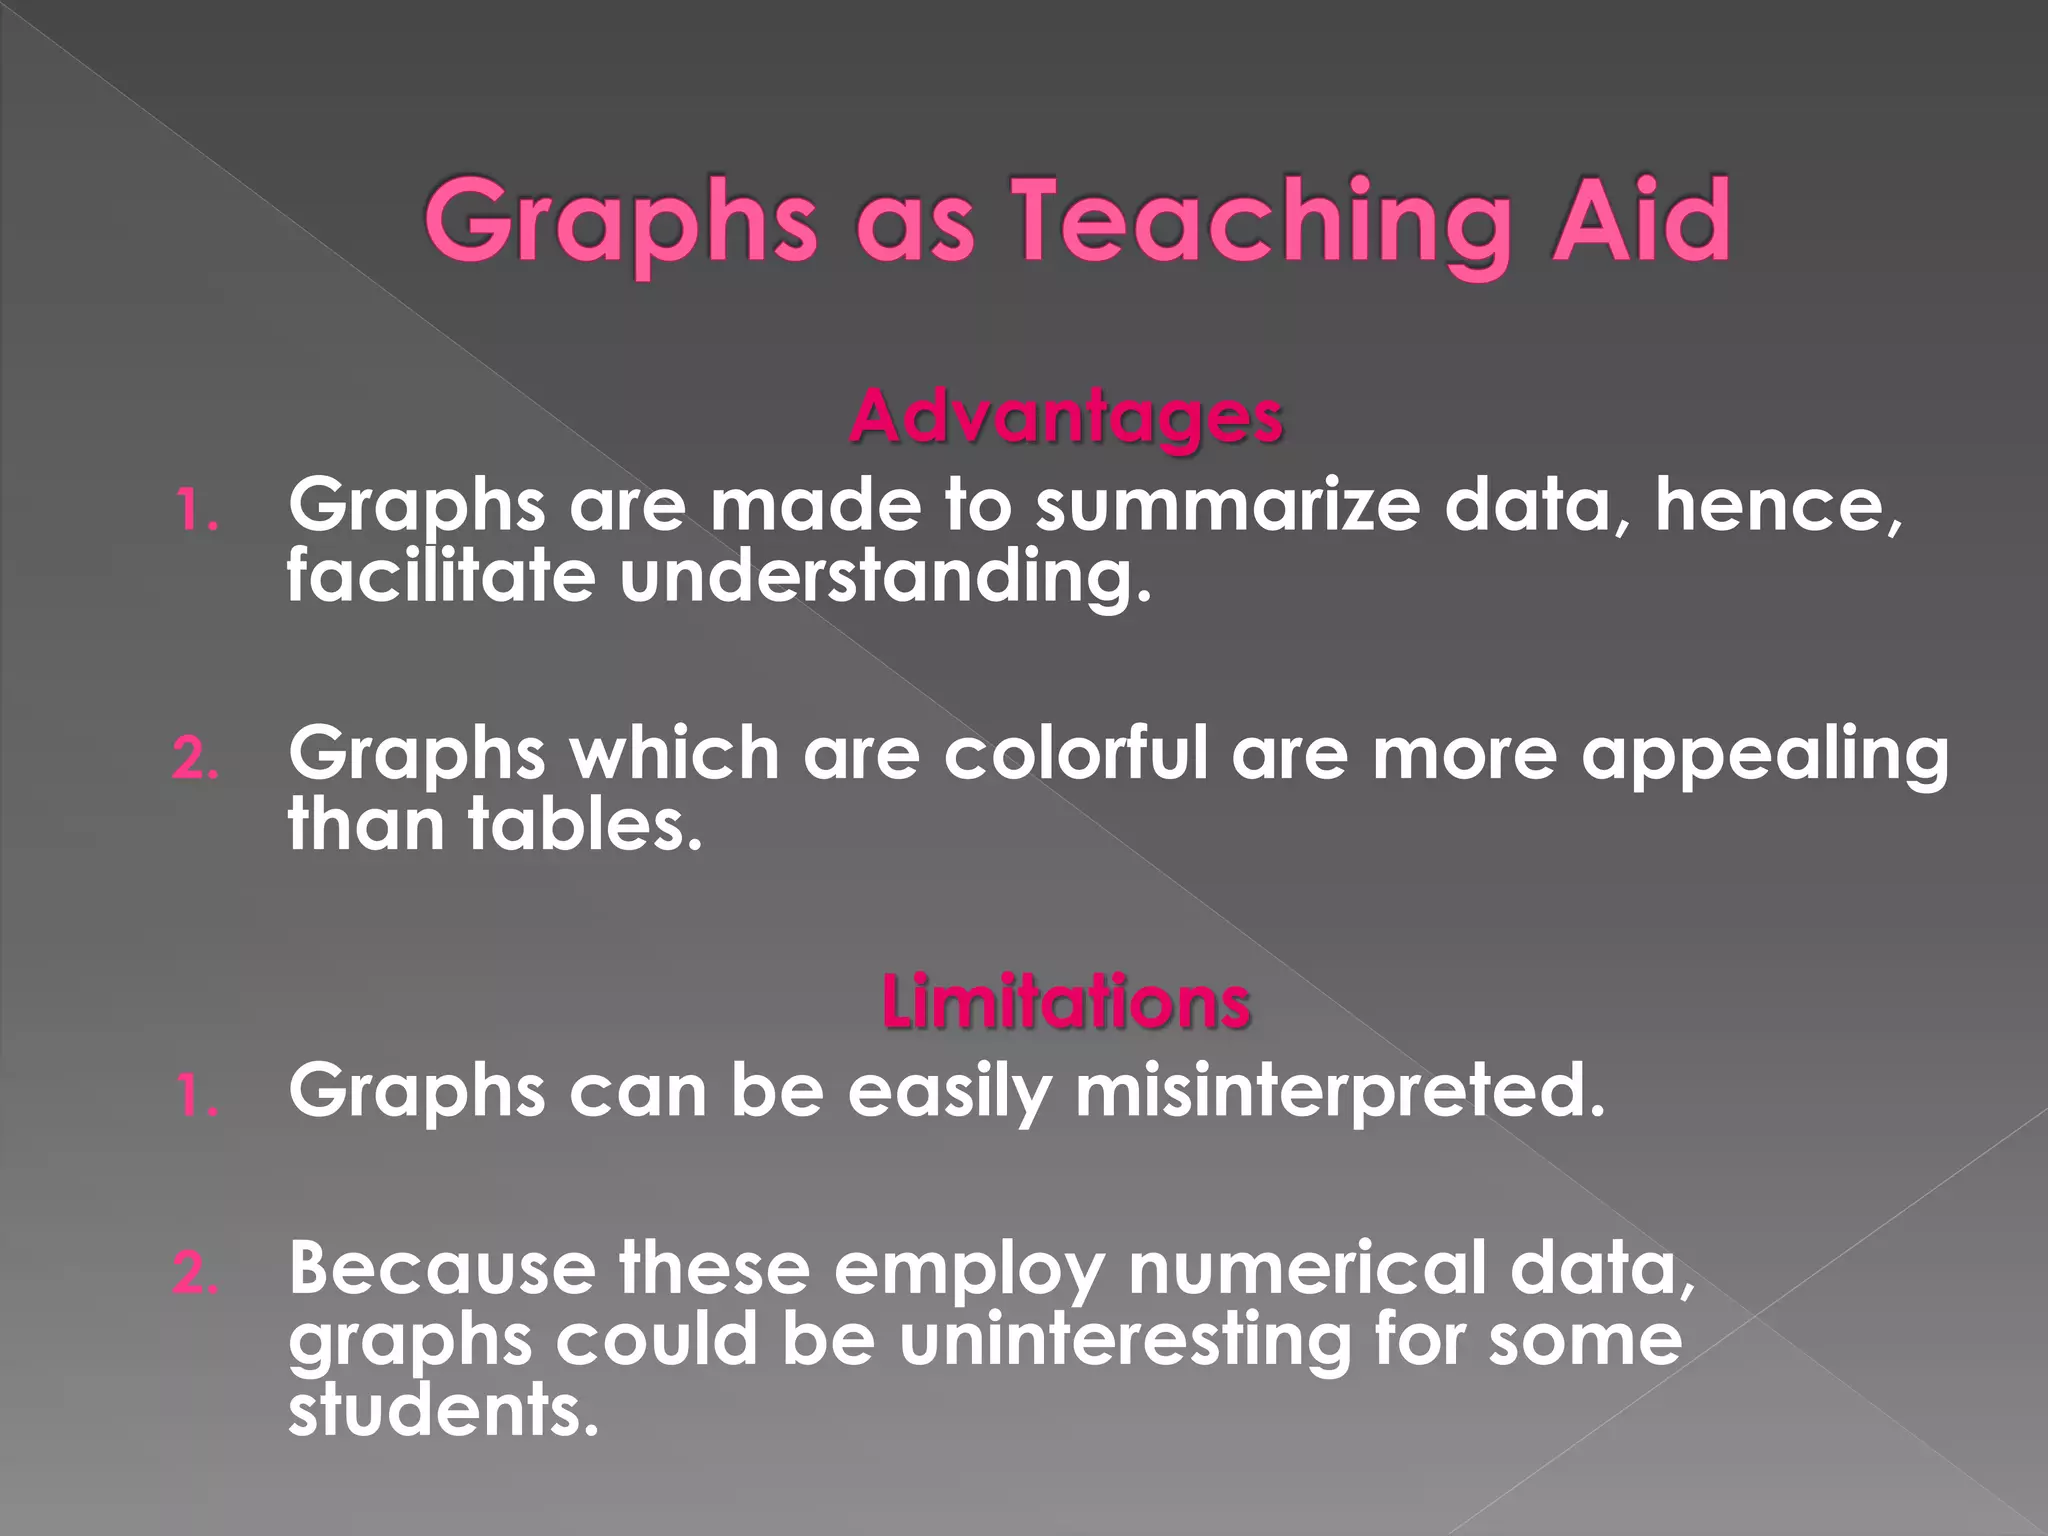
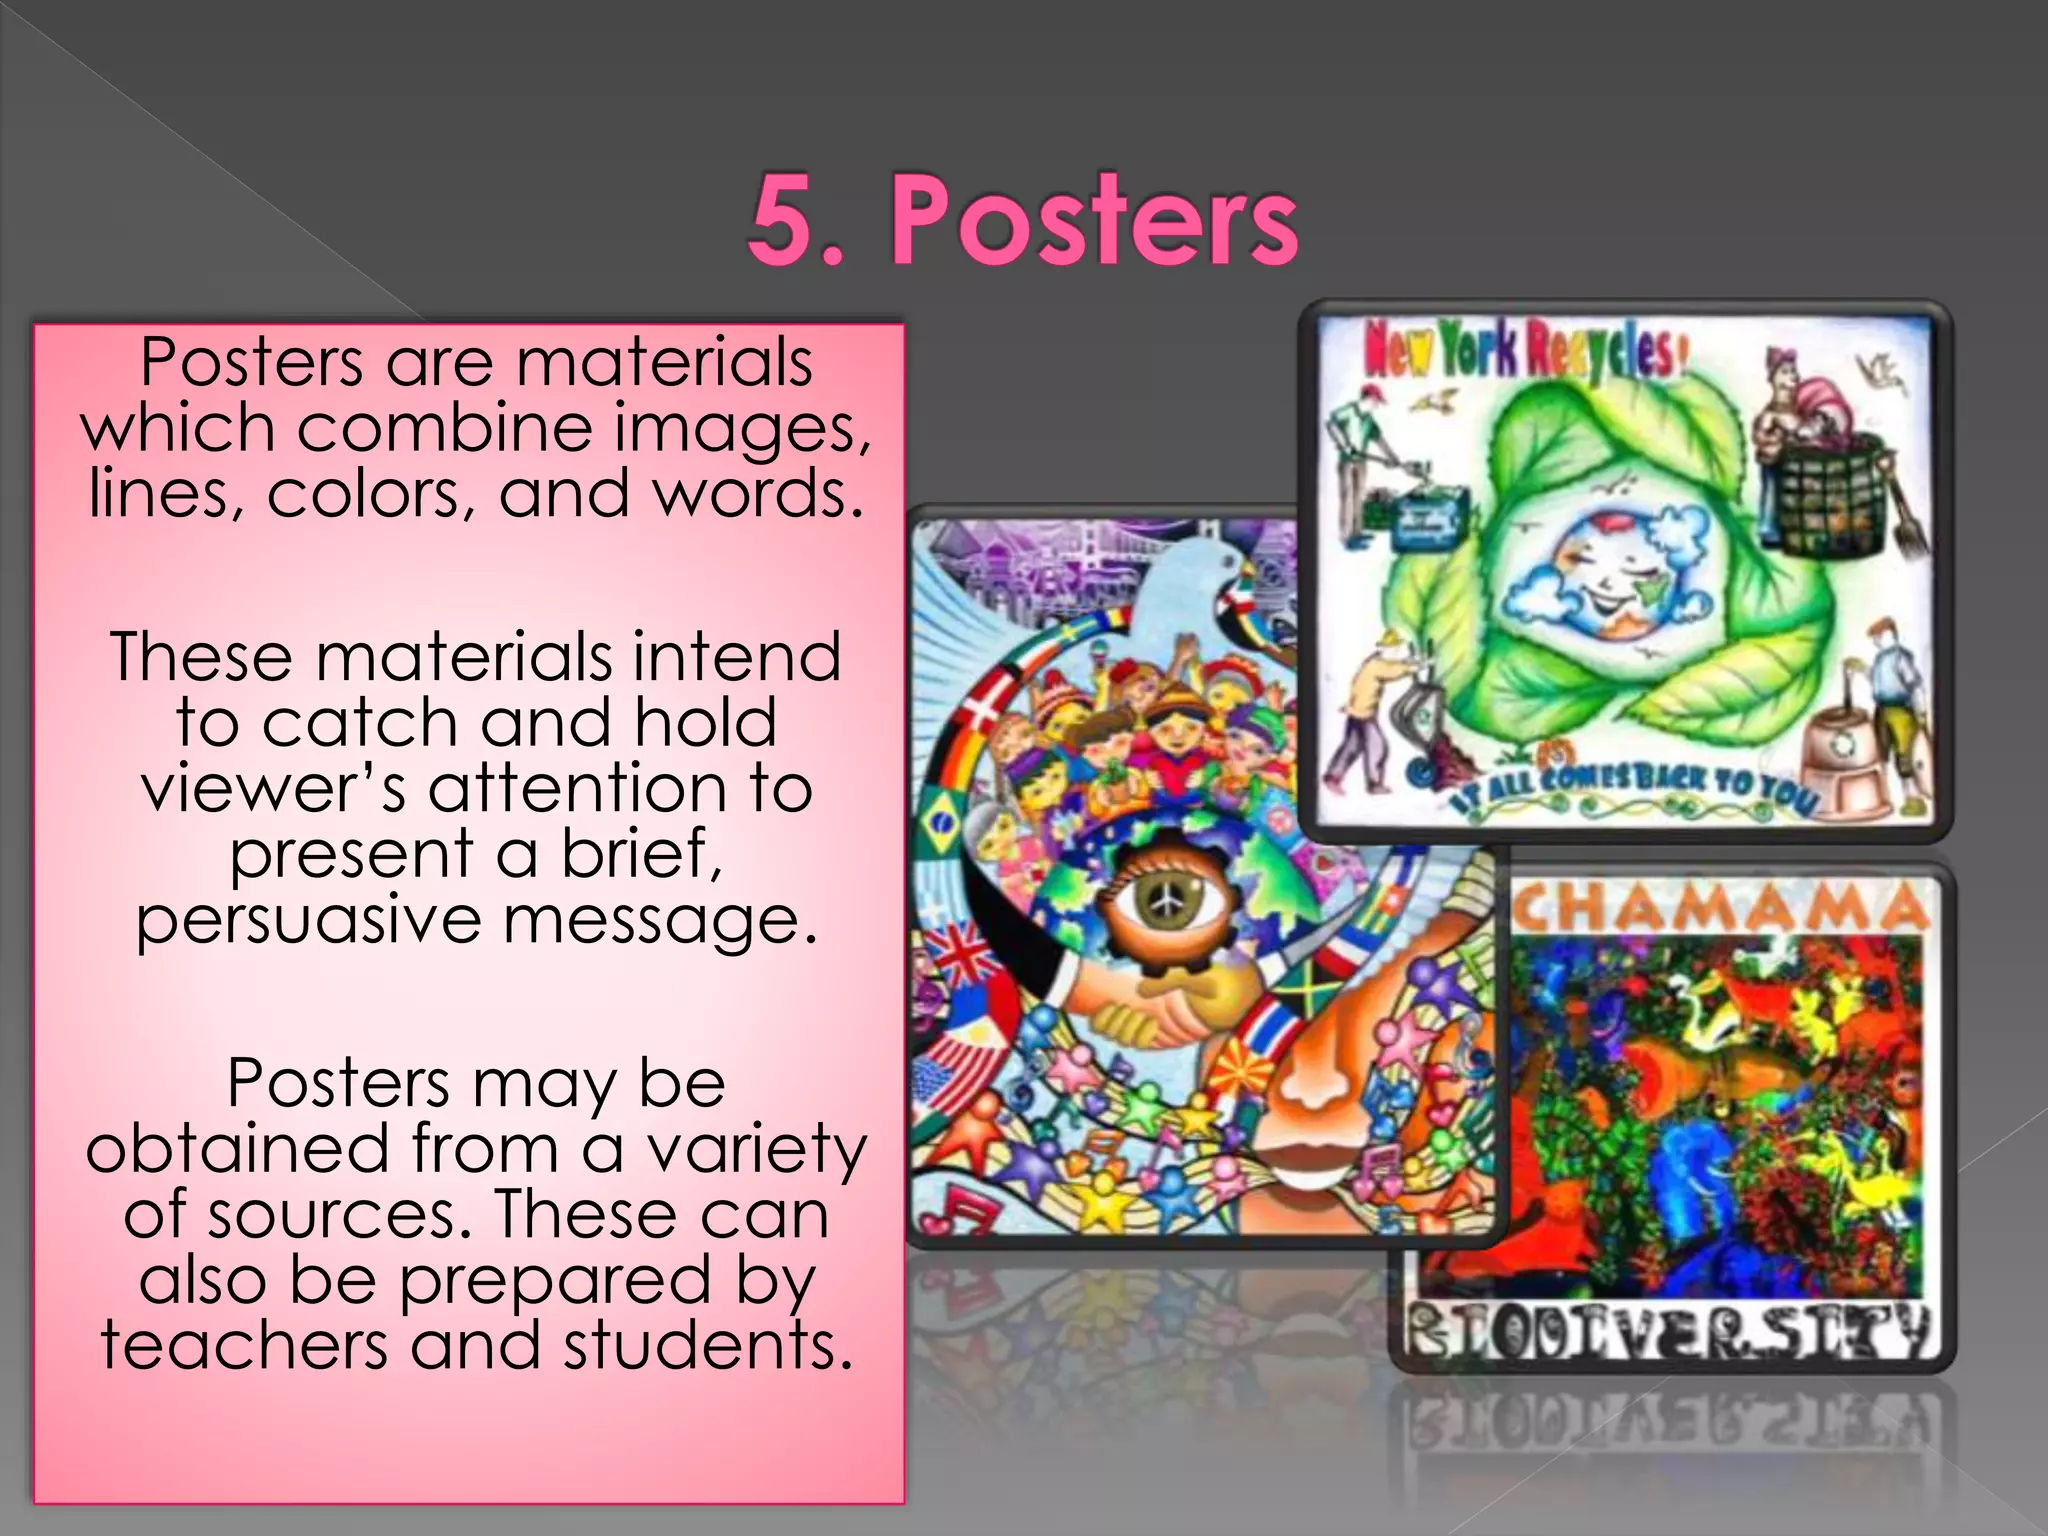
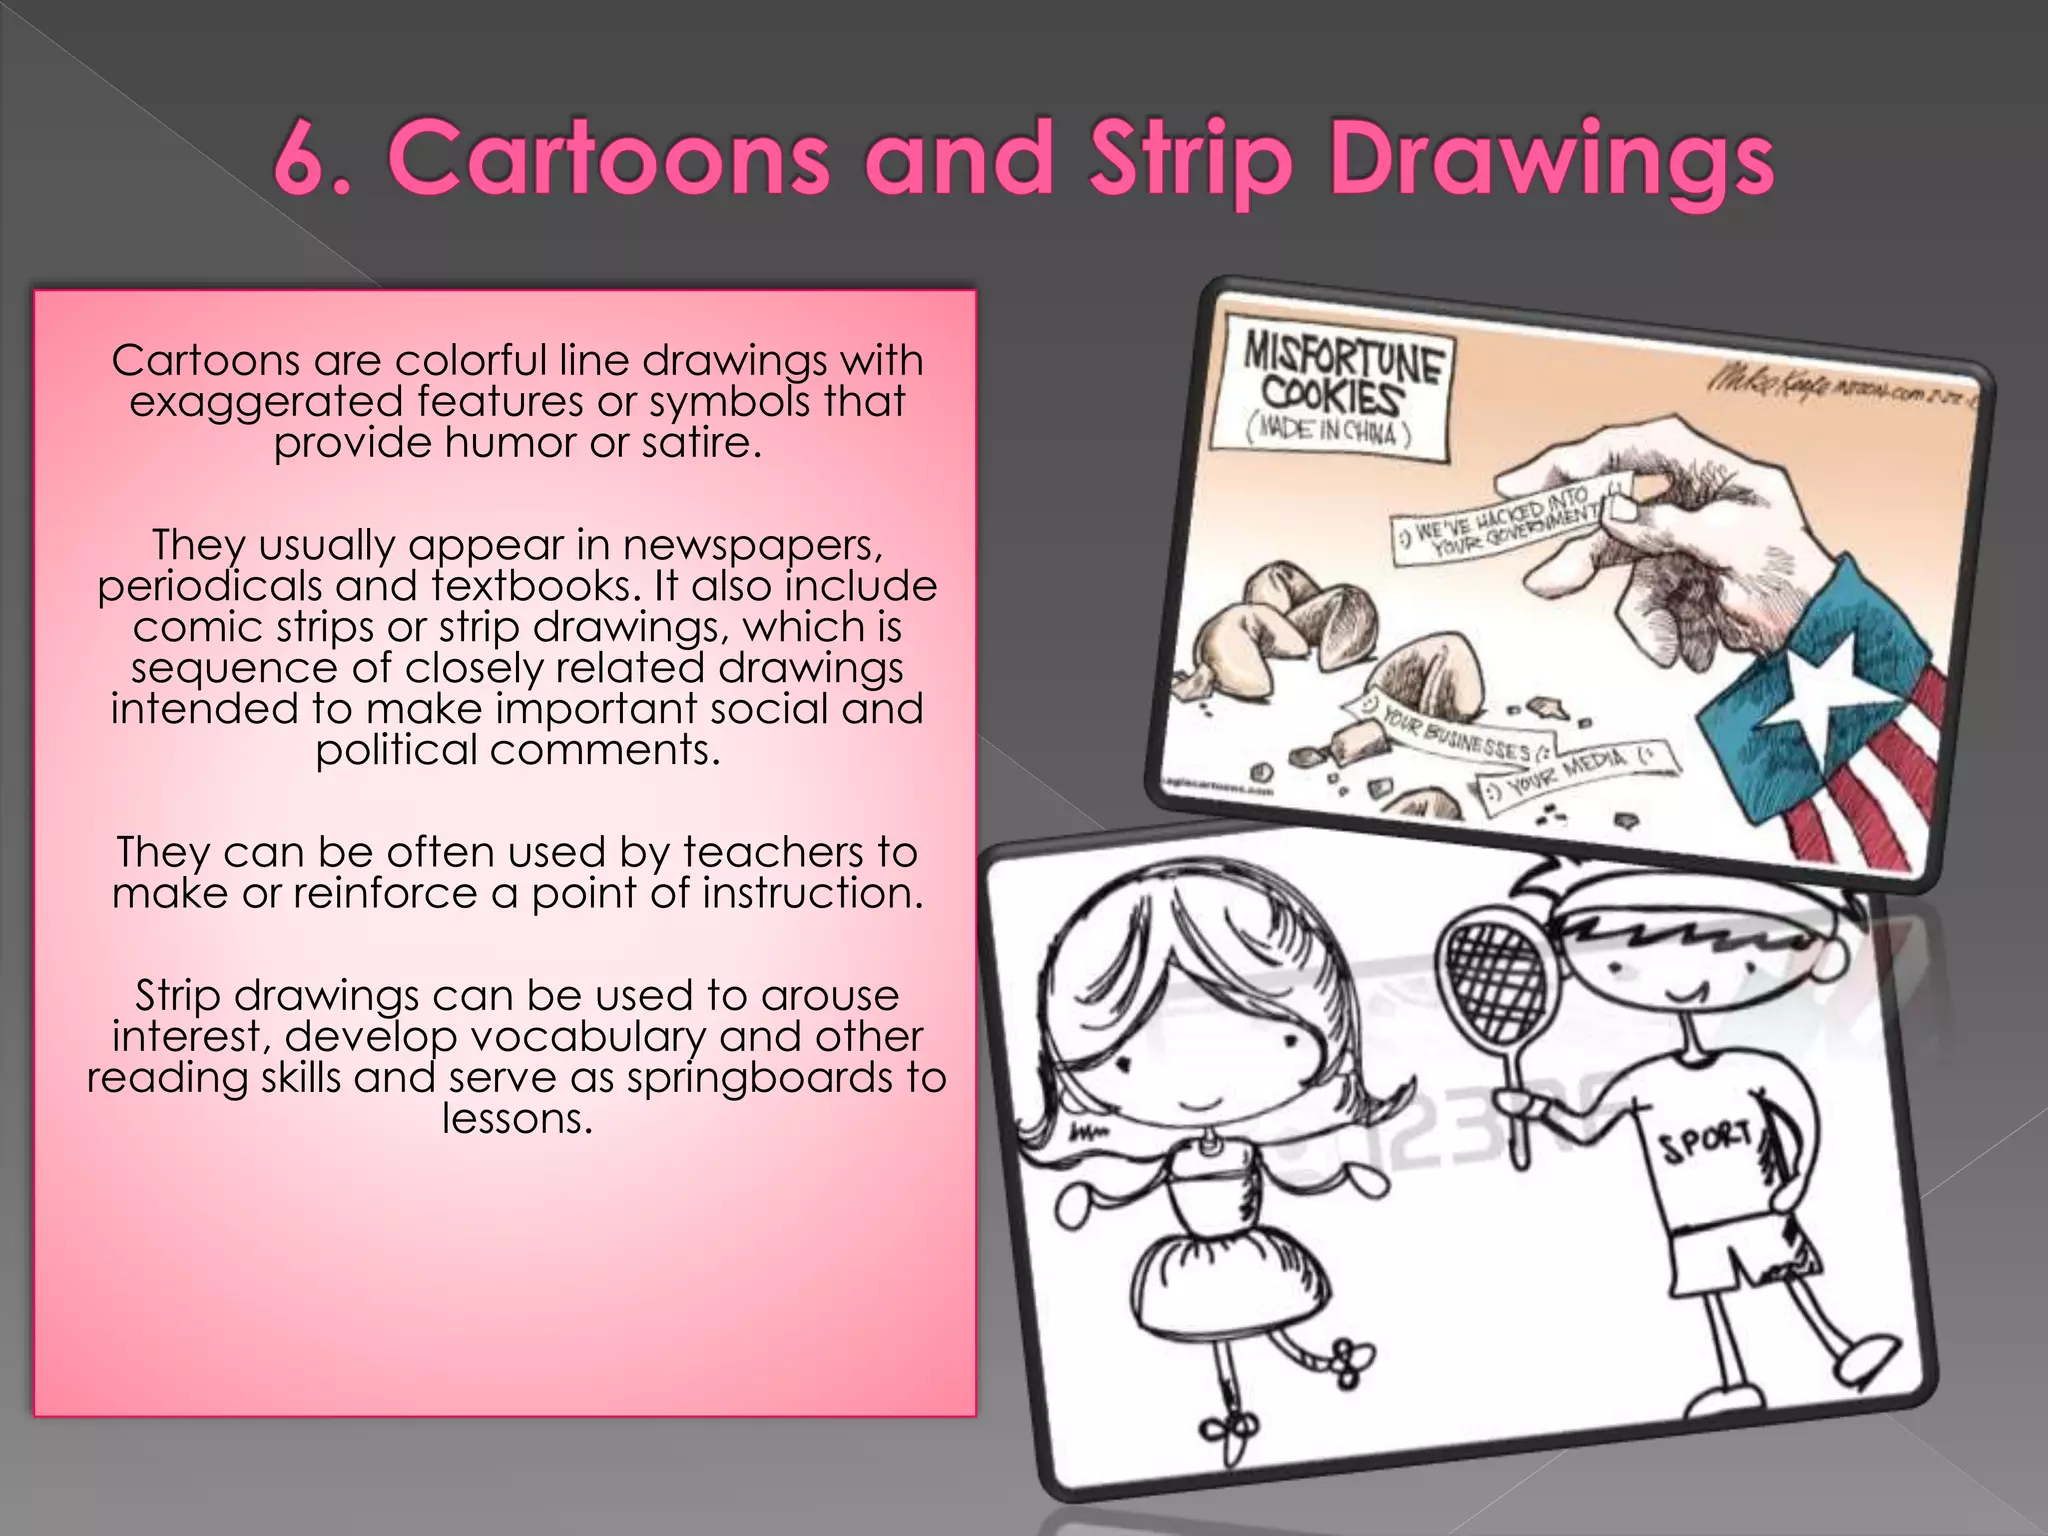
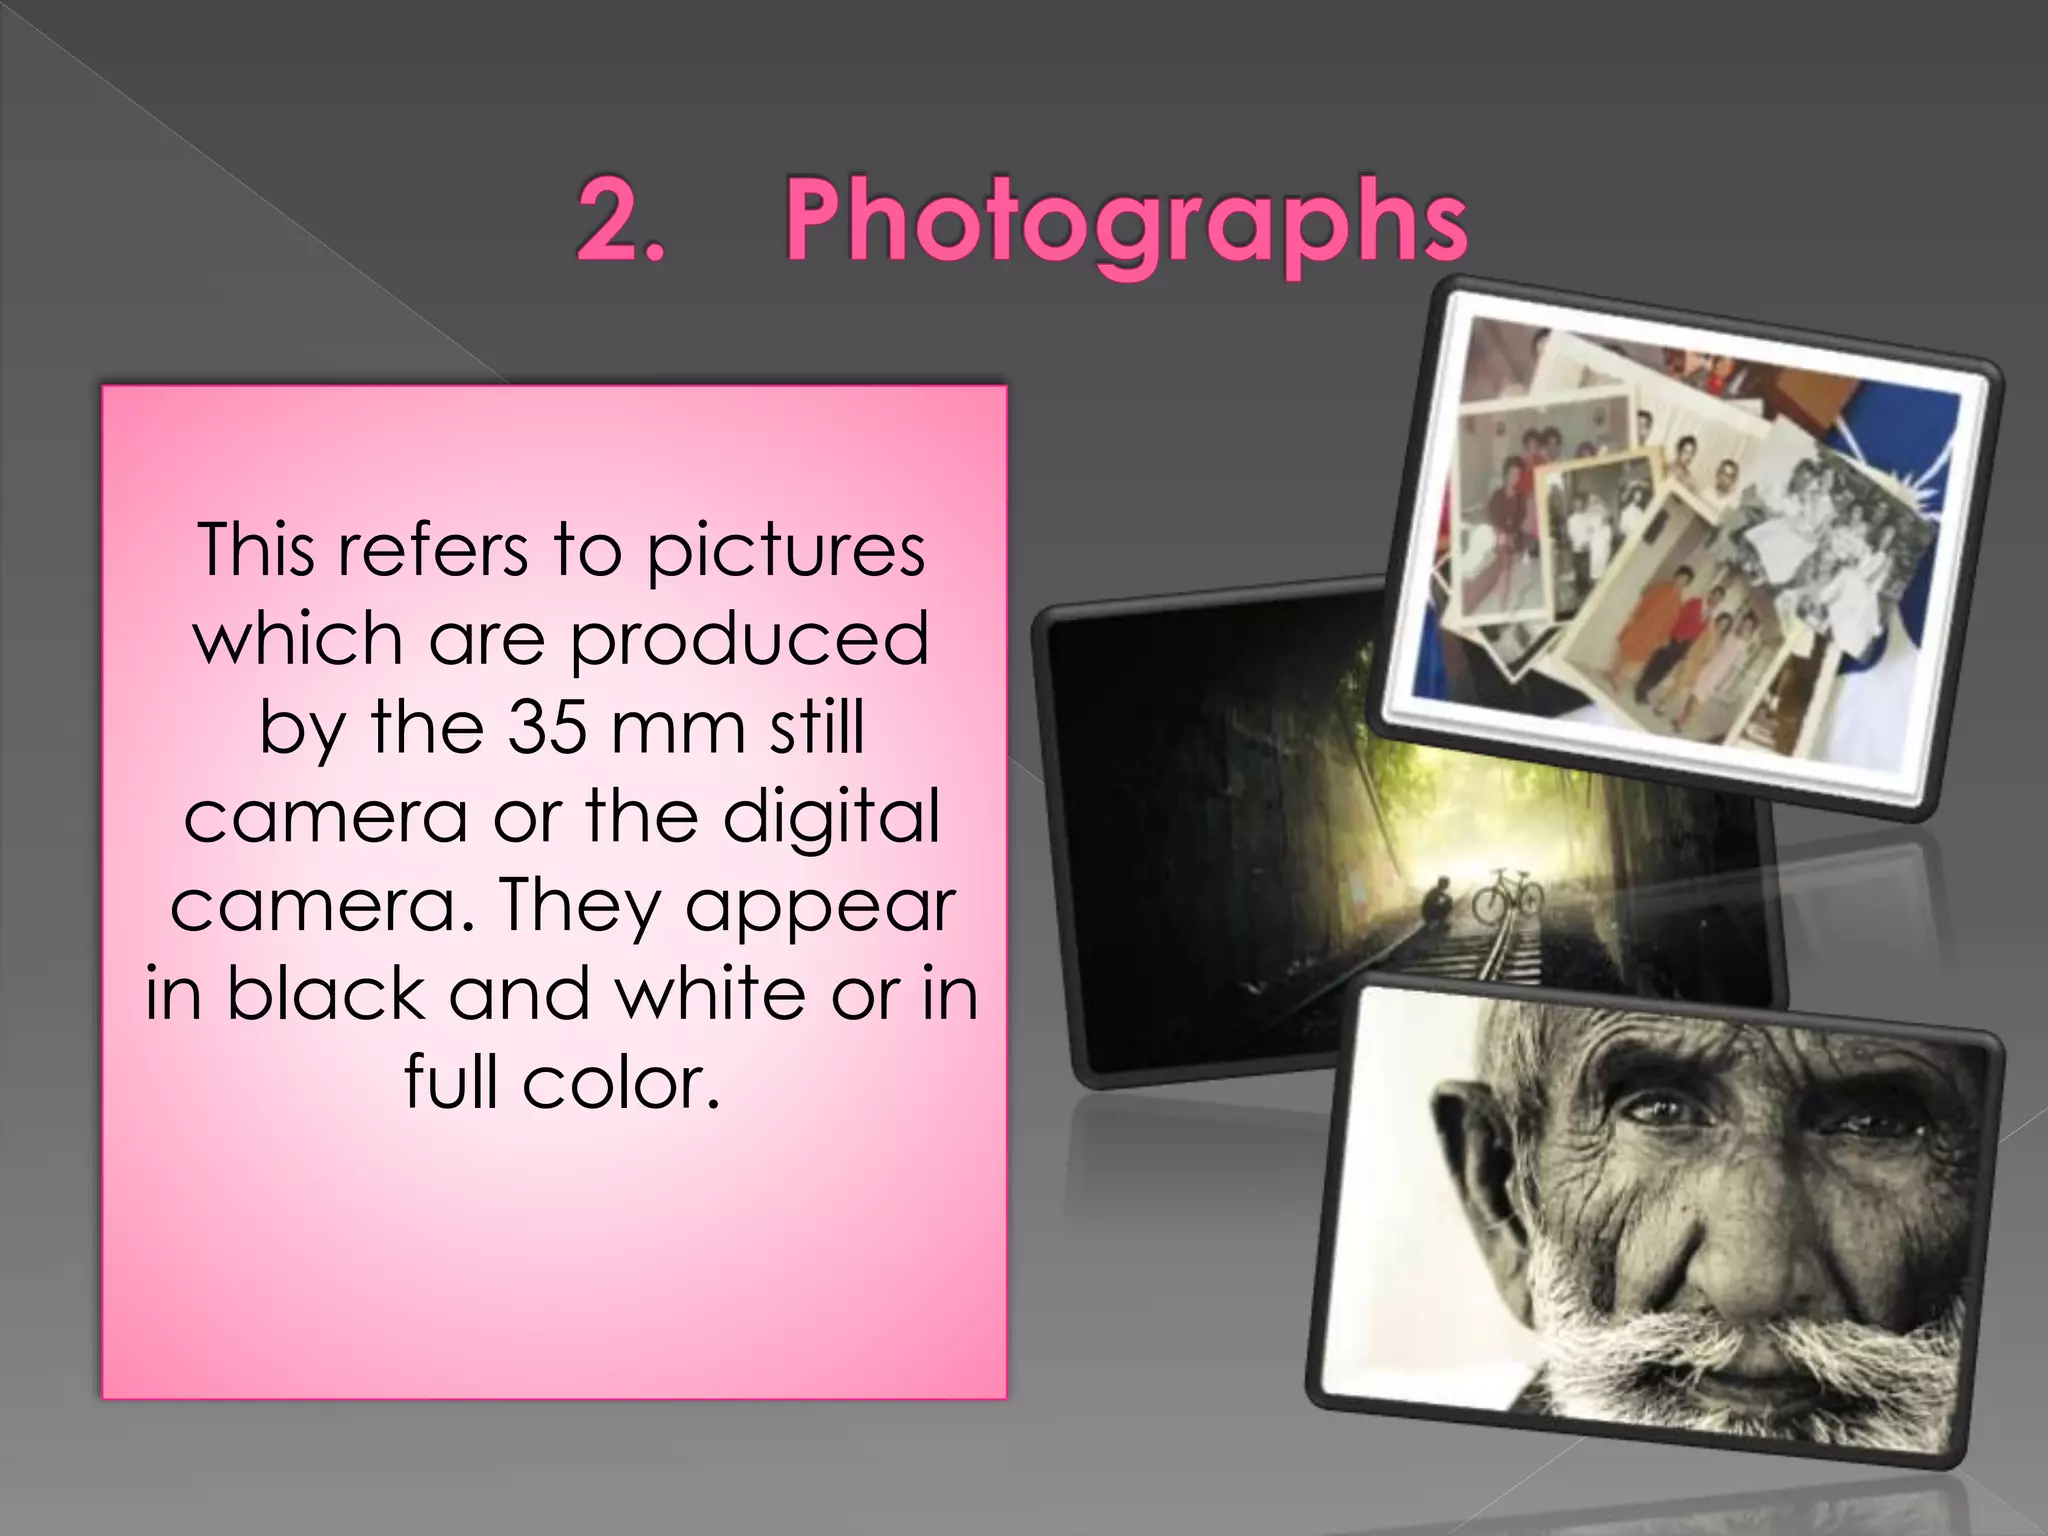
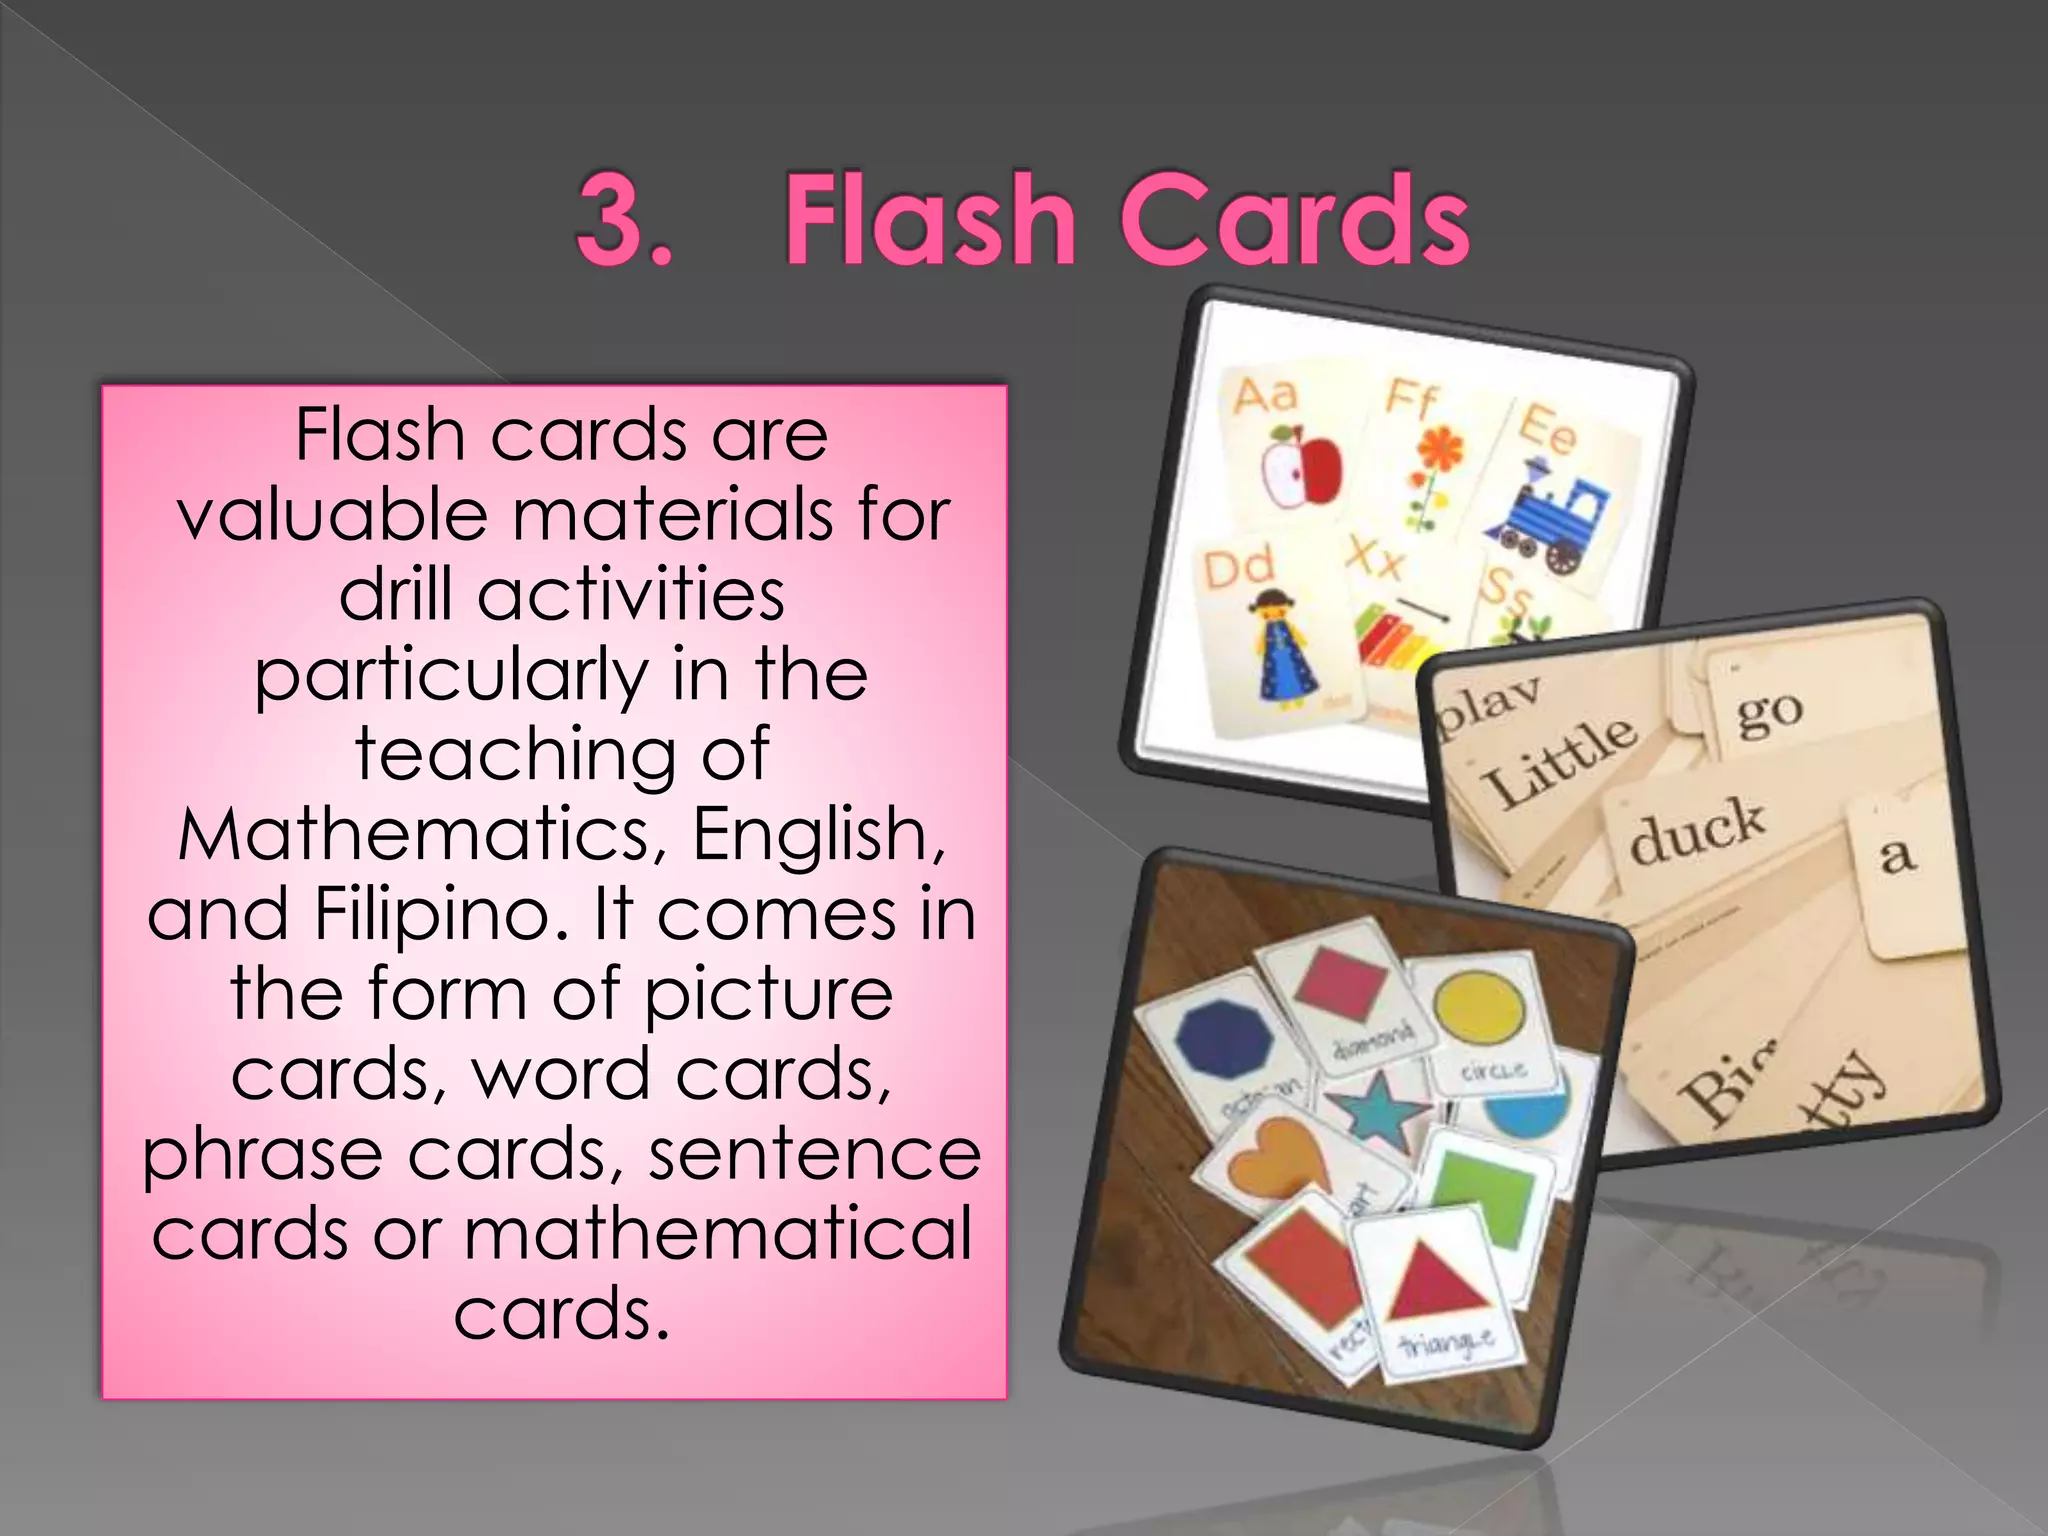
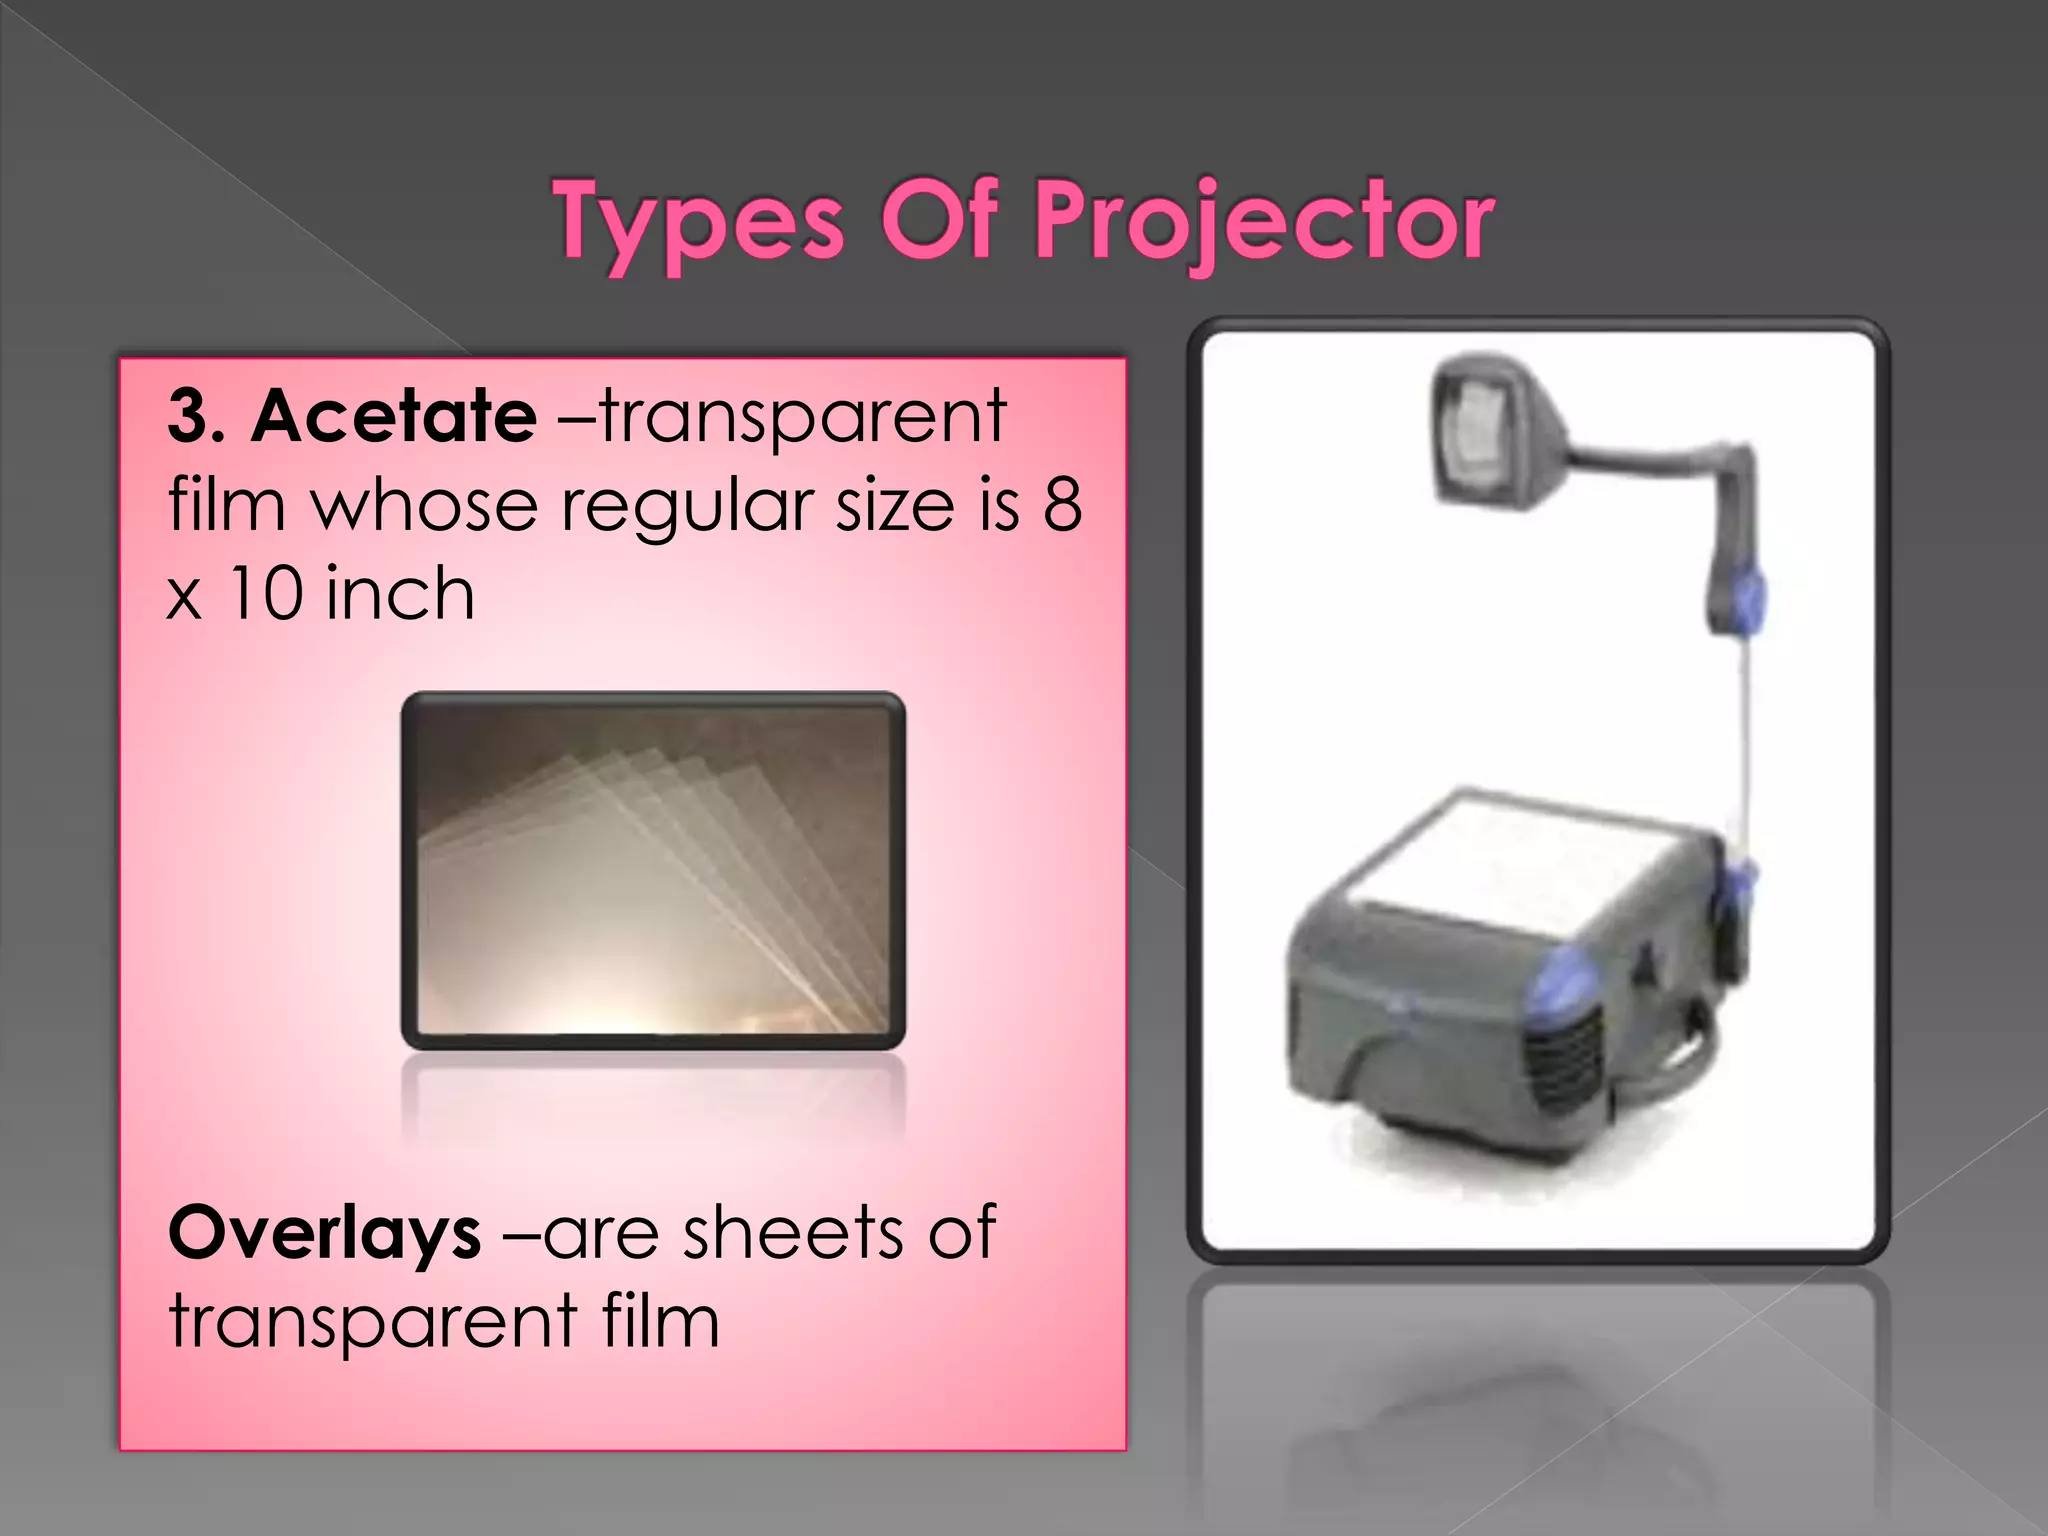
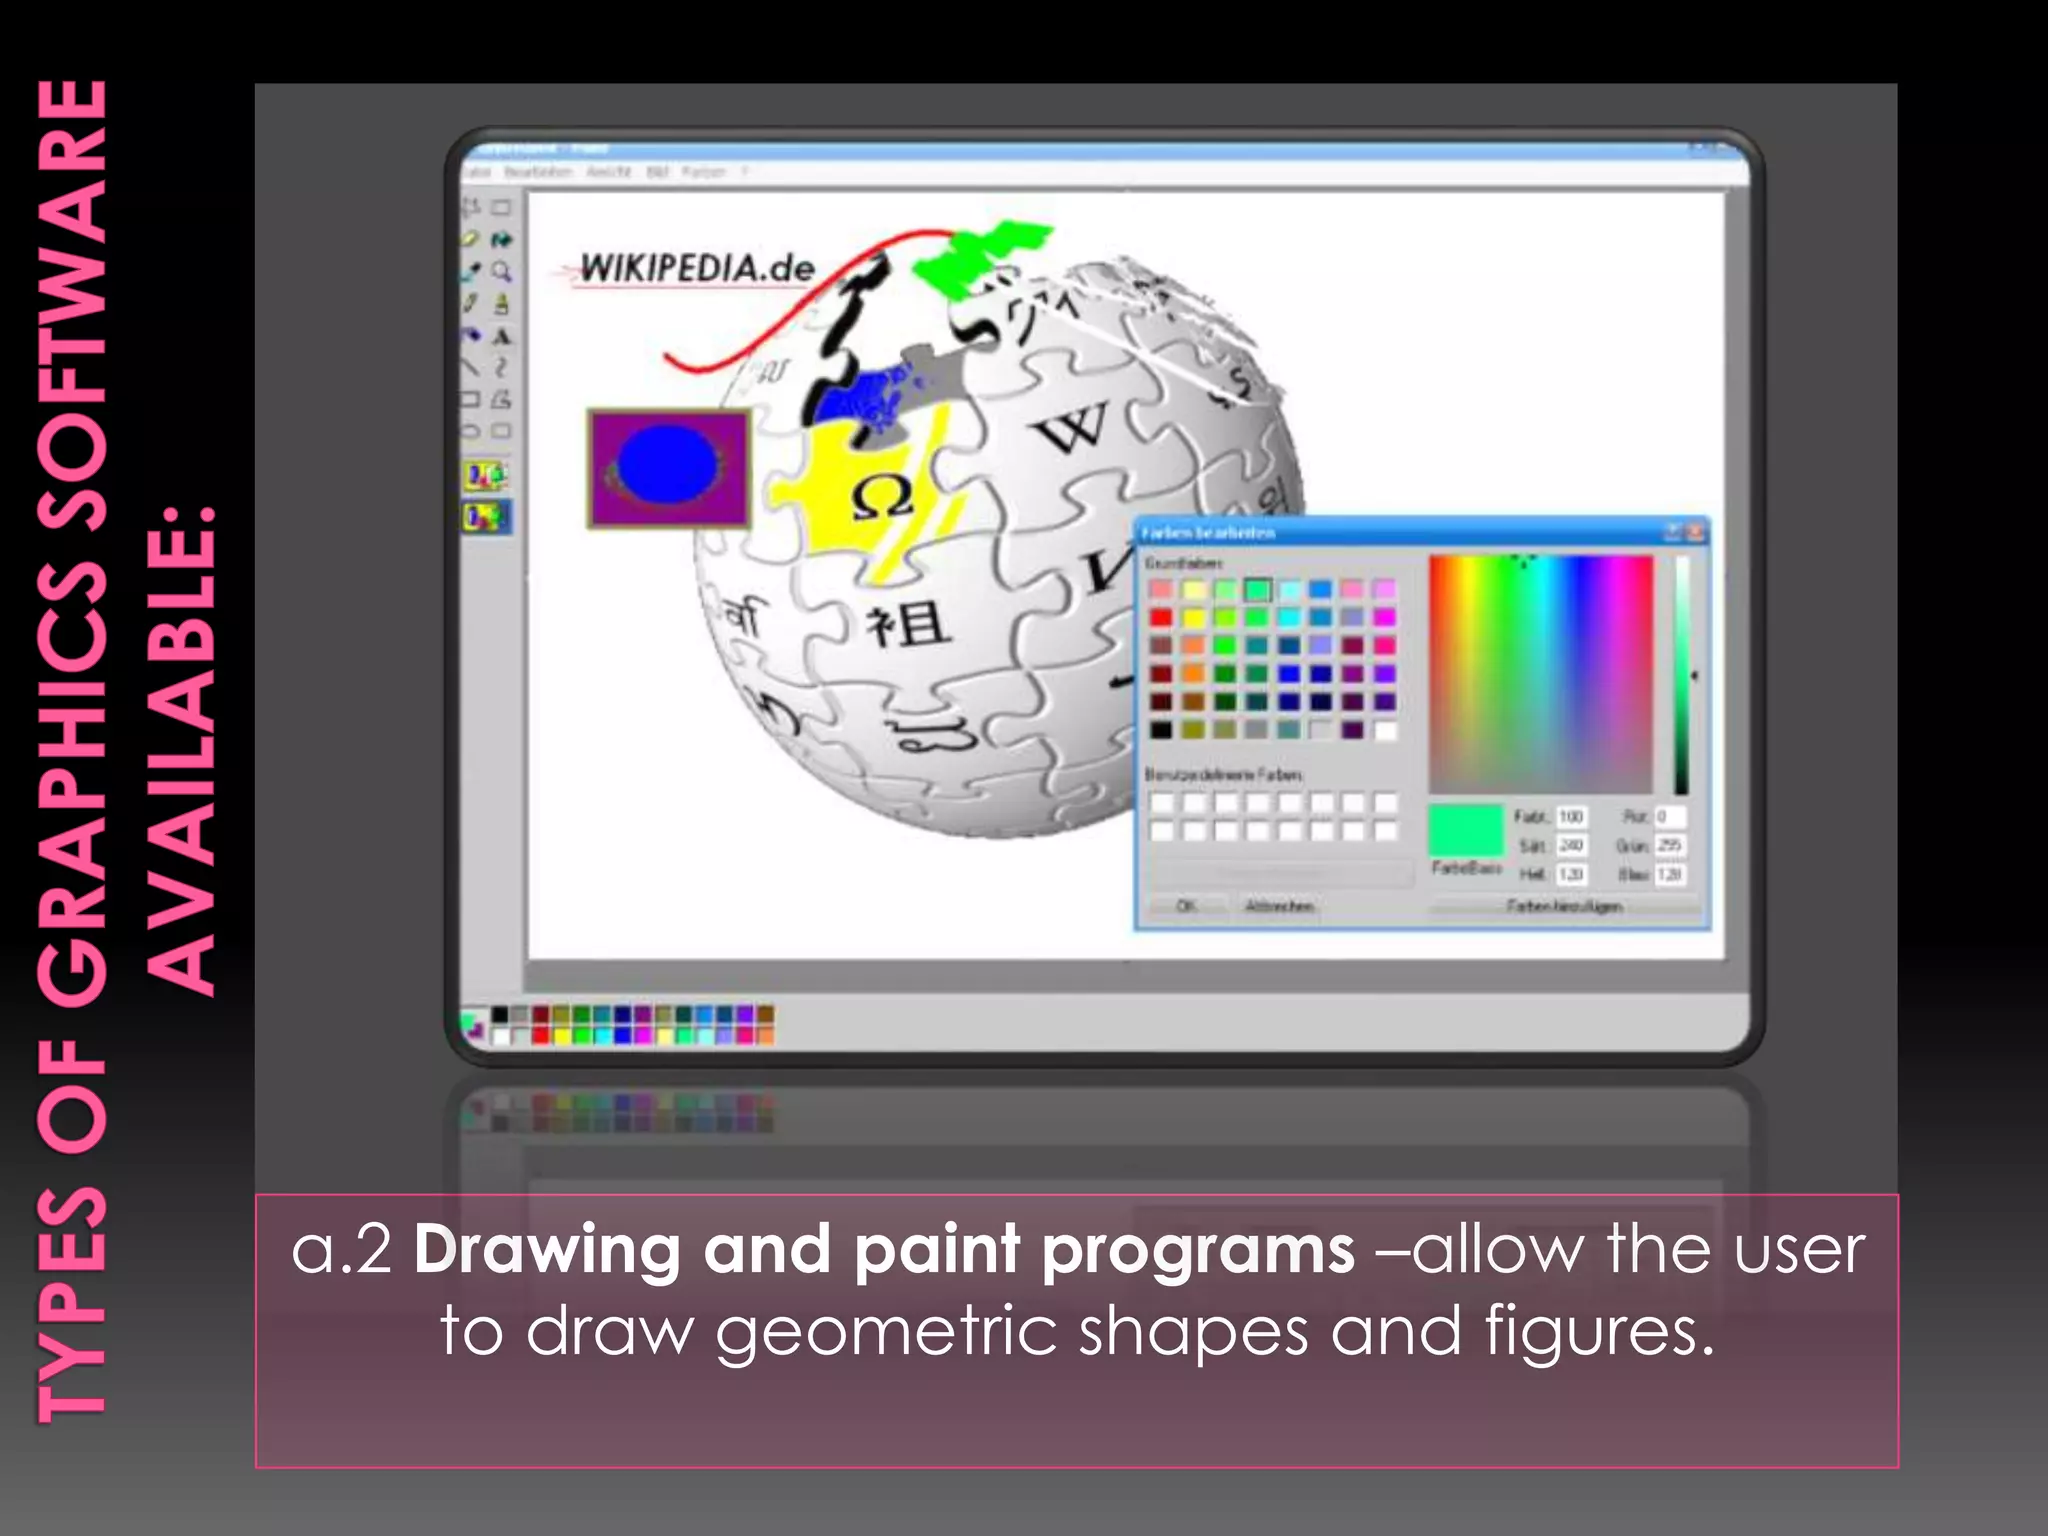

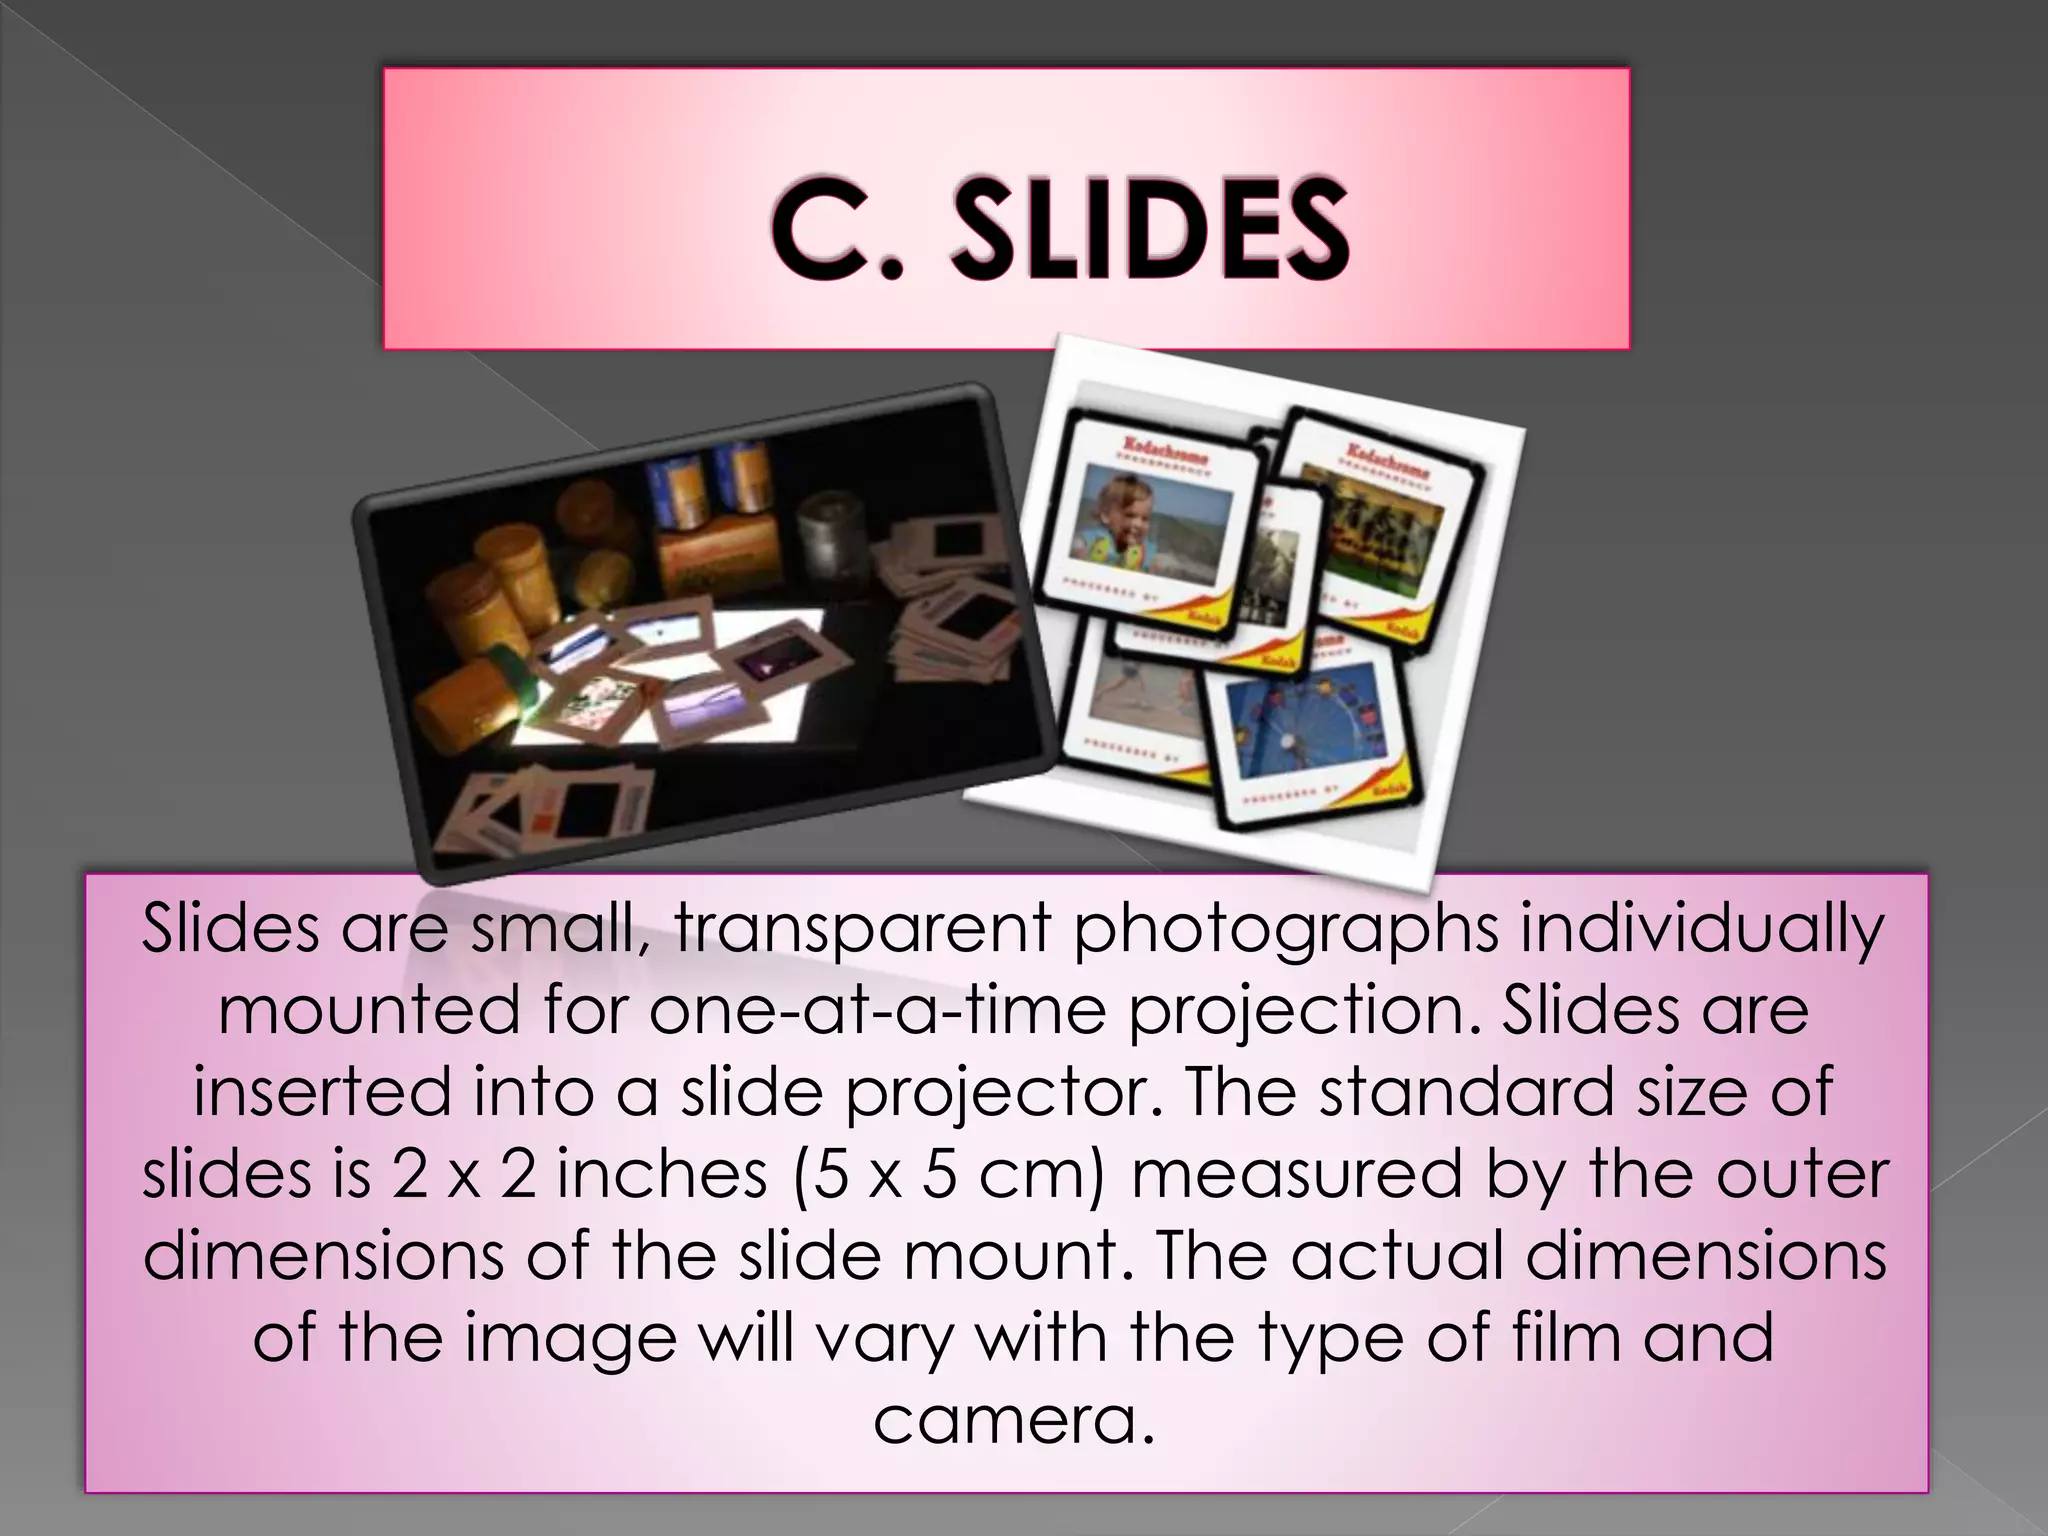
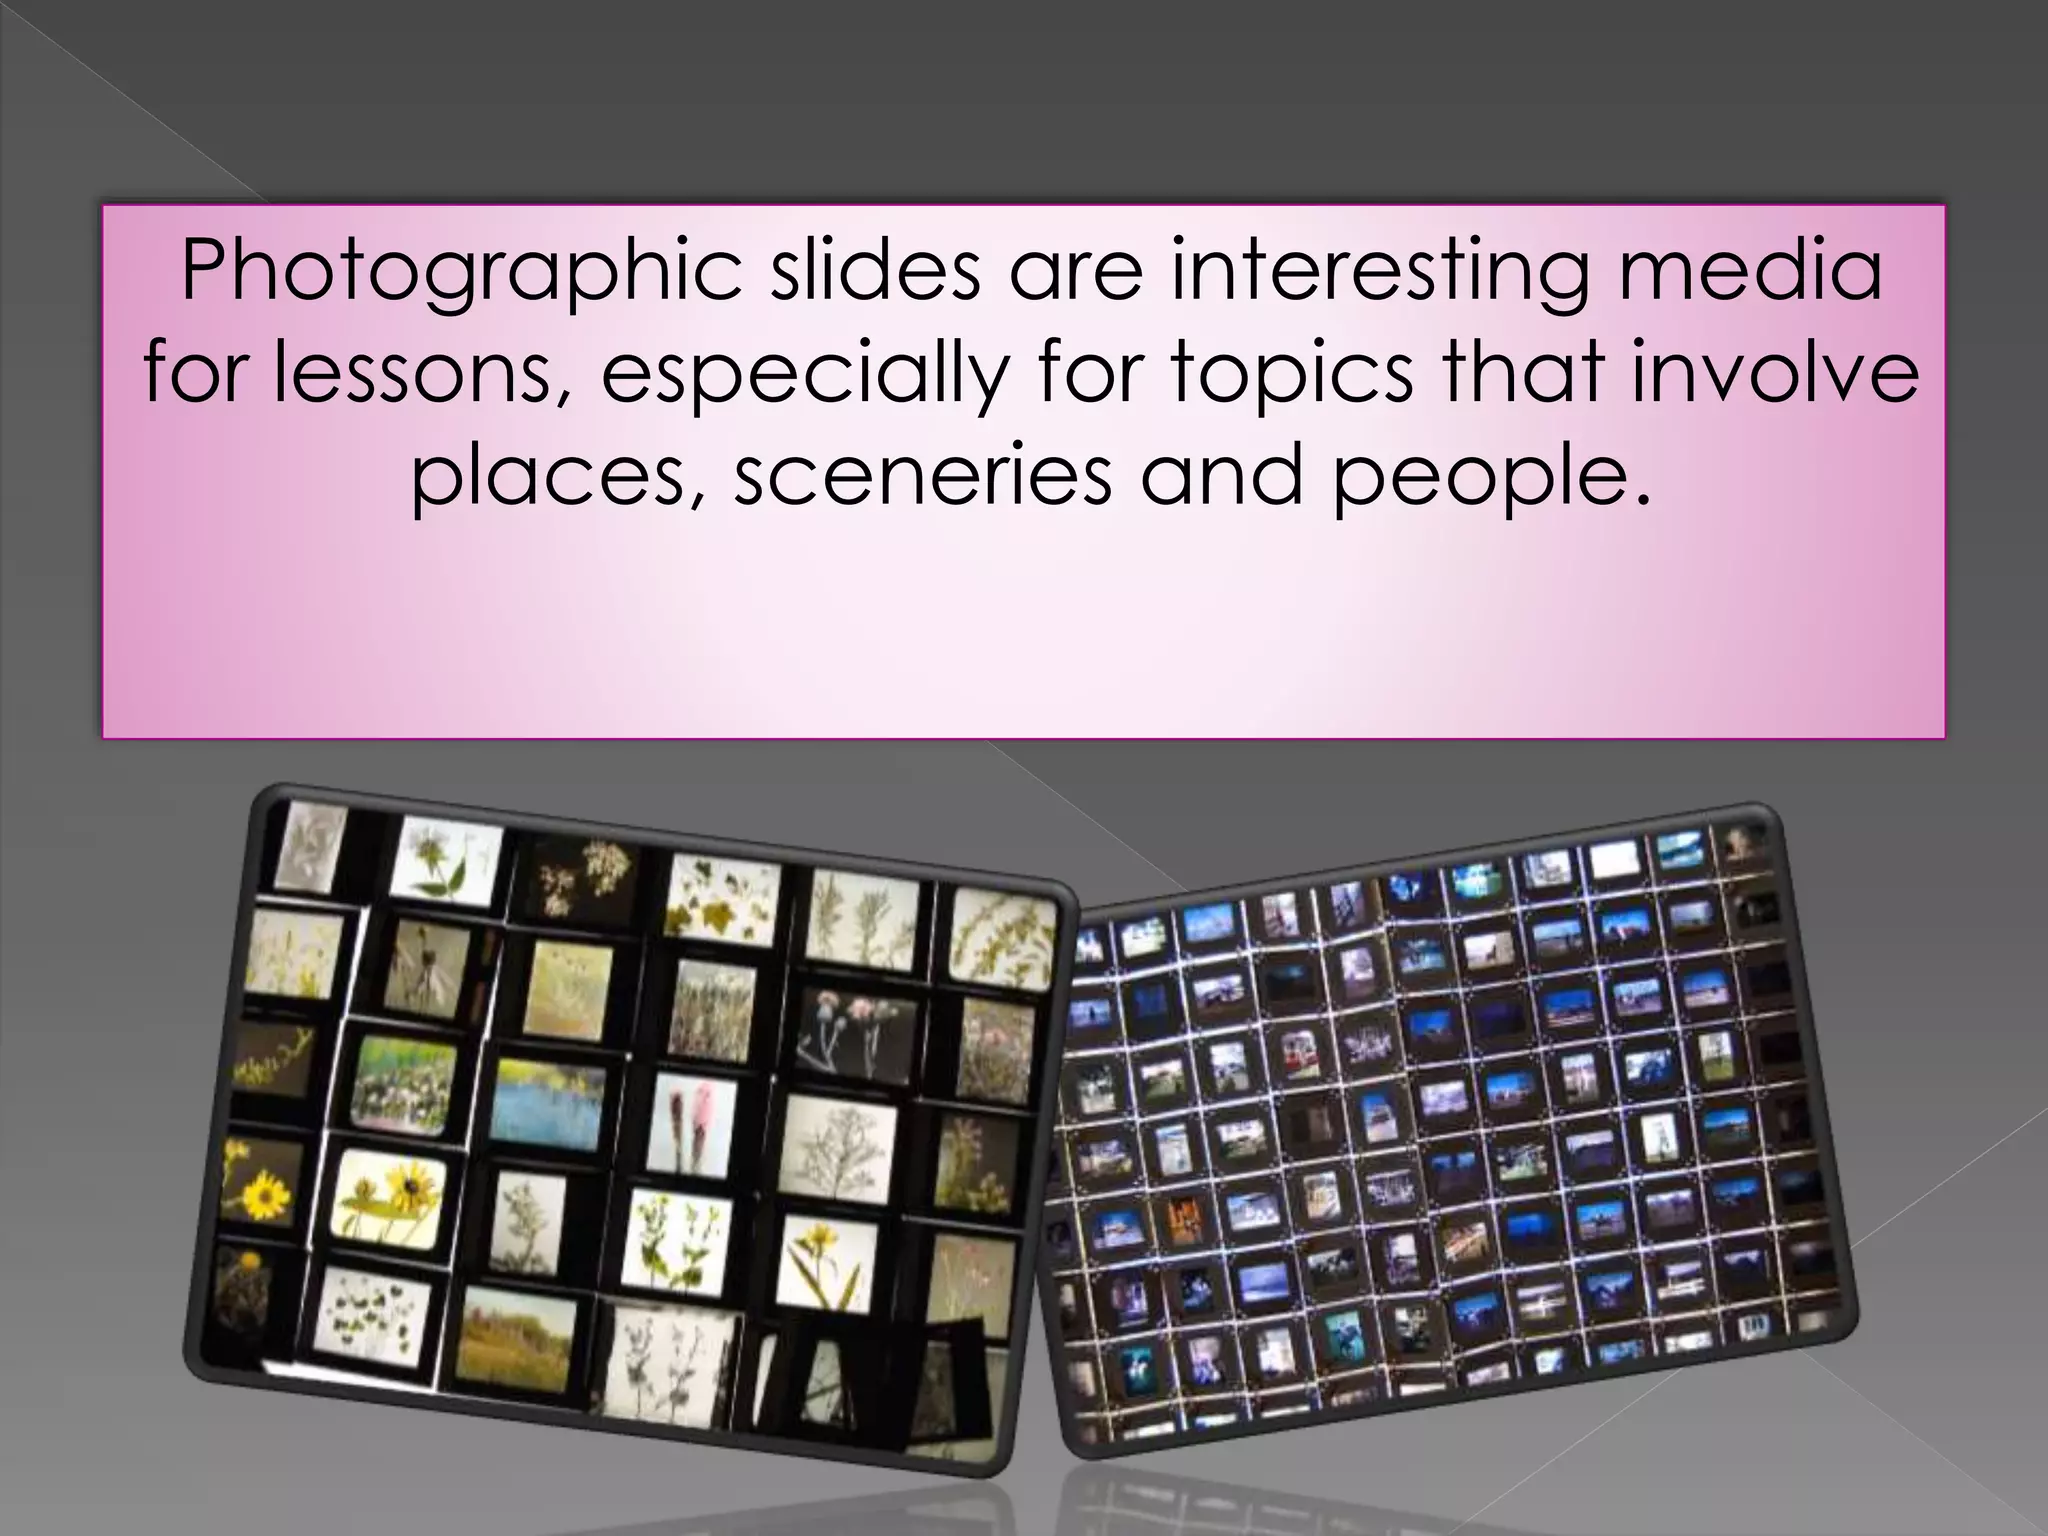

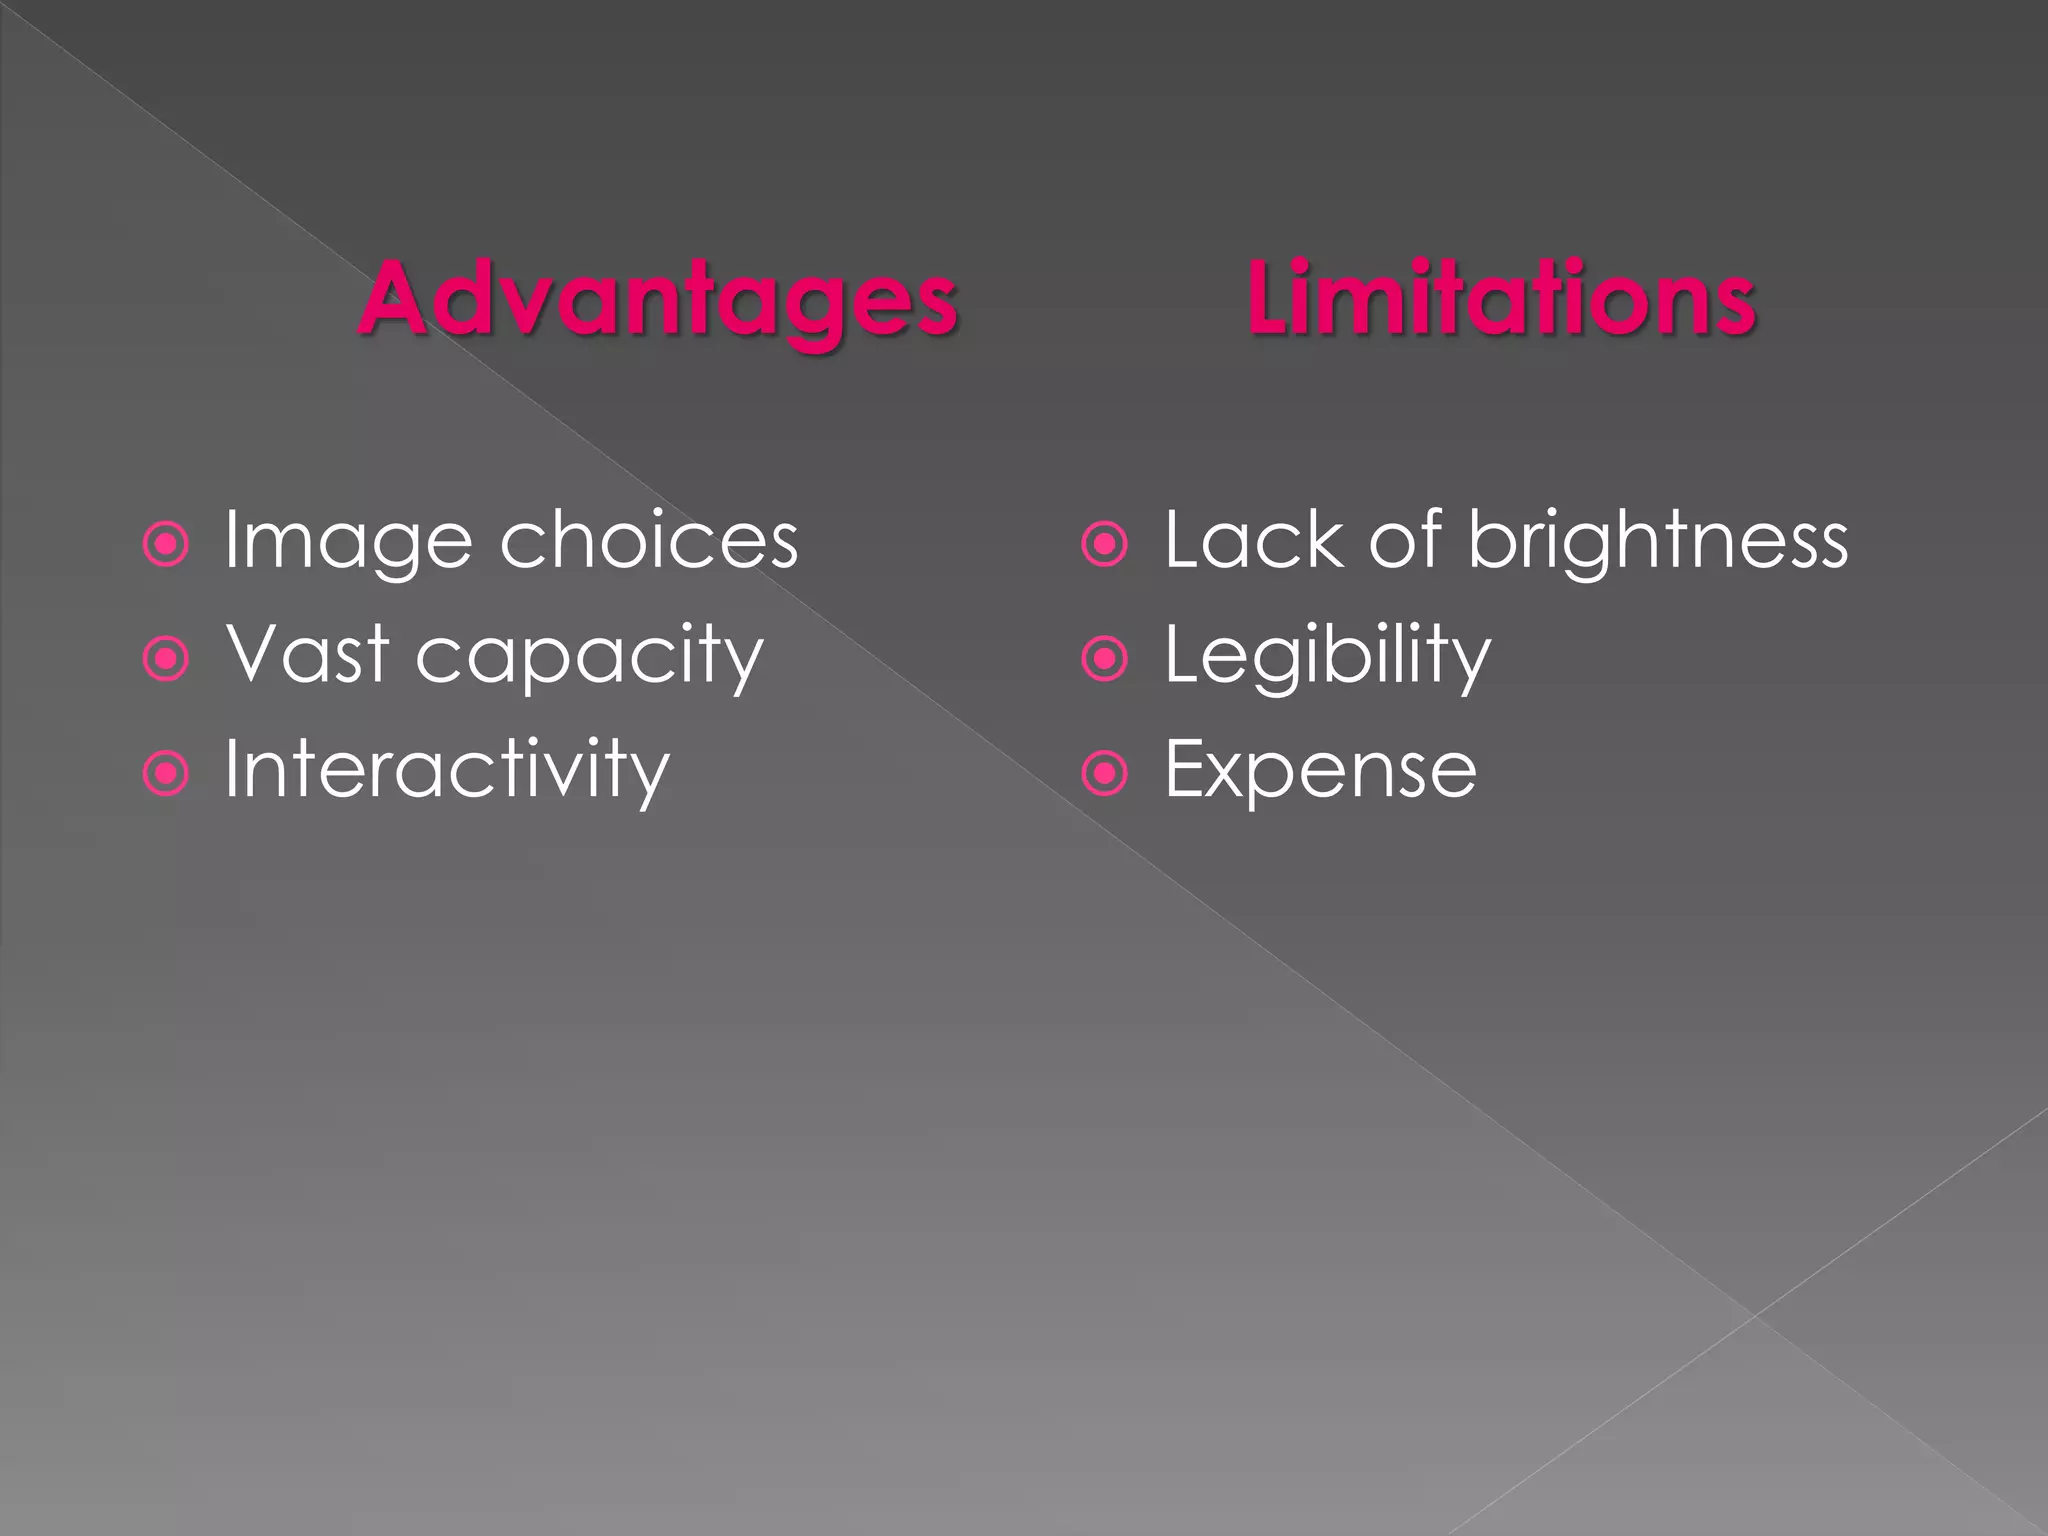


This document discusses different types of visual aids that can be used as educational tools. It defines visual aids as materials that aid learning through visual representation. Non-projected visuals like drawings, illustrations, charts, diagrams, graphs, posters, cartoons, pictures, photographs and flash cards are described. They allow abstract concepts to be presented concretely and stimulate creative expression. Each type of visual aid has advantages like being engaging, easy to use and inexpensive, though some have limitations like potential for misinterpretation.