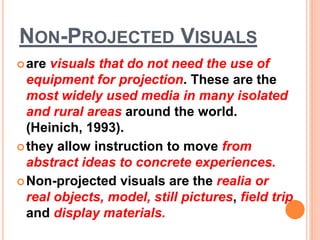
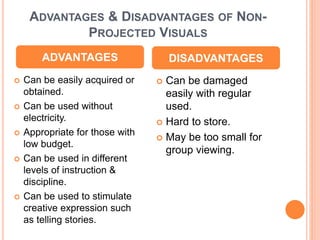
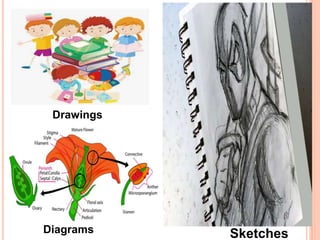
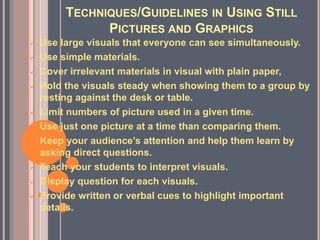
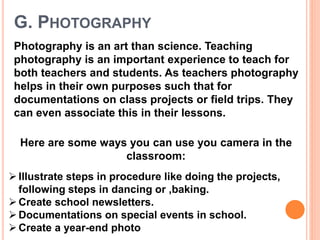
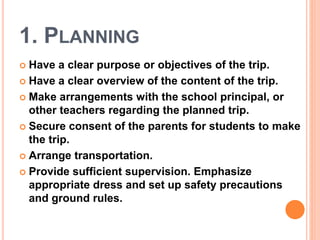
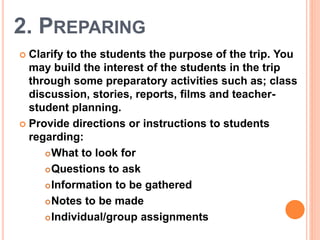
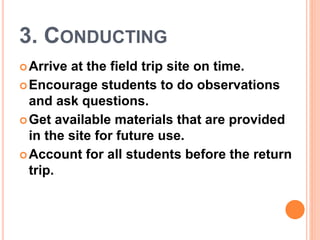
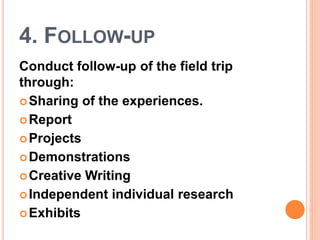
NON-PROJECTED
VISUALS
Reporter:
LAGUIDAO, ALVIN S.
BSEd Mathematics 3
NON-PROJECTED VISUALS
are visuals that do not need the use of
equipment for projection. These are the
most widely used media in many isolated
and rural areas around the world.
(Heinich, 1993).
they allow instruction to move from
abstract ideas to concrete experiences.
Non-projected visuals are the realia or
real objects, model, still pictures, field trip
and display materials.
ADVANTAGES & DISADVANTAGES OF NON-
PROJECTED VISUALS
 Can be easily acquired or
obtained.
 Can be used without
electricity.
 Appropriate for those with
low budget.
 Can be used in different
levels of instruction &
discipline.
 Can be used to stimulate
creative expression such
as telling stories.
 Can be damaged
easily with regular
used.
 Hard to store.
 May be too small for
group viewing.
ADVANTAGES DISADVANTAGES
I. REALIA OR REAL OBJECTS
Real objects such as coins, plants, and
animals that are more accessible for
educational use. These objects are the
instructional aids most closely associated
with Dale’s Cones of Experience. Real
objects are very ideal for the students to
learn new subjects.
II. MODEL
It can be a 3-dimensional
representation of a person or a
thing, it can be larger, smaller
or the same size as the object it
represents. It may be competed
with details or maybe simplified
for instructional purposes.
An example of
a model of the
rice terraces
(up) that is
used in social
sciences
courses. Ant
(down) the
model of the
solar systems
that is used for
science class
TECHNIQUES FOR USING REAL
OBJECTS AND MODEL
 Familiarize the object or the model before using it
to the classroom.
 Practice how to use the object or model, if it is a
working one make sure to know how it works.
 Real objects must be large enough to be seen but
not to big or heavy that can be distracting.
 Show and demonstrate the object or model when
necessary and cover it when not needed.
 Use size, colour slide or visuals to represents the
object to be present. Make sure not to make any
confusion between the real object and the
representations that is being present.
 Walk around the classroom and briefly show to
everyone the object to avoid any distractions.
Passing the object is not a good practice.
III. MOBILE
A mobile is a three-dimensional materials
that are hung independently from the roof
using fine threads.
IV. STILL PICTURES & GRAPHICS
These are the photograph-like
representations of people, places and
things.
TYPES OF STILL GRAPHICS
 Drawings including Sketches and Diagrams
 Charts
 Graphs
 Posters
 Cartoons
 Maps
 Photography
 It can translate abstract ideas into a more
realistic format
 It is readily available in books, magazines,
newspaper, catalogues, etc.
 It is easy to use because it does not require
any equipment.
ADVANTAGES:
LIMITATIONS:
 Some photograph are too small for group
purposes.
 Still pictures are two-dimensional
A. DRAWINGS, SKETCHES AND
DIAGRAMS
 This are graphic arrangement of lines that represents
persons, places, things and concepts.
Drawings – more complete and realistic, it can be
found easily on textbooks and other classroom
materials.
Sketches – this involves pencil to create figures or
pictures. They said that sketches are preliminary to
drawing.
Diagrams – usually intended to show parts of an
object and helps to explain process on how something
works of form
Drawings
SketchesDiagrams
B. CHARTS
 These are “a visual symbol summarizing,
comparing, contrasting or performing other
helpful services in explaining subject-matter.”
(Dale, 1969)
 Graphic representations of abstract
relationships such as chronologies, quantities
or hierarchies.
 It should have a well-defined instructional
purpose. In general charts must express only
one major concept or configurations of
concepts.
TYPES OF CHARTS
 Organizational Charts
 Classification Charts
 Time Line
 Flowcharts
 Tabular Charts
Organizational Charts
shows structure or chain of command in an organization such as school,
company, corporations, civic groups or government department. This also
shows interrelationship of personnel or departments.
Classification Charts
used chiefly to classify or categorize objects,
places or species.
Time Line
this shows chronological relationships
between events. They mostly shows the
historical events in sequence.
Flowcharts
also known as process charts which shows
sequence, procedure or a flow of process
Tabular Charts
these are tables contains numerical
information and data values.
C. GRAPHS
 Visual representation of numerical data.
 They also shows relationships among units of the
data.
 Its visually interesting and data can be interpreted
more quickly than in tabular form.
Some Uses of Graphs:
• Used to present statistical results
• Gives bird’s eye view of the compete information
• Used as an effective tool for comparing and
contrasting complicated facts.
TYPES OF
GRAPHS
 Bar Graphs
 Pictorial Graphs
 Pie Graphs
 Line Graphs
Bar Graphs
used for comparing similar items in different
categories or groups.
Pictorial Graphs
uses of drawing as representation instead of
numerical data.
Pie Graphs
a graphs uses to help you see the percentage of the
part to the whole, its uses percentage as the part.
Line Graphs
this uses in plotting trends that shows the
increase and decrease in data over time.
D. POSTERS
Posters are visual combinations of images,
lines, colors and words that are intended to
catch its viewers attention to communicate
a brief message.
They can be also used to stimulate interest
for events and new topics.
Characteristic of a Poster
Uses of Posters
Suggestion for Preparing Posters
E. CARTOONS
 The most common and popular visual to
learners, a rough caricatures of real people,
objects, animals and events. Cartoons appeal
very well to the learners of all ages.
F. MAPS
To show the geographical
features of the earth surface.
To show relationships between
places.
An accurate representation of the pane
surface in the form of diagram drawn to scale.
Uses of Maps:
TYPES OF MAPS
Road Map
Physical Map
Topographic Map
Political Map
Climate Map
Resource Map
Thematic Map
Road Map
most commonly map used for navigation.
Physical Map
shows the landscape and features of specific
area such as lakes, mountains, and seas.
Topographic Map
same as physical map but its uses lines to
show changes in elevation.
Political Map
shows location and names of important
cities, this is usually used for student’s
references.
Climate Map
a type of maps
usually for
weather reports,
this shows
information such
as average rainfall
and temperatures.
Resource Map
Shows the
economic activities
or resource that
can be found in a
particular area.
Thematic Map
shows theme or
topic in a particular
area.
TECHNIQUES/GUIDELINES IN USING STILL
PICTURES AND GRAPHICS
 Use large visuals that everyone can see simultaneously.
 Use simple materials.
 Cover irrelevant materials in visual with plain paper,
 Hold the visuals steady when showing them to a group by
resting against the desk or table.
 Limit numbers of picture used in a given time.
 Use just one picture at a time than comparing them.
 Keep your audience’s attention and help them learn by
asking direct questions.
 Teach your students to interpret visuals.
 Display question for each visuals.
 Provide written or verbal cues to highlight important
details.
G. PHOTOGRAPHY
Photography is an art than science. Teaching
photography is an important experience to teach for
both teachers and students. As teachers photography
helps in their own purposes such that for
documentations on class projects or field trips. They
can even associate this in their lessons.
Here are some ways you can use you camera in the
classroom:
Illustrate steps in procedure like doing the projects,
following steps in dancing or ,baking.
Create school newsletters.
Documentations on special events in school.
Create a year-end photo
SELECTING PERFECT CAMERA
 Cell phones & Smartphones
Point and Shoot
EVIL Camera
(Electronic Viewfinder with
Interchangeable Lens)
DSLRs
(Digital Single Less Reflex)
BASIC CAMERA
PARTS
 Lens
 Viewfinder
 Body
 Shutter Release
 Aperture
 Image Sensor
 Memory Card
 LCD Screen
 Flash
 User’s Control
TECHNICAL TERMS
IN PHOTOGRAPHY
 Pixels
 Megapixels
 Zoom
 White Balance
POINTERS TO CONSIDER IN
PHOTOGRAPHY
 Rule of Thirds
 Balancing Elements
 Leading Lines
 Symmetry and Patterns
 Viewpoint
 Background
 Depth
 Framing
 Cropping
 Experimentations
V. FIELD TRIPS
Field trips is an excursion outside the
classroom. Usually this takes place outside
the classrooms or schools to visit other
places to study on great people or real
objects and also to have a first-hand
experience or encounter on the phenomena
that cannot be brought to schools.
FIELD TRIPS MAY INCLUDES:
Trip of a few minutes into the school
field/garden.
Going to other building within the school.
Visit to different department
offices/departments within the campus.
A day trip to historical places, zoos,
museums and parks.
FIELD TRIPS PURPOSES
(HEINRICH,1993)
 Provide enrichment of factual information read in
textbooks and make words on the printed page more
meaningful.
 Improve attitudes, expand understanding and increase
skills.
 Provide first hand experiences with objects, places,
situations and human relationships that cannot be
provided in the classroom.
 Sharpen awareness of the students’ environment.
 Expose student to careers that they might want to
pursue.
 Blend the classroom, the immediate community and a
larger world into a more meaningful whole.
CONDUCTING A FIELD TRIP
1. PLANNING
 Have a clear purpose or objectives of the trip.
 Have a clear overview of the content of the trip.
 Make arrangements with the school principal, or
other teachers regarding the planned trip.
 Secure consent of the parents for students to make
the trip.
 Arrange transportation.
 Provide sufficient supervision. Emphasize
appropriate dress and set up safety precautions
and ground rules.
2. PREPARING
 Clarify to the students the purpose of the trip. You
may build the interest of the students in the trip
through some preparatory activities such as; class
discussion, stories, reports, films and teacher-
student planning.
 Provide directions or instructions to students
regarding:
What to look for
Questions to ask
Information to be gathered
Notes to be made
Individual/group assignments
3. CONDUCTING
Arrive at the field trip site on time.
Encourage students to do observations
and ask questions.
Get available materials that are provided
in the site for future use.
Account for all students before the return
trip.
4. FOLLOW-UP
Conduct follow-up of the field trip
through:
Sharing of the experiences.
Report
Projects
Demonstrations
Creative Writing
Independent individual research
Exhibits
CHARACTERISTICS OF A POSTER
The following characteristics identify a
posters from other graphics:
Words are minimal. Usually 4 or 5 only.
Layout of elements are simple and
arrange well.
Colors and text are efficient. Illustrations
are bold and lettering styles are simple.
Posters are attractive.
USES OF A POSTERS
Posters may use in many ways such as:
It motivates the students
Single ideas or subject are presented
It can publicized important school and
community projects and events
It captures attentions and conveys
message quickly
It gives a strong and lasting impressions.
SUGGESTIONS FOR PREPARING
POSTERS
To create an effective posters, the following
suggestions can be followed:
 Think of a theme
 Provide the title or the slogan that are most fitting
 Have a trial and error of the best layout of the
poster
 Gather every materials needed
 Finalize the design and gives some finishing
touch
THANK YOU
FOR
LISTENING!

Non-Projected Visuals Presentations

  • 1.
  • 2.
    NON-PROJECTED VISUALS are visualsthat do not need the use of equipment for projection. These are the most widely used media in many isolated and rural areas around the world. (Heinich, 1993). they allow instruction to move from abstract ideas to concrete experiences. Non-projected visuals are the realia or real objects, model, still pictures, field trip and display materials.
  • 3.
    ADVANTAGES & DISADVANTAGESOF NON- PROJECTED VISUALS  Can be easily acquired or obtained.  Can be used without electricity.  Appropriate for those with low budget.  Can be used in different levels of instruction & discipline.  Can be used to stimulate creative expression such as telling stories.  Can be damaged easily with regular used.  Hard to store.  May be too small for group viewing. ADVANTAGES DISADVANTAGES
  • 4.
    I. REALIA ORREAL OBJECTS Real objects such as coins, plants, and animals that are more accessible for educational use. These objects are the instructional aids most closely associated with Dale’s Cones of Experience. Real objects are very ideal for the students to learn new subjects.
  • 5.
    II. MODEL It canbe a 3-dimensional representation of a person or a thing, it can be larger, smaller or the same size as the object it represents. It may be competed with details or maybe simplified for instructional purposes.
  • 6.
    An example of amodel of the rice terraces (up) that is used in social sciences courses. Ant (down) the model of the solar systems that is used for science class
  • 7.
    TECHNIQUES FOR USINGREAL OBJECTS AND MODEL  Familiarize the object or the model before using it to the classroom.  Practice how to use the object or model, if it is a working one make sure to know how it works.  Real objects must be large enough to be seen but not to big or heavy that can be distracting.  Show and demonstrate the object or model when necessary and cover it when not needed.  Use size, colour slide or visuals to represents the object to be present. Make sure not to make any confusion between the real object and the representations that is being present.  Walk around the classroom and briefly show to everyone the object to avoid any distractions. Passing the object is not a good practice.
  • 8.
    III. MOBILE A mobileis a three-dimensional materials that are hung independently from the roof using fine threads.
  • 9.
    IV. STILL PICTURES& GRAPHICS These are the photograph-like representations of people, places and things. TYPES OF STILL GRAPHICS  Drawings including Sketches and Diagrams  Charts  Graphs  Posters  Cartoons  Maps  Photography
  • 10.
     It cantranslate abstract ideas into a more realistic format  It is readily available in books, magazines, newspaper, catalogues, etc.  It is easy to use because it does not require any equipment. ADVANTAGES: LIMITATIONS:  Some photograph are too small for group purposes.  Still pictures are two-dimensional
  • 11.
    A. DRAWINGS, SKETCHESAND DIAGRAMS  This are graphic arrangement of lines that represents persons, places, things and concepts. Drawings – more complete and realistic, it can be found easily on textbooks and other classroom materials. Sketches – this involves pencil to create figures or pictures. They said that sketches are preliminary to drawing. Diagrams – usually intended to show parts of an object and helps to explain process on how something works of form
  • 12.
  • 13.
    B. CHARTS  Theseare “a visual symbol summarizing, comparing, contrasting or performing other helpful services in explaining subject-matter.” (Dale, 1969)  Graphic representations of abstract relationships such as chronologies, quantities or hierarchies.  It should have a well-defined instructional purpose. In general charts must express only one major concept or configurations of concepts.
  • 14.
    TYPES OF CHARTS Organizational Charts  Classification Charts  Time Line  Flowcharts  Tabular Charts
  • 15.
    Organizational Charts shows structureor chain of command in an organization such as school, company, corporations, civic groups or government department. This also shows interrelationship of personnel or departments.
  • 16.
    Classification Charts used chieflyto classify or categorize objects, places or species.
  • 17.
    Time Line this showschronological relationships between events. They mostly shows the historical events in sequence.
  • 18.
    Flowcharts also known asprocess charts which shows sequence, procedure or a flow of process
  • 19.
    Tabular Charts these aretables contains numerical information and data values.
  • 20.
    C. GRAPHS  Visualrepresentation of numerical data.  They also shows relationships among units of the data.  Its visually interesting and data can be interpreted more quickly than in tabular form. Some Uses of Graphs: • Used to present statistical results • Gives bird’s eye view of the compete information • Used as an effective tool for comparing and contrasting complicated facts.
  • 21.
    TYPES OF GRAPHS  BarGraphs  Pictorial Graphs  Pie Graphs  Line Graphs
  • 22.
    Bar Graphs used forcomparing similar items in different categories or groups.
  • 23.
    Pictorial Graphs uses ofdrawing as representation instead of numerical data.
  • 24.
    Pie Graphs a graphsuses to help you see the percentage of the part to the whole, its uses percentage as the part.
  • 25.
    Line Graphs this usesin plotting trends that shows the increase and decrease in data over time.
  • 26.
    D. POSTERS Posters arevisual combinations of images, lines, colors and words that are intended to catch its viewers attention to communicate a brief message. They can be also used to stimulate interest for events and new topics. Characteristic of a Poster Uses of Posters Suggestion for Preparing Posters
  • 28.
    E. CARTOONS  Themost common and popular visual to learners, a rough caricatures of real people, objects, animals and events. Cartoons appeal very well to the learners of all ages.
  • 29.
    F. MAPS To showthe geographical features of the earth surface. To show relationships between places. An accurate representation of the pane surface in the form of diagram drawn to scale. Uses of Maps:
  • 30.
    TYPES OF MAPS RoadMap Physical Map Topographic Map Political Map Climate Map Resource Map Thematic Map
  • 31.
    Road Map most commonlymap used for navigation.
  • 32.
    Physical Map shows thelandscape and features of specific area such as lakes, mountains, and seas.
  • 33.
    Topographic Map same asphysical map but its uses lines to show changes in elevation.
  • 34.
    Political Map shows locationand names of important cities, this is usually used for student’s references.
  • 35.
    Climate Map a typeof maps usually for weather reports, this shows information such as average rainfall and temperatures.
  • 36.
    Resource Map Shows the economicactivities or resource that can be found in a particular area.
  • 37.
    Thematic Map shows themeor topic in a particular area.
  • 38.
    TECHNIQUES/GUIDELINES IN USINGSTILL PICTURES AND GRAPHICS  Use large visuals that everyone can see simultaneously.  Use simple materials.  Cover irrelevant materials in visual with plain paper,  Hold the visuals steady when showing them to a group by resting against the desk or table.  Limit numbers of picture used in a given time.  Use just one picture at a time than comparing them.  Keep your audience’s attention and help them learn by asking direct questions.  Teach your students to interpret visuals.  Display question for each visuals.  Provide written or verbal cues to highlight important details.
  • 39.
    G. PHOTOGRAPHY Photography isan art than science. Teaching photography is an important experience to teach for both teachers and students. As teachers photography helps in their own purposes such that for documentations on class projects or field trips. They can even associate this in their lessons. Here are some ways you can use you camera in the classroom: Illustrate steps in procedure like doing the projects, following steps in dancing or ,baking. Create school newsletters. Documentations on special events in school. Create a year-end photo
  • 40.
    SELECTING PERFECT CAMERA Cell phones & Smartphones Point and Shoot
  • 41.
    EVIL Camera (Electronic Viewfinderwith Interchangeable Lens) DSLRs (Digital Single Less Reflex)
  • 42.
    BASIC CAMERA PARTS  Lens Viewfinder  Body  Shutter Release  Aperture  Image Sensor  Memory Card  LCD Screen  Flash  User’s Control TECHNICAL TERMS IN PHOTOGRAPHY  Pixels  Megapixels  Zoom  White Balance
  • 43.
    POINTERS TO CONSIDERIN PHOTOGRAPHY  Rule of Thirds  Balancing Elements  Leading Lines  Symmetry and Patterns  Viewpoint  Background  Depth  Framing  Cropping  Experimentations
  • 44.
    V. FIELD TRIPS Fieldtrips is an excursion outside the classroom. Usually this takes place outside the classrooms or schools to visit other places to study on great people or real objects and also to have a first-hand experience or encounter on the phenomena that cannot be brought to schools.
  • 45.
    FIELD TRIPS MAYINCLUDES: Trip of a few minutes into the school field/garden. Going to other building within the school. Visit to different department offices/departments within the campus. A day trip to historical places, zoos, museums and parks.
  • 46.
    FIELD TRIPS PURPOSES (HEINRICH,1993) Provide enrichment of factual information read in textbooks and make words on the printed page more meaningful.  Improve attitudes, expand understanding and increase skills.  Provide first hand experiences with objects, places, situations and human relationships that cannot be provided in the classroom.  Sharpen awareness of the students’ environment.  Expose student to careers that they might want to pursue.  Blend the classroom, the immediate community and a larger world into a more meaningful whole.
  • 47.
  • 48.
    1. PLANNING  Havea clear purpose or objectives of the trip.  Have a clear overview of the content of the trip.  Make arrangements with the school principal, or other teachers regarding the planned trip.  Secure consent of the parents for students to make the trip.  Arrange transportation.  Provide sufficient supervision. Emphasize appropriate dress and set up safety precautions and ground rules.
  • 49.
    2. PREPARING  Clarifyto the students the purpose of the trip. You may build the interest of the students in the trip through some preparatory activities such as; class discussion, stories, reports, films and teacher- student planning.  Provide directions or instructions to students regarding: What to look for Questions to ask Information to be gathered Notes to be made Individual/group assignments
  • 50.
    3. CONDUCTING Arrive atthe field trip site on time. Encourage students to do observations and ask questions. Get available materials that are provided in the site for future use. Account for all students before the return trip.
  • 51.
    4. FOLLOW-UP Conduct follow-upof the field trip through: Sharing of the experiences. Report Projects Demonstrations Creative Writing Independent individual research Exhibits
  • 52.
    CHARACTERISTICS OF APOSTER The following characteristics identify a posters from other graphics: Words are minimal. Usually 4 or 5 only. Layout of elements are simple and arrange well. Colors and text are efficient. Illustrations are bold and lettering styles are simple. Posters are attractive.
  • 53.
    USES OF APOSTERS Posters may use in many ways such as: It motivates the students Single ideas or subject are presented It can publicized important school and community projects and events It captures attentions and conveys message quickly It gives a strong and lasting impressions.
  • 54.
    SUGGESTIONS FOR PREPARING POSTERS Tocreate an effective posters, the following suggestions can be followed:  Think of a theme  Provide the title or the slogan that are most fitting  Have a trial and error of the best layout of the poster  Gather every materials needed  Finalize the design and gives some finishing touch
  • 55.