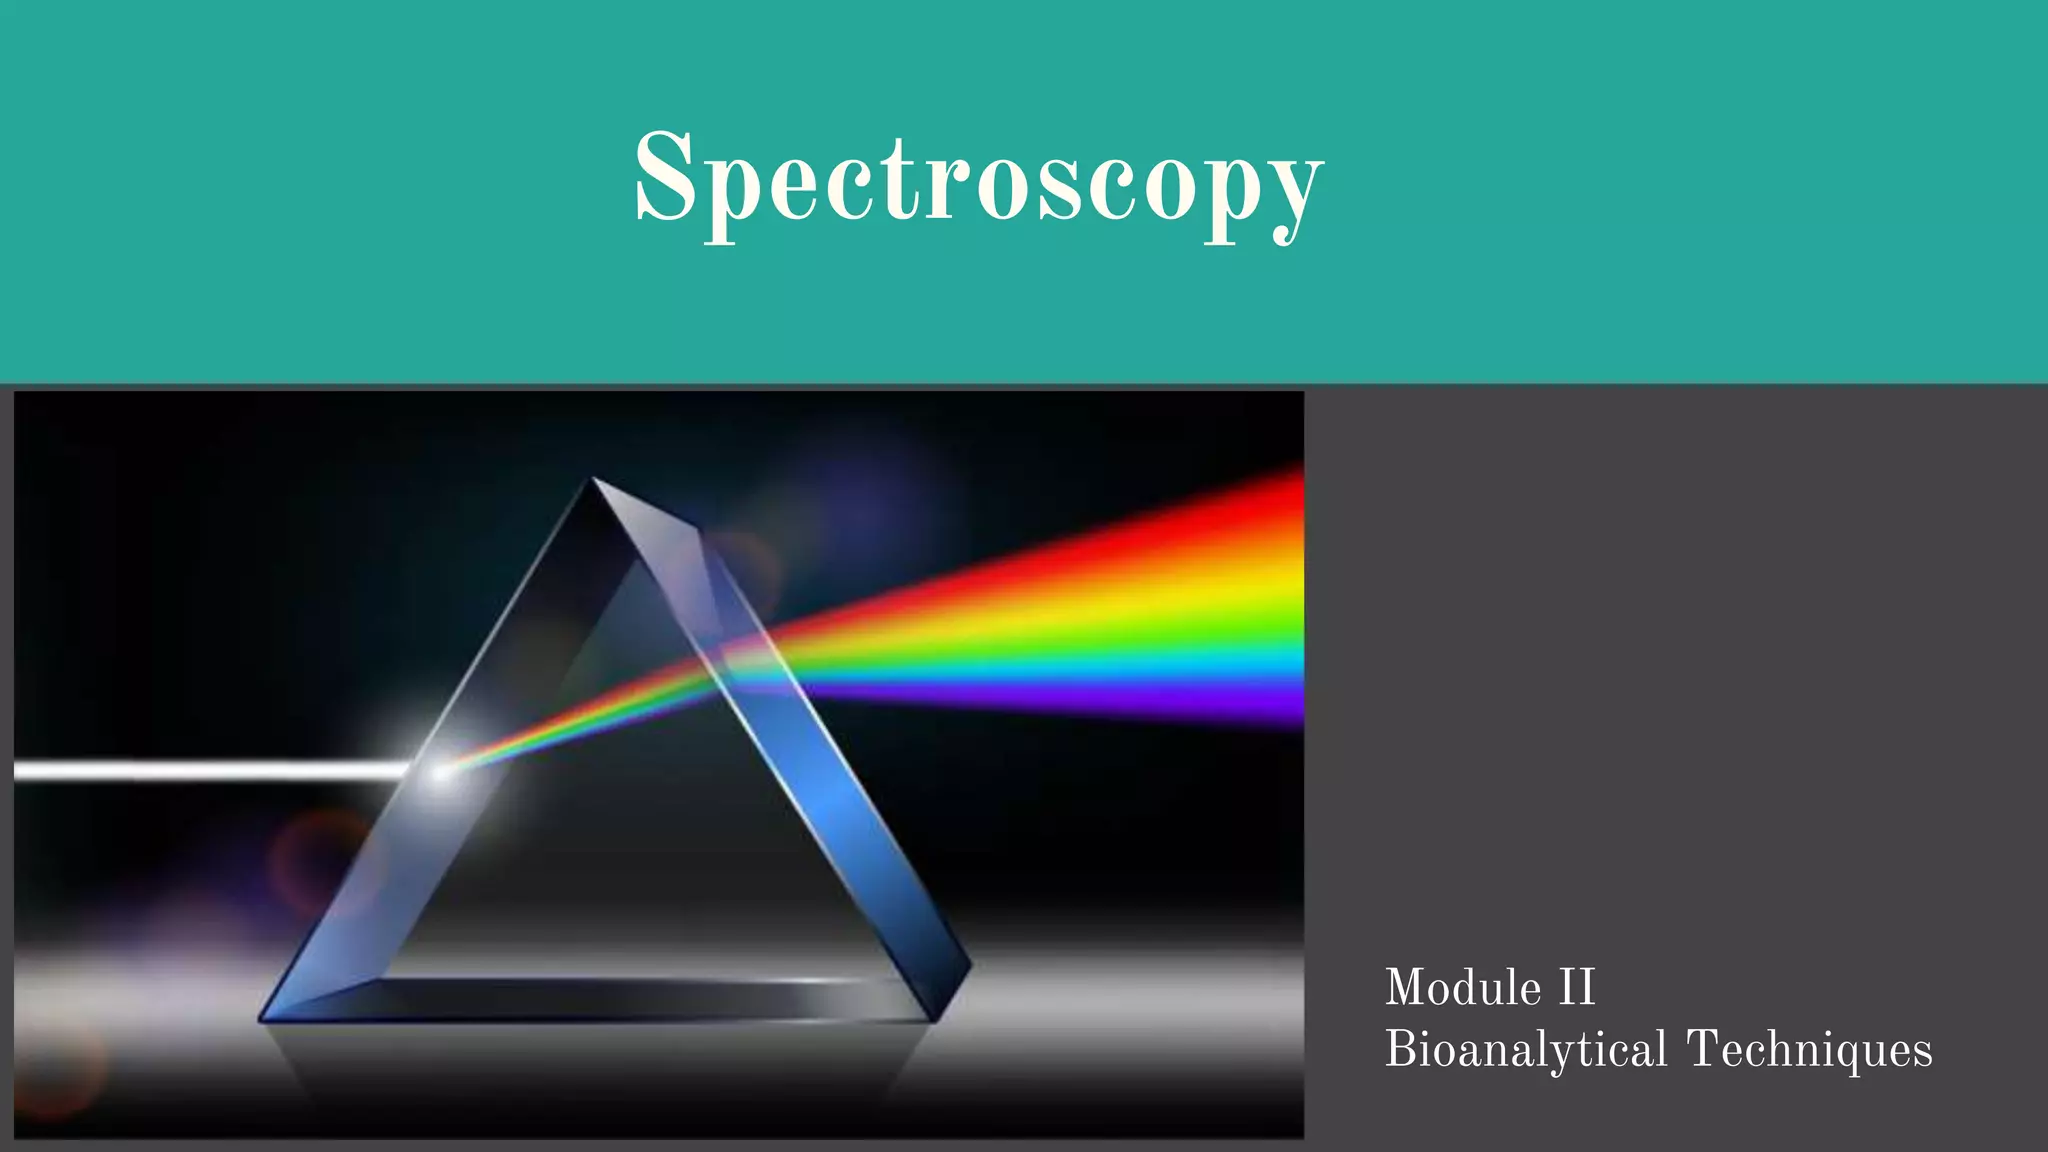
SlideShare a Scribd company logo
1 of 36
Spectroscopy
Module II
Bioanalytical Techniques
Introduction
● Spectroscopic techniques employ light to interact with matter and thus probe certain
features of a sample to learn about its consistency or structure.
● Light is electromagnetic radiation, a phenomenon exhibiting different energies, and
dependent on that energy, different molecular features can be probed.
● Properties of electromagnetic radiations
a. Electromagnetic radiation is composed of an electric and a perpendicular magnetic
vector, each one oscillating in plane at right angles to the direction of propagation.
b. The wavelength λ is the spatial distance between two consecutive peaks (one cycle)
in the sinusoidal waveform and is measured in submultiples of metre, usually in
nanometres (nm). The maximum length of the vector is called the amplitude.
c. The frequency of the electromagnetic radiation is the number of oscillations made
by the wave within the timeframe of 1 s.
d. Wavenumber v which describes the number of completed wave cycles per distance.
Interaction with matter
The photon is the elementary particle responsible for electromagnetic phenomena. It
carries the electromagnetic radiation and has properties of a wave, as well as of a
particle, albeit having a mass of zero.
As a particle, it interacts with matter by
transferring its energy E:
E=hc/λ=hv
where h is the Planck constant (h = 6.63X10⁻³⁴ Js) and v is the frequency of the
radiation.
Absorption and Transmittance
Electrons in either atoms or molecules
may be distributed between several
energy levels but principally reside in the
lowest levels (ground state). In order for
an electron to be promoted to a higher
level (excited state), energy must be put
into the system. If this energy E is
derived from electromagnetic radiation,
this gives rise to an absorption spectrum,
and an electron is transferred from the
electronic ground state (S0) into the first
electronic excited state (S1).
Electron can then revert back to ground
state relaesing heat or fluroscence.
Measurement of Transmission and Absorbance
Transmission: T=I/I0
Absorbance : The chance for a photon to be absorbed by matter is given by an
extinction coefficient which itself is dependent on the wavelength λ of the photon. If
light with the intensity I0 passes through a sample with appropriate transparency
and the path length (thickness) d, the intensity I drops along the pathway in an
exponential manner.
The characteristic absorption parameter for the sample is the extinction coefficient
α, yielding the correlation
I= I0e-αd
.
Absorption spectrum
The plot of absorption probability
against wavelength is called
absorption spectrum
Beer lambert’s law
The Beer-Lambert law is a linear relationship between the absorbance and the
concentration, molar absorption coefficient and optical coefficient of a solution.
Biochemical samples usually comprise aqueous solutions, where the substance of
interest is present at a molar concentration c. Algebraic transformation of the
exponential correlation into an expression based on the decadic logarithm yields the
law of Beer lambert
● The Beer–Lambert law is valid for low concentrations only. Higher
concentrations might lead to association of molecules and therefore cause
deviations from the ideal behaviour.
● Absorbance and extinction coefficients are additive parameters, which
complicates determination of concentrations in samples with more than one
absorbing species.
● Note that in dispersive samples or suspensions scattering effects increase the
absorbance, since the scattered light is not reaching the detector for readout.
The absorbance recorded by the spectrophotometer is thus overestimated and
needs to be corrected.
Limitations of Beer lambert’s law
Absorption or light scattering –Optical Density
● In some applications, for example measurement of turbidity of cell cultures
(determination of biomass concentration), it is not the absorption but the
scattering of light that is actually measured with a spectrophotometer.
● Extremely turbid samples like bacterial cultures do not absorb the incoming
light. Instead, the light is scattered and thus, the spectrometer will record an
apparent absorbance (sometimes also called attenuance).
● In this case, the observed parameter is called optical density (OD). Instruments
specifically designed to measure turbid samples are nephelometers or Klett
meters; however, most biochemical laboratories use the general UV/Vis
spectrometer for determination of optical densities of cell cultures.
UV-VIS Spectrophotometer
● UV-Vis spectroscopy is an analytical technique that measures the amount of
discrete wavelengths of UV or visible light that are absorbed by or
transmitted through a sample in comparison to a reference or blank sample.
This property is influenced by the sample composition, potentially providing
information on what is in the sample and at what concentration.
● Range of wavelength
UV:100-400 nm
Visible: 400-700 nm
UV-VIS Spectrophotometer
Instrumentation
● UV/Vis spectrophotometers are usually dual-beam spectrometers where the
first channel contains the sample and the second channel holds the control
(buffer) for correction.
● Alternatively, one can record the control spectrum first and use this as internal
reference for the sample spectrum
● Components of UV-Vis spectrophotometers
1. Light Source: Tungsten filament bulb for the visible part of the spectrum, and a
Deuterium bulb for the UV region.
Tungstan Lamp Deuterium Lamp
● 2. Monochromator:
A monochromator is an optical system that transmits a specific band of the
electromagnetic spectrum.Consisting of either a prism or a rotating metal grid of
high precision called grating, is placed between the light source and the sample.
The monochromators unit consists of :
● Entrance slit – defines narrow beam of radiation from source.
● Collimating lens (polished surface) - collimates the lights.
● Prism (make-quartz)- disperses the light into specific wavelength.
● Focusing lens -captures the dispersed light & sharpens the same to the sample
cuvette via exit slit
● Exit slit- allows the corrected wavelength of light to the sample cuvette
● For Visible and UV spectroscopy, a liquid sample is usually contained in a cell called
a cuvette.
● Glass is suitable for visible but not for UV spectroscopy because it absorbs UV
radiation.
● Quartz can be used in UV as well as in visible spectroscopy
3. Sample Container
4. Photosensitive detectors
● The detectors are devices that convert radiant energy into electrical signal.
● A Detector should be sensitive, and has a fast response over a considerable
range of wavelengths.
● In addition, the electrical signal produced by the detector must be directly
proportionate to the transmitted intensity.
● In a dual-beam instrument, the incoming light beam is split into two parts by a
half mirror. One beam passes through the sample, the other through a control
(blank, reference). This approach obviates any problems of variation in light
intensity, as both reference and sample would be affected equally.
● The measured absorbance is the difference between the two transmitted beams
of light recorded. Depending on the instrument, a second detector measures the
intensity of the incoming beam, although some instruments use an arrangement
where one detector measures the incoming and the transmitted intensity
alternately.
● Since borosilicate glass and normal plastics absorb UV light, such cuvettes can
only be used for applications in the visible range of the spectrum (up to 350nm).
For UV measurements, quartz cuvettes need to be used.
Procedure for detection
● Wavelength selection can also be achieved by using coloured filters as
monochromators that absorb all but ascertain limited range of wavelengths.
This limited range is called the bandwidth of the filter. Filter-based wavelength
selection is used in colorimetry, a method with moderate accuracy, but best
suited for specific colorimetric assays where only certain wavelengths are of
interest. If wavelengths are selected by prisms or gratings, the technique is
called spectrophotometry
Wavelength Selection
Applications of UV-VIS Spectrophotometer
● Qualitative analysis may be performed in the UV/Vis regions to identify certain
classes of compounds both in the pure state and in biological mixtures (e.g. protein-
bound).
● Quantitative Analysis:
Concentration Determination: The usual procedure for (colorimetric) assays is to
prepare a set of standards and produce a plot of concentration versus absorbance called
calibration curve. Absorbance of unknowns are then measured and their concentration
interpolated from the linear region of the plot.
● DNA and RNA analysis: Quickly verifying the purity and concentration of RNA and
DNA is one particularly widespread application.
● Beverage analysis: The identification of particular compounds in drinks is another
common application of UV-Vis spectroscopy. Caffeine content must be within
certain legal limits, for which UV light can facilitate quantification.
● Pharmaceuticals: To identify individual pharmaceutical compounds.
Types of Spectroscopy
● Nanodrop Spectroscopy
● FTIR Spectroscopy
● Raman Spectroscopy
● NMR Spectroscopy
● Fluorescence Spectroscopy
● Atomic spectroscopy
● Circular Dichroism Spectroscopy
Nanodrop Spectroscopy
Microvolume/Nanodrop
Spectrophotometer
● Uses UV-VIS light
● Can quantify small volume of sample(1-2 ul)
● Used for DNA, RNA and Protein quantification
● No cuvetts required
Microvolume Spectrophotometer/
Nanodrop
FTIR(Fourier Transform Infrared Spectroscopy)
Principle
● Uses Infrared radiations
● Within the electromagnetic spectrum, the energy range below the UV/Vis is
the infrared region, encompassing the wavelength range of about 700 nm to 25
um,and thus reaching from the red end of the visible to the microwave
region.The absorption of infrared light by a molecule results in transition to
higher levels of vibration.
● An infrared spectrum arises from the fact that a molecule absorbs incident
light of a certain wavelength which will then be ‘missing’ from the
transmitted light. The recorded spectrum will show an absorption band.
Raman Spectroscopy
● A Raman spectrum arises from the analysis of scattered light.The largest part
of an incident light beam passes through the sample (transmission). A small
part is scattered isotropically, i.e. uniformly in all directions (Rayleigh scatter).
● The Raman spectrum arises from the fact that a very small proportion of light
scattered by the sample will have a different frequency than the incident
light.
● As different vibrational states are excited, energy portions will be missing, thus
giving rise to peaks at lower frequencies than the incident light (Stokes lines).
● Notably, higher frequencies are also observed (antiStokes lines); these arise
from excited molecules returning to ground state. The emitted energy is dumped
onto the incident light which results in scattered light of higher energy than the
incident light.
Raman Spectrum of Trisodium Citrate
NMR Spectroscopy
● Nuclear magnetic resonance (NMR) spectroscopy is the study of molecules by
recording the interaction of radiofrequency (Rf) electromagnetic radiations with
the nuclei of molecules placed in a strong magnetic field.
● According to the NMR principle, Many nuclei have spin, and all nuclei are
electrically charged. An energy transfer from the base energy to a higher energy
level is achievable when an external magnetic field is supplied.
● Transfer of energy is possible from base energy to higher energy levels when an
external magnetic field is applied.
● The transfer of energy occurs at a wavelength that coincides with the radio
frequency.
● Also, energy is emitted at the same frequency when the spin comes back to its
base level. Therefore, by measuring the signal which matches this transfer the
processing of the NMR spectrum for the concerned nucleus is yield.
Fluorescence Spectroscopy
● Fluorescence is an emission phenomenon where an energy transition from a
higher to a lower state is accompanied by radiation. Only molecules in their
excited forms are able to emit fluorescence; thus, they have to be brought into a
state of higher energy prior to the emission phenomenon
● Fluorescence spectroscopy works most accurately at very low concentrations of
emitting fluorophores.
● Intrinsic Fluorescence- In proteins-tyrosine, tryptophan and Phenylanaline
Excitation at 280nm excites tyrosine and tryptophan fluorescence
● Extrinsic Fluroscence-Many biochemical molecules of interest are non-
fluorescent.so, an external fluorophore can be introduced into the system by
chemical coupling or non-covalent binding. E.g. Fluroscein and SYBR Green.
Fluorescence
Phenomenon
Atomic Spectroscopy
Atomic Absorption Spectroscopy Atomic Emission Spectroscopy
Lines can be observed as light of
a particular wavelength (colour).
Black lines can be observed
against a bright background.
● Atomic spectroscopy is typically based on the analysis of the electromagnetic
radiation emitted by the atoms in an element. This electromagnetic radiation is
highly unique to the particular atom; therefore the detection is very accurate
even for small sample amounts.
● In a spectrum of an element, the absorption or emission wavelengths are
associated with transitions that require a minimum of energy change. In order for
energy changes to be minimal, transitions tend to occur between orbitals close
together in energy terms. For example, excitation of a sodium atom and its
subsequent relaxation gives rise to emission of orange light (‘D-line’) due to the
transition of an electron from the 3s to the 3p orbital and return.
Circular Dichroism Spectroscopy
● Single-beam UV absorption spectrometer
● CD spectrometry involves measuring a very small difference between two
absorption values which are large signals.
● Generally, left and right circularly polarised light passes through the sample
in an alternating fashion. This is achieved by an electro-optic modulator which
is a crystal that transmits either the left- or right-handed polarised component
of linearly polarised light, depending on the polarity of the electric field that is
applied by alternating currents. The photomultiplier detector produces a voltage
proportional to the ellipticity of the resultant beam emerging from the sample.
● It is used to study biological molecules, their structure, and interactions with
metals and other molecules.
Circular Dichroism
Spectrophotometer
Circular Dichroism
Spectrum
END OF MODULE

More Related Content

Similar to Spectroscopy.pptx

Uv visible spectroscopy
Uv visible spectroscopyUv visible spectroscopy
Uv visible spectroscopyAsmitaSatao
 
spectrophotometry and its types.pdf
spectrophotometry and its types.pdfspectrophotometry and its types.pdf
spectrophotometry and its types.pdfalihaider64675
 
Ultraviolet-visible spectroscopy slide.pptx
Ultraviolet-visible spectroscopy slide.pptxUltraviolet-visible spectroscopy slide.pptx
Ultraviolet-visible spectroscopy slide.pptxAhnaf maznun
 
Spectrophotometry & Calorimetry.pptx
Spectrophotometry & Calorimetry.pptxSpectrophotometry & Calorimetry.pptx
Spectrophotometry & Calorimetry.pptxdrarunsingh4
 
uv spectelectronic transition in the roscopy
uv spectelectronic transition in the roscopyuv spectelectronic transition in the roscopy
uv spectelectronic transition in the roscopyRiyaDas765755
 
INSTRUMENTATIONS UV-VIS.pdf
INSTRUMENTATIONS UV-VIS.pdfINSTRUMENTATIONS UV-VIS.pdf
INSTRUMENTATIONS UV-VIS.pdfDr. Dinesh Mehta
 
Spectrophotometry in clinical chemistry
Spectrophotometry in clinical chemistrySpectrophotometry in clinical chemistry
Spectrophotometry in clinical chemistryOfonmbuk Umoh
 
uv -visible spectroscopy
uv -visible spectroscopyuv -visible spectroscopy
uv -visible spectroscopyyogitamandlik2
 
Ultraviolet and visible spectroscopy
Ultraviolet and visible  spectroscopyUltraviolet and visible  spectroscopy
Ultraviolet and visible spectroscopyGeetaraniLoushigam
 
Spectropotometer.08.20 - Copy.ppt
Spectropotometer.08.20 - Copy.pptSpectropotometer.08.20 - Copy.ppt
Spectropotometer.08.20 - Copy.pptdiptodas18
 
Spectrophotometer instrumentation & working
Spectrophotometer instrumentation & working Spectrophotometer instrumentation & working
Spectrophotometer instrumentation & working Sabahat Ali
 
UV-VIS molecular spectroscopy.202004201521035685ranvijay_engg_UV_and_VISIBLE_...
UV-VIS molecular spectroscopy.202004201521035685ranvijay_engg_UV_and_VISIBLE_...UV-VIS molecular spectroscopy.202004201521035685ranvijay_engg_UV_and_VISIBLE_...
UV-VIS molecular spectroscopy.202004201521035685ranvijay_engg_UV_and_VISIBLE_...abusunabakali
 

Similar to Spectroscopy.pptx (20)

UV SPECTROSCOPY ppt.pptx
UV SPECTROSCOPY ppt.pptxUV SPECTROSCOPY ppt.pptx
UV SPECTROSCOPY ppt.pptx
 
UV SPECTROSCOPY ppt.pptx
UV SPECTROSCOPY ppt.pptxUV SPECTROSCOPY ppt.pptx
UV SPECTROSCOPY ppt.pptx
 
Uv visible spectroscopy
Uv visible spectroscopyUv visible spectroscopy
Uv visible spectroscopy
 
spectrophotometry and its types.pdf
spectrophotometry and its types.pdfspectrophotometry and its types.pdf
spectrophotometry and its types.pdf
 
Ultraviolet-visible spectroscopy slide.pptx
Ultraviolet-visible spectroscopy slide.pptxUltraviolet-visible spectroscopy slide.pptx
Ultraviolet-visible spectroscopy slide.pptx
 
Spectrophotometry & Calorimetry.pptx
Spectrophotometry & Calorimetry.pptxSpectrophotometry & Calorimetry.pptx
Spectrophotometry & Calorimetry.pptx
 
Spectrophotometry In Biology
Spectrophotometry In BiologySpectrophotometry In Biology
Spectrophotometry In Biology
 
uv spectelectronic transition in the roscopy
uv spectelectronic transition in the roscopyuv spectelectronic transition in the roscopy
uv spectelectronic transition in the roscopy
 
INSTRUMENTATIONS UV-VIS.pdf
INSTRUMENTATIONS UV-VIS.pdfINSTRUMENTATIONS UV-VIS.pdf
INSTRUMENTATIONS UV-VIS.pdf
 
Spectrophotometry in clinical chemistry
Spectrophotometry in clinical chemistrySpectrophotometry in clinical chemistry
Spectrophotometry in clinical chemistry
 
UV Spectroscopy
UV Spectroscopy UV Spectroscopy
UV Spectroscopy
 
uv -visible spectroscopy
uv -visible spectroscopyuv -visible spectroscopy
uv -visible spectroscopy
 
Ultraviolet and visible spectroscopy
Ultraviolet and visible  spectroscopyUltraviolet and visible  spectroscopy
Ultraviolet and visible spectroscopy
 
Spectropotometer.08.20 - Copy.ppt
Spectropotometer.08.20 - Copy.pptSpectropotometer.08.20 - Copy.ppt
Spectropotometer.08.20 - Copy.ppt
 
nephalo and turbidometer.pptx
nephalo and turbidometer.pptxnephalo and turbidometer.pptx
nephalo and turbidometer.pptx
 
Absorbance
AbsorbanceAbsorbance
Absorbance
 
Spectrophotometer instrumentation & working
Spectrophotometer instrumentation & working Spectrophotometer instrumentation & working
Spectrophotometer instrumentation & working
 
Prabhakar singh ii sem-paper v-colorimeter & spectrophotometer
Prabhakar singh  ii sem-paper v-colorimeter & spectrophotometerPrabhakar singh  ii sem-paper v-colorimeter & spectrophotometer
Prabhakar singh ii sem-paper v-colorimeter & spectrophotometer
 
UV-VIS molecular spectroscopy.202004201521035685ranvijay_engg_UV_and_VISIBLE_...
UV-VIS molecular spectroscopy.202004201521035685ranvijay_engg_UV_and_VISIBLE_...UV-VIS molecular spectroscopy.202004201521035685ranvijay_engg_UV_and_VISIBLE_...
UV-VIS molecular spectroscopy.202004201521035685ranvijay_engg_UV_and_VISIBLE_...
 
Spectrophotometry
SpectrophotometrySpectrophotometry
Spectrophotometry
 

More from Alisha Shaikh

cell cloning- Therapeutic and reproductive cloning
cell cloning- Therapeutic and reproductive cloningcell cloning- Therapeutic and reproductive cloning
cell cloning- Therapeutic and reproductive cloningAlisha Shaikh
 
Glycogenesis and glycogenolysis pathways
Glycogenesis and glycogenolysis pathwaysGlycogenesis and glycogenolysis pathways
Glycogenesis and glycogenolysis pathwaysAlisha Shaikh
 
_ETC and Oxidative phosphorylation.pptx
_ETC and  Oxidative phosphorylation.pptx_ETC and  Oxidative phosphorylation.pptx
_ETC and Oxidative phosphorylation.pptxAlisha Shaikh
 
_Cell Signalling .pptx
_Cell Signalling .pptx_Cell Signalling .pptx
_Cell Signalling .pptxAlisha Shaikh
 
Different types of vectors.pptx
Different types of vectors.pptxDifferent types of vectors.pptx
Different types of vectors.pptxAlisha Shaikh
 
_Site directed Mutagenesis.pptx
_Site directed Mutagenesis.pptx_Site directed Mutagenesis.pptx
_Site directed Mutagenesis.pptxAlisha Shaikh
 
_Sequencing Methods .pptx
_Sequencing Methods .pptx_Sequencing Methods .pptx
_Sequencing Methods .pptxAlisha Shaikh
 
_PCR and its different types.pptx
_PCR and its different types.pptx_PCR and its different types.pptx
_PCR and its different types.pptxAlisha Shaikh
 
Chromatographic Techniques.pptx
Chromatographic Techniques.pptxChromatographic Techniques.pptx
Chromatographic Techniques.pptxAlisha Shaikh
 
_centrifugation .pptx
_centrifugation .pptx_centrifugation .pptx
_centrifugation .pptxAlisha Shaikh
 
Marine Biotechnology.pptx
Marine Biotechnology.pptxMarine Biotechnology.pptx
Marine Biotechnology.pptxAlisha Shaikh
 
Molecular Diagnostics.pptx
Molecular Diagnostics.pptxMolecular Diagnostics.pptx
Molecular Diagnostics.pptxAlisha Shaikh
 

More from Alisha Shaikh (16)

cell cloning- Therapeutic and reproductive cloning
cell cloning- Therapeutic and reproductive cloningcell cloning- Therapeutic and reproductive cloning
cell cloning- Therapeutic and reproductive cloning
 
Glycogenesis and glycogenolysis pathways
Glycogenesis and glycogenolysis pathwaysGlycogenesis and glycogenolysis pathways
Glycogenesis and glycogenolysis pathways
 
_ETC and Oxidative phosphorylation.pptx
_ETC and  Oxidative phosphorylation.pptx_ETC and  Oxidative phosphorylation.pptx
_ETC and Oxidative phosphorylation.pptx
 
_Cell Signalling .pptx
_Cell Signalling .pptx_Cell Signalling .pptx
_Cell Signalling .pptx
 
_Meiosis.pptx
_Meiosis.pptx_Meiosis.pptx
_Meiosis.pptx
 
_Mitosis.pptx
_Mitosis.pptx_Mitosis.pptx
_Mitosis.pptx
 
Different types of vectors.pptx
Different types of vectors.pptxDifferent types of vectors.pptx
Different types of vectors.pptx
 
_Site directed Mutagenesis.pptx
_Site directed Mutagenesis.pptx_Site directed Mutagenesis.pptx
_Site directed Mutagenesis.pptx
 
_Sequencing Methods .pptx
_Sequencing Methods .pptx_Sequencing Methods .pptx
_Sequencing Methods .pptx
 
_Biogas .pptx
_Biogas .pptx_Biogas .pptx
_Biogas .pptx
 
_PCR and its different types.pptx
_PCR and its different types.pptx_PCR and its different types.pptx
_PCR and its different types.pptx
 
The Cell Cycle.pptx
The Cell Cycle.pptxThe Cell Cycle.pptx
The Cell Cycle.pptx
 
Chromatographic Techniques.pptx
Chromatographic Techniques.pptxChromatographic Techniques.pptx
Chromatographic Techniques.pptx
 
_centrifugation .pptx
_centrifugation .pptx_centrifugation .pptx
_centrifugation .pptx
 
Marine Biotechnology.pptx
Marine Biotechnology.pptxMarine Biotechnology.pptx
Marine Biotechnology.pptx
 
Molecular Diagnostics.pptx
Molecular Diagnostics.pptxMolecular Diagnostics.pptx
Molecular Diagnostics.pptx
 

Recently uploaded

TOTAL CHOLESTEROL (lipid profile test).pptx
TOTAL CHOLESTEROL (lipid profile test).pptxTOTAL CHOLESTEROL (lipid profile test).pptx
TOTAL CHOLESTEROL (lipid profile test).pptxdharshini369nike
 
Speech, hearing, noise, intelligibility.pptx
Speech, hearing, noise, intelligibility.pptxSpeech, hearing, noise, intelligibility.pptx
Speech, hearing, noise, intelligibility.pptxpriyankatabhane
 
Manassas R - Parkside Middle School 🌎🏫
Manassas R - Parkside Middle School 🌎🏫Manassas R - Parkside Middle School 🌎🏫
Manassas R - Parkside Middle School 🌎🏫qfactory1
 
Microphone- characteristics,carbon microphone, dynamic microphone.pptx
Microphone- characteristics,carbon microphone, dynamic microphone.pptxMicrophone- characteristics,carbon microphone, dynamic microphone.pptx
Microphone- characteristics,carbon microphone, dynamic microphone.pptxpriyankatabhane
 
Scheme-of-Work-Science-Stage-4 cambridge science.docx
Scheme-of-Work-Science-Stage-4 cambridge science.docxScheme-of-Work-Science-Stage-4 cambridge science.docx
Scheme-of-Work-Science-Stage-4 cambridge science.docxyaramohamed343013
 
zoogeography of pakistan.pptx fauna of Pakistan
zoogeography of pakistan.pptx fauna of Pakistanzoogeography of pakistan.pptx fauna of Pakistan
zoogeography of pakistan.pptx fauna of Pakistanzohaibmir069
 
Bentham & Hooker's Classification. along with the merits and demerits of the ...
Bentham & Hooker's Classification. along with the merits and demerits of the ...Bentham & Hooker's Classification. along with the merits and demerits of the ...
Bentham & Hooker's Classification. along with the merits and demerits of the ...Nistarini College, Purulia (W.B) India
 
RESPIRATORY ADAPTATIONS TO HYPOXIA IN HUMNAS.pptx
RESPIRATORY ADAPTATIONS TO HYPOXIA IN HUMNAS.pptxRESPIRATORY ADAPTATIONS TO HYPOXIA IN HUMNAS.pptx
RESPIRATORY ADAPTATIONS TO HYPOXIA IN HUMNAS.pptxFarihaAbdulRasheed
 
Neurodevelopmental disorders according to the dsm 5 tr
Neurodevelopmental disorders according to the dsm 5 trNeurodevelopmental disorders according to the dsm 5 tr
Neurodevelopmental disorders according to the dsm 5 trssuser06f238
 
LIGHT-PHENOMENA-BY-CABUALDIONALDOPANOGANCADIENTE-CONDEZA (1).pptx
LIGHT-PHENOMENA-BY-CABUALDIONALDOPANOGANCADIENTE-CONDEZA (1).pptxLIGHT-PHENOMENA-BY-CABUALDIONALDOPANOGANCADIENTE-CONDEZA (1).pptx
LIGHT-PHENOMENA-BY-CABUALDIONALDOPANOGANCADIENTE-CONDEZA (1).pptxmalonesandreagweneth
 
Harmful and Useful Microorganisms Presentation
Harmful and Useful Microorganisms PresentationHarmful and Useful Microorganisms Presentation
Harmful and Useful Microorganisms Presentationtahreemzahra82
 
Is RISC-V ready for HPC workload? Maybe?
Is RISC-V ready for HPC workload? Maybe?Is RISC-V ready for HPC workload? Maybe?
Is RISC-V ready for HPC workload? Maybe?Patrick Diehl
 
Call Girls in Munirka Delhi 💯Call Us 🔝9953322196🔝 💯Escort.
Call Girls in Munirka Delhi 💯Call Us 🔝9953322196🔝 💯Escort.Call Girls in Munirka Delhi 💯Call Us 🔝9953322196🔝 💯Escort.
Call Girls in Munirka Delhi 💯Call Us 🔝9953322196🔝 💯Escort.aasikanpl
 
Dashanga agada a formulation of Agada tantra dealt in 3 Rd year bams agada tanta
Dashanga agada a formulation of Agada tantra dealt in 3 Rd year bams agada tantaDashanga agada a formulation of Agada tantra dealt in 3 Rd year bams agada tanta
Dashanga agada a formulation of Agada tantra dealt in 3 Rd year bams agada tantaPraksha3
 
BIOETHICS IN RECOMBINANT DNA TECHNOLOGY.
BIOETHICS IN RECOMBINANT DNA TECHNOLOGY.BIOETHICS IN RECOMBINANT DNA TECHNOLOGY.
BIOETHICS IN RECOMBINANT DNA TECHNOLOGY.PraveenaKalaiselvan1
 
THE ROLE OF PHARMACOGNOSY IN TRADITIONAL AND MODERN SYSTEM OF MEDICINE.pptx
THE ROLE OF PHARMACOGNOSY IN TRADITIONAL AND MODERN SYSTEM OF MEDICINE.pptxTHE ROLE OF PHARMACOGNOSY IN TRADITIONAL AND MODERN SYSTEM OF MEDICINE.pptx
THE ROLE OF PHARMACOGNOSY IN TRADITIONAL AND MODERN SYSTEM OF MEDICINE.pptxNandakishor Bhaurao Deshmukh
 
Call Us ≽ 9953322196 ≼ Call Girls In Mukherjee Nagar(Delhi) |
Call Us ≽ 9953322196 ≼ Call Girls In Mukherjee Nagar(Delhi) |Call Us ≽ 9953322196 ≼ Call Girls In Mukherjee Nagar(Delhi) |
Call Us ≽ 9953322196 ≼ Call Girls In Mukherjee Nagar(Delhi) |aasikanpl
 
Welcome to GFDL for Take Your Child To Work Day
Welcome to GFDL for Take Your Child To Work DayWelcome to GFDL for Take Your Child To Work Day
Welcome to GFDL for Take Your Child To Work DayZachary Labe
 

Recently uploaded (20)

TOTAL CHOLESTEROL (lipid profile test).pptx
TOTAL CHOLESTEROL (lipid profile test).pptxTOTAL CHOLESTEROL (lipid profile test).pptx
TOTAL CHOLESTEROL (lipid profile test).pptx
 
Speech, hearing, noise, intelligibility.pptx
Speech, hearing, noise, intelligibility.pptxSpeech, hearing, noise, intelligibility.pptx
Speech, hearing, noise, intelligibility.pptx
 
Manassas R - Parkside Middle School 🌎🏫
Manassas R - Parkside Middle School 🌎🏫Manassas R - Parkside Middle School 🌎🏫
Manassas R - Parkside Middle School 🌎🏫
 
Microphone- characteristics,carbon microphone, dynamic microphone.pptx
Microphone- characteristics,carbon microphone, dynamic microphone.pptxMicrophone- characteristics,carbon microphone, dynamic microphone.pptx
Microphone- characteristics,carbon microphone, dynamic microphone.pptx
 
Scheme-of-Work-Science-Stage-4 cambridge science.docx
Scheme-of-Work-Science-Stage-4 cambridge science.docxScheme-of-Work-Science-Stage-4 cambridge science.docx
Scheme-of-Work-Science-Stage-4 cambridge science.docx
 
zoogeography of pakistan.pptx fauna of Pakistan
zoogeography of pakistan.pptx fauna of Pakistanzoogeography of pakistan.pptx fauna of Pakistan
zoogeography of pakistan.pptx fauna of Pakistan
 
Volatile Oils Pharmacognosy And Phytochemistry -I
Volatile Oils Pharmacognosy And Phytochemistry -IVolatile Oils Pharmacognosy And Phytochemistry -I
Volatile Oils Pharmacognosy And Phytochemistry -I
 
Bentham & Hooker's Classification. along with the merits and demerits of the ...
Bentham & Hooker's Classification. along with the merits and demerits of the ...Bentham & Hooker's Classification. along with the merits and demerits of the ...
Bentham & Hooker's Classification. along with the merits and demerits of the ...
 
Hot Sexy call girls in Moti Nagar,🔝 9953056974 🔝 escort Service
Hot Sexy call girls in  Moti Nagar,🔝 9953056974 🔝 escort ServiceHot Sexy call girls in  Moti Nagar,🔝 9953056974 🔝 escort Service
Hot Sexy call girls in Moti Nagar,🔝 9953056974 🔝 escort Service
 
RESPIRATORY ADAPTATIONS TO HYPOXIA IN HUMNAS.pptx
RESPIRATORY ADAPTATIONS TO HYPOXIA IN HUMNAS.pptxRESPIRATORY ADAPTATIONS TO HYPOXIA IN HUMNAS.pptx
RESPIRATORY ADAPTATIONS TO HYPOXIA IN HUMNAS.pptx
 
Neurodevelopmental disorders according to the dsm 5 tr
Neurodevelopmental disorders according to the dsm 5 trNeurodevelopmental disorders according to the dsm 5 tr
Neurodevelopmental disorders according to the dsm 5 tr
 
LIGHT-PHENOMENA-BY-CABUALDIONALDOPANOGANCADIENTE-CONDEZA (1).pptx
LIGHT-PHENOMENA-BY-CABUALDIONALDOPANOGANCADIENTE-CONDEZA (1).pptxLIGHT-PHENOMENA-BY-CABUALDIONALDOPANOGANCADIENTE-CONDEZA (1).pptx
LIGHT-PHENOMENA-BY-CABUALDIONALDOPANOGANCADIENTE-CONDEZA (1).pptx
 
Harmful and Useful Microorganisms Presentation
Harmful and Useful Microorganisms PresentationHarmful and Useful Microorganisms Presentation
Harmful and Useful Microorganisms Presentation
 
Is RISC-V ready for HPC workload? Maybe?
Is RISC-V ready for HPC workload? Maybe?Is RISC-V ready for HPC workload? Maybe?
Is RISC-V ready for HPC workload? Maybe?
 
Call Girls in Munirka Delhi 💯Call Us 🔝9953322196🔝 💯Escort.
Call Girls in Munirka Delhi 💯Call Us 🔝9953322196🔝 💯Escort.Call Girls in Munirka Delhi 💯Call Us 🔝9953322196🔝 💯Escort.
Call Girls in Munirka Delhi 💯Call Us 🔝9953322196🔝 💯Escort.
 
Dashanga agada a formulation of Agada tantra dealt in 3 Rd year bams agada tanta
Dashanga agada a formulation of Agada tantra dealt in 3 Rd year bams agada tantaDashanga agada a formulation of Agada tantra dealt in 3 Rd year bams agada tanta
Dashanga agada a formulation of Agada tantra dealt in 3 Rd year bams agada tanta
 
BIOETHICS IN RECOMBINANT DNA TECHNOLOGY.
BIOETHICS IN RECOMBINANT DNA TECHNOLOGY.BIOETHICS IN RECOMBINANT DNA TECHNOLOGY.
BIOETHICS IN RECOMBINANT DNA TECHNOLOGY.
 
THE ROLE OF PHARMACOGNOSY IN TRADITIONAL AND MODERN SYSTEM OF MEDICINE.pptx
THE ROLE OF PHARMACOGNOSY IN TRADITIONAL AND MODERN SYSTEM OF MEDICINE.pptxTHE ROLE OF PHARMACOGNOSY IN TRADITIONAL AND MODERN SYSTEM OF MEDICINE.pptx
THE ROLE OF PHARMACOGNOSY IN TRADITIONAL AND MODERN SYSTEM OF MEDICINE.pptx
 
Call Us ≽ 9953322196 ≼ Call Girls In Mukherjee Nagar(Delhi) |
Call Us ≽ 9953322196 ≼ Call Girls In Mukherjee Nagar(Delhi) |Call Us ≽ 9953322196 ≼ Call Girls In Mukherjee Nagar(Delhi) |
Call Us ≽ 9953322196 ≼ Call Girls In Mukherjee Nagar(Delhi) |
 
Welcome to GFDL for Take Your Child To Work Day
Welcome to GFDL for Take Your Child To Work DayWelcome to GFDL for Take Your Child To Work Day
Welcome to GFDL for Take Your Child To Work Day
 

Spectroscopy.pptx

  • 2. Introduction ● Spectroscopic techniques employ light to interact with matter and thus probe certain features of a sample to learn about its consistency or structure. ● Light is electromagnetic radiation, a phenomenon exhibiting different energies, and dependent on that energy, different molecular features can be probed. ● Properties of electromagnetic radiations a. Electromagnetic radiation is composed of an electric and a perpendicular magnetic vector, each one oscillating in plane at right angles to the direction of propagation. b. The wavelength λ is the spatial distance between two consecutive peaks (one cycle) in the sinusoidal waveform and is measured in submultiples of metre, usually in nanometres (nm). The maximum length of the vector is called the amplitude. c. The frequency of the electromagnetic radiation is the number of oscillations made by the wave within the timeframe of 1 s. d. Wavenumber v which describes the number of completed wave cycles per distance.
  • 3.
  • 4.
  • 5. Interaction with matter The photon is the elementary particle responsible for electromagnetic phenomena. It carries the electromagnetic radiation and has properties of a wave, as well as of a particle, albeit having a mass of zero. As a particle, it interacts with matter by transferring its energy E: E=hc/λ=hv where h is the Planck constant (h = 6.63X10⁻³⁴ Js) and v is the frequency of the radiation.
  • 6. Absorption and Transmittance Electrons in either atoms or molecules may be distributed between several energy levels but principally reside in the lowest levels (ground state). In order for an electron to be promoted to a higher level (excited state), energy must be put into the system. If this energy E is derived from electromagnetic radiation, this gives rise to an absorption spectrum, and an electron is transferred from the electronic ground state (S0) into the first electronic excited state (S1). Electron can then revert back to ground state relaesing heat or fluroscence.
  • 7. Measurement of Transmission and Absorbance Transmission: T=I/I0 Absorbance : The chance for a photon to be absorbed by matter is given by an extinction coefficient which itself is dependent on the wavelength λ of the photon. If light with the intensity I0 passes through a sample with appropriate transparency and the path length (thickness) d, the intensity I drops along the pathway in an exponential manner. The characteristic absorption parameter for the sample is the extinction coefficient α, yielding the correlation I= I0e-αd .
  • 8. Absorption spectrum The plot of absorption probability against wavelength is called absorption spectrum
  • 9. Beer lambert’s law The Beer-Lambert law is a linear relationship between the absorbance and the concentration, molar absorption coefficient and optical coefficient of a solution. Biochemical samples usually comprise aqueous solutions, where the substance of interest is present at a molar concentration c. Algebraic transformation of the exponential correlation into an expression based on the decadic logarithm yields the law of Beer lambert
  • 10. ● The Beer–Lambert law is valid for low concentrations only. Higher concentrations might lead to association of molecules and therefore cause deviations from the ideal behaviour. ● Absorbance and extinction coefficients are additive parameters, which complicates determination of concentrations in samples with more than one absorbing species. ● Note that in dispersive samples or suspensions scattering effects increase the absorbance, since the scattered light is not reaching the detector for readout. The absorbance recorded by the spectrophotometer is thus overestimated and needs to be corrected. Limitations of Beer lambert’s law
  • 11. Absorption or light scattering –Optical Density ● In some applications, for example measurement of turbidity of cell cultures (determination of biomass concentration), it is not the absorption but the scattering of light that is actually measured with a spectrophotometer. ● Extremely turbid samples like bacterial cultures do not absorb the incoming light. Instead, the light is scattered and thus, the spectrometer will record an apparent absorbance (sometimes also called attenuance). ● In this case, the observed parameter is called optical density (OD). Instruments specifically designed to measure turbid samples are nephelometers or Klett meters; however, most biochemical laboratories use the general UV/Vis spectrometer for determination of optical densities of cell cultures.
  • 12. UV-VIS Spectrophotometer ● UV-Vis spectroscopy is an analytical technique that measures the amount of discrete wavelengths of UV or visible light that are absorbed by or transmitted through a sample in comparison to a reference or blank sample. This property is influenced by the sample composition, potentially providing information on what is in the sample and at what concentration. ● Range of wavelength UV:100-400 nm Visible: 400-700 nm
  • 15. ● UV/Vis spectrophotometers are usually dual-beam spectrometers where the first channel contains the sample and the second channel holds the control (buffer) for correction. ● Alternatively, one can record the control spectrum first and use this as internal reference for the sample spectrum ● Components of UV-Vis spectrophotometers 1. Light Source: Tungsten filament bulb for the visible part of the spectrum, and a Deuterium bulb for the UV region. Tungstan Lamp Deuterium Lamp
  • 16. ● 2. Monochromator: A monochromator is an optical system that transmits a specific band of the electromagnetic spectrum.Consisting of either a prism or a rotating metal grid of high precision called grating, is placed between the light source and the sample. The monochromators unit consists of : ● Entrance slit – defines narrow beam of radiation from source. ● Collimating lens (polished surface) - collimates the lights. ● Prism (make-quartz)- disperses the light into specific wavelength. ● Focusing lens -captures the dispersed light & sharpens the same to the sample cuvette via exit slit ● Exit slit- allows the corrected wavelength of light to the sample cuvette
  • 17. ● For Visible and UV spectroscopy, a liquid sample is usually contained in a cell called a cuvette. ● Glass is suitable for visible but not for UV spectroscopy because it absorbs UV radiation. ● Quartz can be used in UV as well as in visible spectroscopy 3. Sample Container
  • 18. 4. Photosensitive detectors ● The detectors are devices that convert radiant energy into electrical signal. ● A Detector should be sensitive, and has a fast response over a considerable range of wavelengths. ● In addition, the electrical signal produced by the detector must be directly proportionate to the transmitted intensity.
  • 19. ● In a dual-beam instrument, the incoming light beam is split into two parts by a half mirror. One beam passes through the sample, the other through a control (blank, reference). This approach obviates any problems of variation in light intensity, as both reference and sample would be affected equally. ● The measured absorbance is the difference between the two transmitted beams of light recorded. Depending on the instrument, a second detector measures the intensity of the incoming beam, although some instruments use an arrangement where one detector measures the incoming and the transmitted intensity alternately. ● Since borosilicate glass and normal plastics absorb UV light, such cuvettes can only be used for applications in the visible range of the spectrum (up to 350nm). For UV measurements, quartz cuvettes need to be used. Procedure for detection
  • 20. ● Wavelength selection can also be achieved by using coloured filters as monochromators that absorb all but ascertain limited range of wavelengths. This limited range is called the bandwidth of the filter. Filter-based wavelength selection is used in colorimetry, a method with moderate accuracy, but best suited for specific colorimetric assays where only certain wavelengths are of interest. If wavelengths are selected by prisms or gratings, the technique is called spectrophotometry Wavelength Selection
  • 21. Applications of UV-VIS Spectrophotometer ● Qualitative analysis may be performed in the UV/Vis regions to identify certain classes of compounds both in the pure state and in biological mixtures (e.g. protein- bound). ● Quantitative Analysis: Concentration Determination: The usual procedure for (colorimetric) assays is to prepare a set of standards and produce a plot of concentration versus absorbance called calibration curve. Absorbance of unknowns are then measured and their concentration interpolated from the linear region of the plot. ● DNA and RNA analysis: Quickly verifying the purity and concentration of RNA and DNA is one particularly widespread application. ● Beverage analysis: The identification of particular compounds in drinks is another common application of UV-Vis spectroscopy. Caffeine content must be within certain legal limits, for which UV light can facilitate quantification. ● Pharmaceuticals: To identify individual pharmaceutical compounds.
  • 22. Types of Spectroscopy ● Nanodrop Spectroscopy ● FTIR Spectroscopy ● Raman Spectroscopy ● NMR Spectroscopy ● Fluorescence Spectroscopy ● Atomic spectroscopy ● Circular Dichroism Spectroscopy
  • 24. ● Uses UV-VIS light ● Can quantify small volume of sample(1-2 ul) ● Used for DNA, RNA and Protein quantification ● No cuvetts required Microvolume Spectrophotometer/ Nanodrop
  • 26. Principle ● Uses Infrared radiations ● Within the electromagnetic spectrum, the energy range below the UV/Vis is the infrared region, encompassing the wavelength range of about 700 nm to 25 um,and thus reaching from the red end of the visible to the microwave region.The absorption of infrared light by a molecule results in transition to higher levels of vibration. ● An infrared spectrum arises from the fact that a molecule absorbs incident light of a certain wavelength which will then be ‘missing’ from the transmitted light. The recorded spectrum will show an absorption band.
  • 27. Raman Spectroscopy ● A Raman spectrum arises from the analysis of scattered light.The largest part of an incident light beam passes through the sample (transmission). A small part is scattered isotropically, i.e. uniformly in all directions (Rayleigh scatter). ● The Raman spectrum arises from the fact that a very small proportion of light scattered by the sample will have a different frequency than the incident light. ● As different vibrational states are excited, energy portions will be missing, thus giving rise to peaks at lower frequencies than the incident light (Stokes lines). ● Notably, higher frequencies are also observed (antiStokes lines); these arise from excited molecules returning to ground state. The emitted energy is dumped onto the incident light which results in scattered light of higher energy than the incident light.
  • 28. Raman Spectrum of Trisodium Citrate
  • 29. NMR Spectroscopy ● Nuclear magnetic resonance (NMR) spectroscopy is the study of molecules by recording the interaction of radiofrequency (Rf) electromagnetic radiations with the nuclei of molecules placed in a strong magnetic field. ● According to the NMR principle, Many nuclei have spin, and all nuclei are electrically charged. An energy transfer from the base energy to a higher energy level is achievable when an external magnetic field is supplied. ● Transfer of energy is possible from base energy to higher energy levels when an external magnetic field is applied. ● The transfer of energy occurs at a wavelength that coincides with the radio frequency. ● Also, energy is emitted at the same frequency when the spin comes back to its base level. Therefore, by measuring the signal which matches this transfer the processing of the NMR spectrum for the concerned nucleus is yield.
  • 30. Fluorescence Spectroscopy ● Fluorescence is an emission phenomenon where an energy transition from a higher to a lower state is accompanied by radiation. Only molecules in their excited forms are able to emit fluorescence; thus, they have to be brought into a state of higher energy prior to the emission phenomenon ● Fluorescence spectroscopy works most accurately at very low concentrations of emitting fluorophores. ● Intrinsic Fluorescence- In proteins-tyrosine, tryptophan and Phenylanaline Excitation at 280nm excites tyrosine and tryptophan fluorescence ● Extrinsic Fluroscence-Many biochemical molecules of interest are non- fluorescent.so, an external fluorophore can be introduced into the system by chemical coupling or non-covalent binding. E.g. Fluroscein and SYBR Green.
  • 32. Atomic Spectroscopy Atomic Absorption Spectroscopy Atomic Emission Spectroscopy Lines can be observed as light of a particular wavelength (colour). Black lines can be observed against a bright background.
  • 33. ● Atomic spectroscopy is typically based on the analysis of the electromagnetic radiation emitted by the atoms in an element. This electromagnetic radiation is highly unique to the particular atom; therefore the detection is very accurate even for small sample amounts. ● In a spectrum of an element, the absorption or emission wavelengths are associated with transitions that require a minimum of energy change. In order for energy changes to be minimal, transitions tend to occur between orbitals close together in energy terms. For example, excitation of a sodium atom and its subsequent relaxation gives rise to emission of orange light (‘D-line’) due to the transition of an electron from the 3s to the 3p orbital and return.
  • 34. Circular Dichroism Spectroscopy ● Single-beam UV absorption spectrometer ● CD spectrometry involves measuring a very small difference between two absorption values which are large signals. ● Generally, left and right circularly polarised light passes through the sample in an alternating fashion. This is achieved by an electro-optic modulator which is a crystal that transmits either the left- or right-handed polarised component of linearly polarised light, depending on the polarity of the electric field that is applied by alternating currents. The photomultiplier detector produces a voltage proportional to the ellipticity of the resultant beam emerging from the sample. ● It is used to study biological molecules, their structure, and interactions with metals and other molecules.