Downloaded 17 times
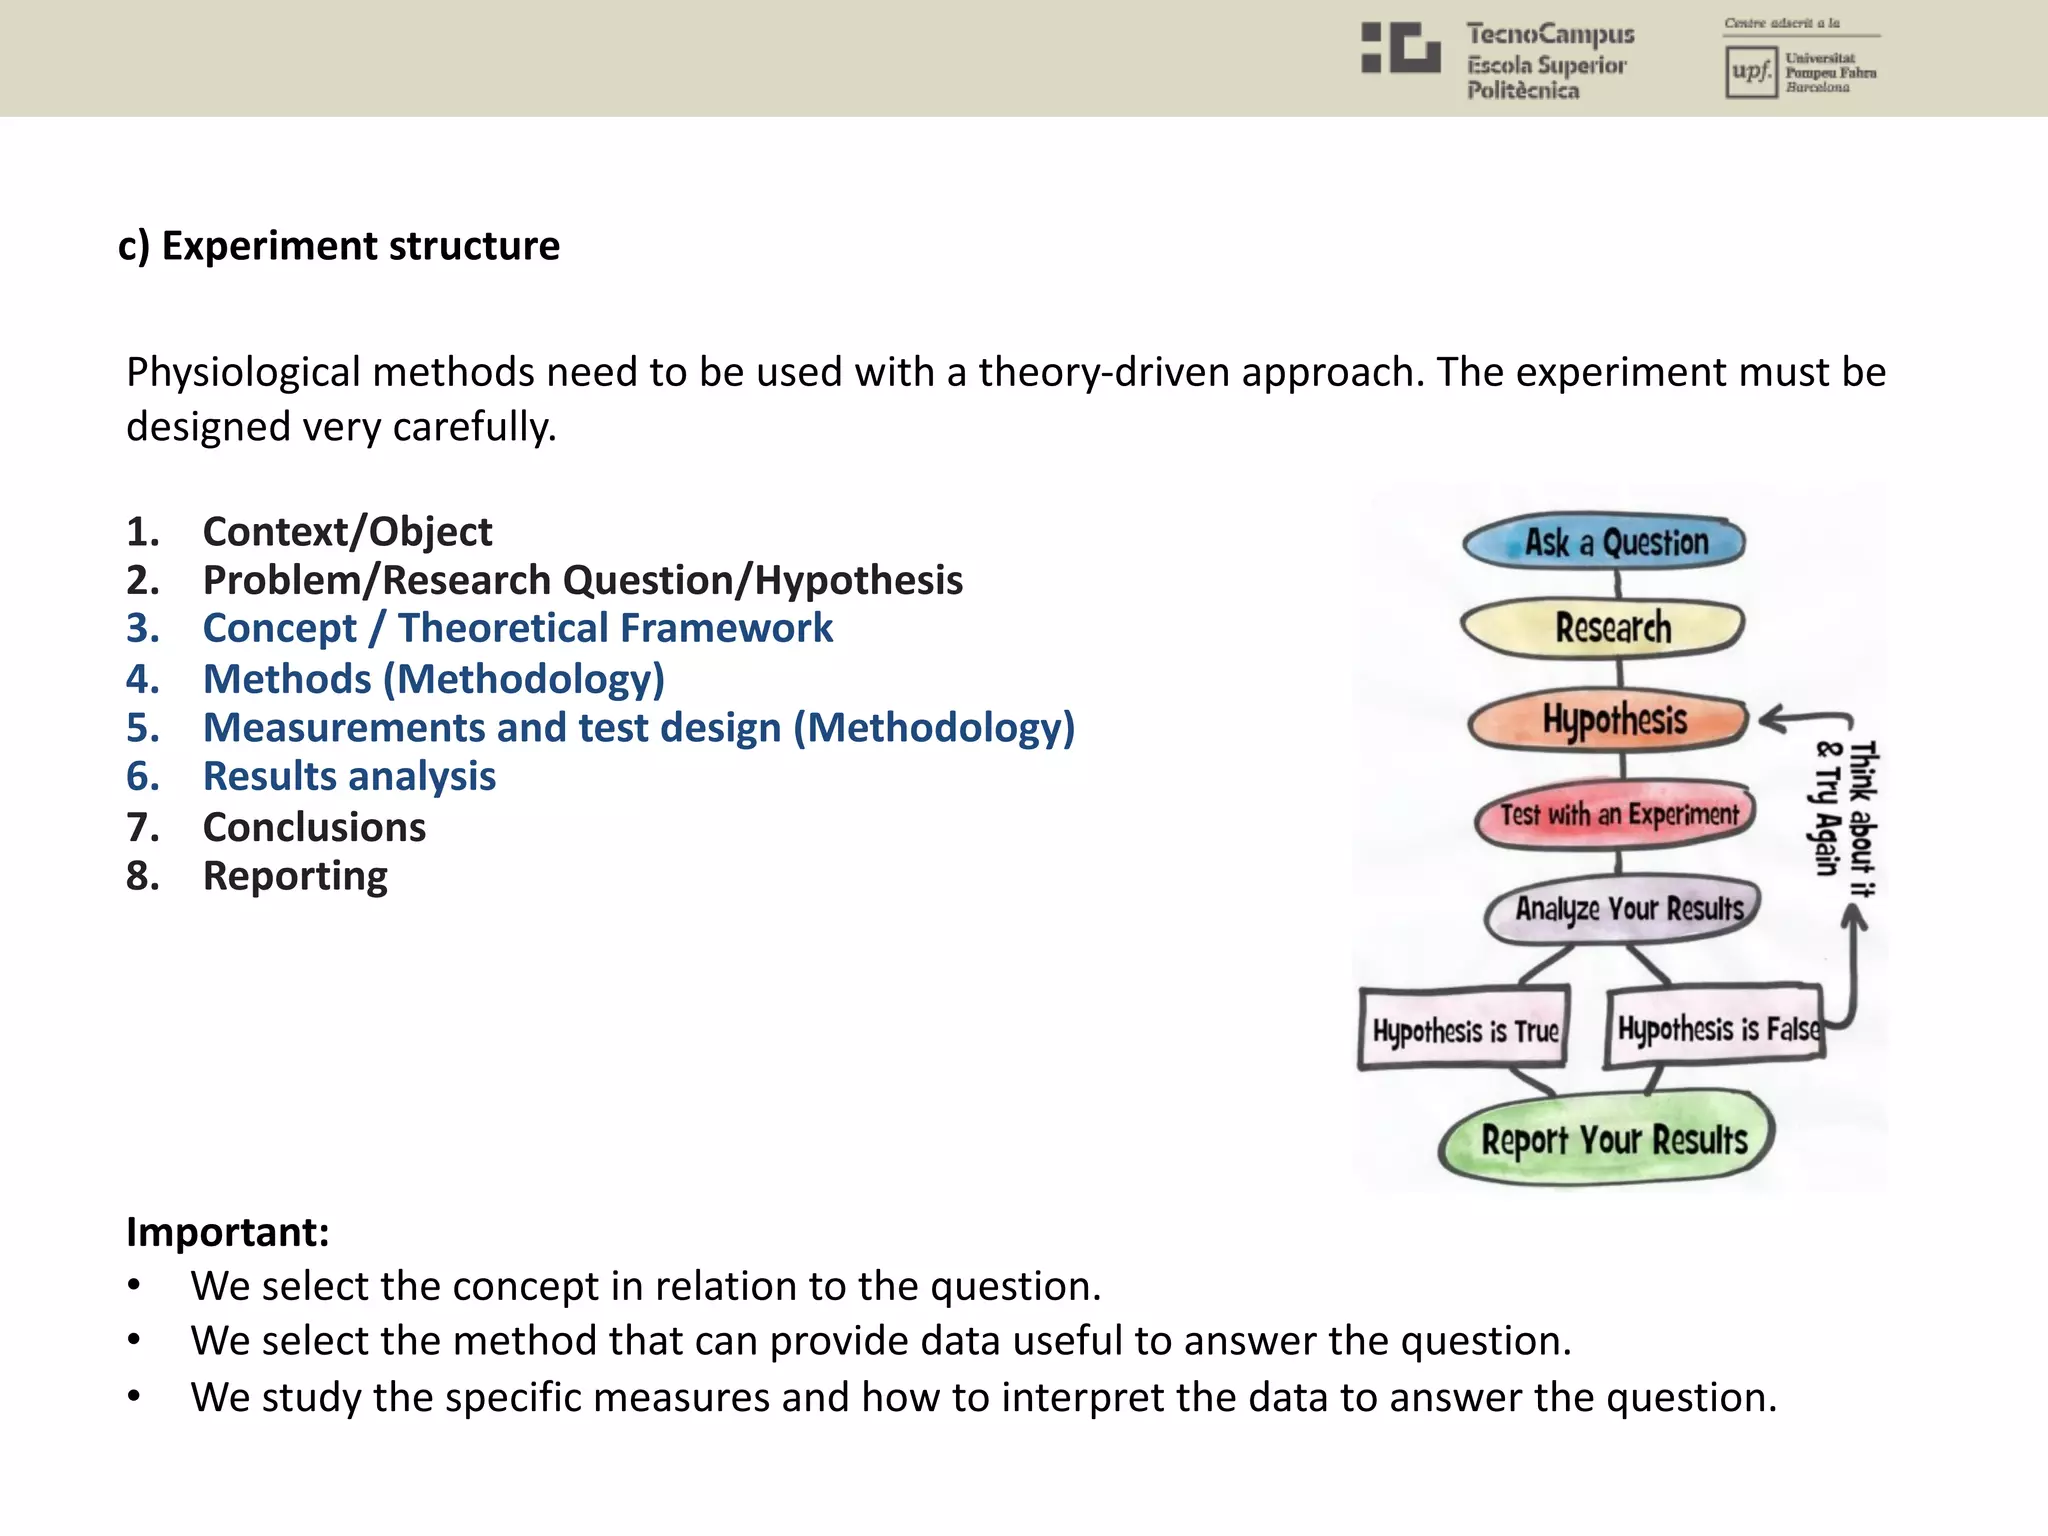
![c) Experiment structure
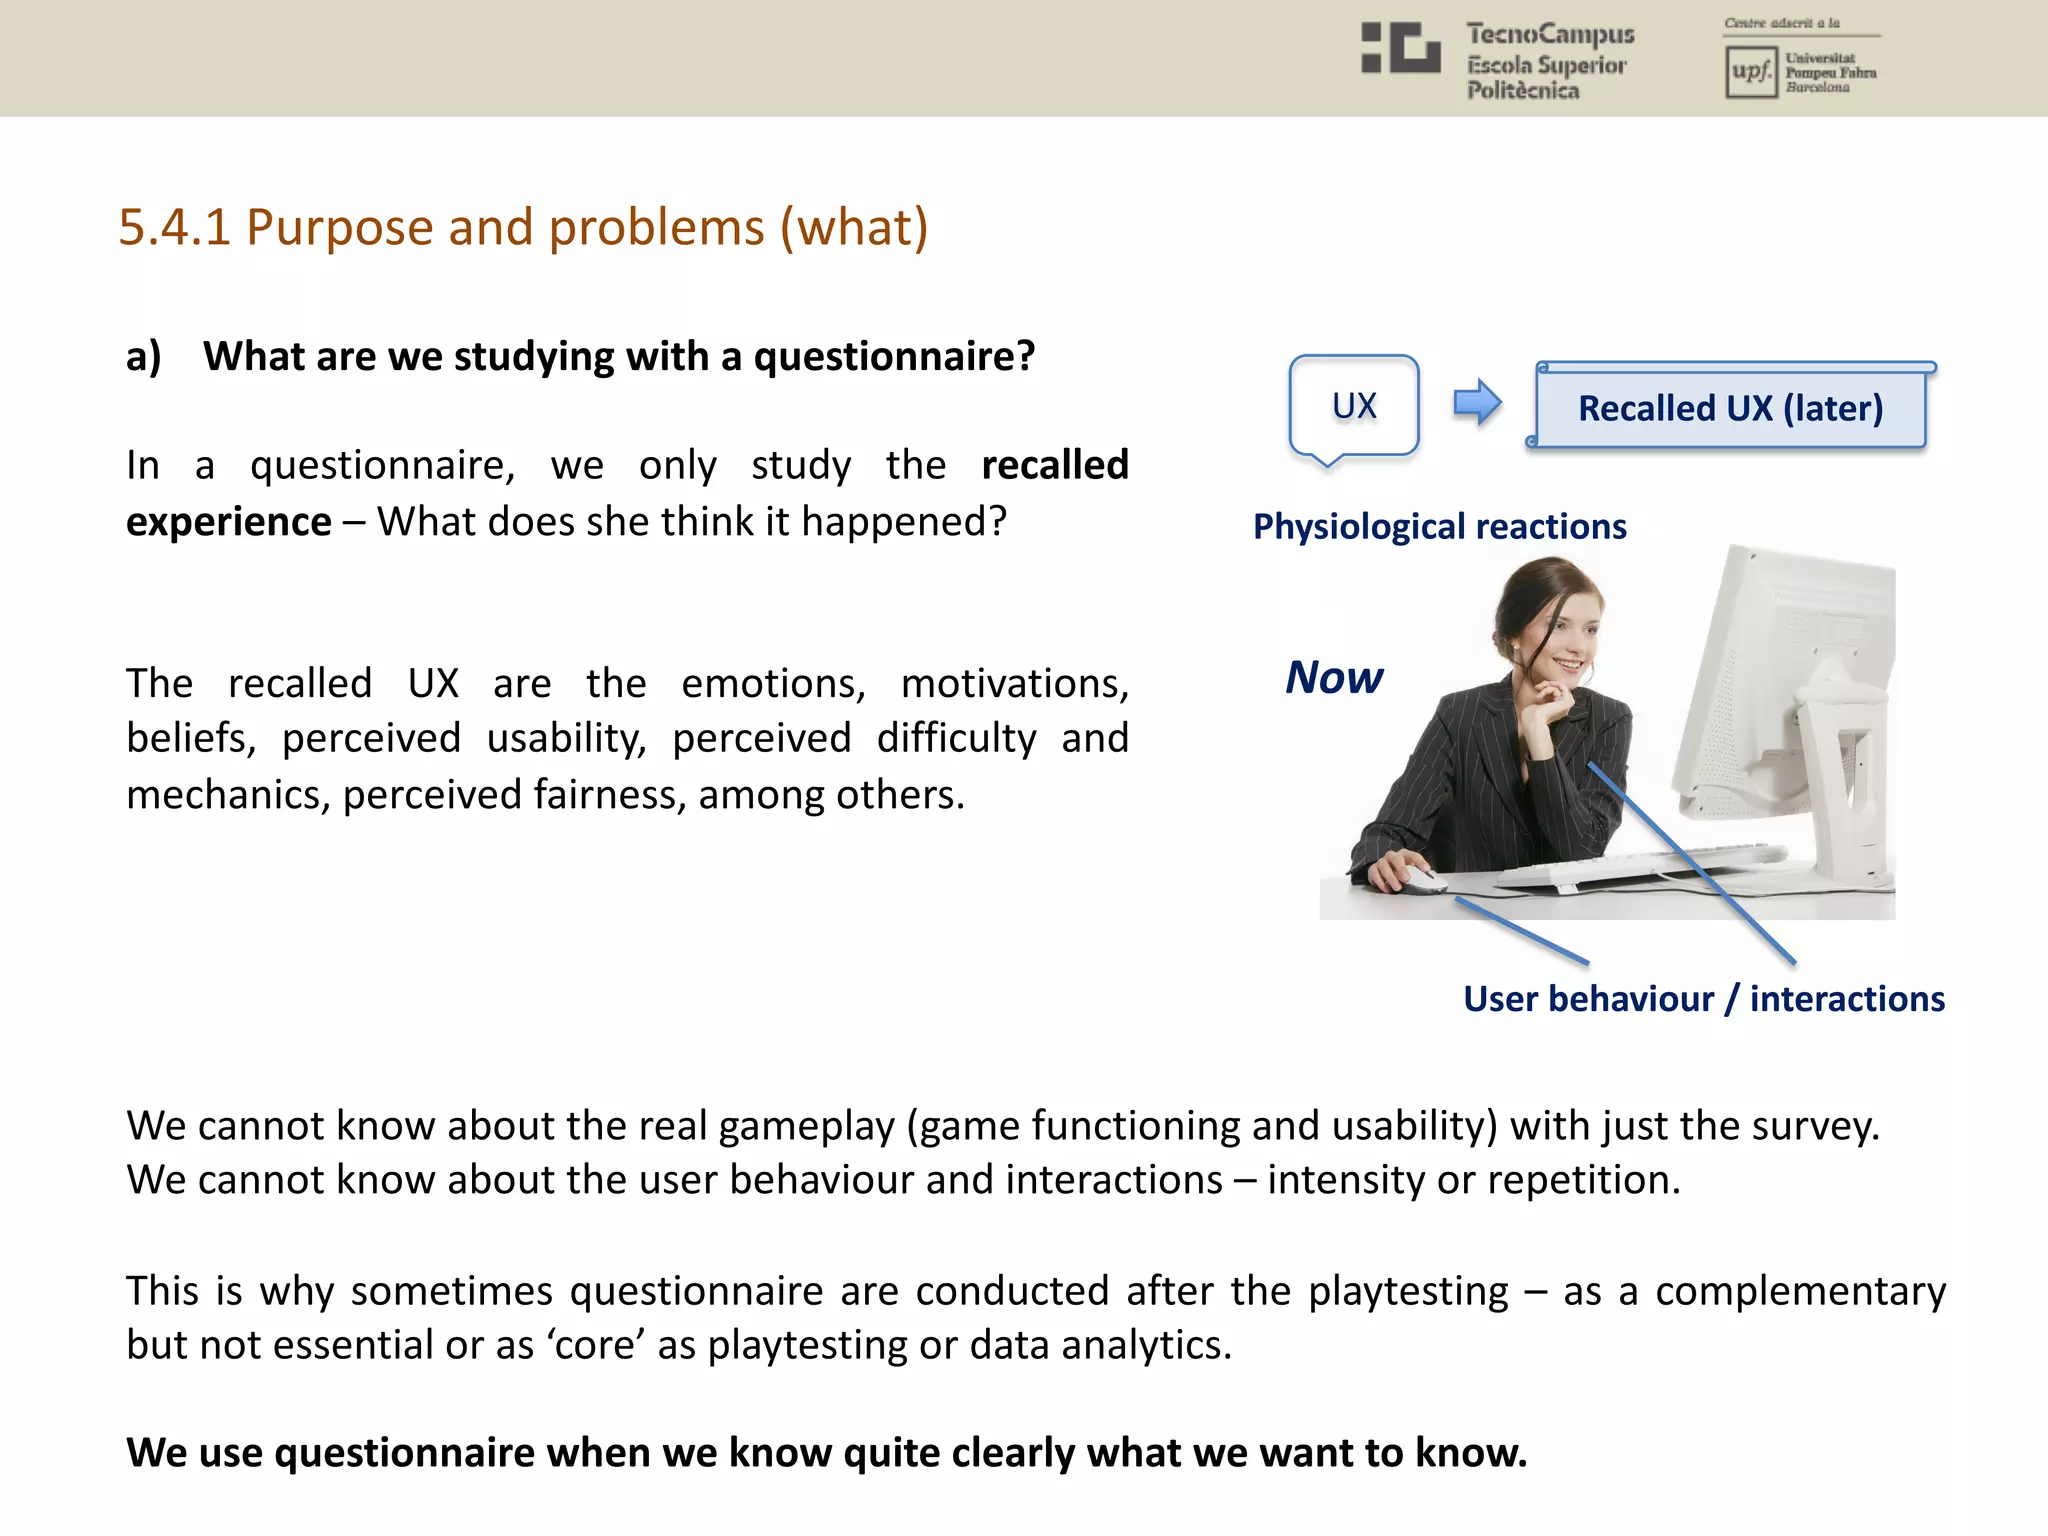
Purpose: A survey or questionnaire can be explorative to understand the context of a user when
we are designing a new service.
What to ask:
Surveys are useful to identify:
Who your users are; What your users want; What they purchase; Where they shop;
What they own; and What they think of your brand or product.
Research process
e.g. Motivation > Self-Determination Theory > Dimensions (Intrinsic, Extrinsic; Needs:
competence, relational, autonomy) > Indicators (Intrinsic = no rewards) > Hypothesis (the game
is dominated by intrinsic) > Method (Questionnaire) > Questions (‘You had the most fun while
maneuvering the car’> Results > Conclusions (the game is dominated by intrinsic but…).
[https://uxmastery.com/better-user-research-through-surveys/]](https://image.slidesharecdn.com/uxu7-190402205419/75/User-Experience-7-Quantitative-Methods-Questionnaires-Biometrics-and-Data-Analysis-11-2048.jpg)
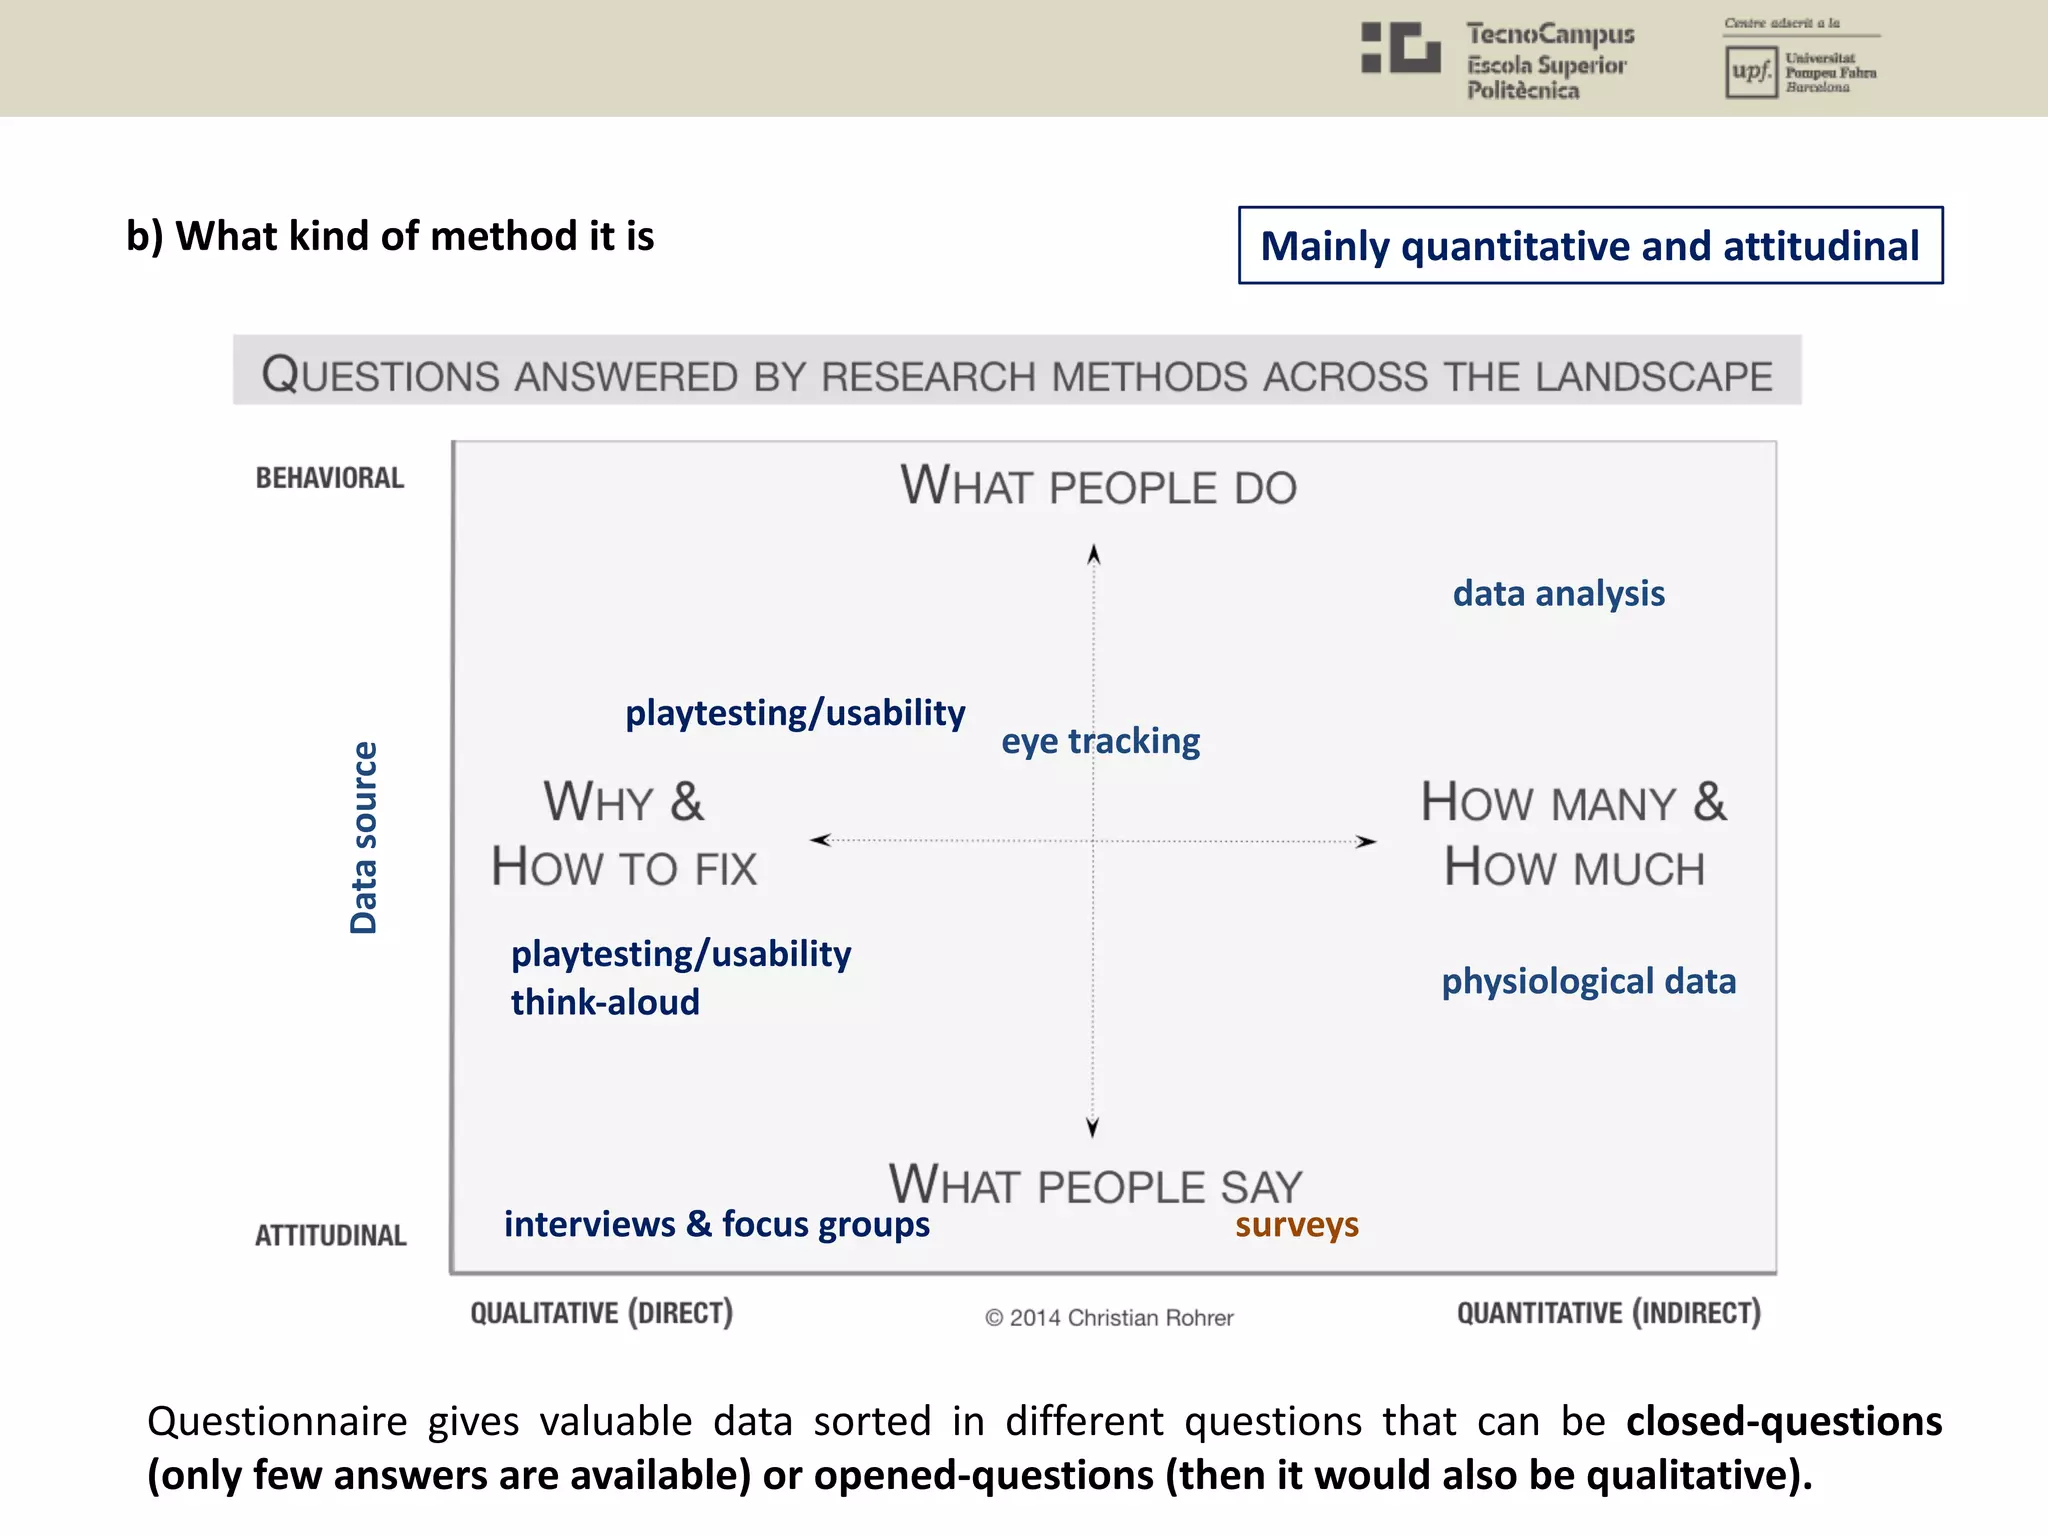
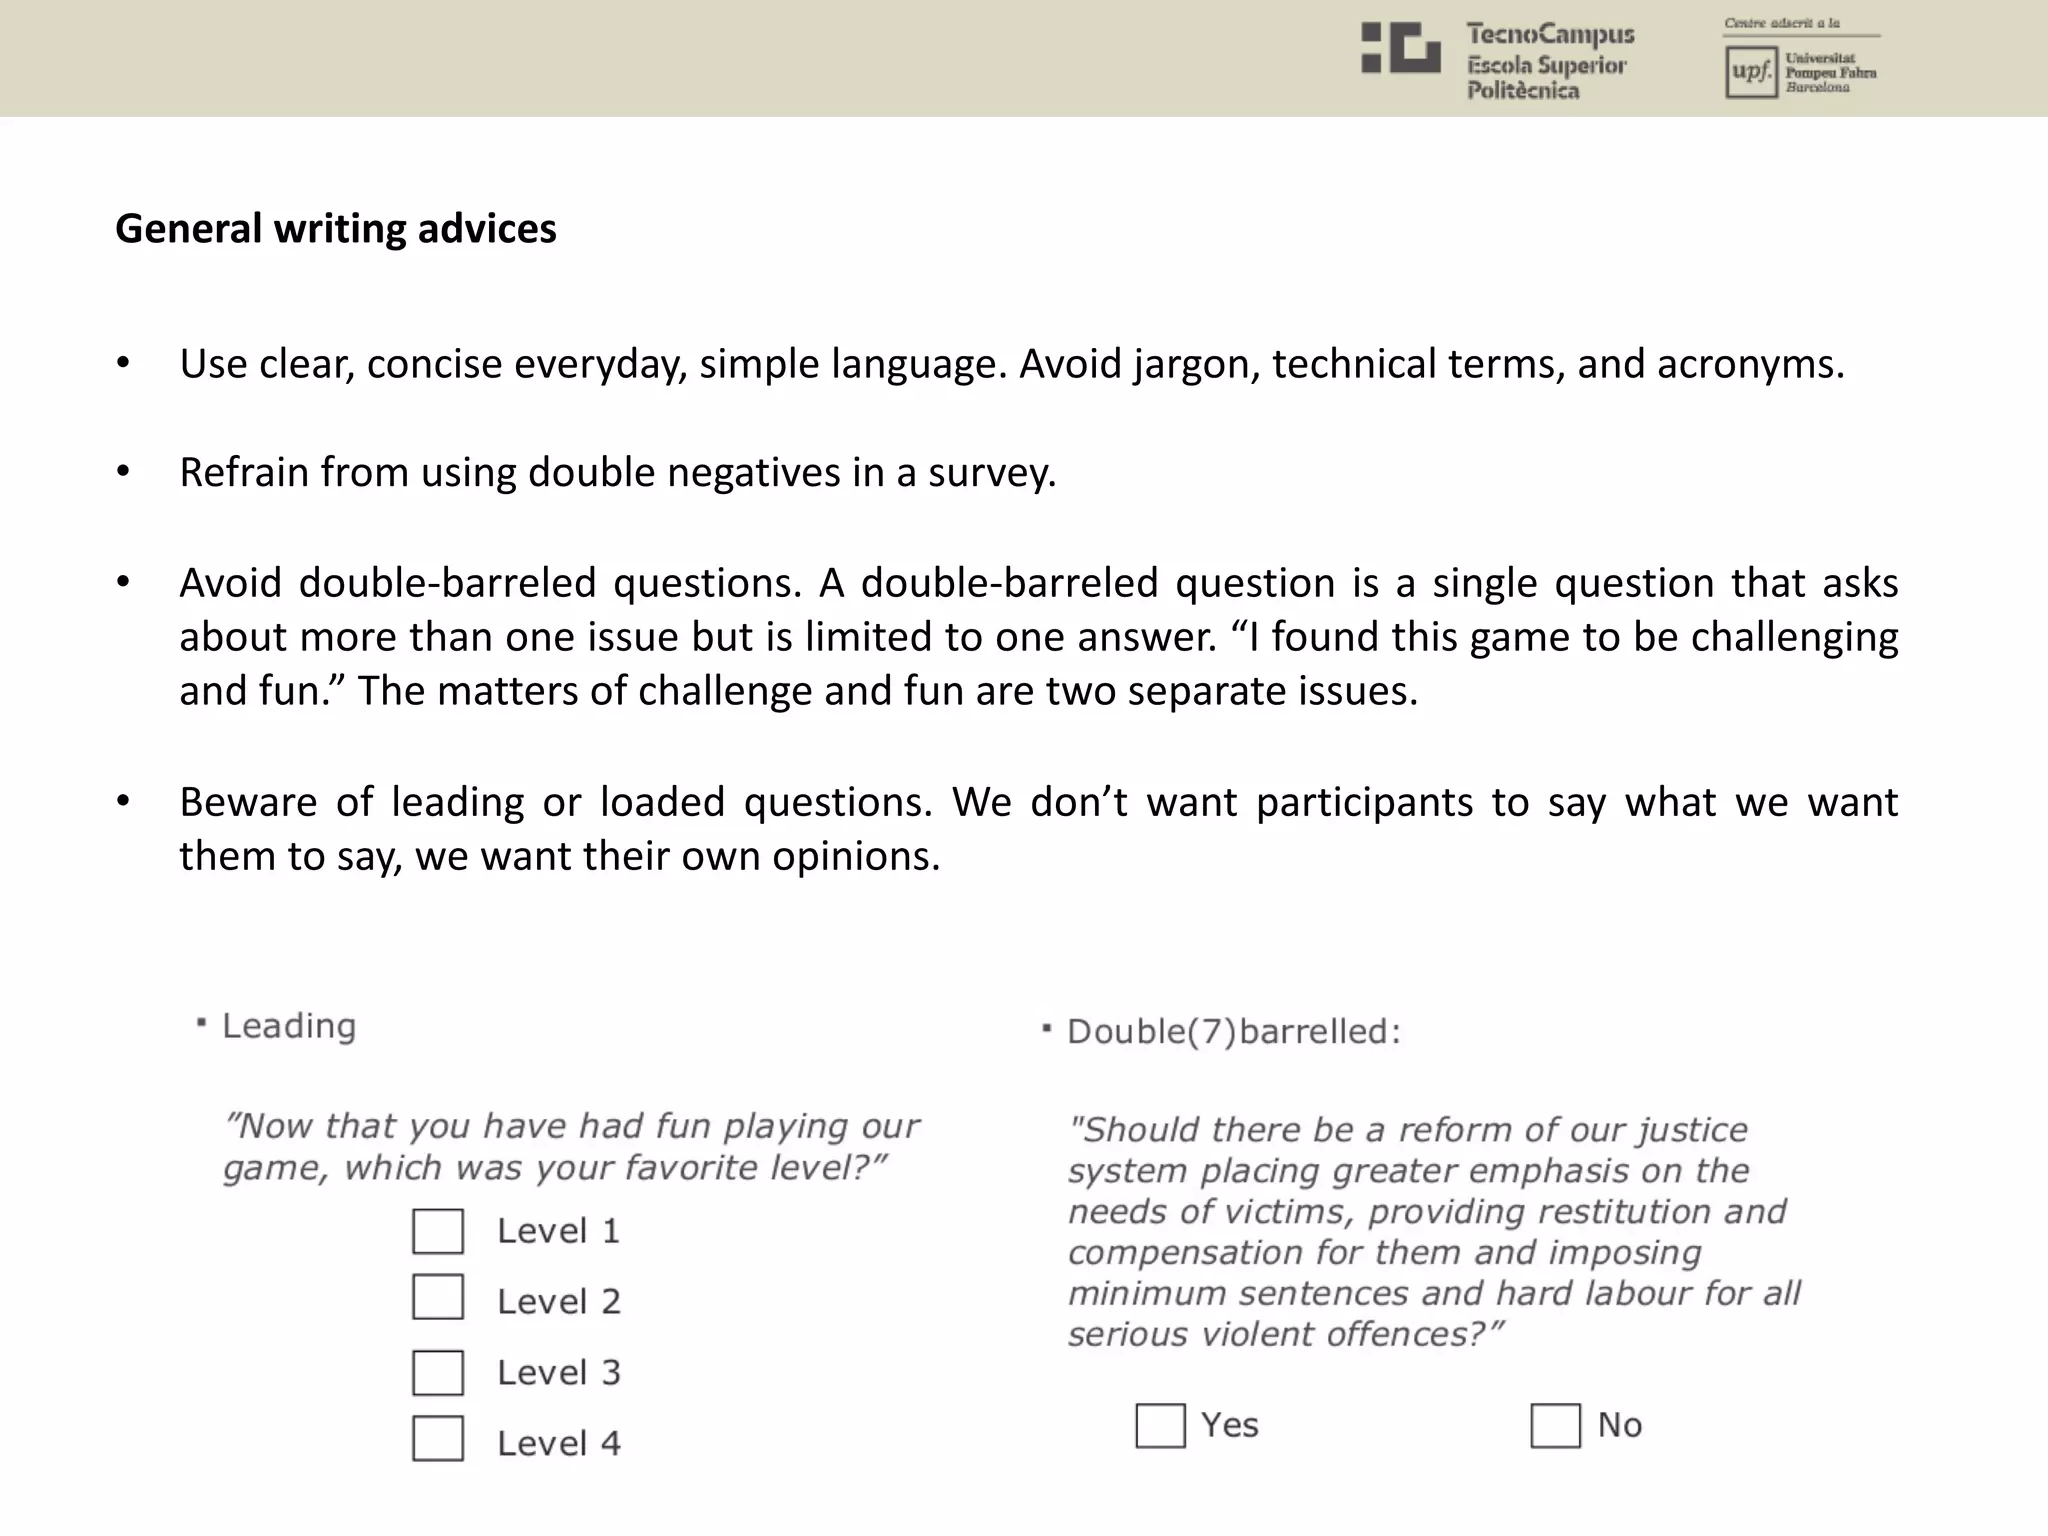
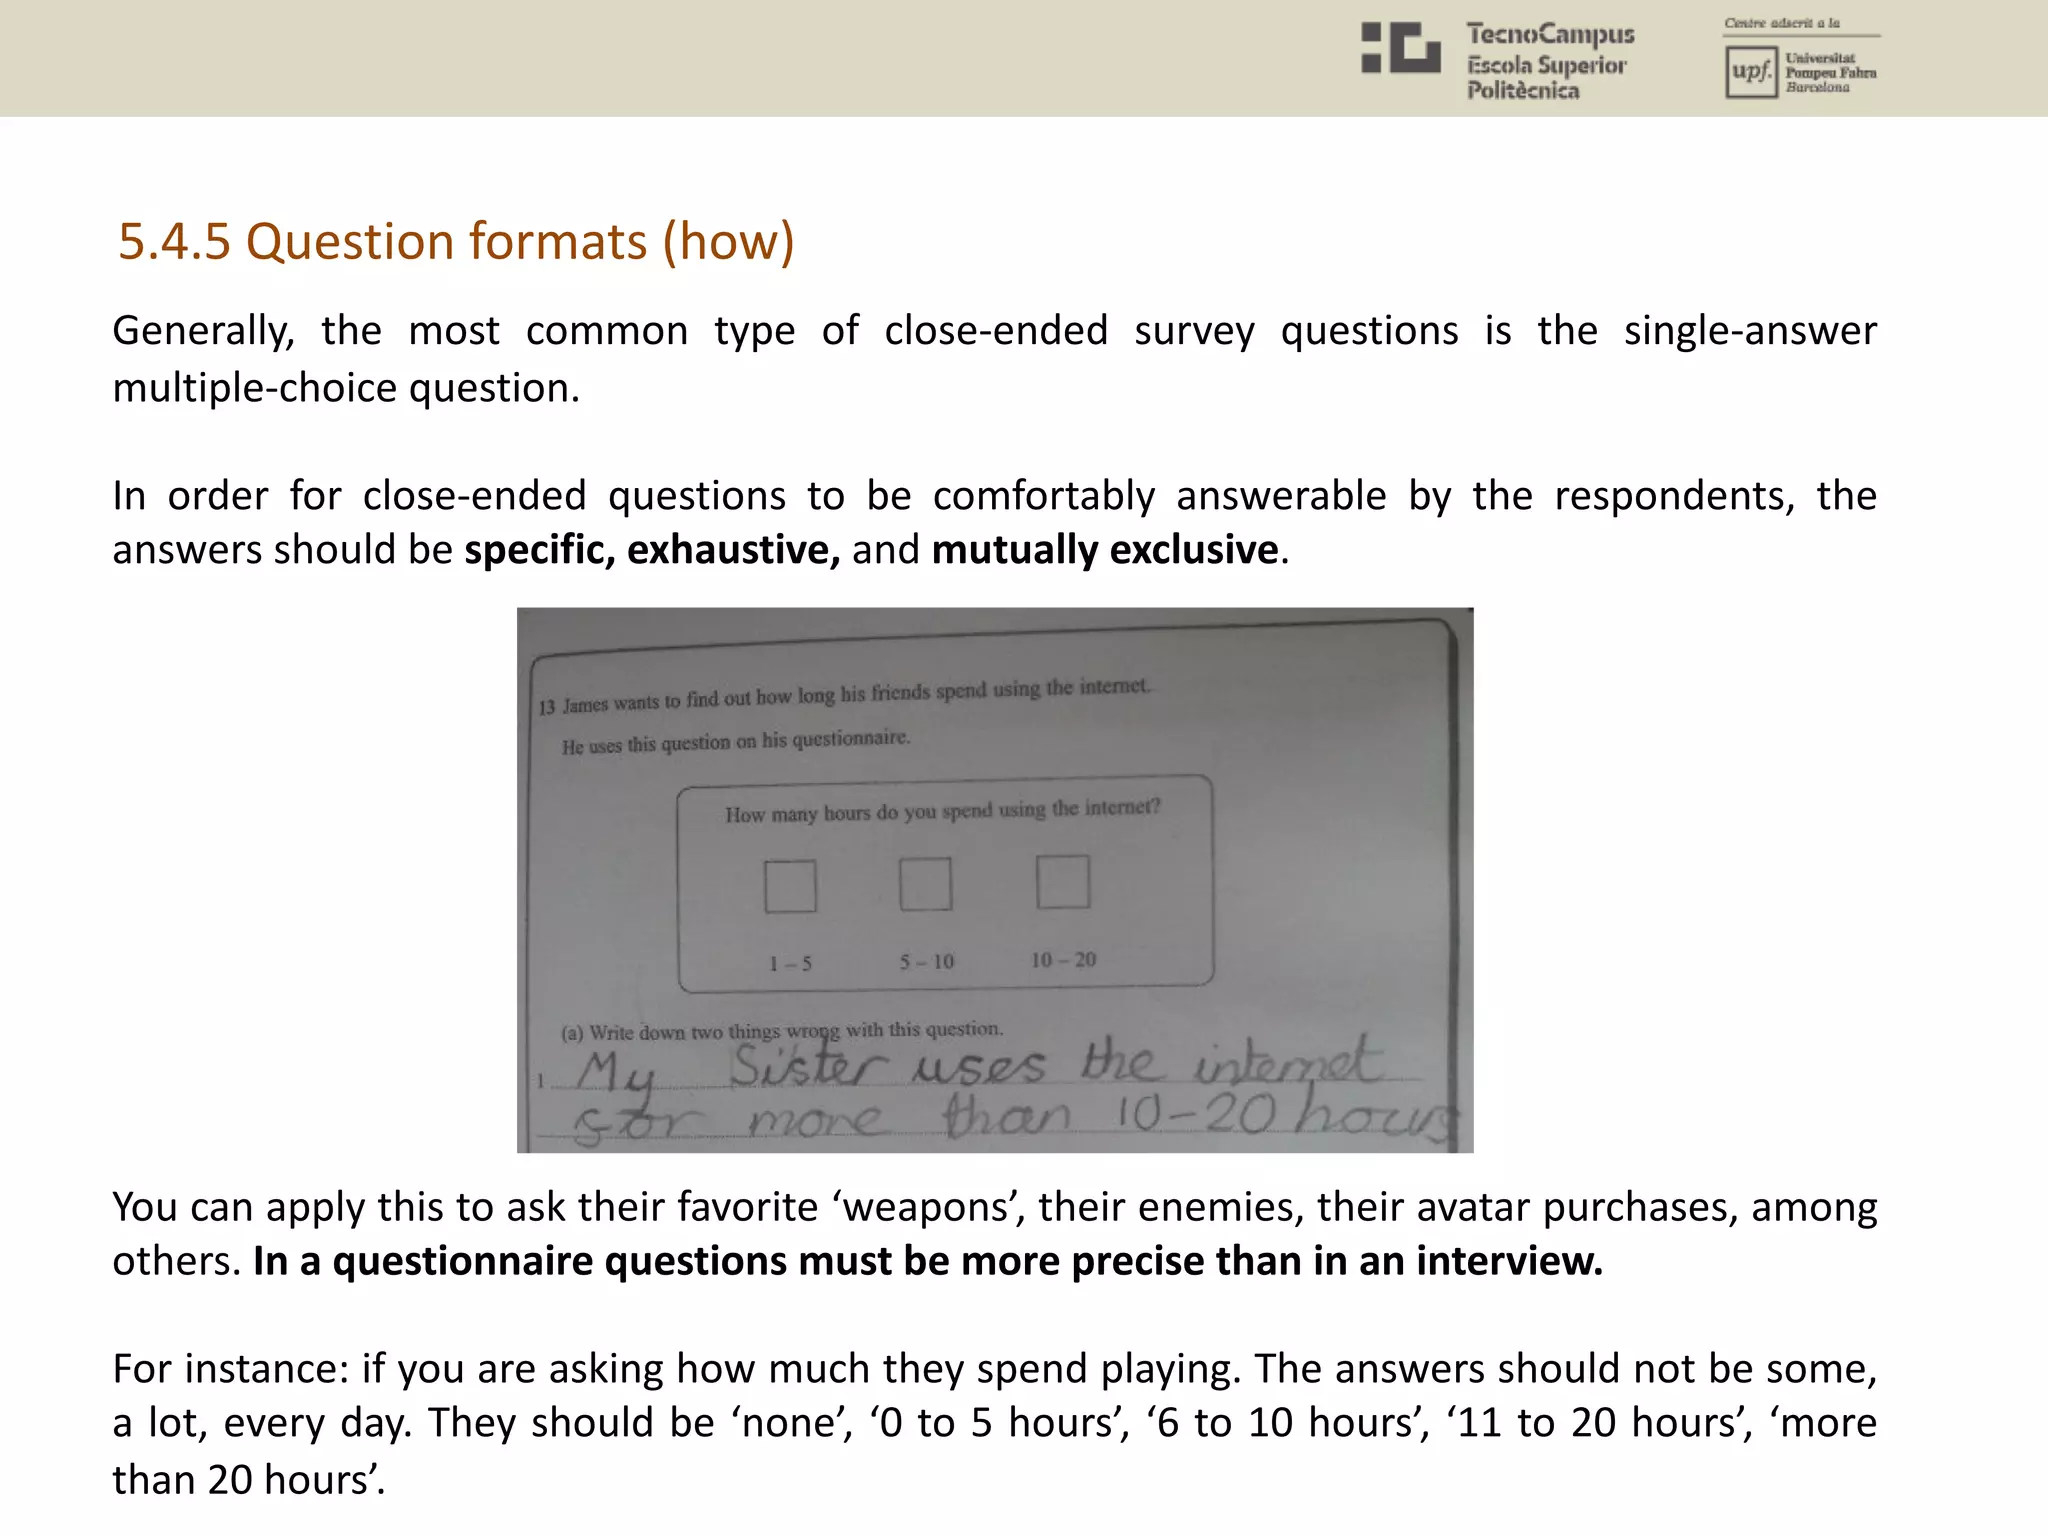
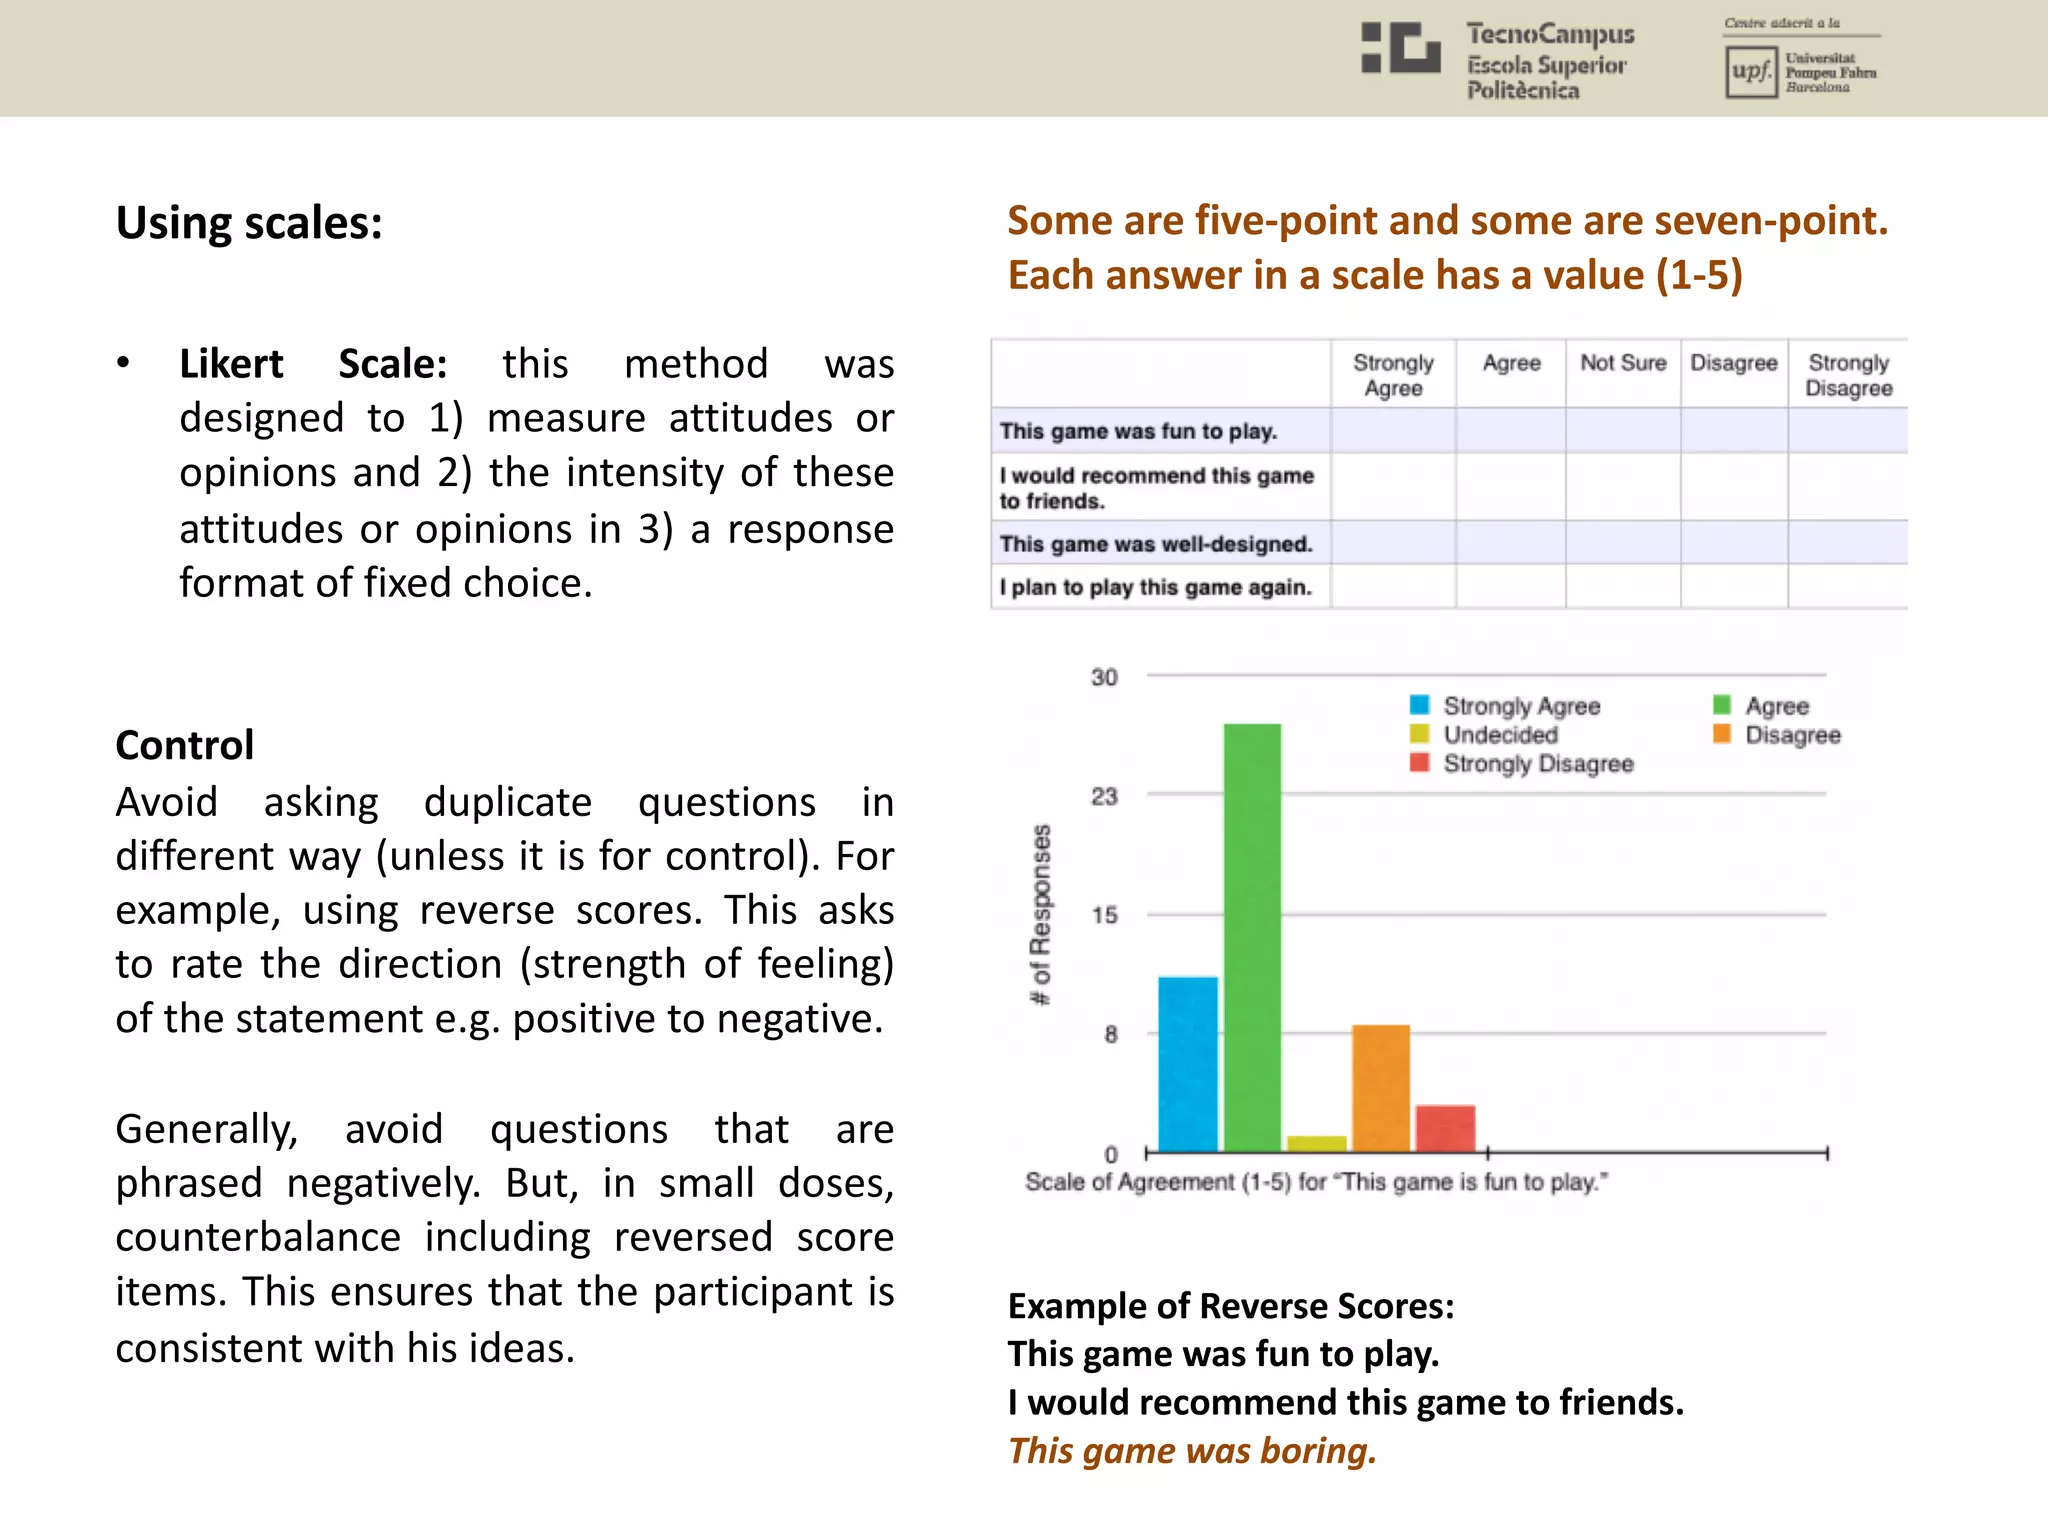
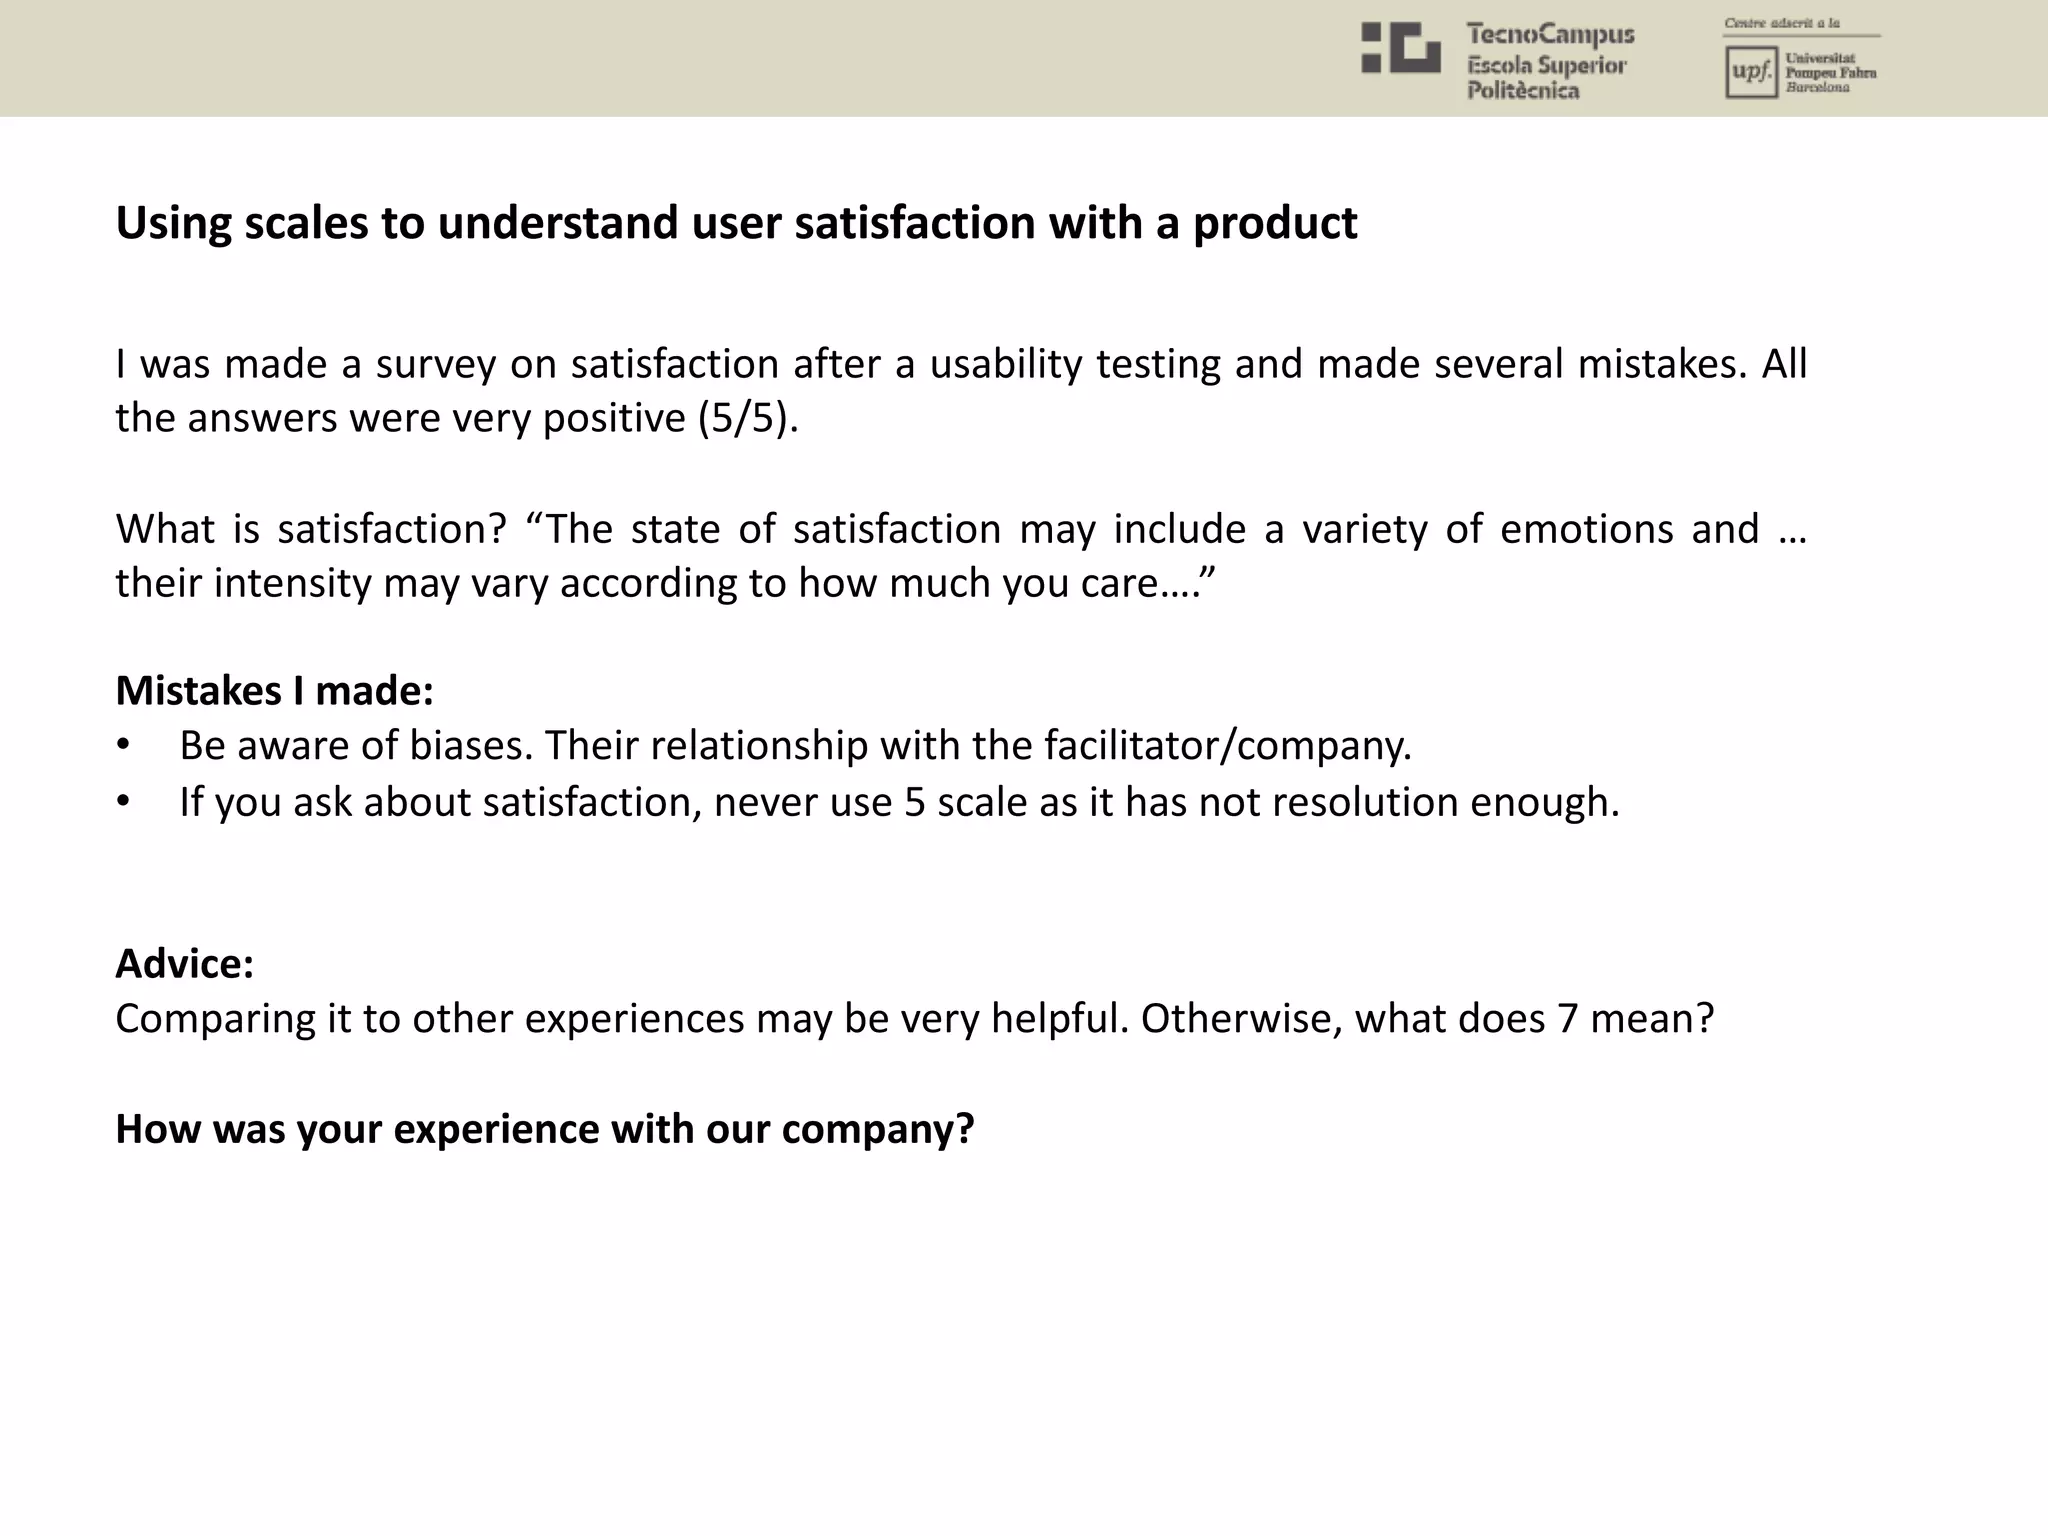
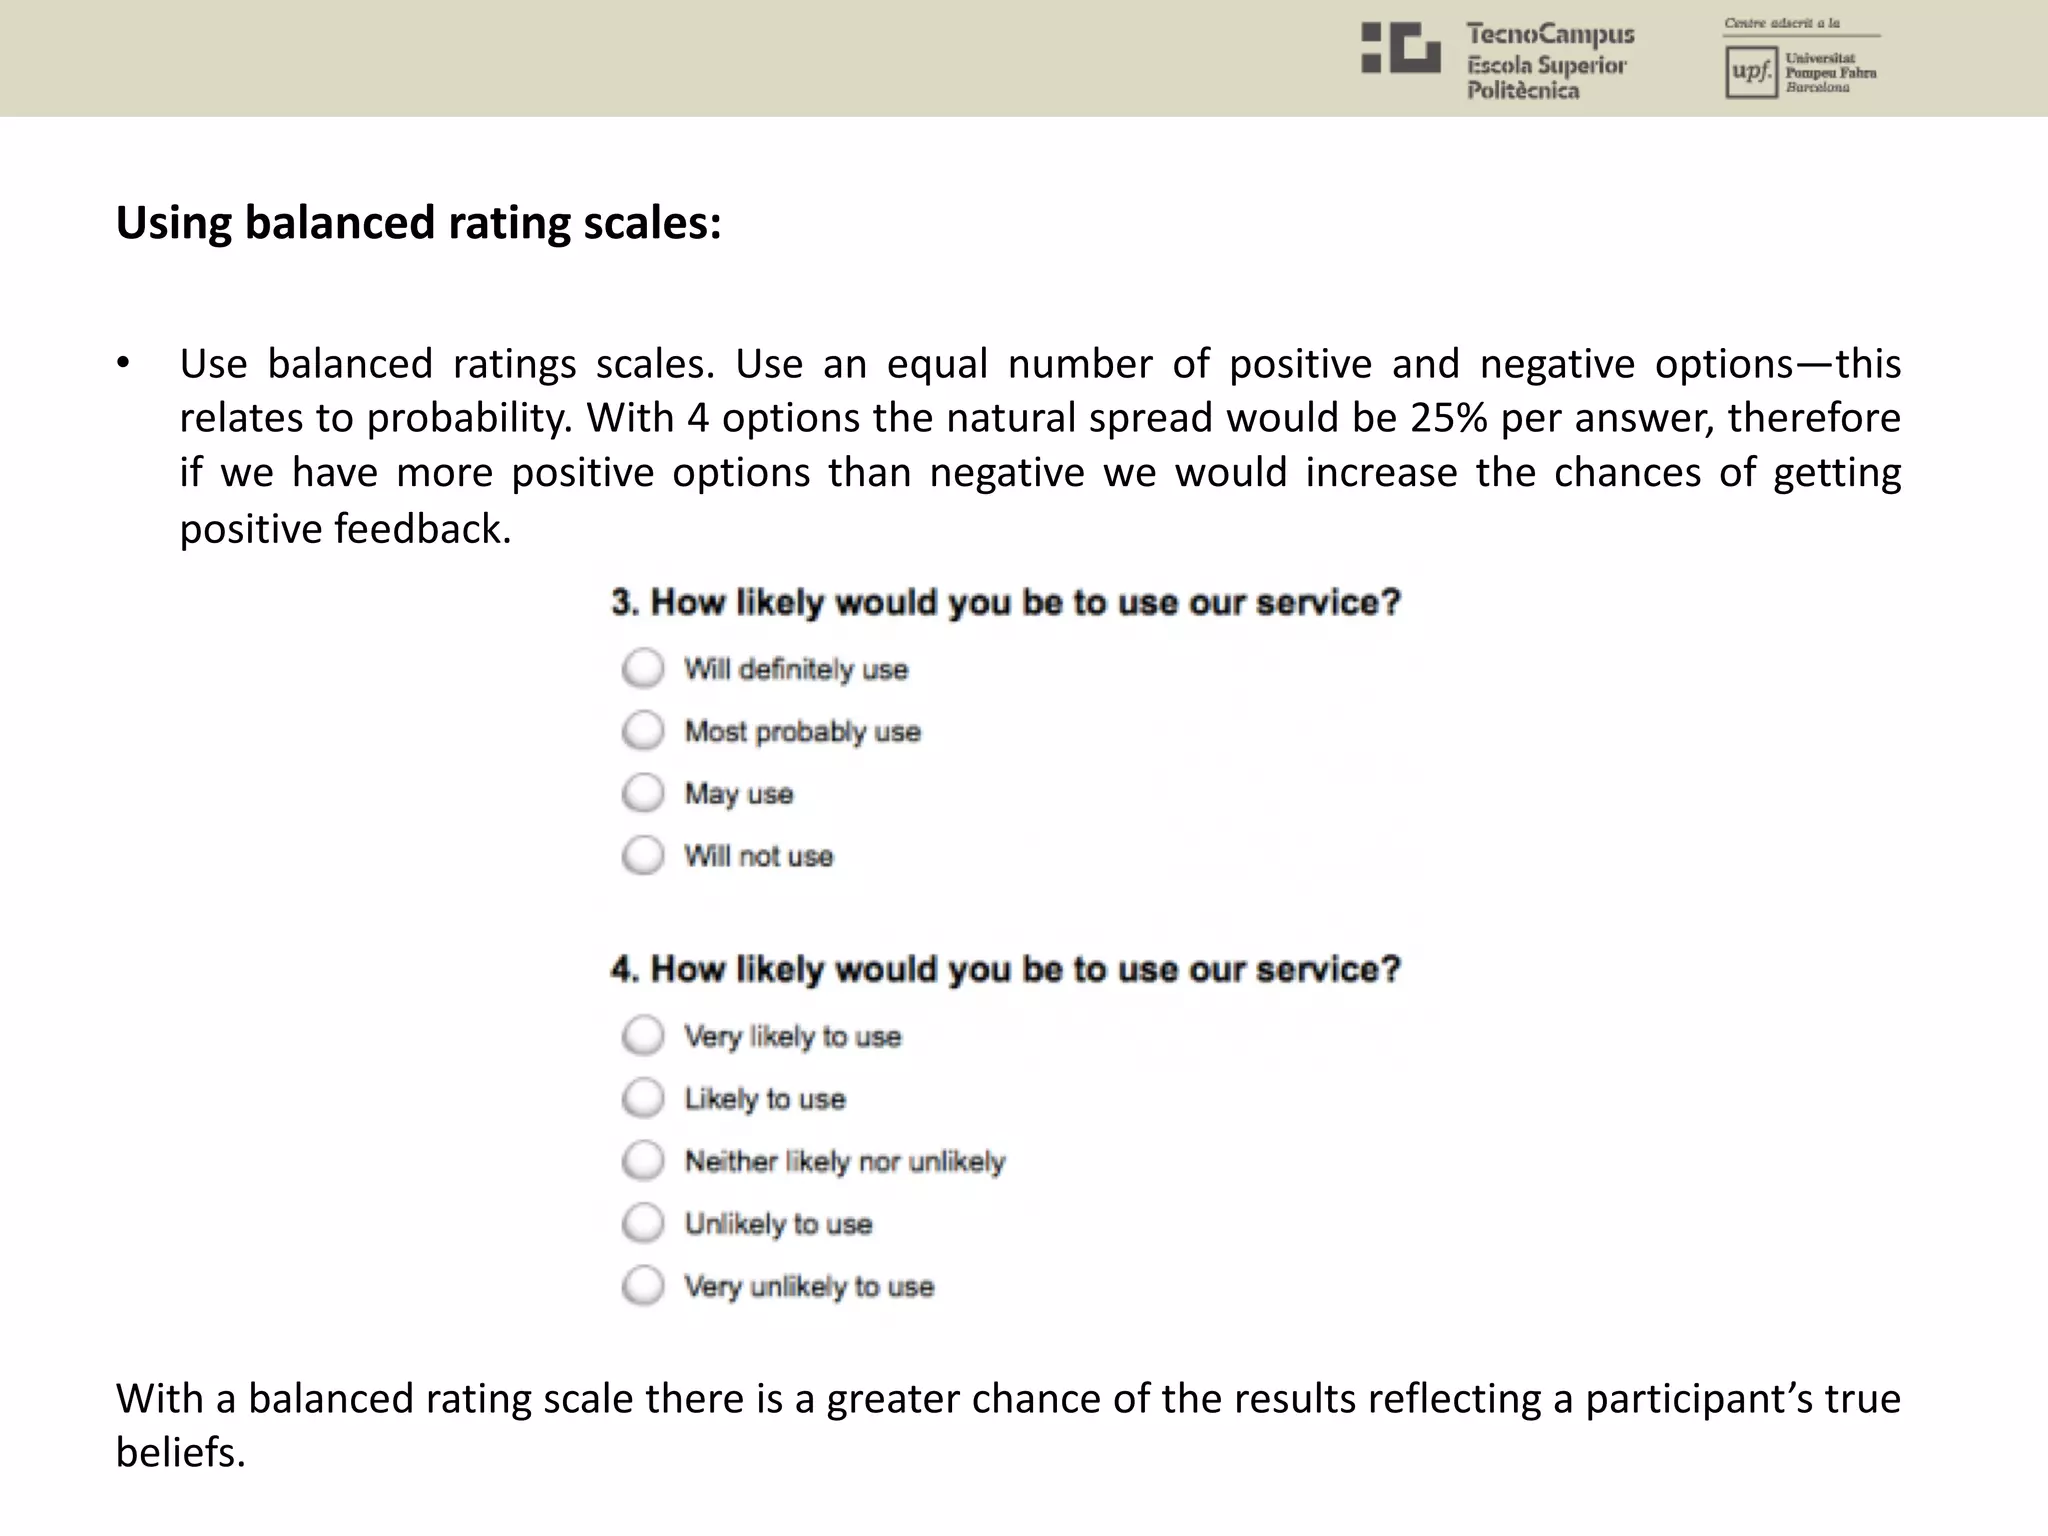
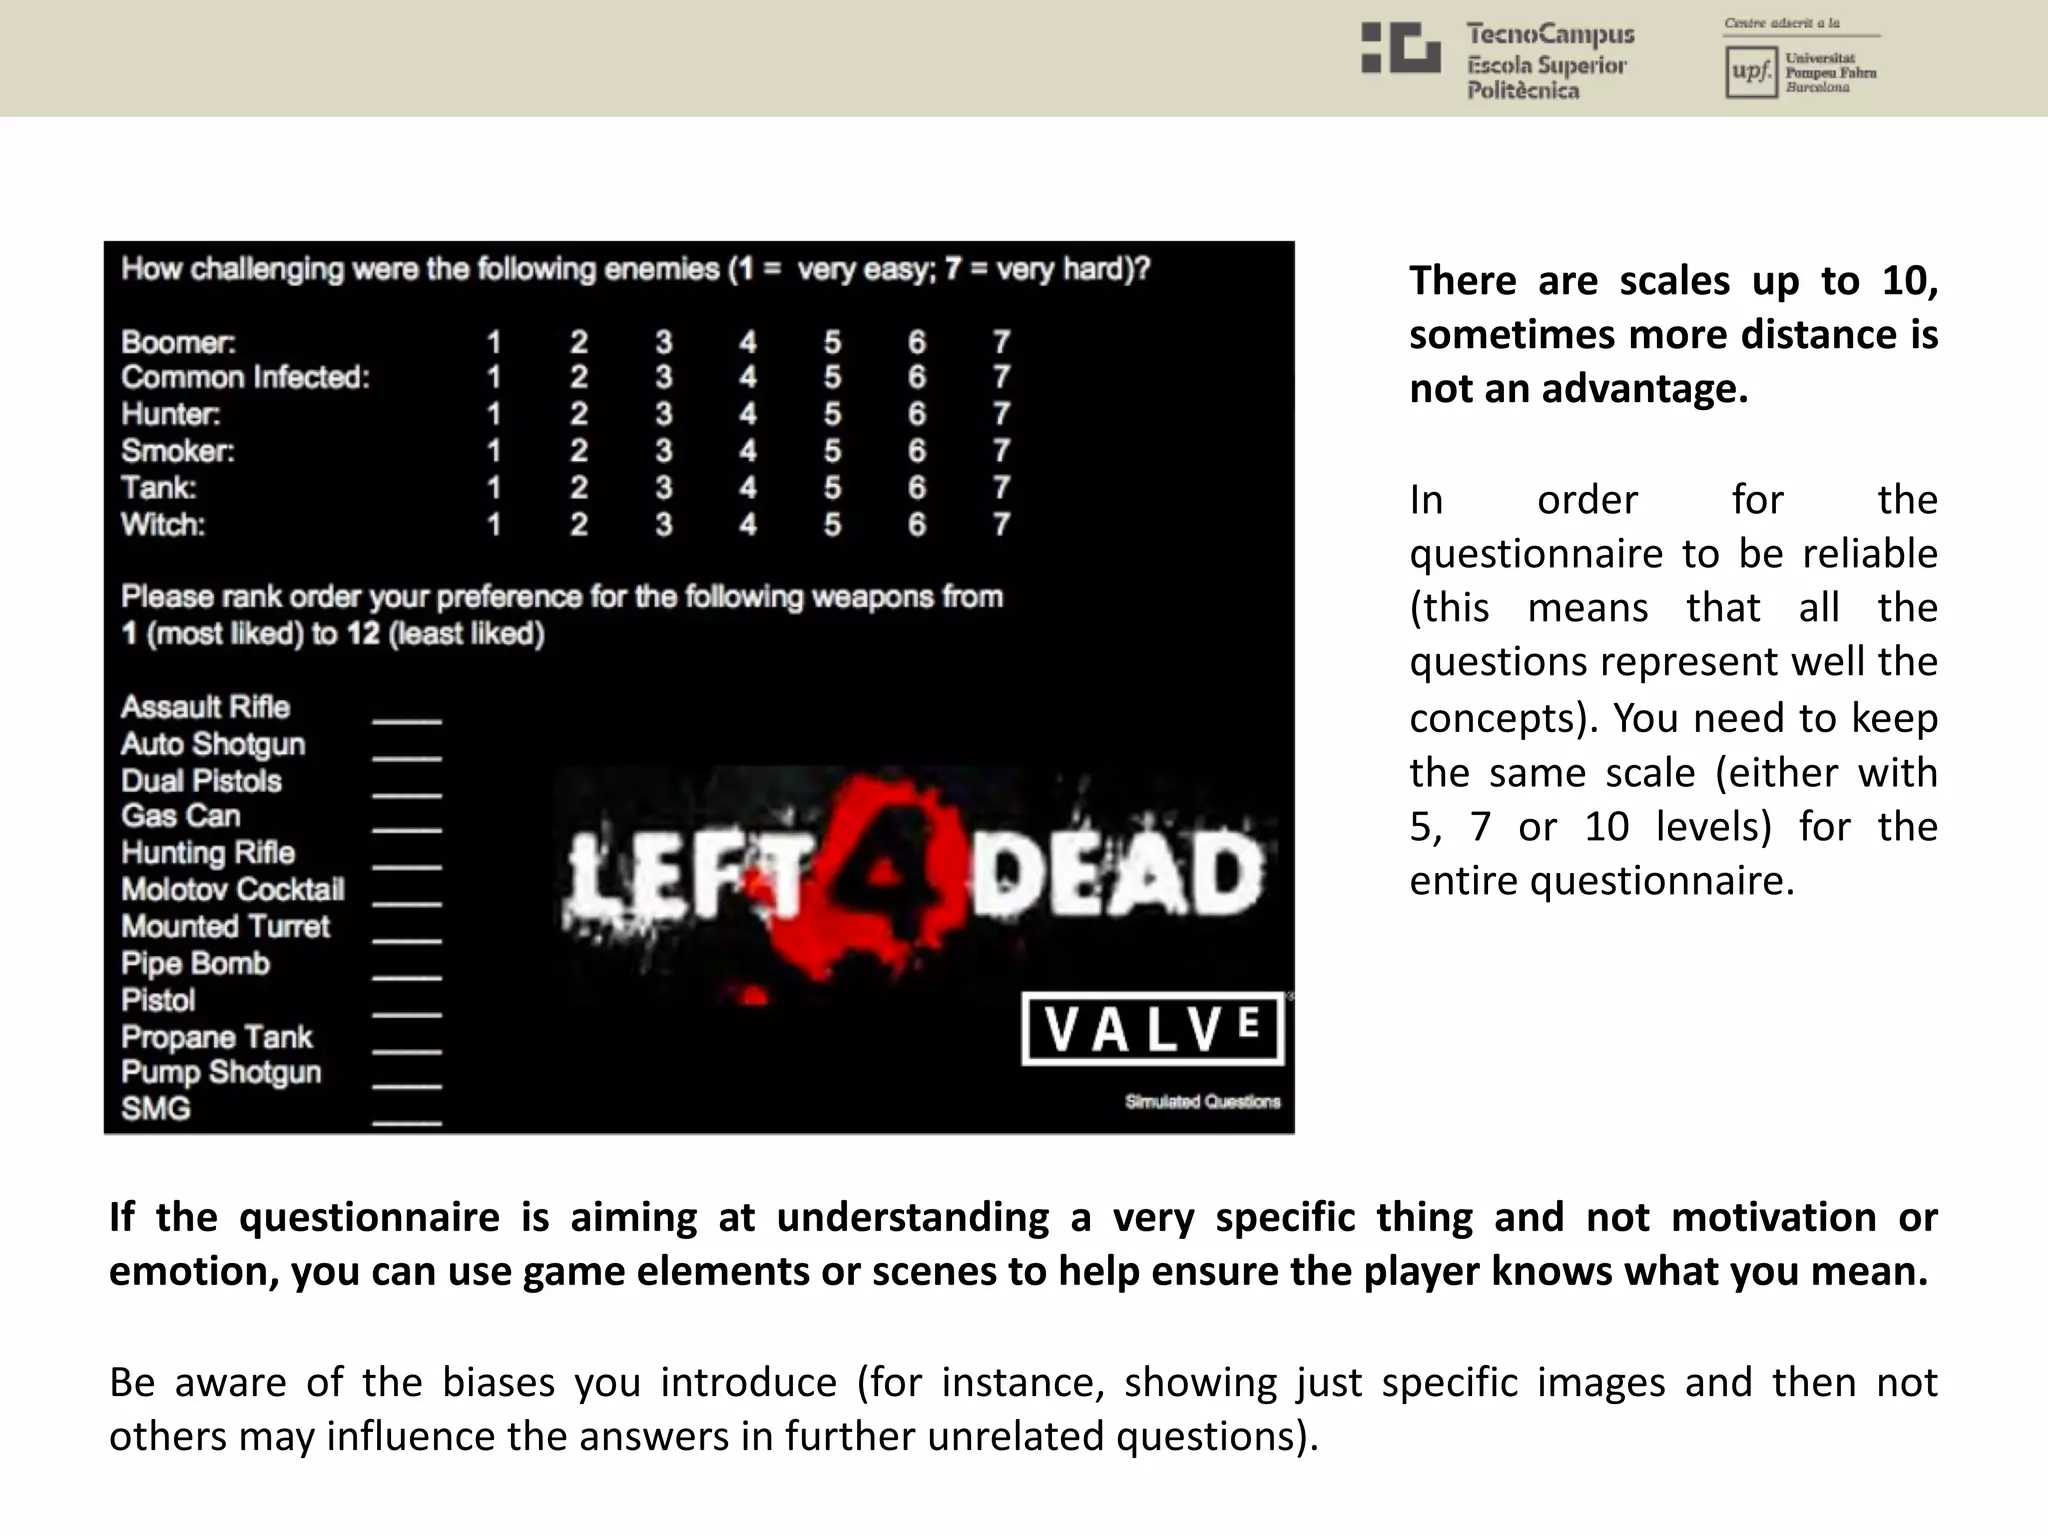
![5.4.4 Question formulation (how)
• Each question must be mapped or related to a particular concept or problem you are
trying to understand (research question).
Let us say we want to study emotional attachment or motivation (again).
Validity: A questionnaire experiment is valid if it measures what it claims to measure. For
example, a test measuring the emotional attachment to a set of characters should not ask
something else such as the UI/UX design. Another way to think about it is if I’m trying to
measure a player’s attitude of a game’s level difficulty, am I asking the correct questions to be
able to gauge that?
In order to be sure that we are asking questions about the concepts or topics we are thinking
about, we should give the questionnaire to someone to try to identify the concepts and check
the agreement.
The number of questions will determine the time to answer (it should not exceed 15-20 min.).
[http://www.gamasutra.com/view/feature/169069/finding_out_what_they_think_a_.php?print=1]
[http://www.gamasutra.com/blogs/NeferDoane/20150316/238780/How_to_Design_a_Survey_for_User_Feedba
ck.php?print=1]](https://image.slidesharecdn.com/uxu7-190402205419/75/User-Experience-7-Quantitative-Methods-Questionnaires-Biometrics-and-Data-Analysis-13-2048.jpg)
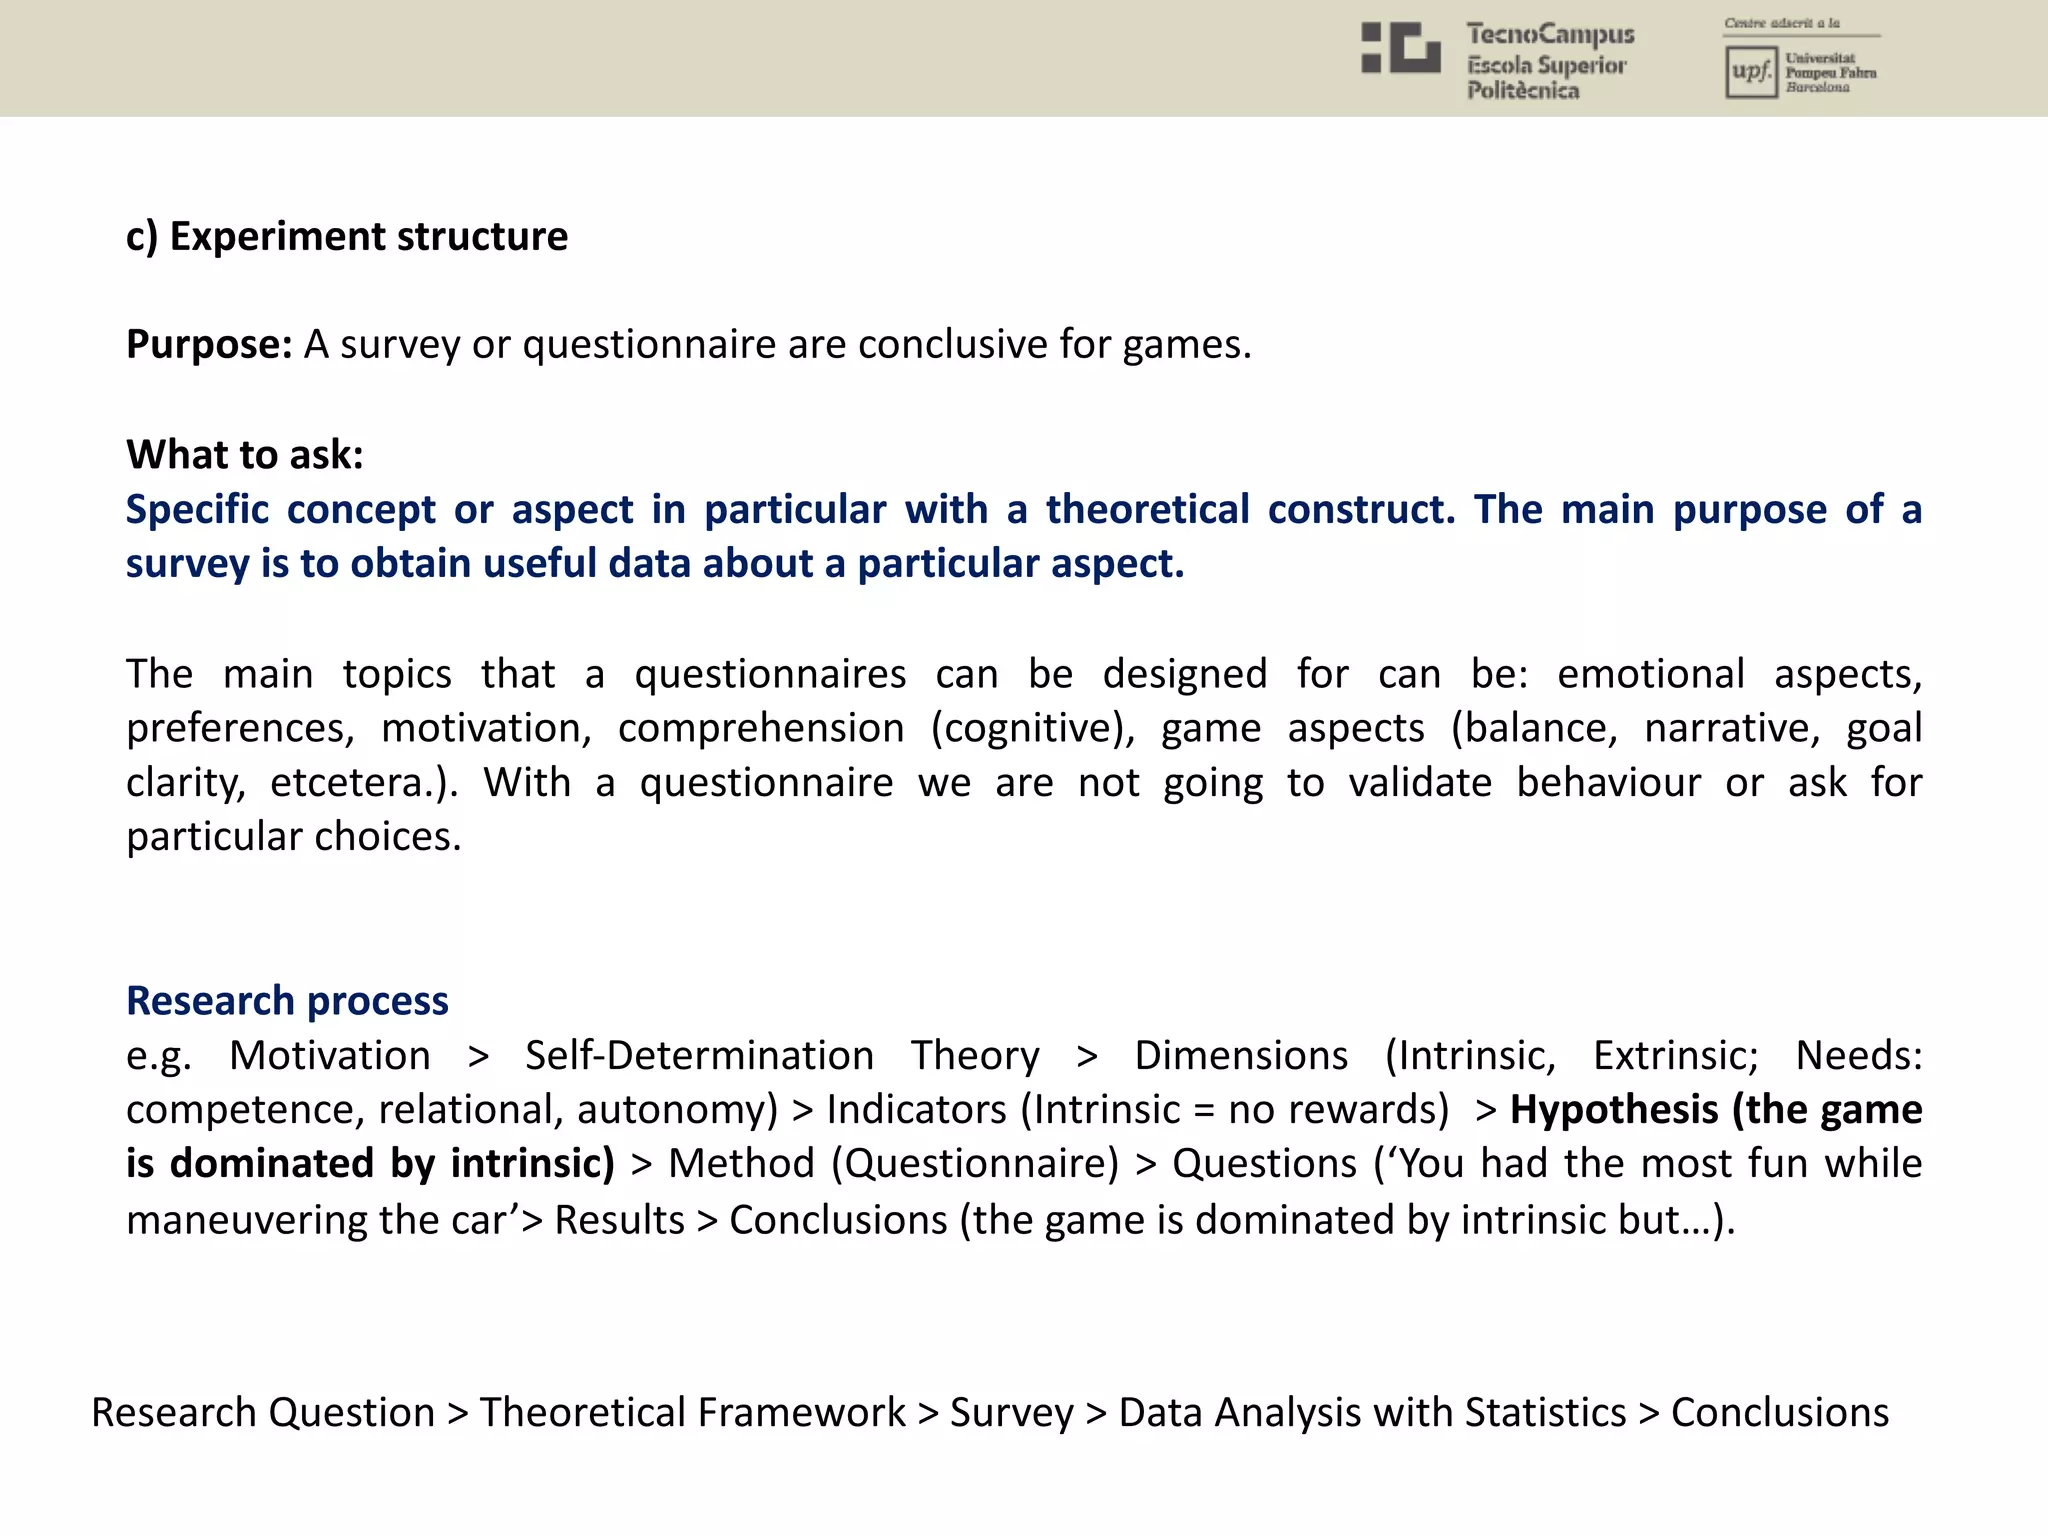
![5.4.6 Pros / Cons
Pros
• Cost-efficiency: Ease of gathering large amounts of data, practically no constraints on
geographical location and demographics, and quick results — in other words… time and
money. While a survey’s construction can take considerable effort, the player’s role in filling it
out usually takes a short amount of time.
• Consistent and reliable. You know that participants are answering to the same questions and
you can work out this data together.
• Quantifiable. You can compare different concepts and see their magnitude much more easily
(in comparison with interview) and in a large scale.
Cons.
• Individuals might be unfamiliar with or have difficulty remembering relevant information. An
additional reason for this is that individuals may feel societal pressure to respond in a manner
that will be viewed favorably by others, a social science term called social desirability bias.
• Another challenge when using survey design is that surveys have inflexible design (you can’t
change anything about the survey once you’ve started to administer it). The reasons for this
inflexibility is to maintain the validity of collected data. (for instance, it is no possible to add
follow up questions). Besides, it takes some time to create them in a proper way.
• Need a large(ish) sample to be sure that the data is representative.
• It reflects what users say instead of what users do (typical limits of subjective data).
[http://www.gamasutra.com/blogs/NeferDoane/20150316/238780/How_to_Design_a_Survey_for_User_Feed
back.php]](https://image.slidesharecdn.com/uxu7-190402205419/75/User-Experience-7-Quantitative-Methods-Questionnaires-Biometrics-and-Data-Analysis-21-2048.jpg)
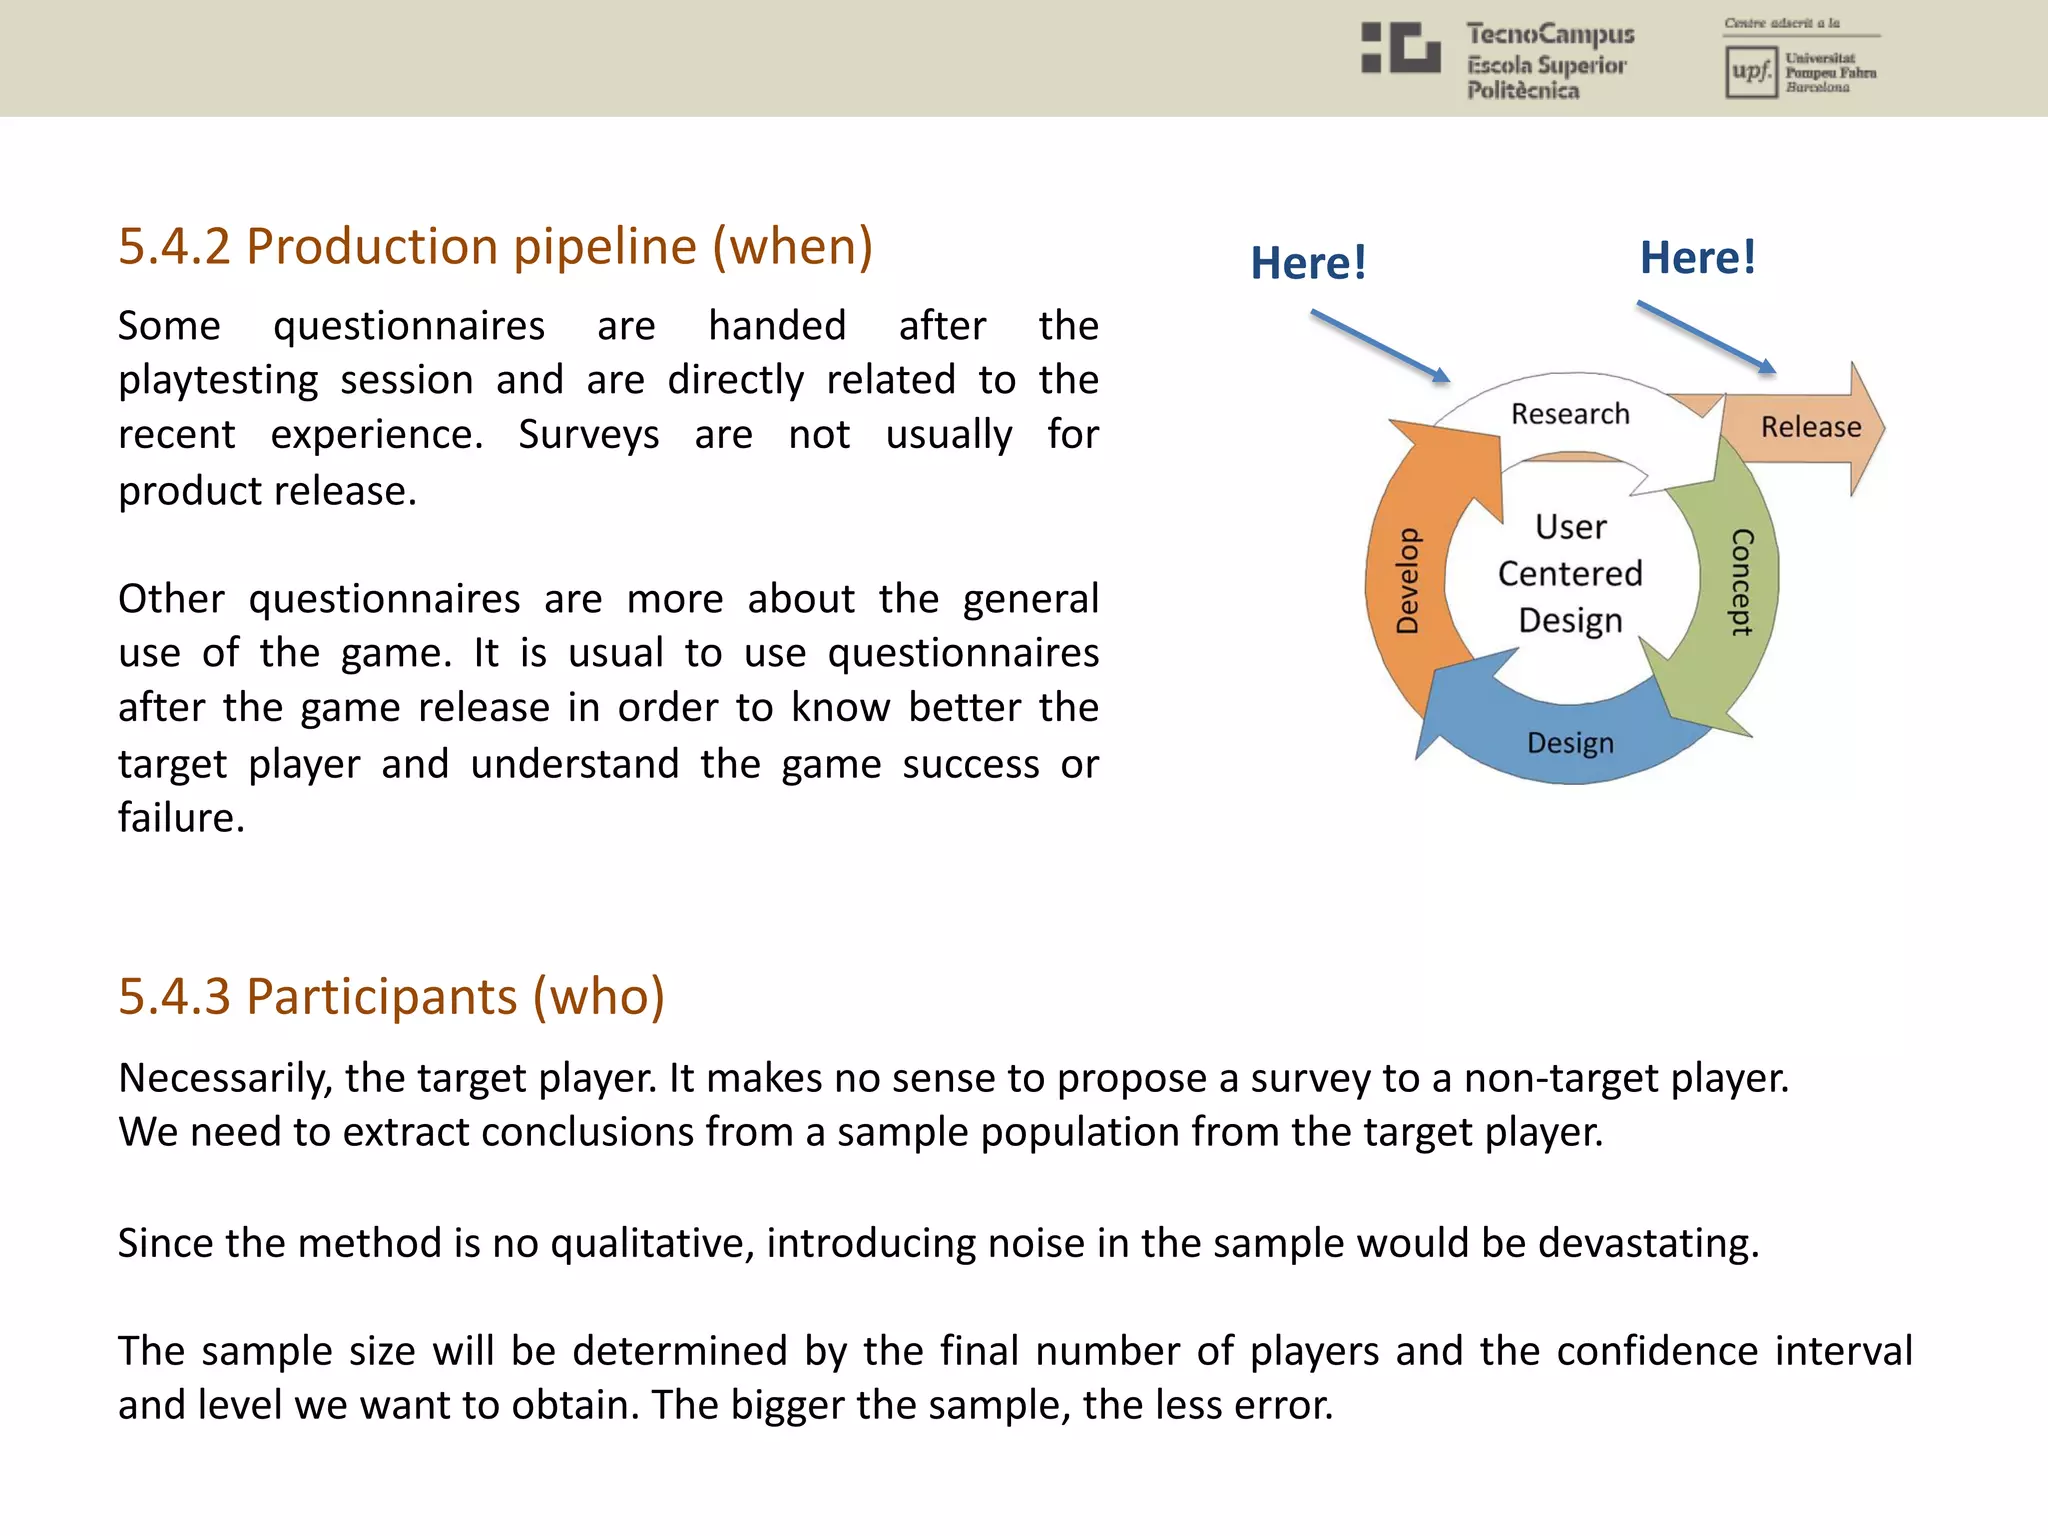
![Rigby and Ryan have demonstrated
there exist a relationship between
among the three measures of
motivation (autonomy, relational and
competence) and the player
outcomes (in enjoyment,
recommending the game….) for
specific genres of games.
For example, the PENS measures
were found to be very accurate at
predicting the likelihood that players
of an adventure or role-playing game
would purchase more games from
the same developer.
[http://www.gamasutra.com/view/feature/130155/rethinking_carrots_a_new_method_.php?print=1]
[http://immersyve.com/white-paper-the-player-experience-of-need-satisfaction-pens-2007/]
Playful Design. John Ferrara. 2012. Chapter 8. Playtesting. Evaluating Motivation: The PENS Moodel. (p. 108)](https://image.slidesharecdn.com/uxu7-190402205419/75/User-Experience-7-Quantitative-Methods-Questionnaires-Biometrics-and-Data-Analysis-25-2048.jpg)
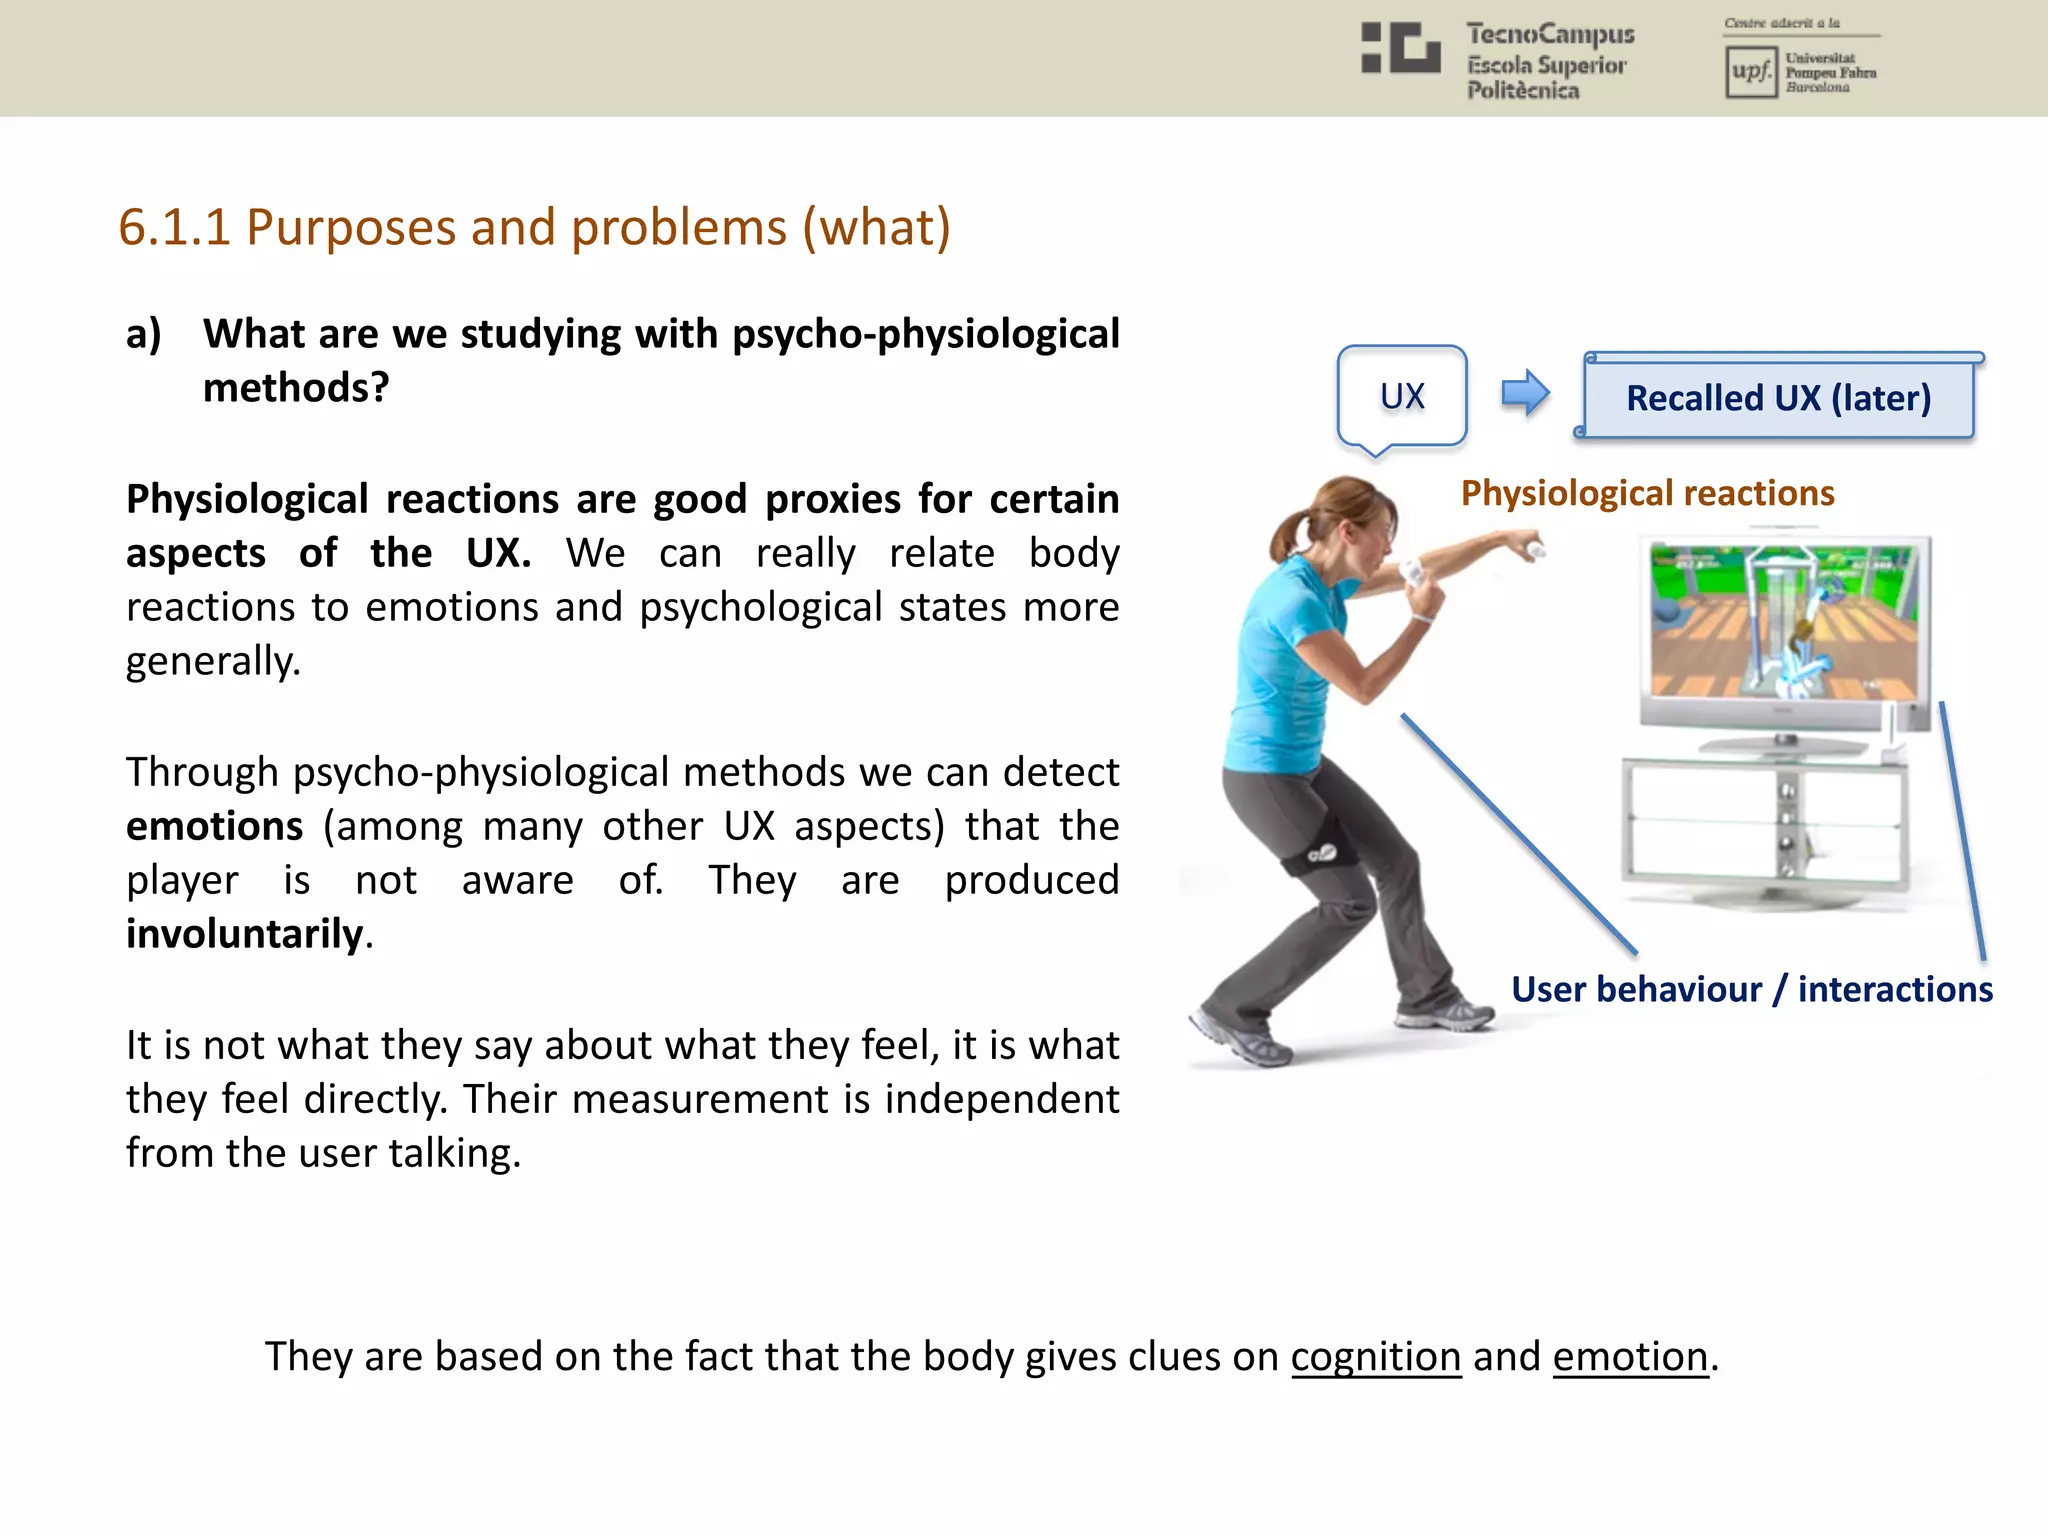
![6.1 Biometrics Methods
Biometrics is the technical term for body measurements and calculations. Biometrics methods
are those aimed at obtaining these measurements.
They may remind of you a ‘lie detector’. When utilizing lie detector machines, the body of a test
subject is hooked to several sensors capable of recording changes in a range of physiological
processes such as her heartbeat, the electrical conductivity of her skin, the frequency of her
respiration, and so forth.
[http://www.gamasutra.com/view/feature/183887/the_case_for_casual_biometrics.php?print=1]](https://image.slidesharecdn.com/uxu7-190402205419/75/User-Experience-7-Quantitative-Methods-Questionnaires-Biometrics-and-Data-Analysis-27-2048.jpg)
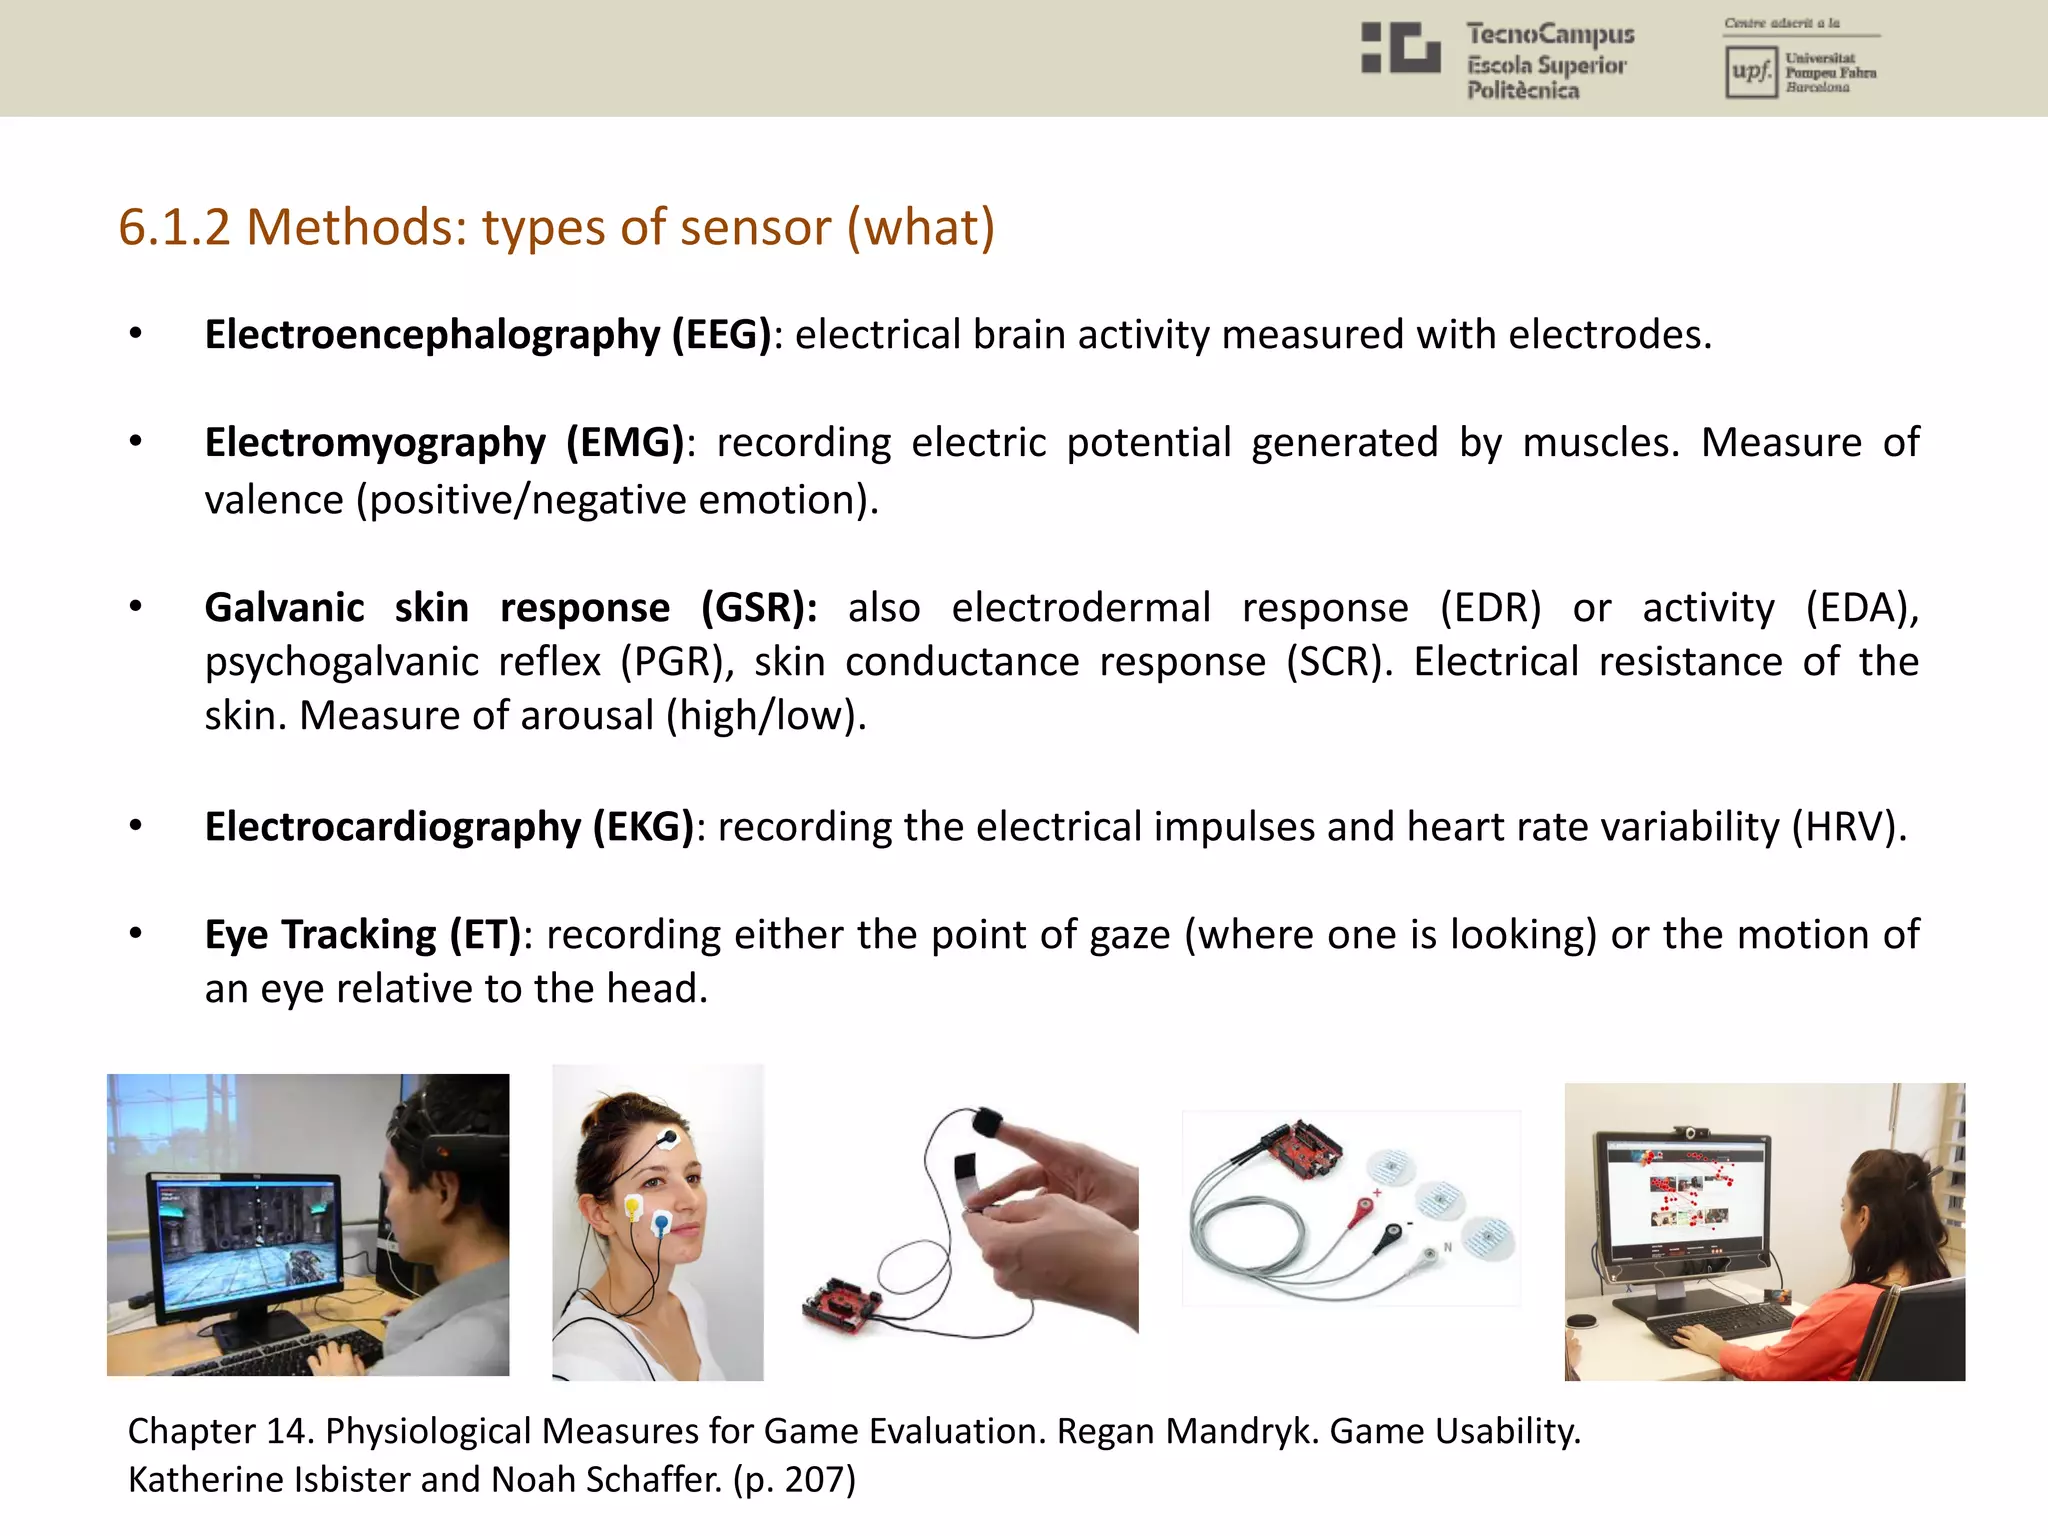
![What are the specific measures for each method?
Electroencephalography (EEG) measures
In terms of these frequencies, the bands of interest are usually the:
• Alpha band (8-14 hz) that reflects calm, mental work.
• Beta band (14-30 hz) that reflects focused, engaged mental work.
• Delta band (1-4 hz) that reflects sleep, relaxation and fatigue.
• Theta band (4-8 hz) that reflects emotions and sensations.
Electromyography (EMG) measures
EMG is all about detecting the activation of muscles through the use of electrodes, which are
attached to the relevant muscle (or muscles). So again, like EEG, (and like most of the measures
I am mentioning) this method relies on detecting electric current. However, unlike EEG, EMG is
a direct indication of activation in the peripheral nervous system.
• Brow (Corrugator supercilii) that register negative emotion (unpleasant valence)
• Cheeks (Zygomaticus major) that register positive emotion (pleasant valence)
• Area around the eyes (Orbicularis oculi) that are said to register expressions of enjoyment
and "genuine pleasure" (whatever that is).
[http://www.gamasutra.com/view/feature/6341/game_testing_and_research_the_.php?print=1]
6.1.3 Data analysis (how)](https://image.slidesharecdn.com/uxu7-190402205419/75/User-Experience-7-Quantitative-Methods-Questionnaires-Biometrics-and-Data-Analysis-37-2048.jpg)
![[https://link.springer.com/article/10.1007/s11257-017-9192-3]
Flow could be research with Eye Tracking and surveys.
• With an eye tracking we would see a sustained attention (“Focal attention is reduced to
one area and is stable along time”).
• With a survey we would see the degree of immersion they recall from their experience.
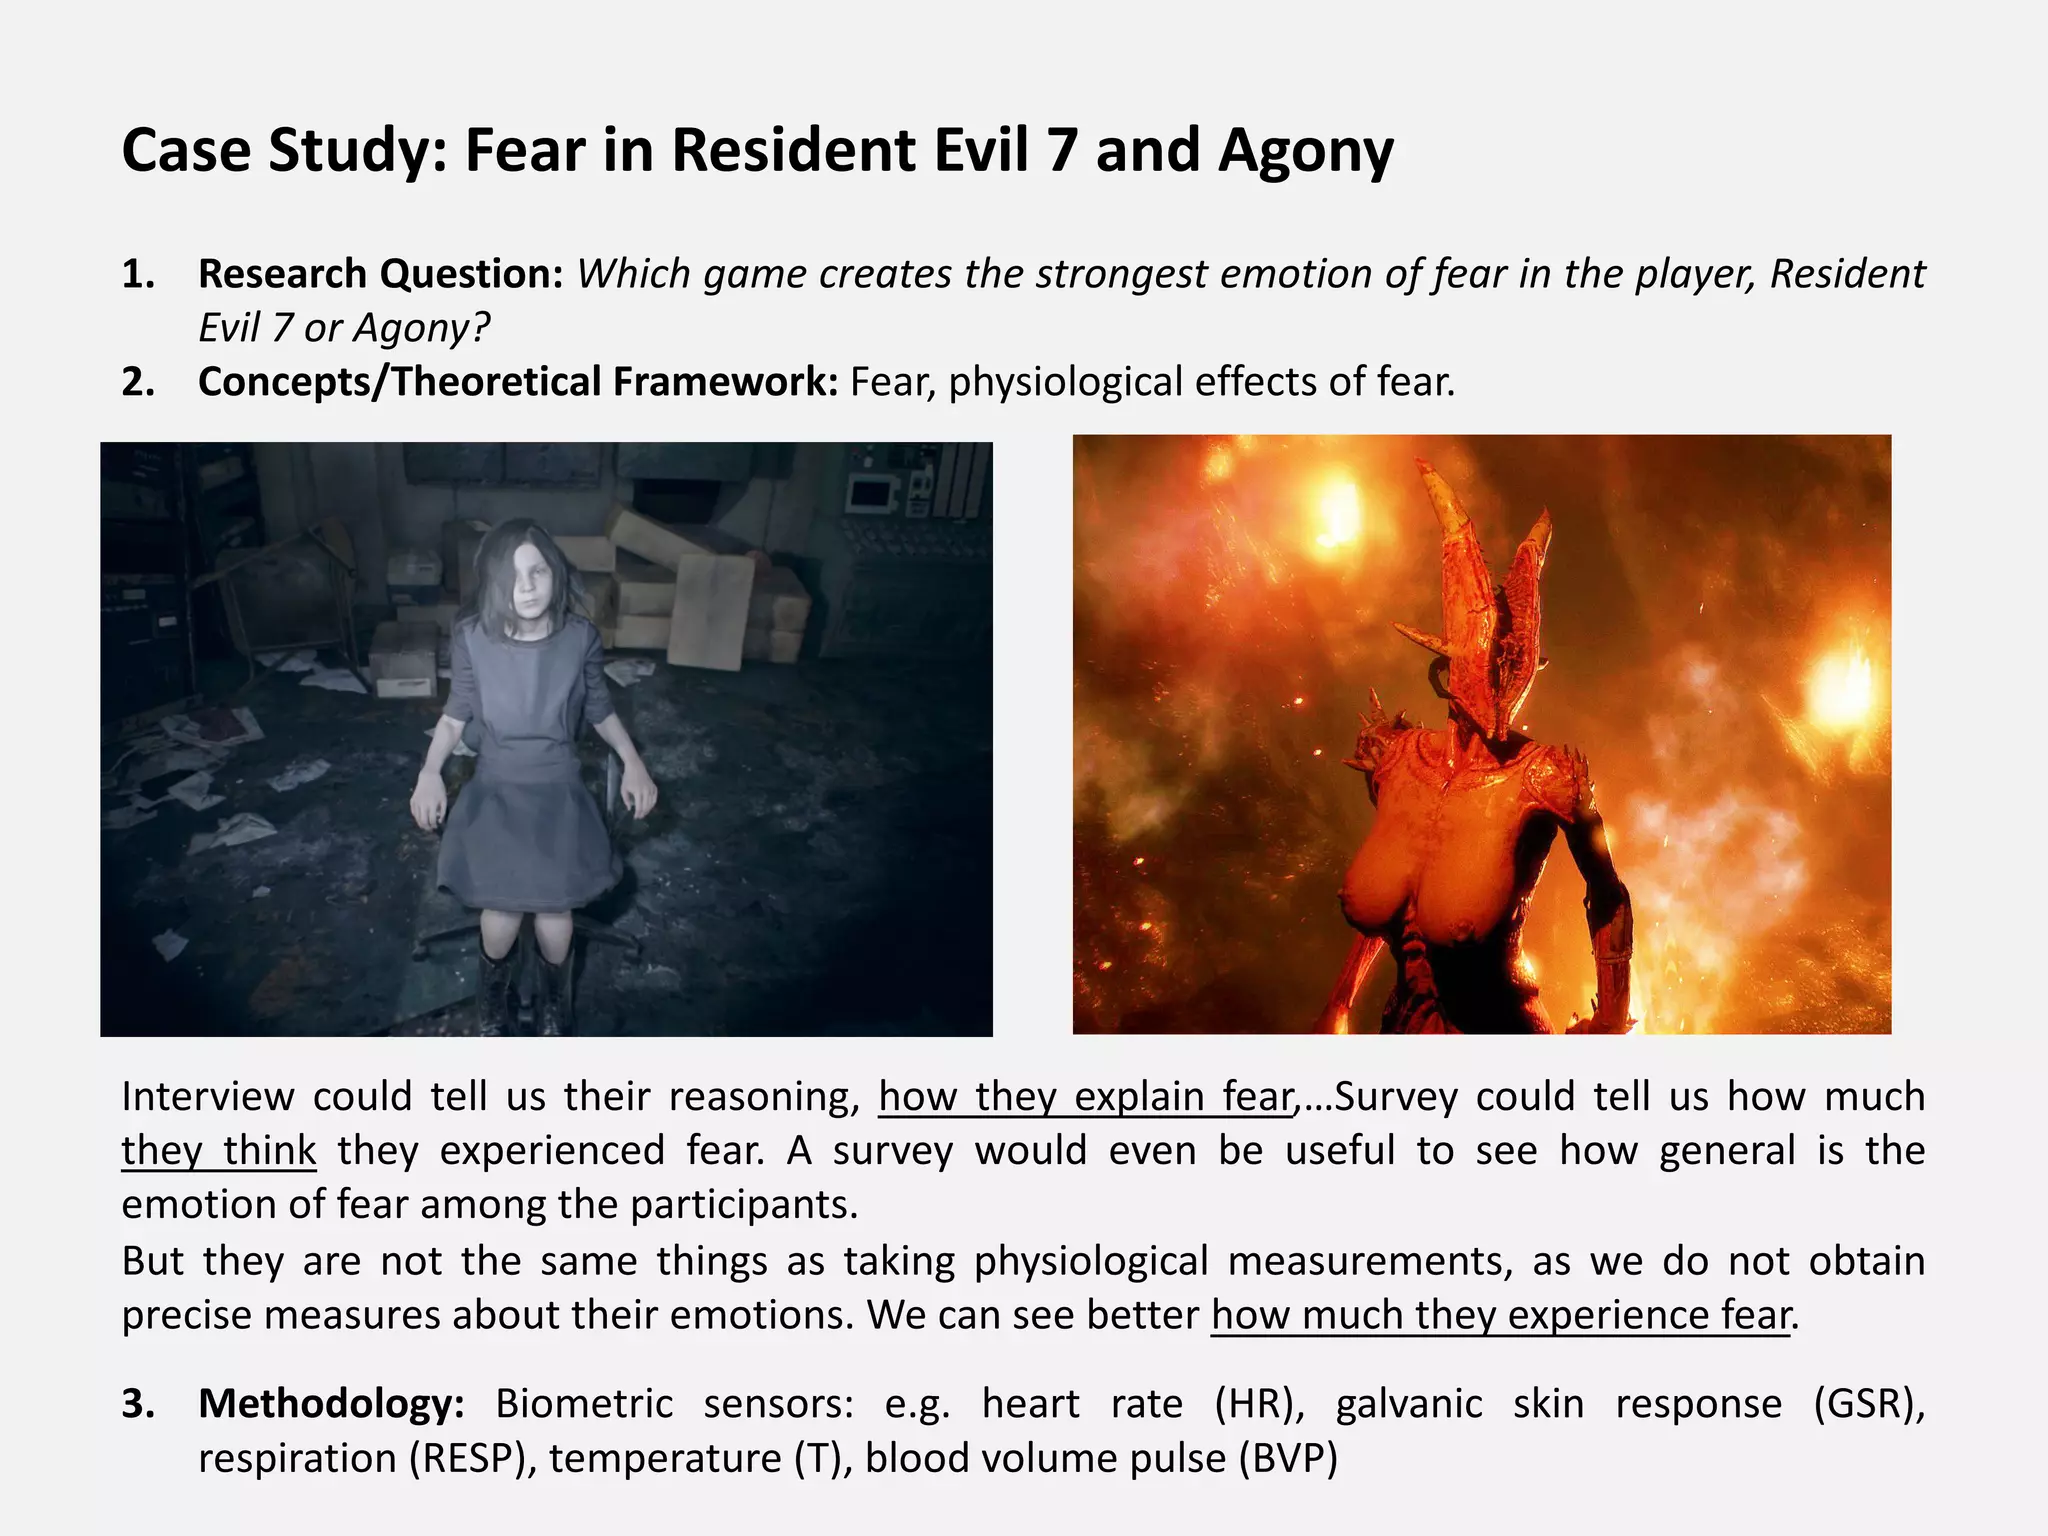
Case Study: Flow in Need for Speed 2015
1. Research Questions: Does the player experiment a Flow state of mind while playing Need for
Speed?
2. Concepts/Theoretical Framework: Flow theory, attention, physiological effects of attention.
3. Methodology: Biometric sensors: e.g. heart rate (HR), galvanic skin response (GSR),
respiration (RESP), temperature (T), blood volume pulse (BVP)
4. Results: Players experienced flow. Both data from the gameplay and the player physiological
responses could be used to understand what creates flow and then automatically generate
effective content variations to stimulate it.](https://image.slidesharecdn.com/uxu7-190402205419/75/User-Experience-7-Quantitative-Methods-Questionnaires-Biometrics-and-Data-Analysis-43-2048.jpg)
![The Effectiveness of Casual Video Games in Improving Mood and Decreasing Stress. Carmen V. Russoniello,
Kevin O’Brien and Jennifer M. Parks. 2009.
[https://www.supercheats.com/articles/262/video-games-as-stress-relief/2]
Case Study: Relax in Casual Video Games
1. Research Question: Does playing casual video games such as Bejeweled 2, Bookworm
Adventures and Peggle improve mood and decrease stress?
2. Concepts/Theoretical Framework: Emotion theories.
3. Methodology: Biometric sensors: Electroencephalography (EEG), Heart Rate Variability
(HRV).
4. Results: The effects were consistent with increased mood and corroborated findings on
psychological reports. These sort of games help in releasing stress.](https://image.slidesharecdn.com/uxu7-190402205419/75/User-Experience-7-Quantitative-Methods-Questionnaires-Biometrics-and-Data-Analysis-45-2048.jpg)
![Why aren’t biometrics more adopted by video game developers?
Because of the “cons” and,…
1. It does not substitute playtesting, and the subjective methods (surveys, interviews) can
provide data which is useful “enough” to iterate in game design.
2. Only certain games like First-person shooters, racing cars, action-RPG, have clear
patterns in terms of subjective behavior (emotional arousal, cognitive workload). Many
other games are more fuzzy and do not put the player in these high states.
Valve’s game researcher opinion (Dr. Mike Ambinder, experimental psychologist)
"Some publishers are going down this route, but I'm not sure biometrics is the way to go. We've
had a lot of time to experience what works and what doesn't, and biometrics doesn't tend to
add a lot to the techniques we're already using. ”
“You could learn most of this stuff by just asking people. I mean, what we want to know is
whether people are having fun or not. And just asking them, or watching them play the game,
can determine that. We don't need super-precise accuracy on the emotional state. ”
Sometimes, more complex scientific methods do not add enough to justify their use.
[http://www.gamespot.com/articles/the-science-of-playtesting/1100-6323661]](https://image.slidesharecdn.com/uxu7-190402205419/75/User-Experience-7-Quantitative-Methods-Questionnaires-Biometrics-and-Data-Analysis-46-2048.jpg)
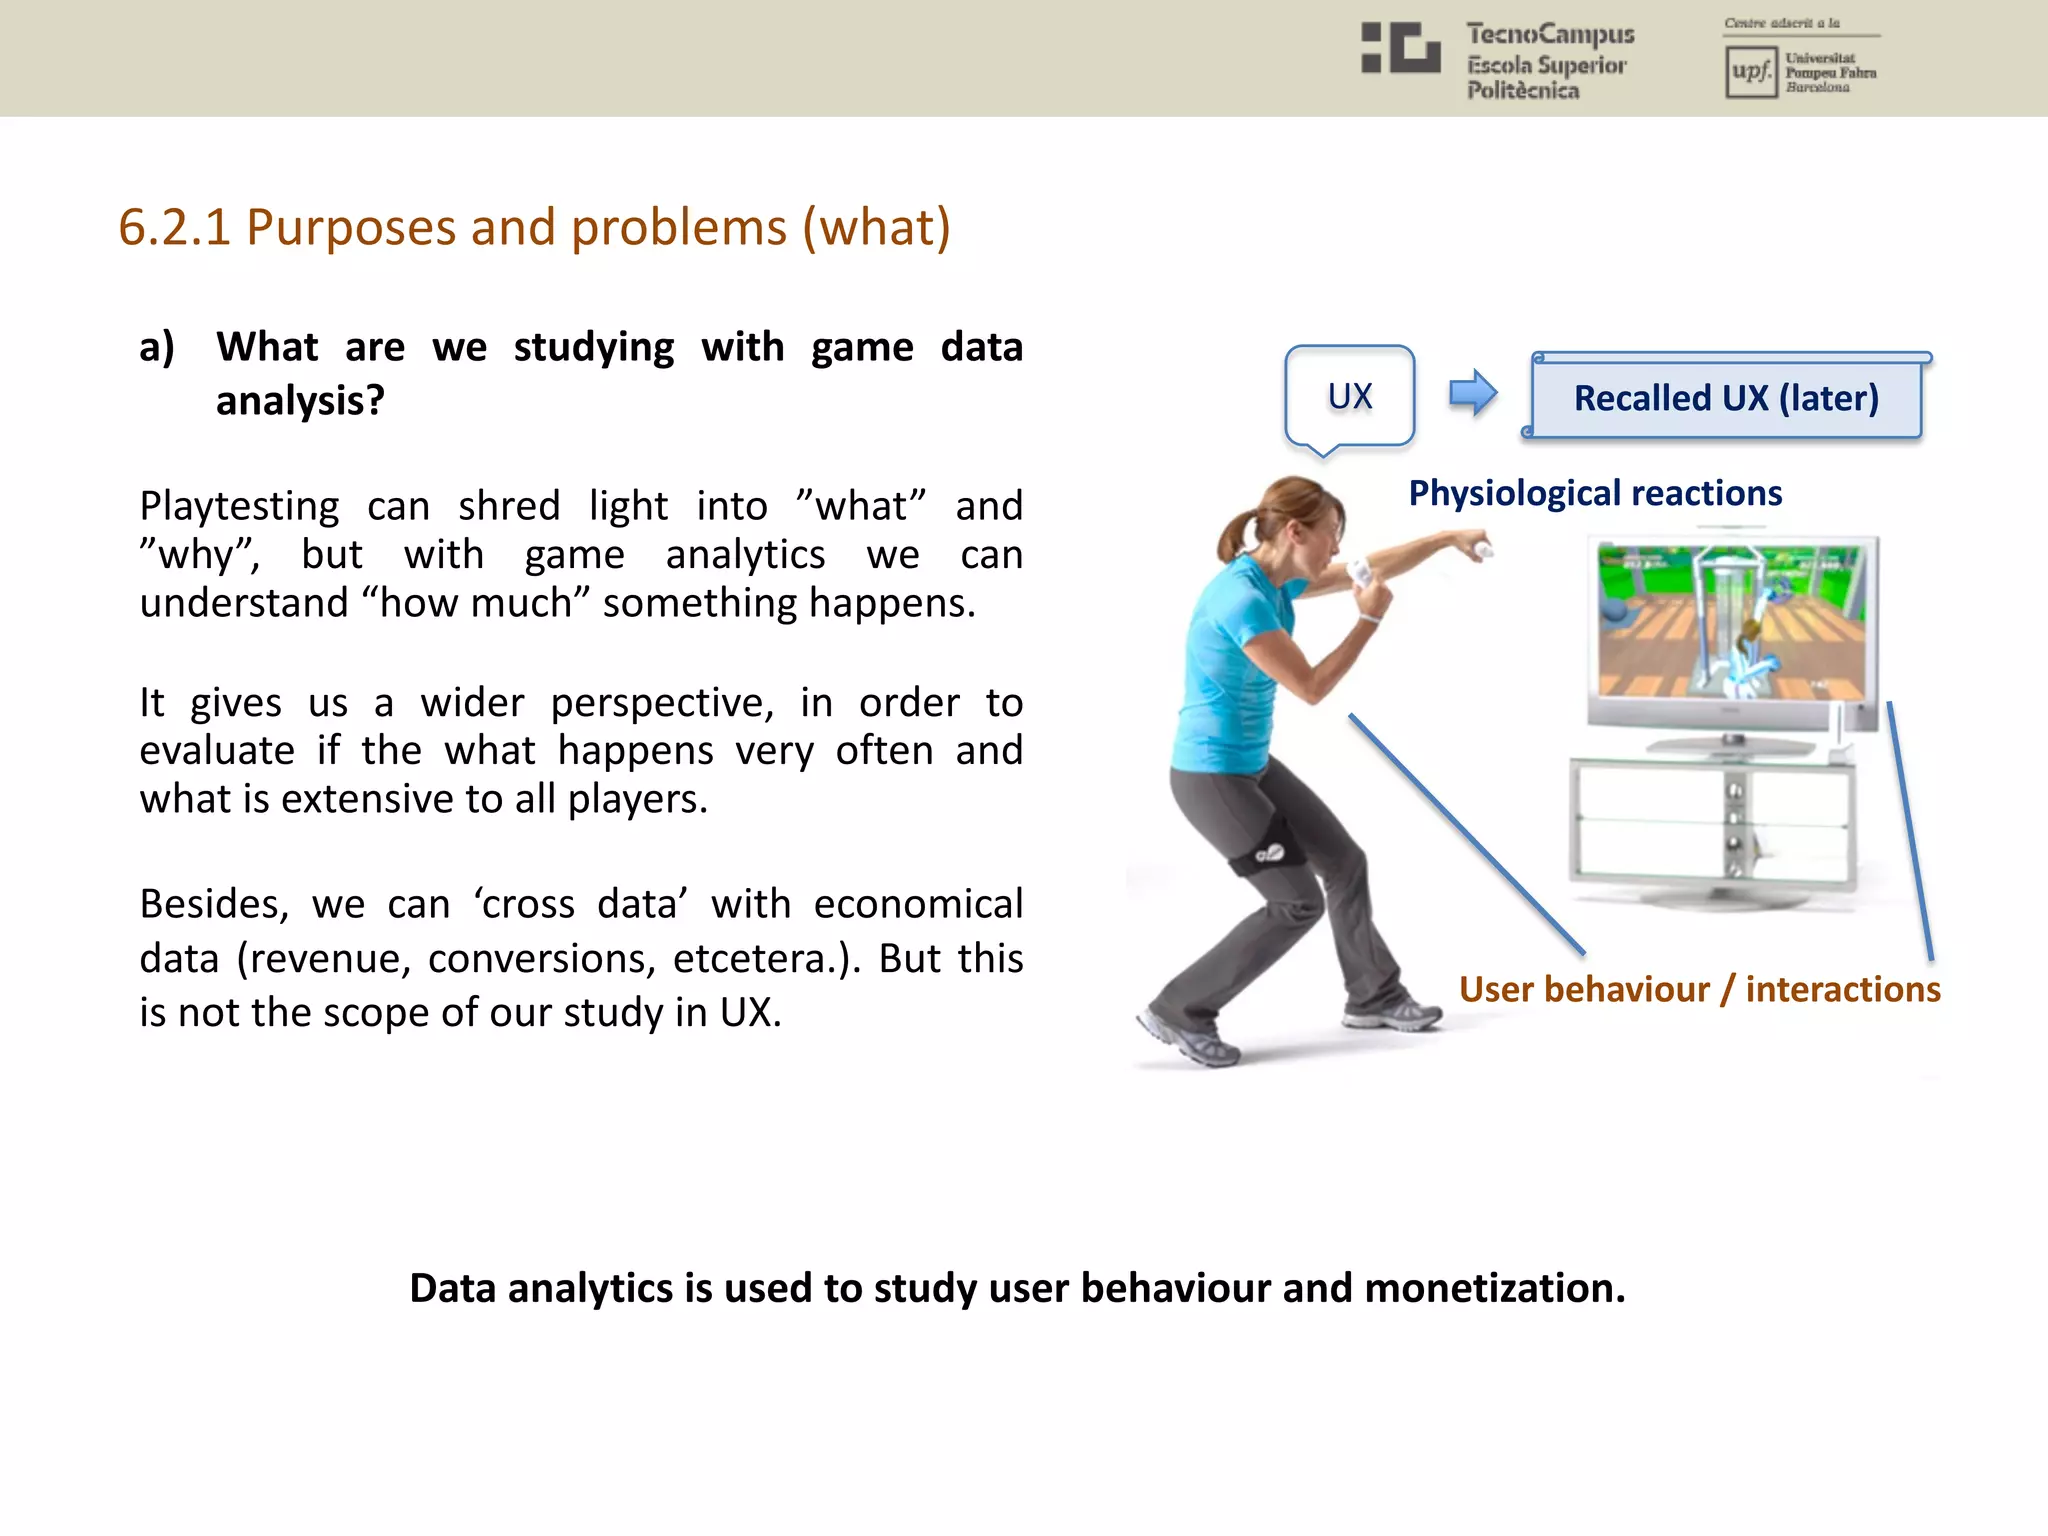
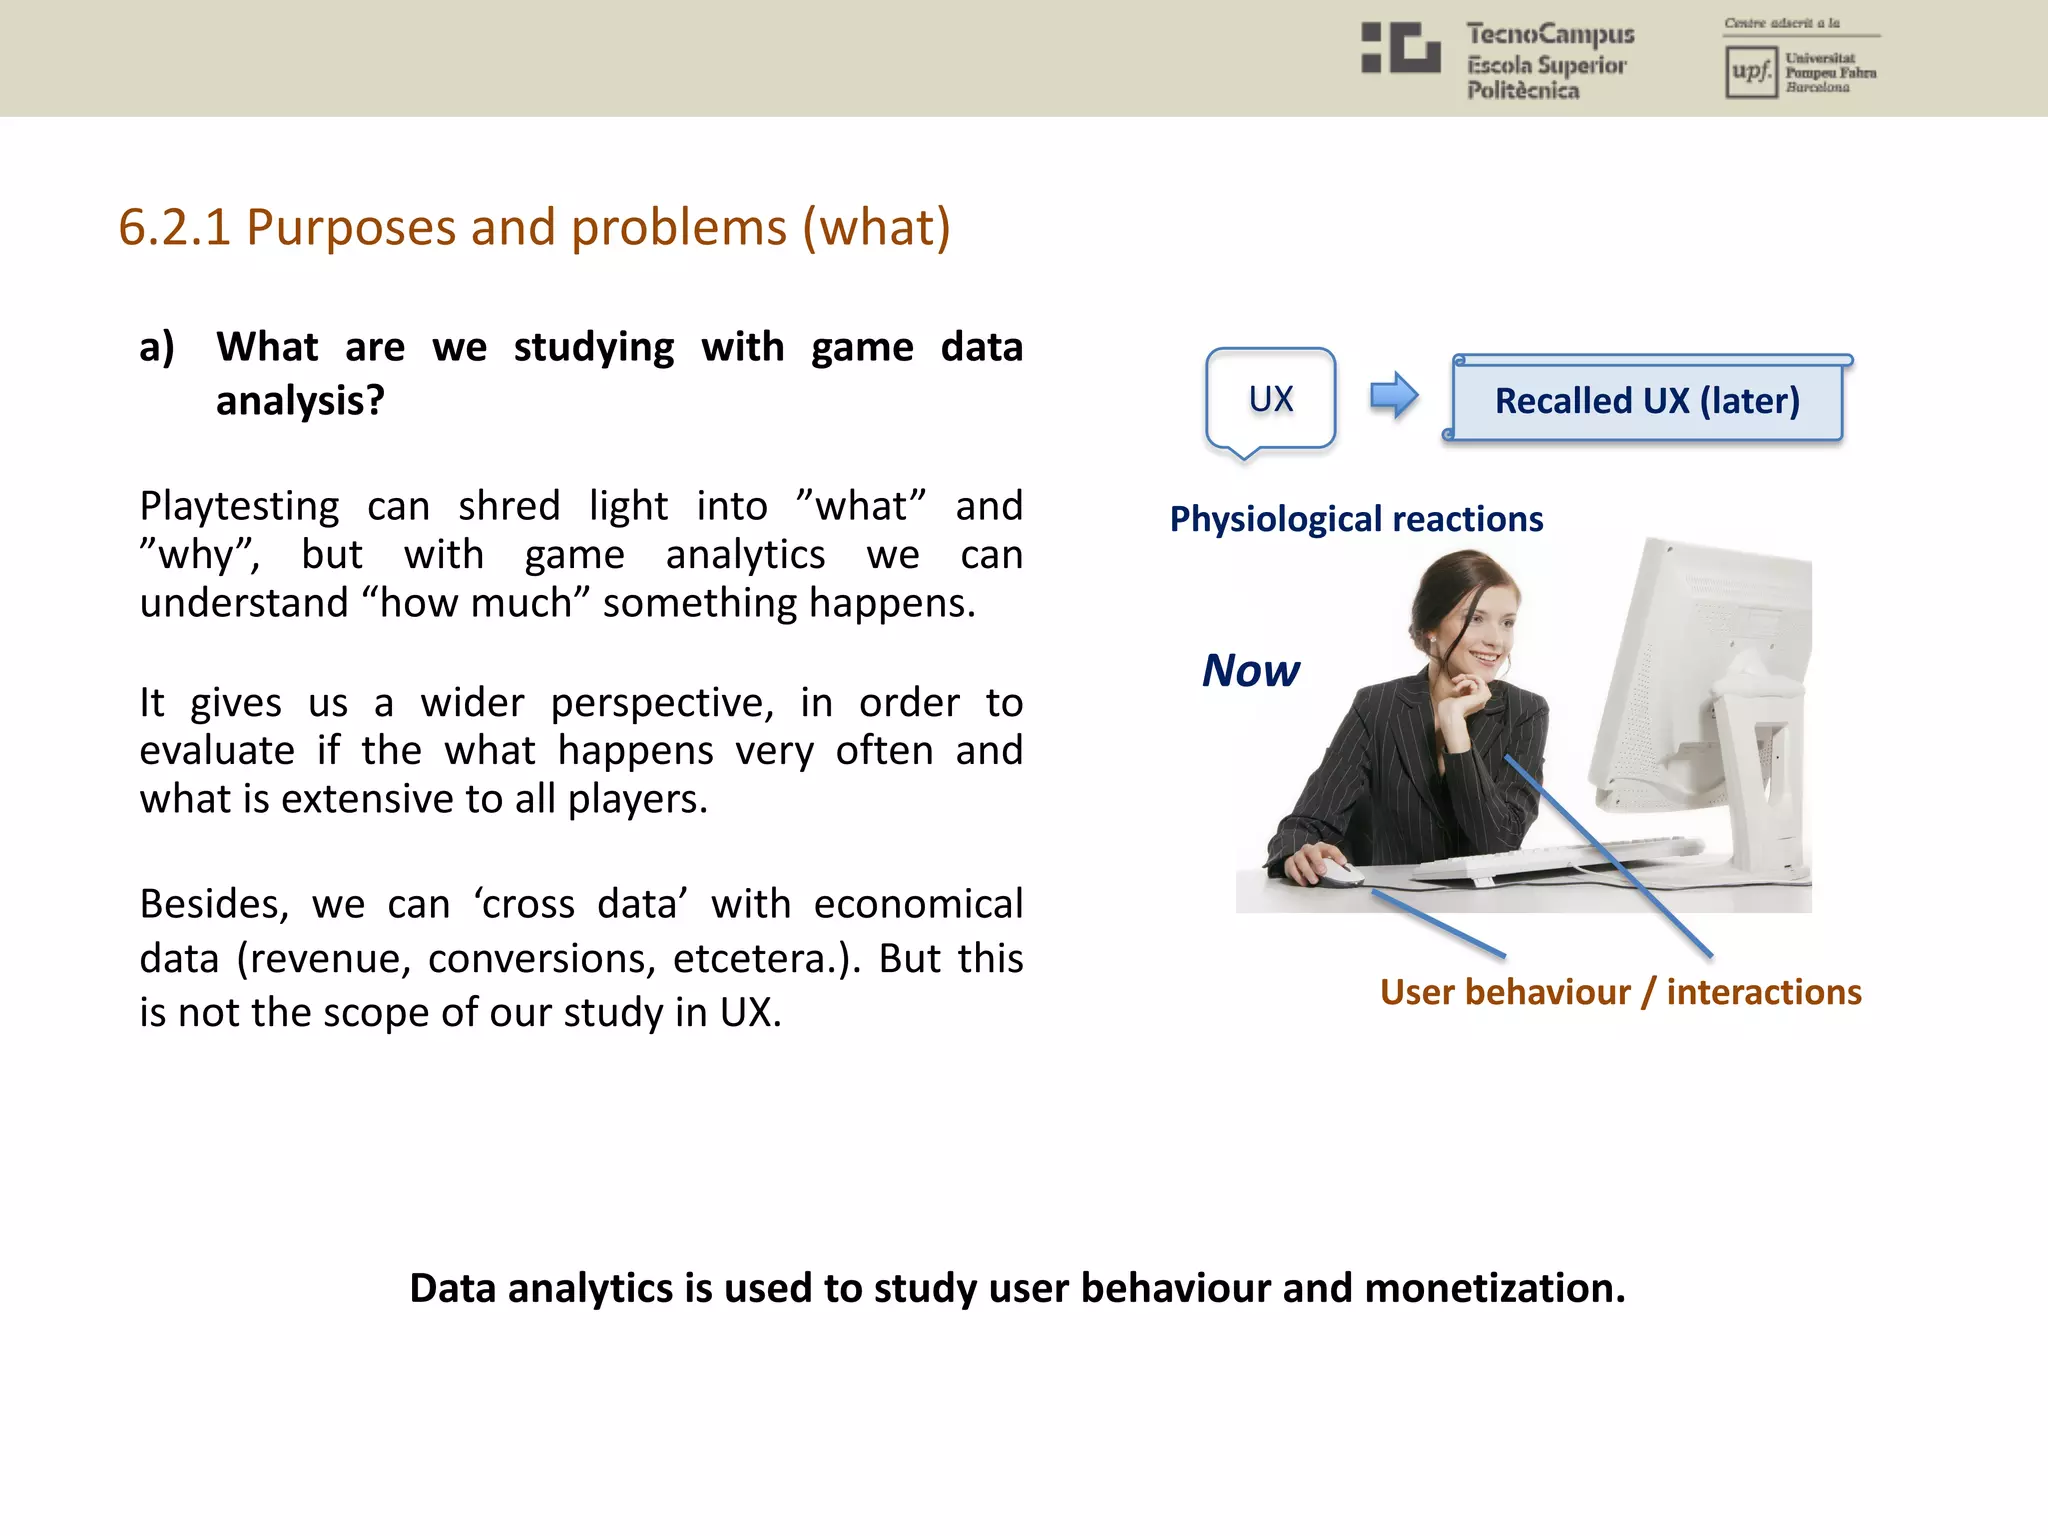
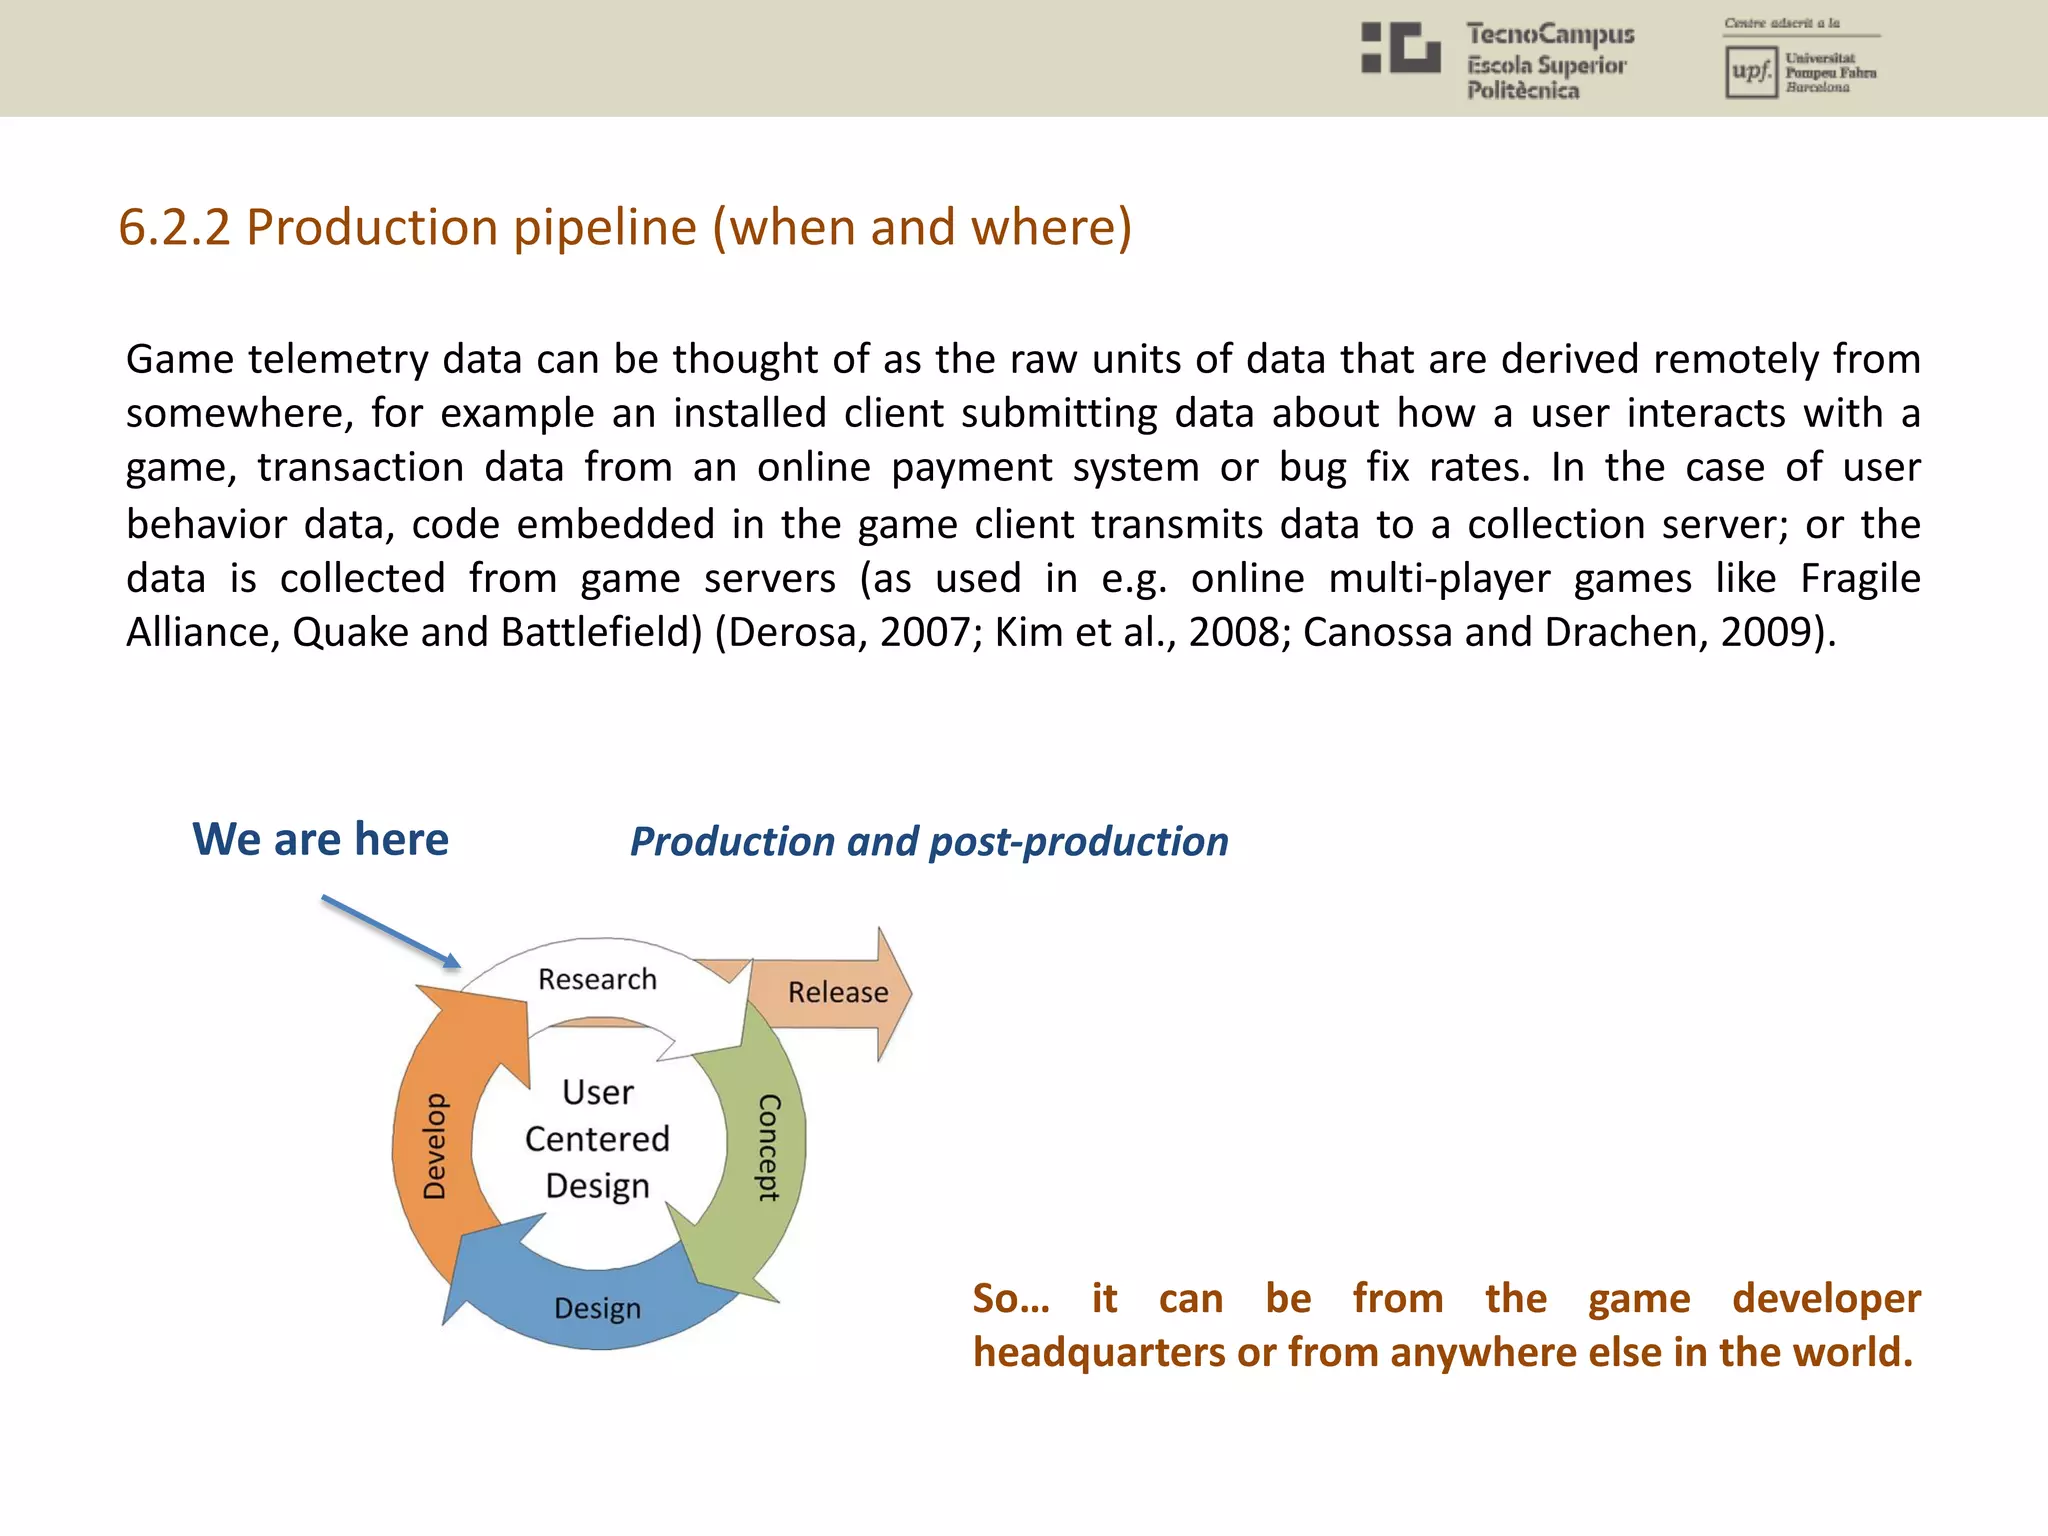
![6.2 (User Behaviour) Data Analysis
Telemetry n. The science and technology of automatic measurement and transmission of data
by wire, radio, or other means from remote sources, as from space vehicles, to receiving
stations for recording and analysis.
Game development telemetry – … automatic measurement and transmission of data from
game executable, build pipeline and development tools for recording, analysis and continual
improvement. What kind of data are we obtaining? Events, player small interactions,
achievements, etcetera. this is the behavioral data that we want to import from gameplay.
What is behavior? It is the user interactions along time. We can define interactions, we can
define time. By analyzing data related to the user behavior we can understand certain things
about motivation, but not completely.
Game analytics can thus be understood as the application of analytics to game development
and research (El-Nasr, Drachen and Canossa, 2013, p.5).
[http://www.gameanalytics.com/blog/what-is-game-telemetry.html]](https://image.slidesharecdn.com/uxu7-190402205419/75/User-Experience-7-Quantitative-Methods-Questionnaires-Biometrics-and-Data-Analysis-47-2048.jpg)
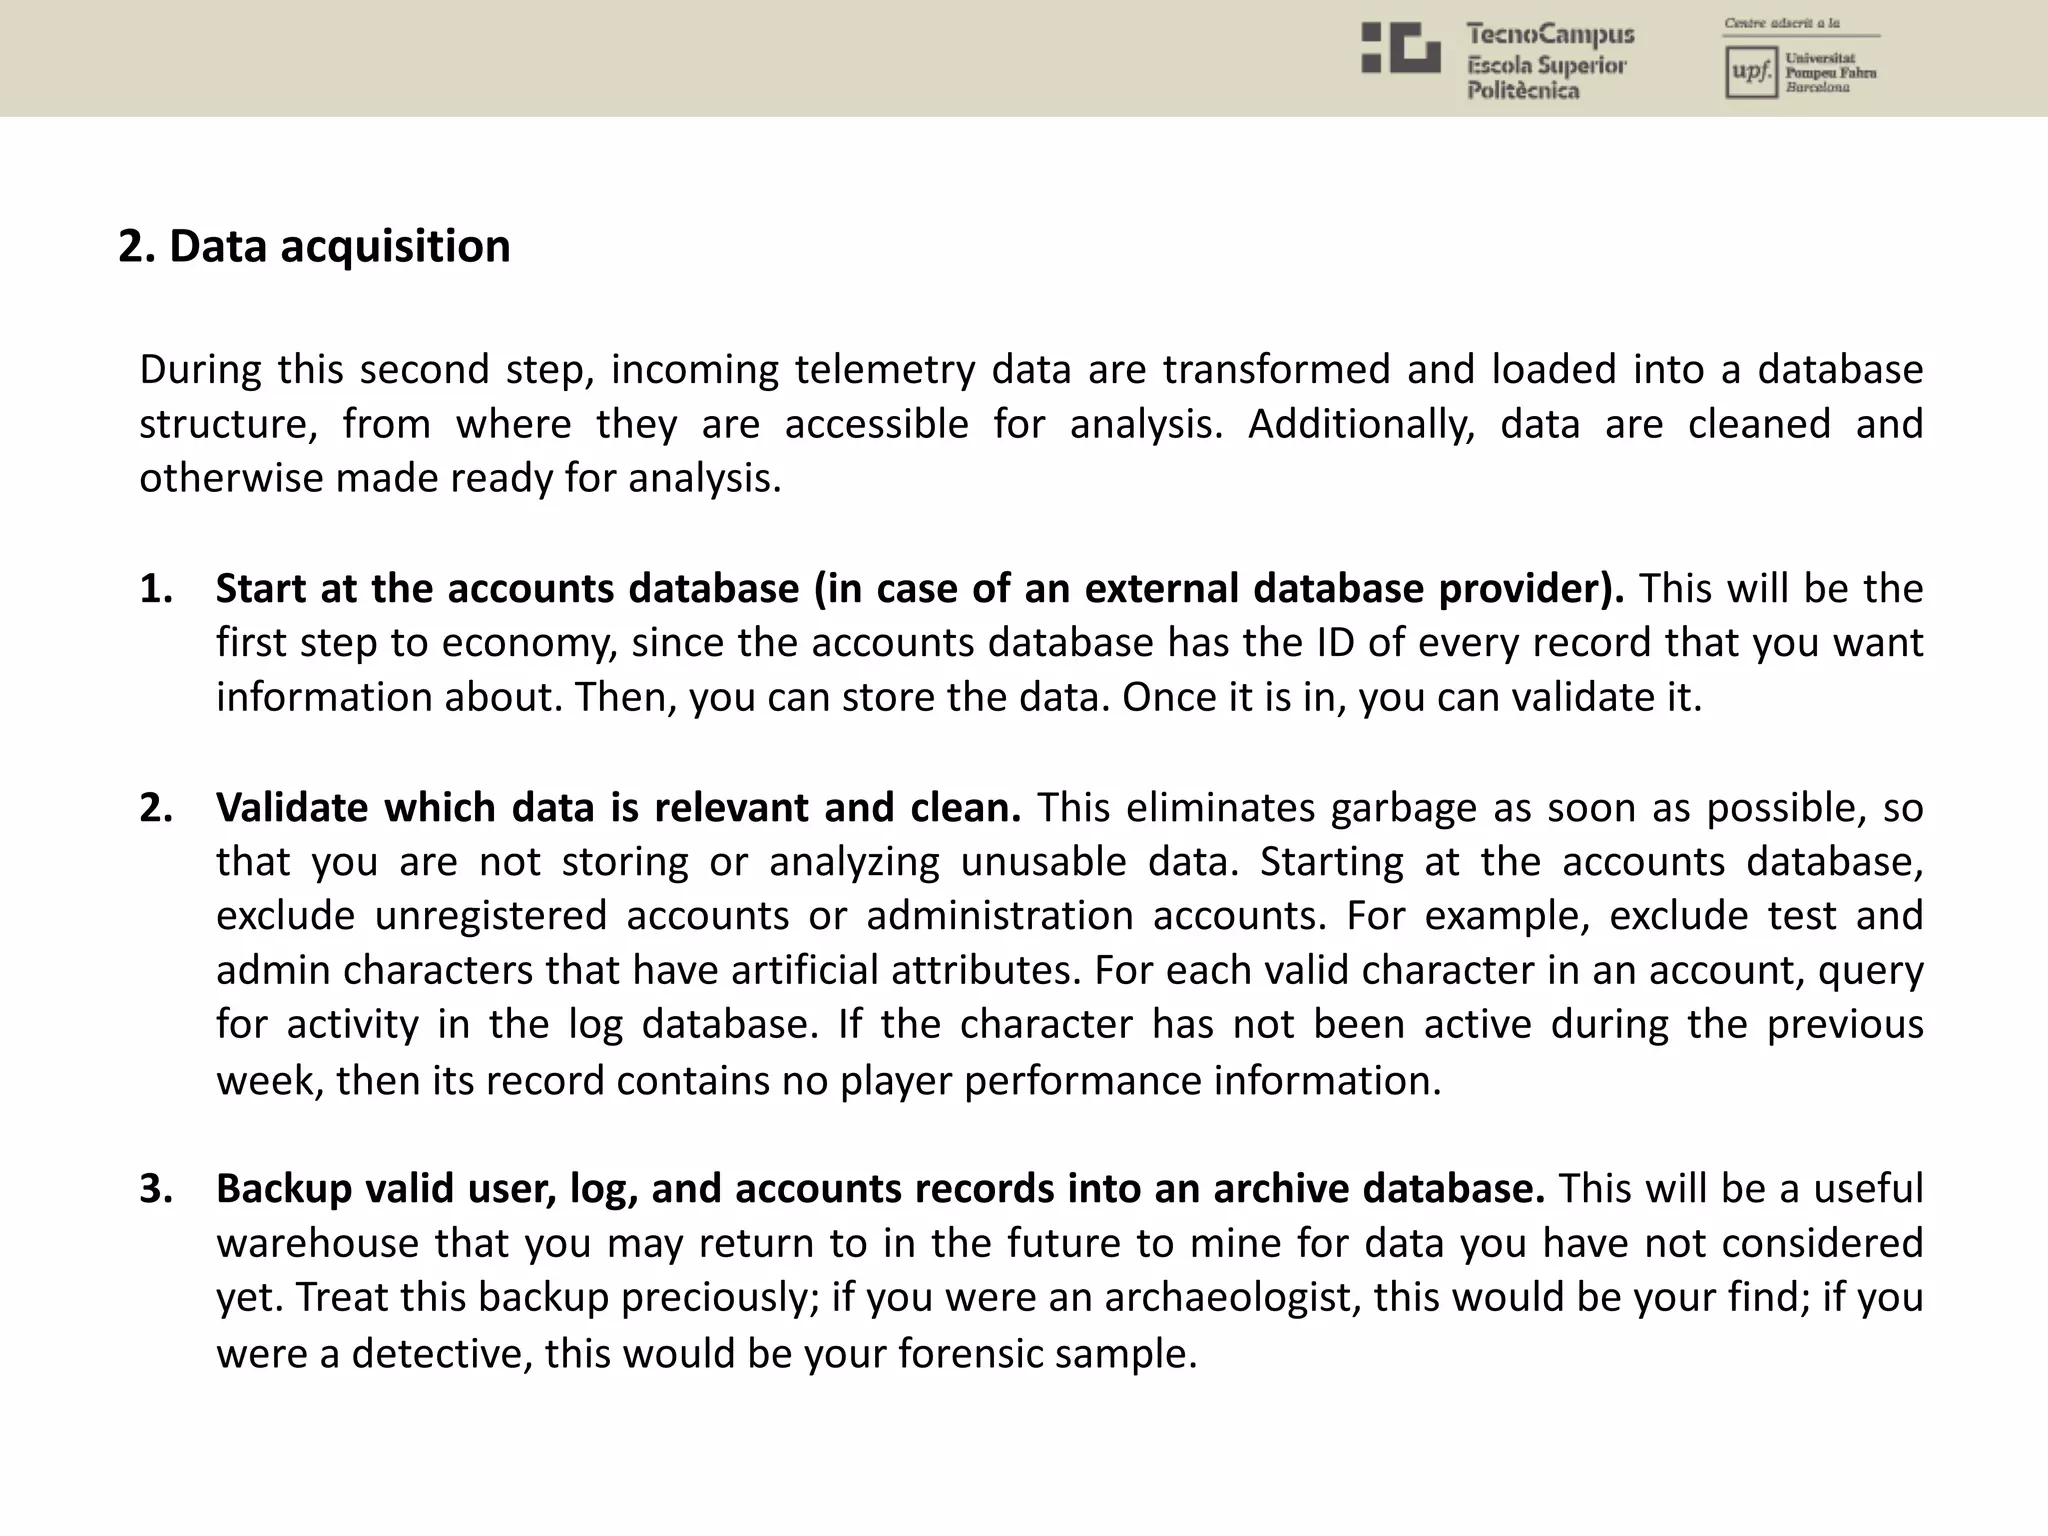
![The data acquisition comprises the different computing systems and processes dedicated
to obtain and storage the data.
• The code installed in the back-end of the game to store the .
• The communications at network level (TCP-UDP)
• The database where the data is stored (MySQL, etc.)
This is the usual network architecture to do data analysis
[https://www.raywenderlich.com/7559/game-analytics-101]
System Architecture](https://image.slidesharecdn.com/uxu7-190402205419/75/User-Experience-7-Quantitative-Methods-Questionnaires-Biometrics-and-Data-Analysis-59-2048.jpg)
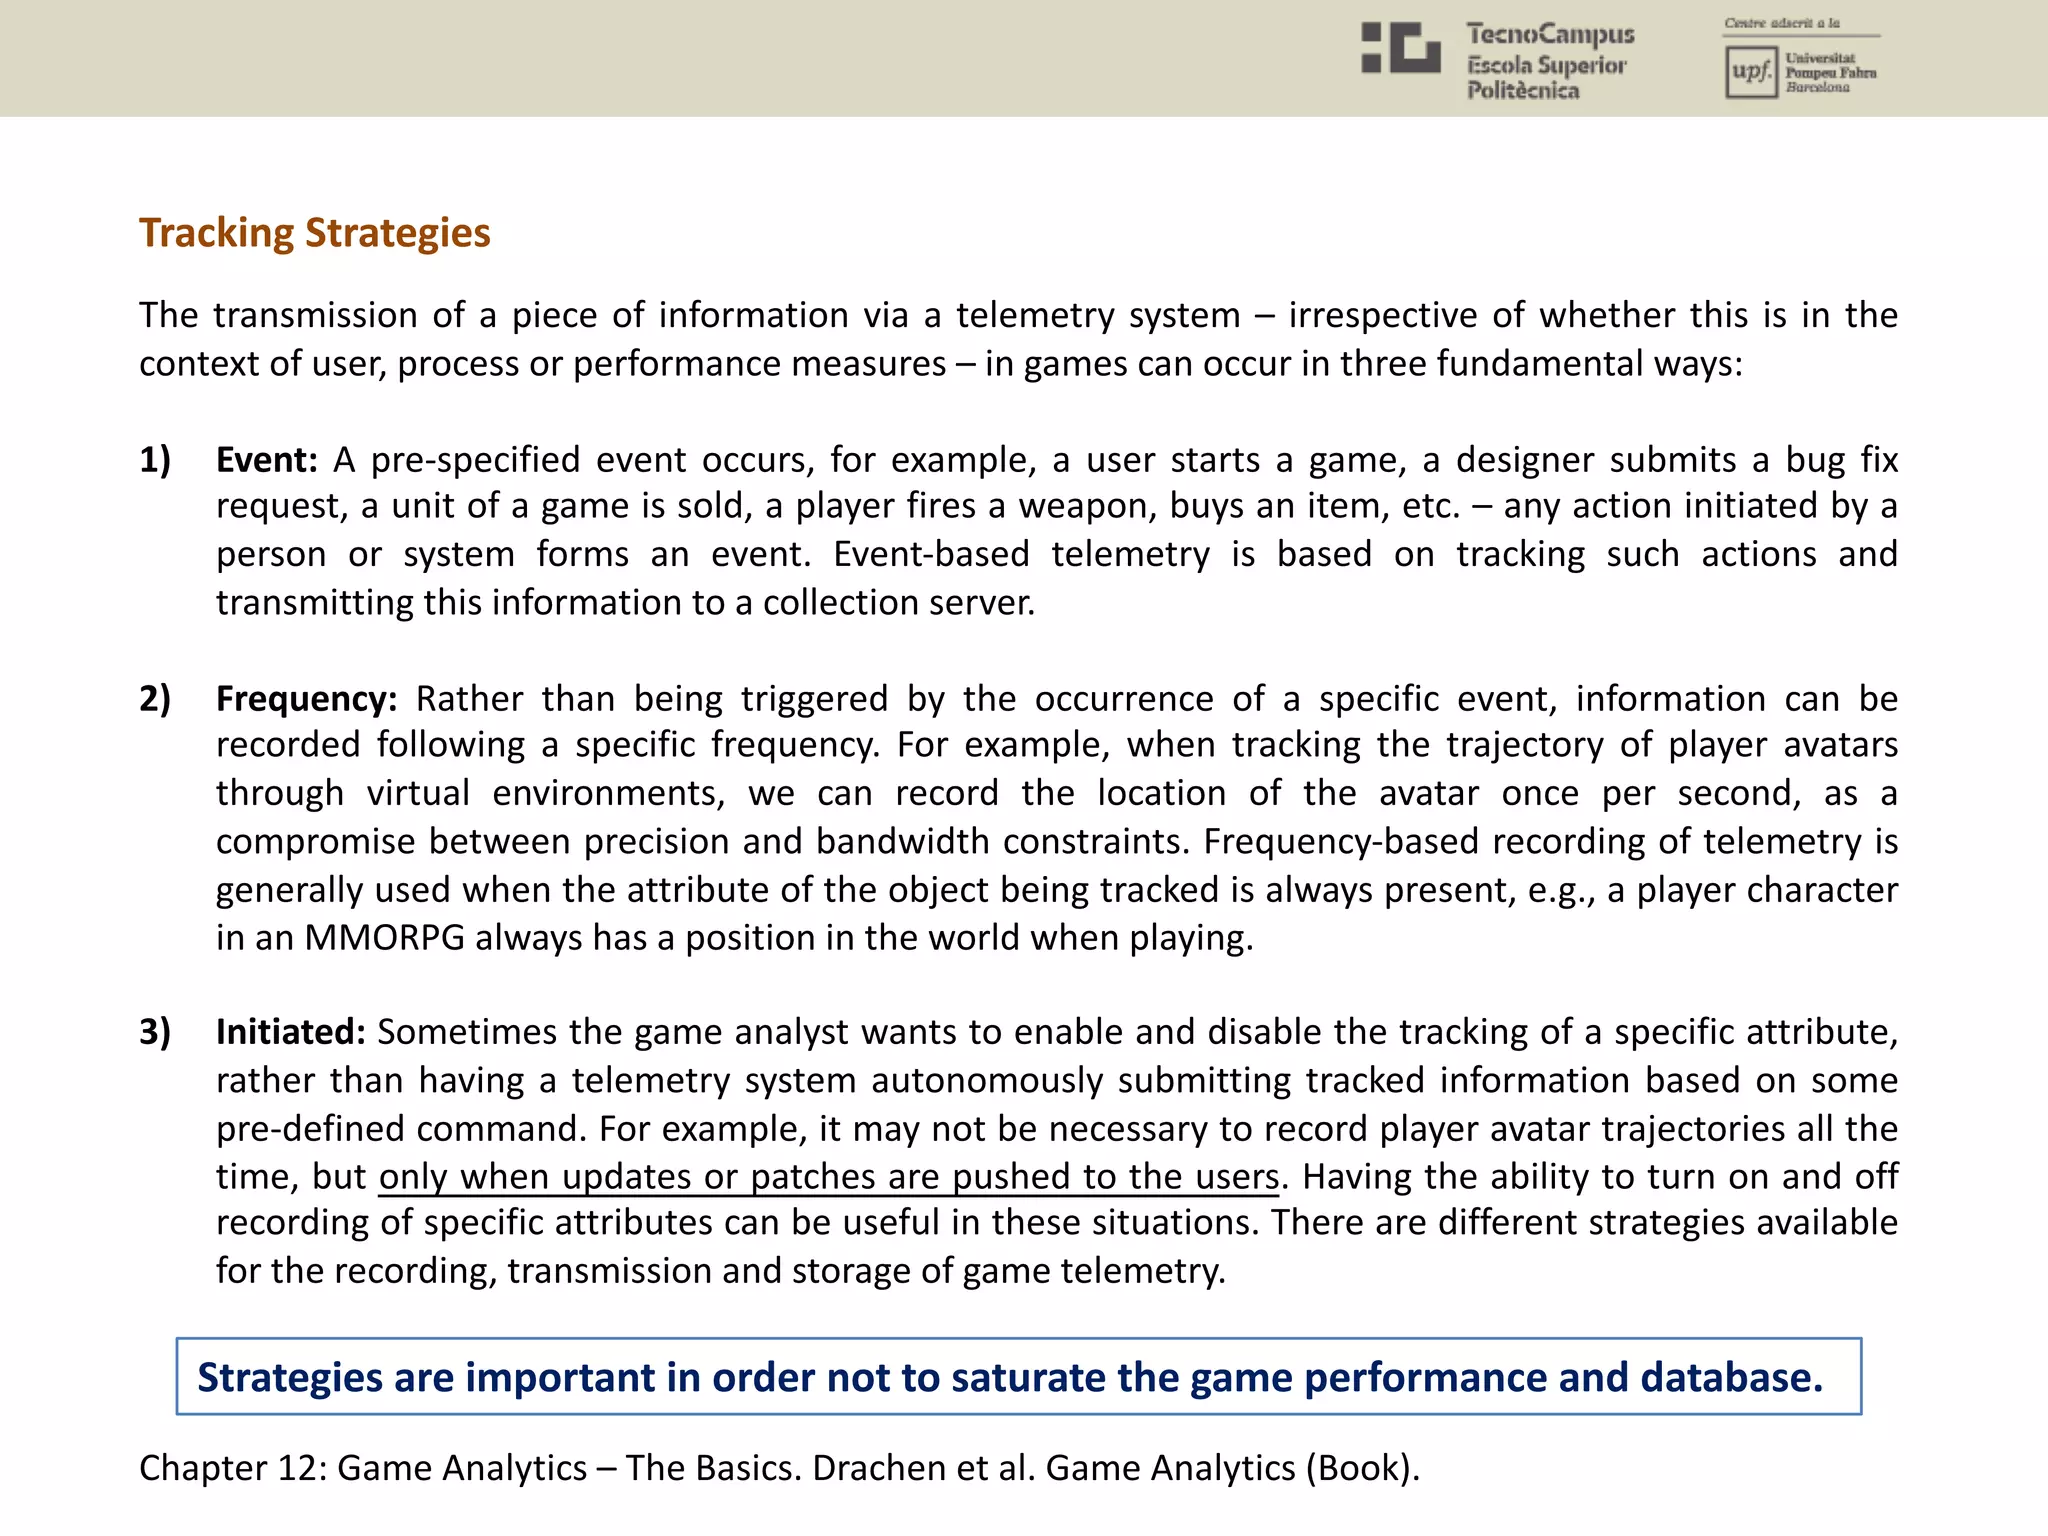
![[http://www.gamasutra.com/view/feature/2816/better_game_design_through_data_.php?print=1]
Player behavior is a function of the day of the week.
Depending on the target, it will make more sense to track a specific period of time.](https://image.slidesharecdn.com/uxu7-190402205419/75/User-Experience-7-Quantitative-Methods-Questionnaires-Biometrics-and-Data-Analysis-61-2048.jpg)
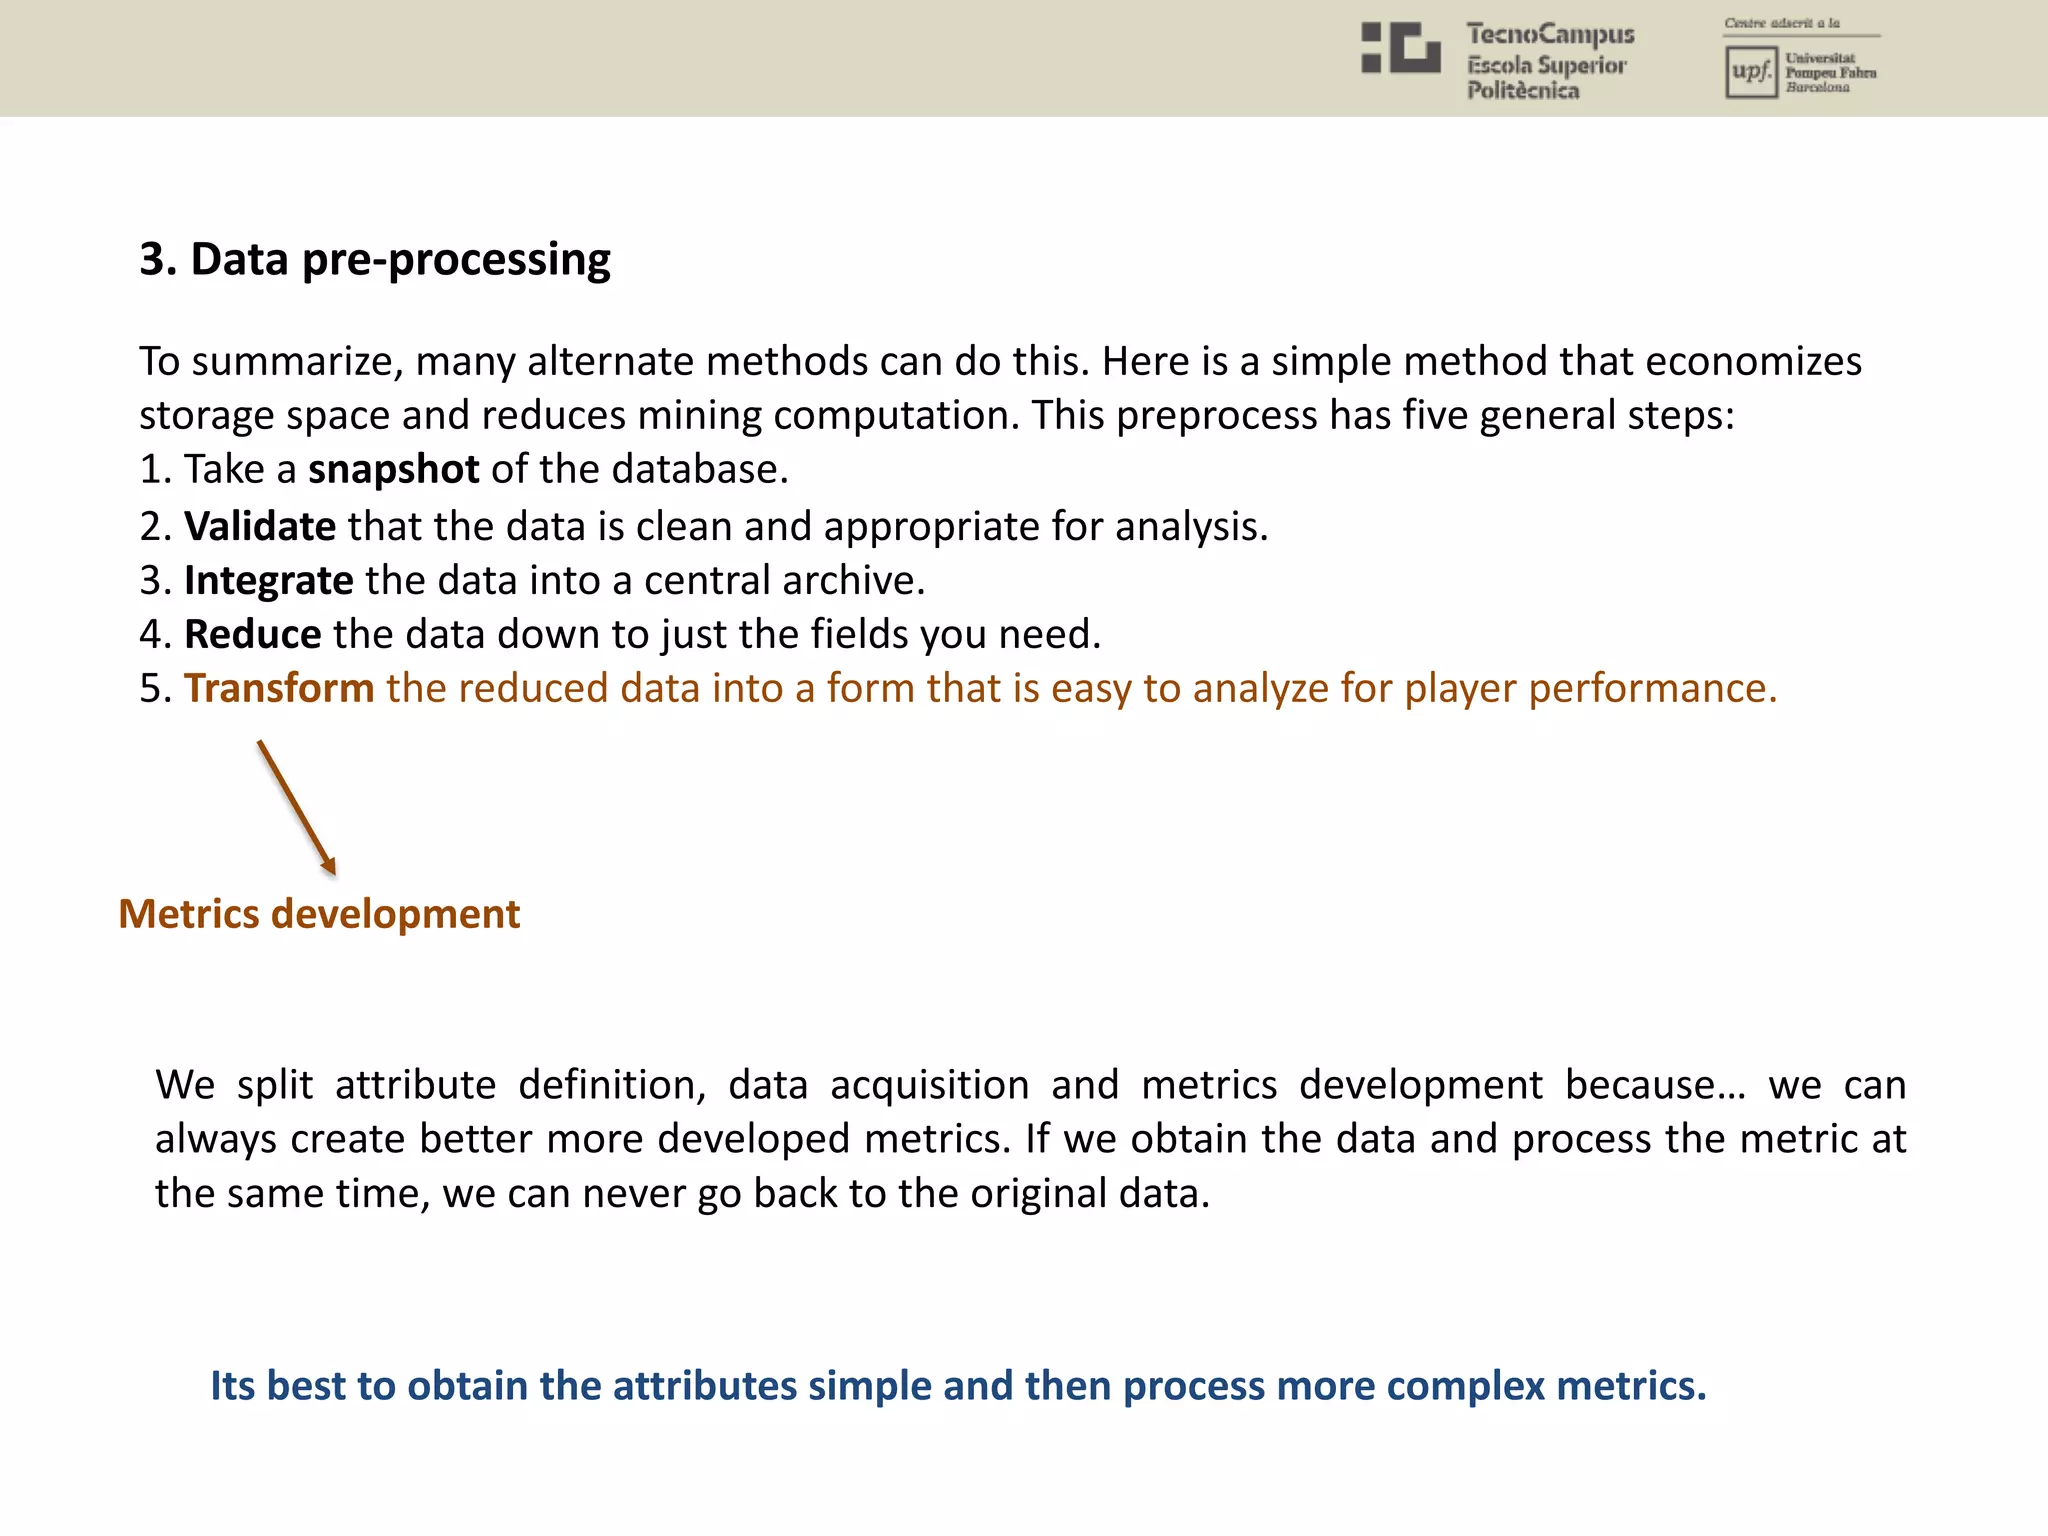
![Valve has a platform for recording gameplay metrics: Kills, Deaths, Hero Selection, In-
Game Purchases, Matchmaking wait times, Bullet trajectories, Friends in Party, Low-
Priority Penalties, etcetera.
Data sent at relevant intervals: Daily, Monthly, Lifetime Rollups, Views, Aggregations.
This is an important point: it is not useful to send data at all times. At the same time, it is
necessary to collect data for different periods of time (days, weeks, months). Take into
account the circadian patterns, holidays, etc.
Valve and its Data Collection OGS (Operational Game Stats)
[https://www.youtube.com/watch?v=HQwL6zh7AgA&list=PLckFgM6dUP2hc4iy-IdKFtqR9TeZWMPjm]](https://image.slidesharecdn.com/uxu7-190402205419/75/User-Experience-7-Quantitative-Methods-Questionnaires-Biometrics-and-Data-Analysis-62-2048.jpg)
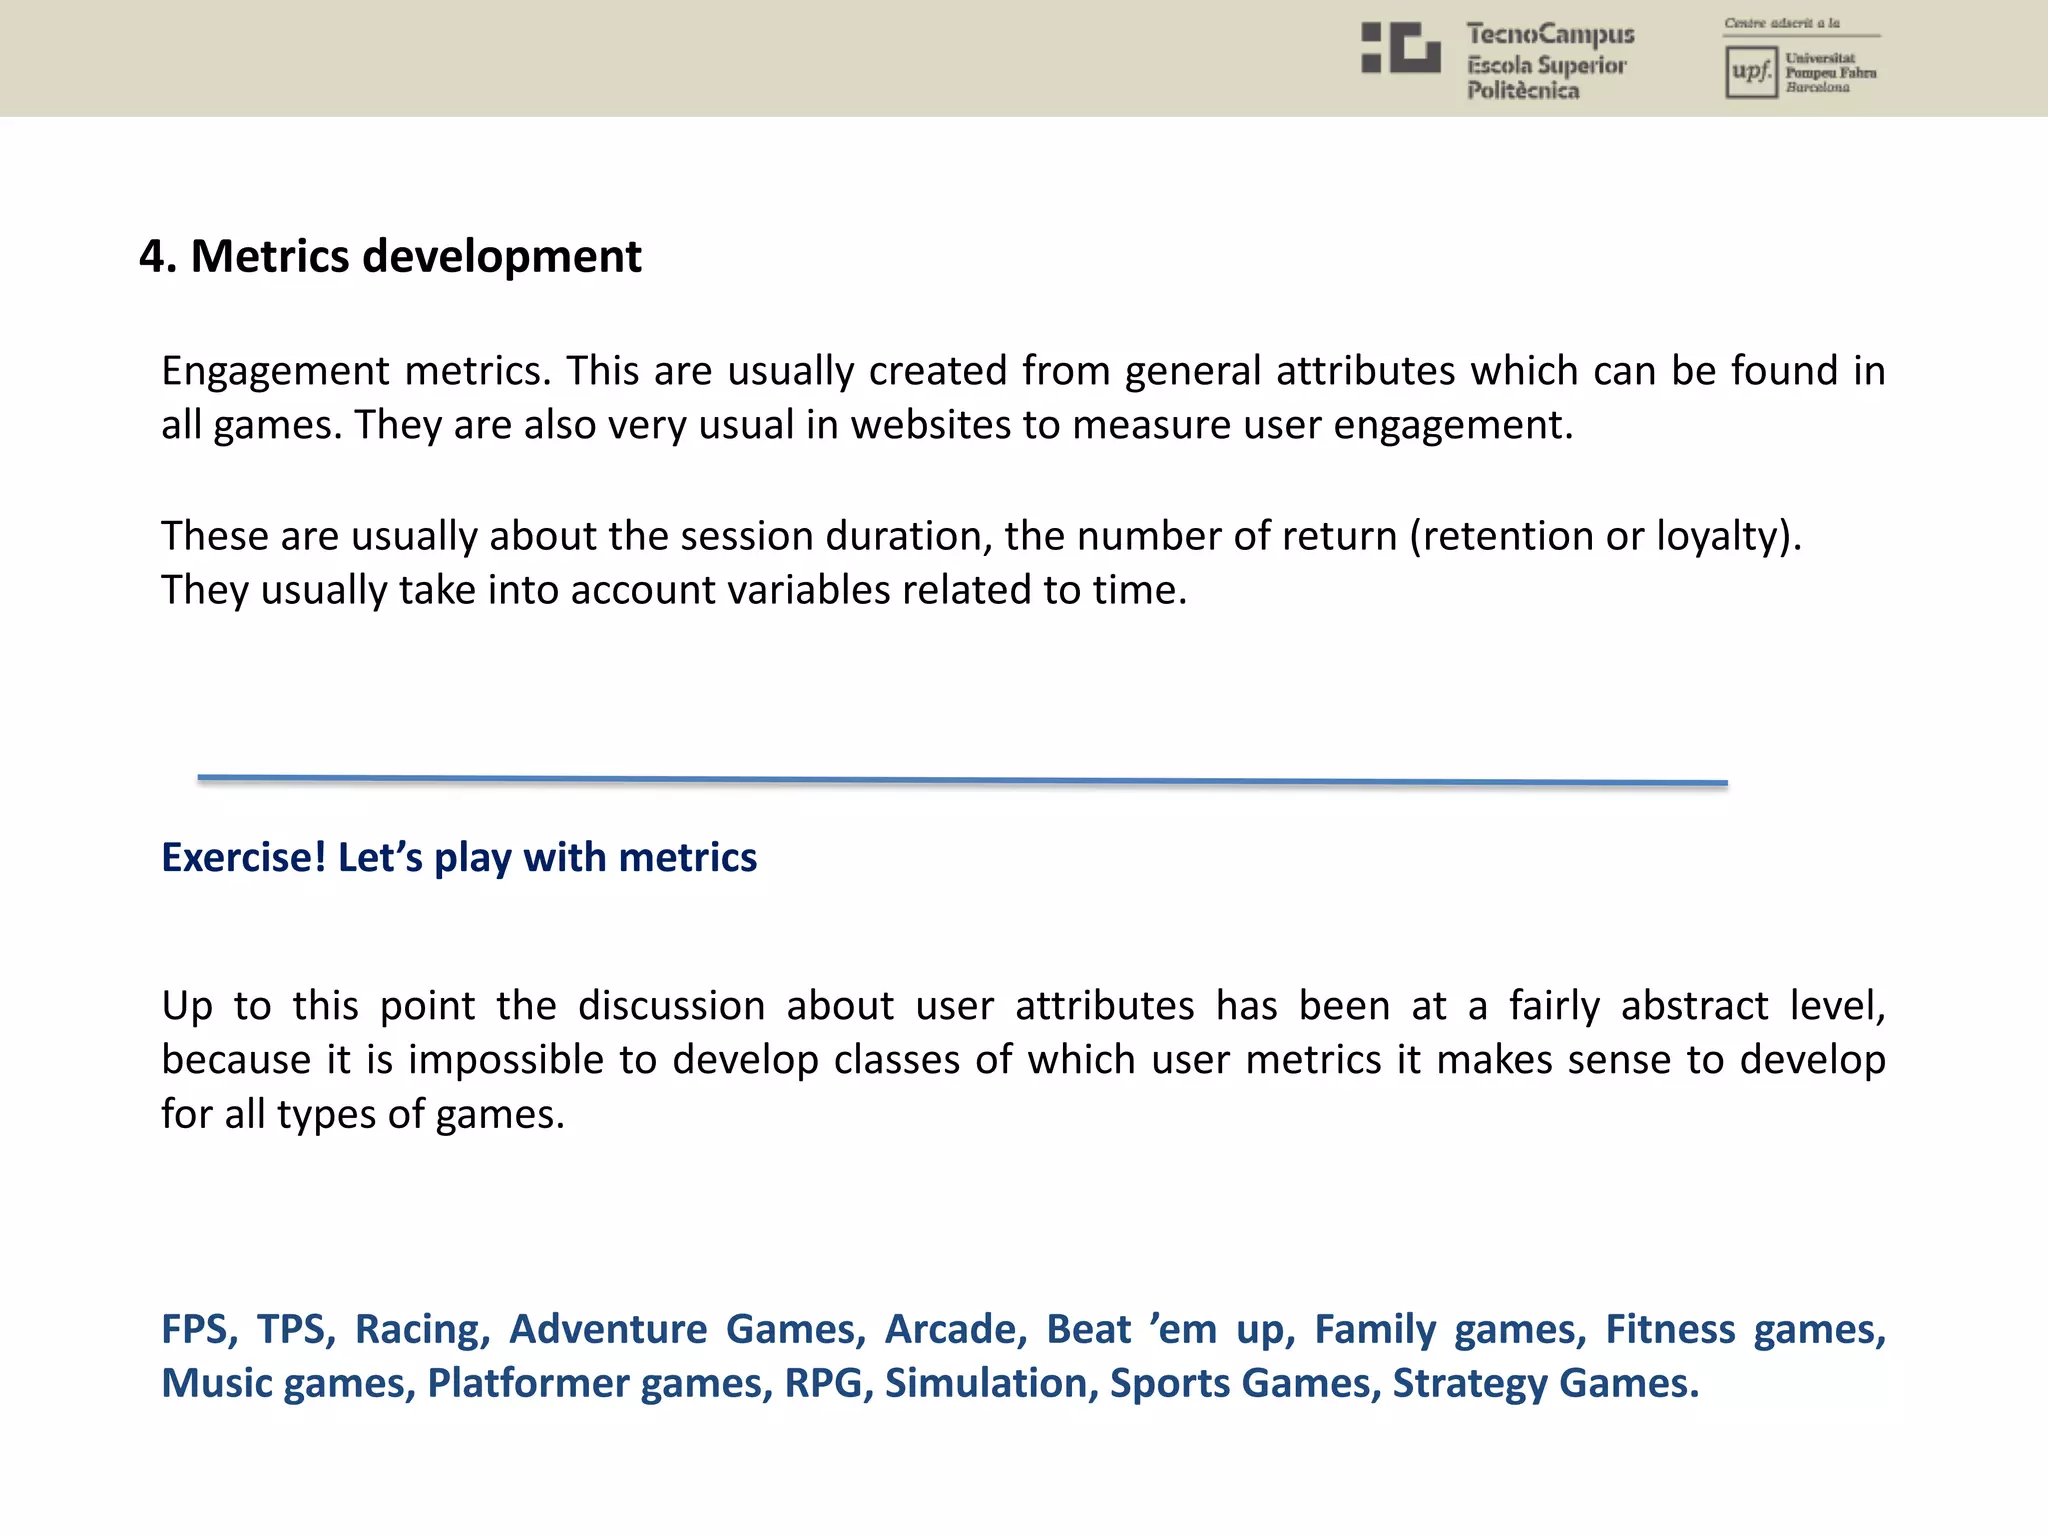
![• FPS: Useful gameplay metrics: Weapon use, trajectory, item/asset use, character/kit choice,
level/map choice, loss/win [quota], heatmaps, team scores, map lethality, map balance,
vehicle use metrics, strategic point captures/losses, jumps, crouches, special moves, object
activation. AI-enemy damage inflicted + trajectory. Possibly even projectile tracking.
• TPS: Useful gameplay metrics: as for FPS + camera angle, character orientation.
• Racing: Useful gameplay metrics: Track choice, vehicle choice, vehicle performance, win/loss
ratio per track and vehicle, completion times, completion ratio per track and player, upgrades
[if possible], color scheme [if possible], hits, avg. speed different types of tracks/track shapes.
• Adventure games: Useful gameplay metrics: story progression [e.g. node based], NPC
interaction, trajectory, puzzle completion, character progression, character item use, world
item use, AI-enemy performance, damage taken and received + source (player, mob).
• Advance: Useful gameplay metrics: trajectory, powerup usage, special ability usage, session
length, stages completed, points reached, unlocks, opponent type damage dealt/received,
player damage dealt/received [as applicable].
• Beat’em up: Useful gameplay metrics: Character selection, ability use, combo use, damage
dealt, damage received (per ability, character etc.), weapon usage, arena choice, win/loss
ratio as a feature of character, player skill profiles.
Chapter 12: Game Analytics – The Basics. Drachen et al. Game Analytics (Book).](https://image.slidesharecdn.com/uxu7-190402205419/75/User-Experience-7-Quantitative-Methods-Questionnaires-Biometrics-and-Data-Analysis-65-2048.jpg)
![• Family games: Useful gameplay metrics: varies substantially – subgame selection,
character/avatar selections, game mode used, in-game selections, asset use, number of
players, etc. form some of the possibilities
• Fitness games: Useful gameplay metrics: session length, calories burned, exercises chosen,
match between exercises shown and player actions, player accuracy in performing exercises,
total playtime over X days, player hardware/exercise equipment [usually registered], player
demographics [usually entered during profile creation], music tracks selected, backgrounds
selected, avatar selection, powerups/content unlocked [common feature], total duration of
play per user.
• Music games: Useful gameplay metrics: Points scored, song/track chosen, match with
rythm/auditory mechanics, difficulty setting, track vs. difficulty, track vs. errors, track vs.
choices.
• Platformer games: Useful gameplay metrics: jumping, progression speed, items collected,
powerups/abilities used, AI-enemy performance, damage taken + sources of damage
• RPGs: Useful gameplay metrics: character progression, quest completions, quest time to
complete, asset use (resources), character ability/item use [including context of use], combat
statistics, AI-enemy performance, story progression [including choices], NPC interactions [e.g.
communication], ability/item performance, damage taken + sources of damage, cutscene
viewed/skipped, items collected [including spatial info].](https://image.slidesharecdn.com/uxu7-190402205419/75/User-Experience-7-Quantitative-Methods-Questionnaires-Biometrics-and-Data-Analysis-66-2048.jpg)
![• Sports games: Useful gameplay metrics: match types, win/loss ratios, team selection, color
schemes, country chosen, management decisions [if game includes management aspects],
in-match events [e.g. goal scored, fouls, tackles, length of hit], item use [e.g. club type],
heatmap [density of player time spent on sections of the field], team setup/strategy, player
[in-game] selection, player commands to team/team members.
• Strategy games: Useful gameplay metrics: all features related to player strategy and control.
Generally two types of things players can build: building and units. Selections and order of
selection are crucial metrics. Commands given to units, upgrades purchased, trajectory,
win/loss ratio, team/race/color selection, maps used, map settings, match/game settings
(usually strategy games have some settings that affect the core mechanics).
Race/aspect/team chosen, time spent on building tasks vs. unit tasks.
Chapter 12: Game Analytics – The Basics. Drachen et al. Game Analytics (Book).
How many metrics did you match?](https://image.slidesharecdn.com/uxu7-190402205419/75/User-Experience-7-Quantitative-Methods-Questionnaires-Biometrics-and-Data-Analysis-67-2048.jpg)
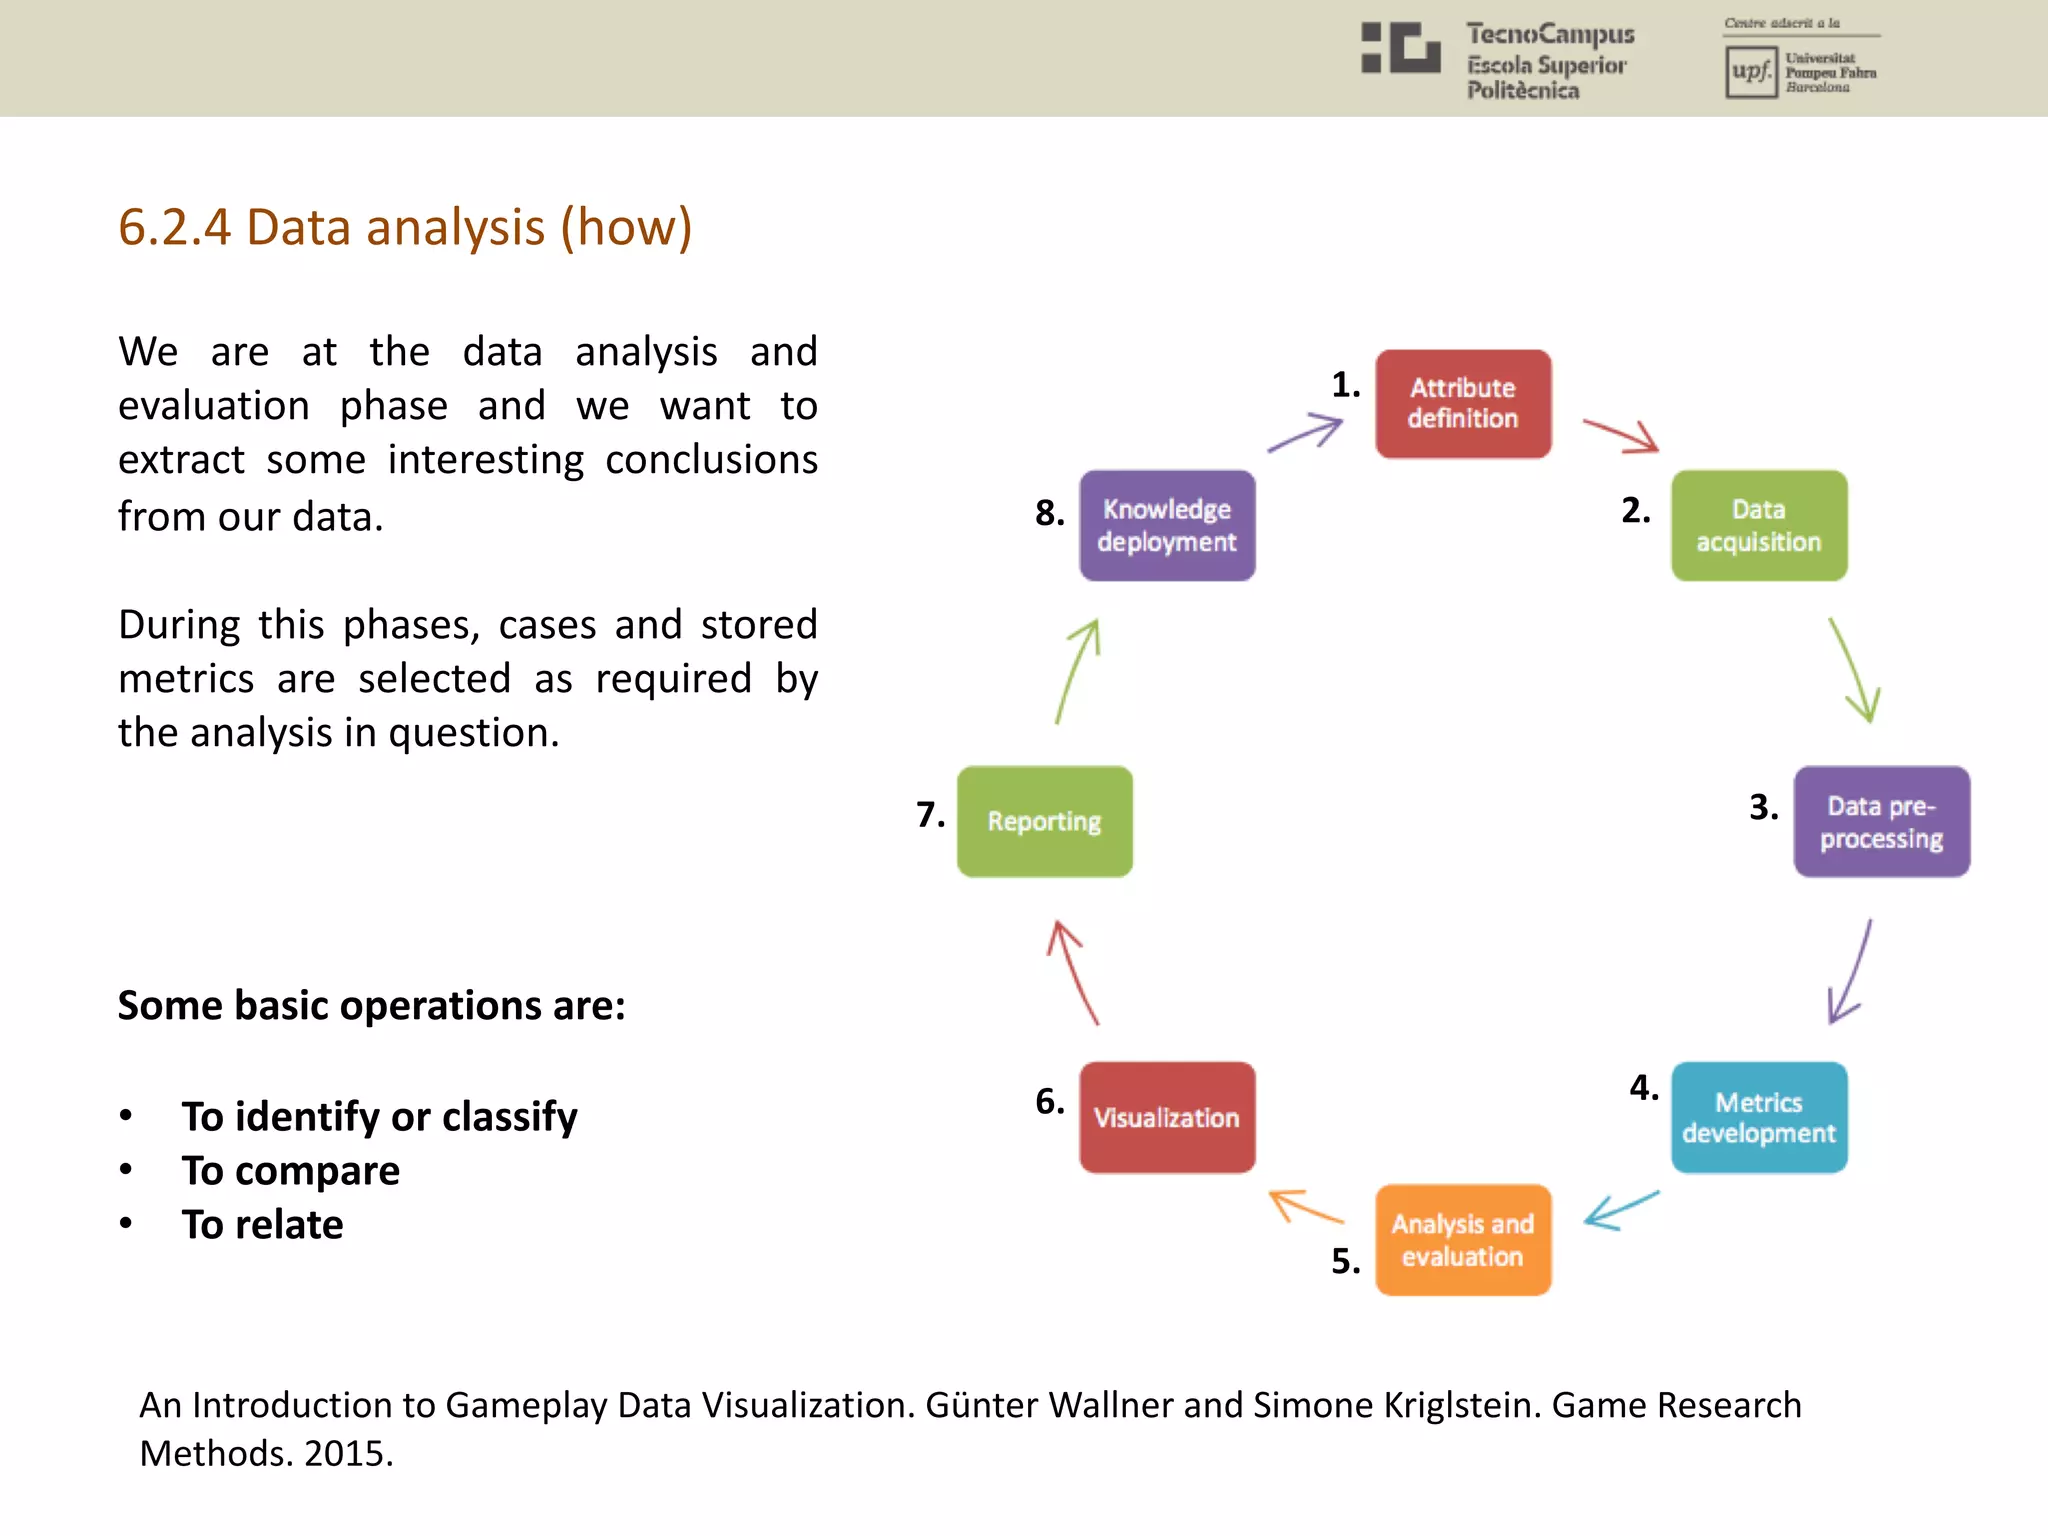
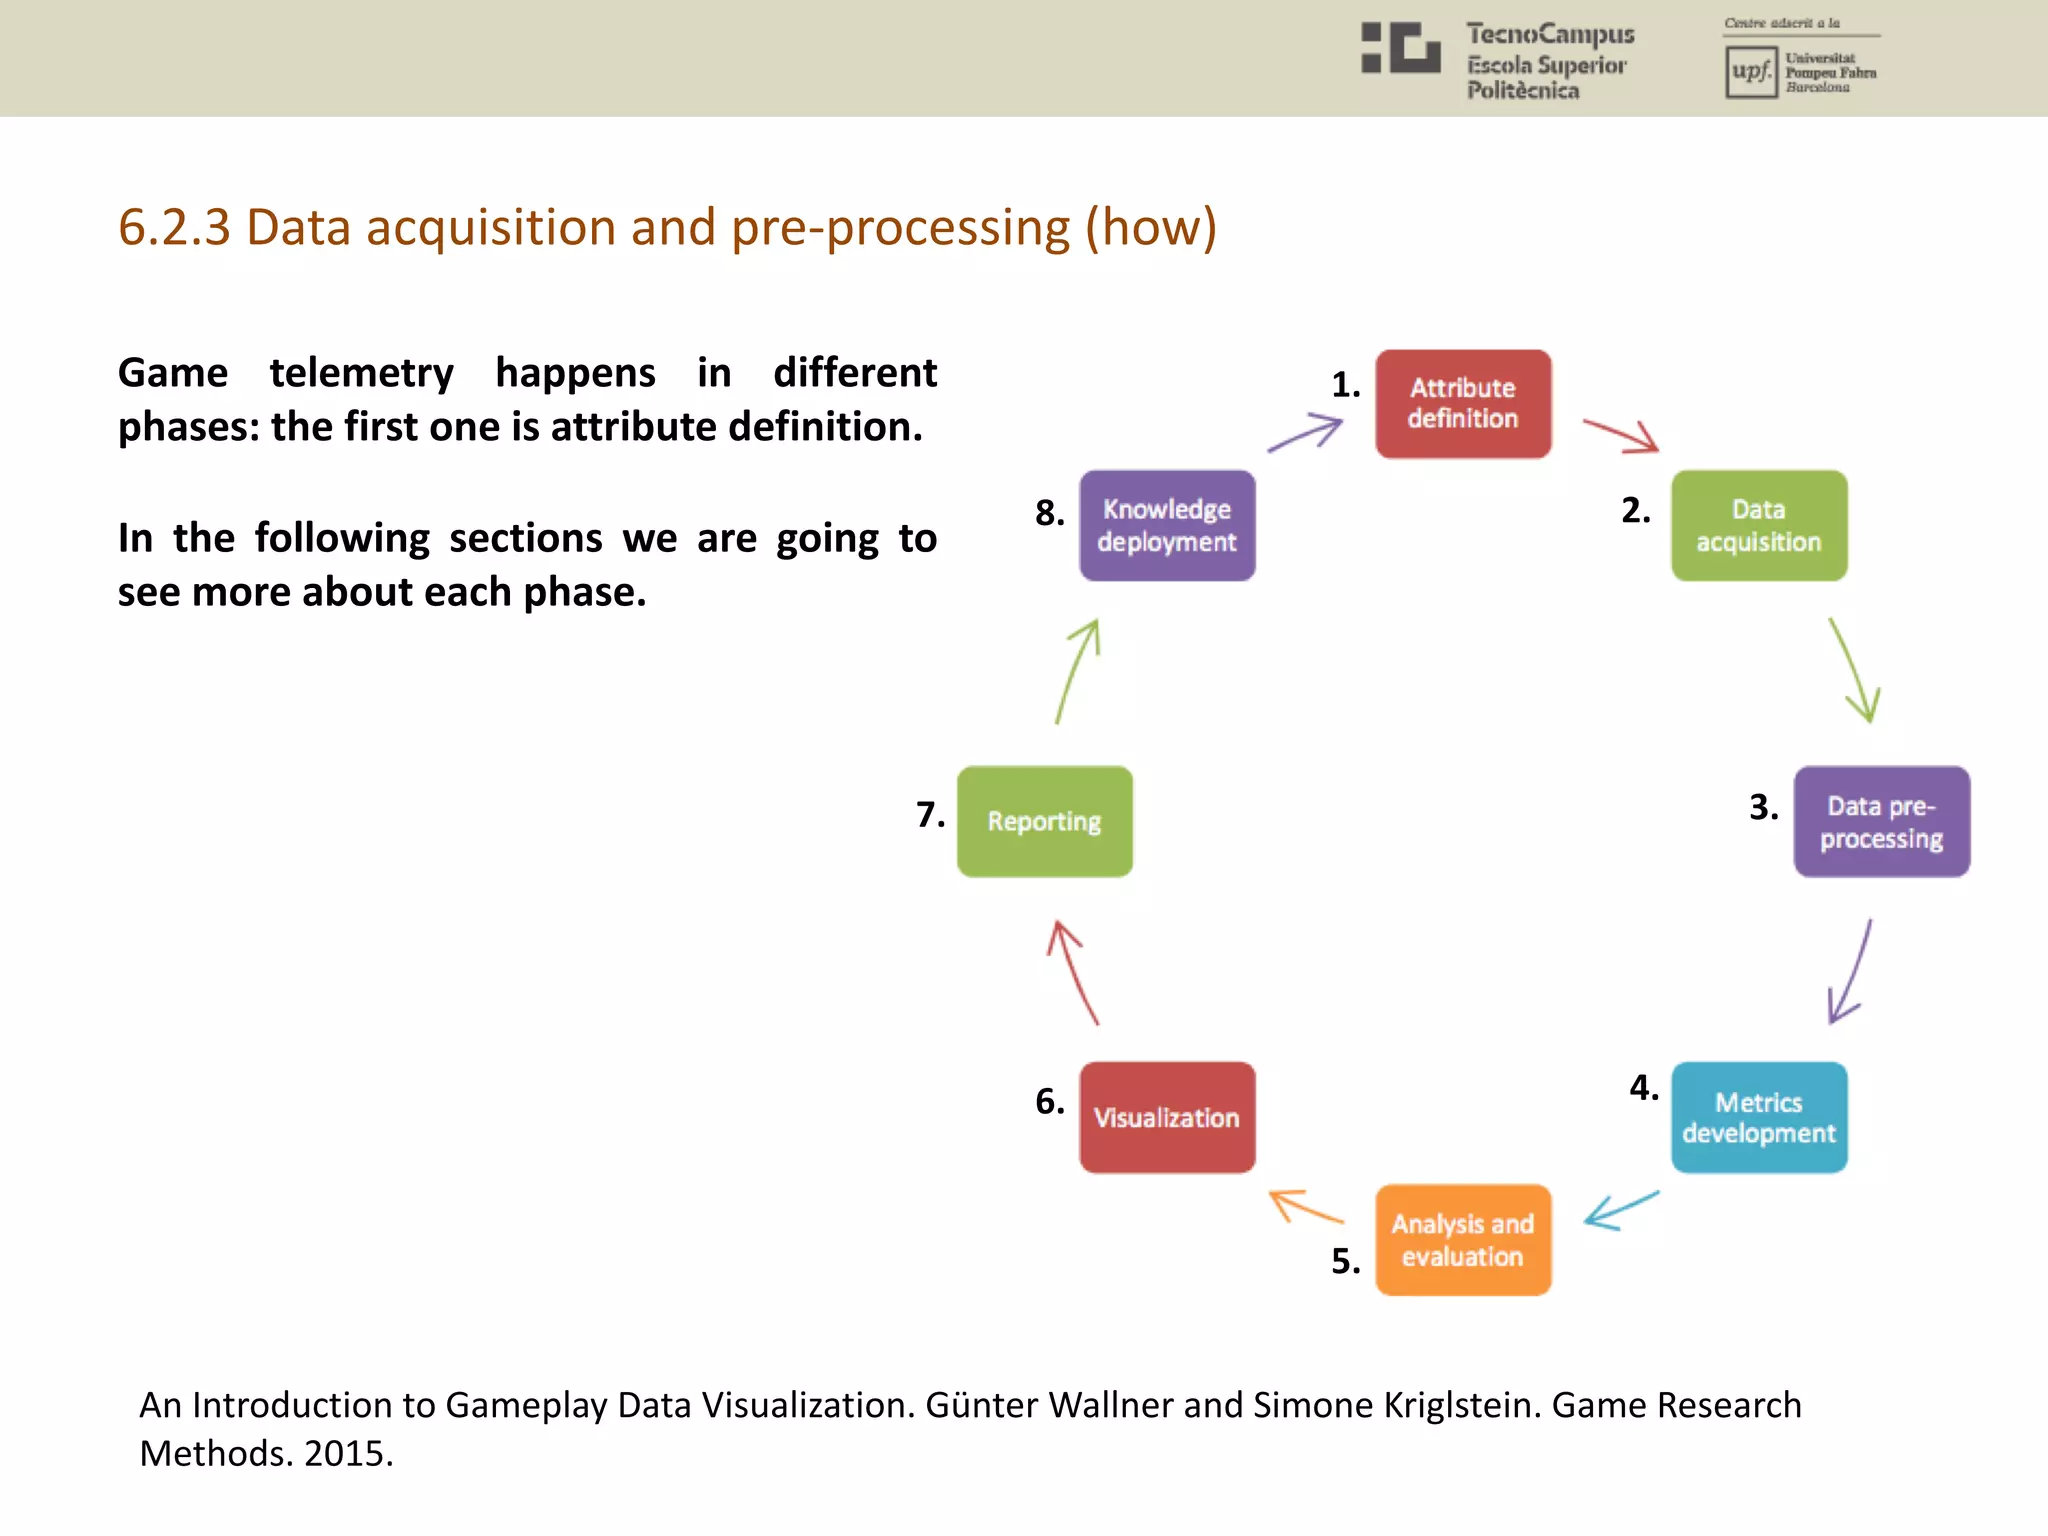
![Visualizations are representations of
data to perceive, use, and
communicate information.
In context of gameplay data analysis,
the interest to use and develop
visualization techniques increased in
the last years among industry
professionals and researchers. Visual
representations of gameplay can
support game developers and
designers to analyze recorded player
behavior to, for example, identify
interaction or design problems or to
understand the effects of design
decisions.
6.2.5 Reporting and data visualization
An Introduction to Gameplay Data Visualization. Günter Wallner and Simone Kriglstein. Game Research
Methods. 2015.
[http://www.gamasutra.com/view/feature/170332/?print=1]
1.
2.
3.
4.
5.
6.
7.
8.](https://image.slidesharecdn.com/uxu7-190402205419/75/User-Experience-7-Quantitative-Methods-Questionnaires-Biometrics-and-Data-Analysis-73-2048.jpg)
![An Introduction to Gameplay Data Visualization. Günter Wallner and Simone Kriglstein. Game Research
Methods. 2015.
[http://www.gamasutra.com/view/feature/170332/?print=1]
The power of visualization: on the left is where people are standing when they make kills with a
weapon and on the right is deaths by this weapon in Halo Reach. With just a basic knowledge of
FPS games, you can still probably work exactly what kind of weapon this is and where the
elevated and the open spaces are in the level.
They are less precise than statistical analysis
but sometimes more helpful. Easier to
understand and find interesting insights.](https://image.slidesharecdn.com/uxu7-190402205419/75/User-Experience-7-Quantitative-Methods-Questionnaires-Biometrics-and-Data-Analysis-74-2048.jpg)
![Heatmaps are used to visualize aggregated data from huge data sets but can also be used to
provide players with individualized visual feedback for the purpose of post-gameplay analysis.
Heatmap of death locations on the Team Fortress 2 map Goldrush.
[http://www.gamasutra.com/view/news/125213/Opinion_Balance_and_Flow_Maps.php]
Advantage: they can show spatial patterns more easily.
Disadvantage: only one variable can be shown at a time and a third dimension is lost.](https://image.slidesharecdn.com/uxu7-190402205419/75/User-Experience-7-Quantitative-Methods-Questionnaires-Biometrics-and-Data-Analysis-76-2048.jpg)
![[http://www.gamasutra.com/view/news/125213/Opinion_Balance_and_Flow_Maps.php]
It is possible to create several versions of the same map with subtracted metrics
(player kills – player deaths) to obtain an idea of balance.
A balance heat map can show us perfect spots
from where people kill and are not killed.](https://image.slidesharecdn.com/uxu7-190402205419/75/User-Experience-7-Quantitative-Methods-Questionnaires-Biometrics-and-Data-Analysis-77-2048.jpg)
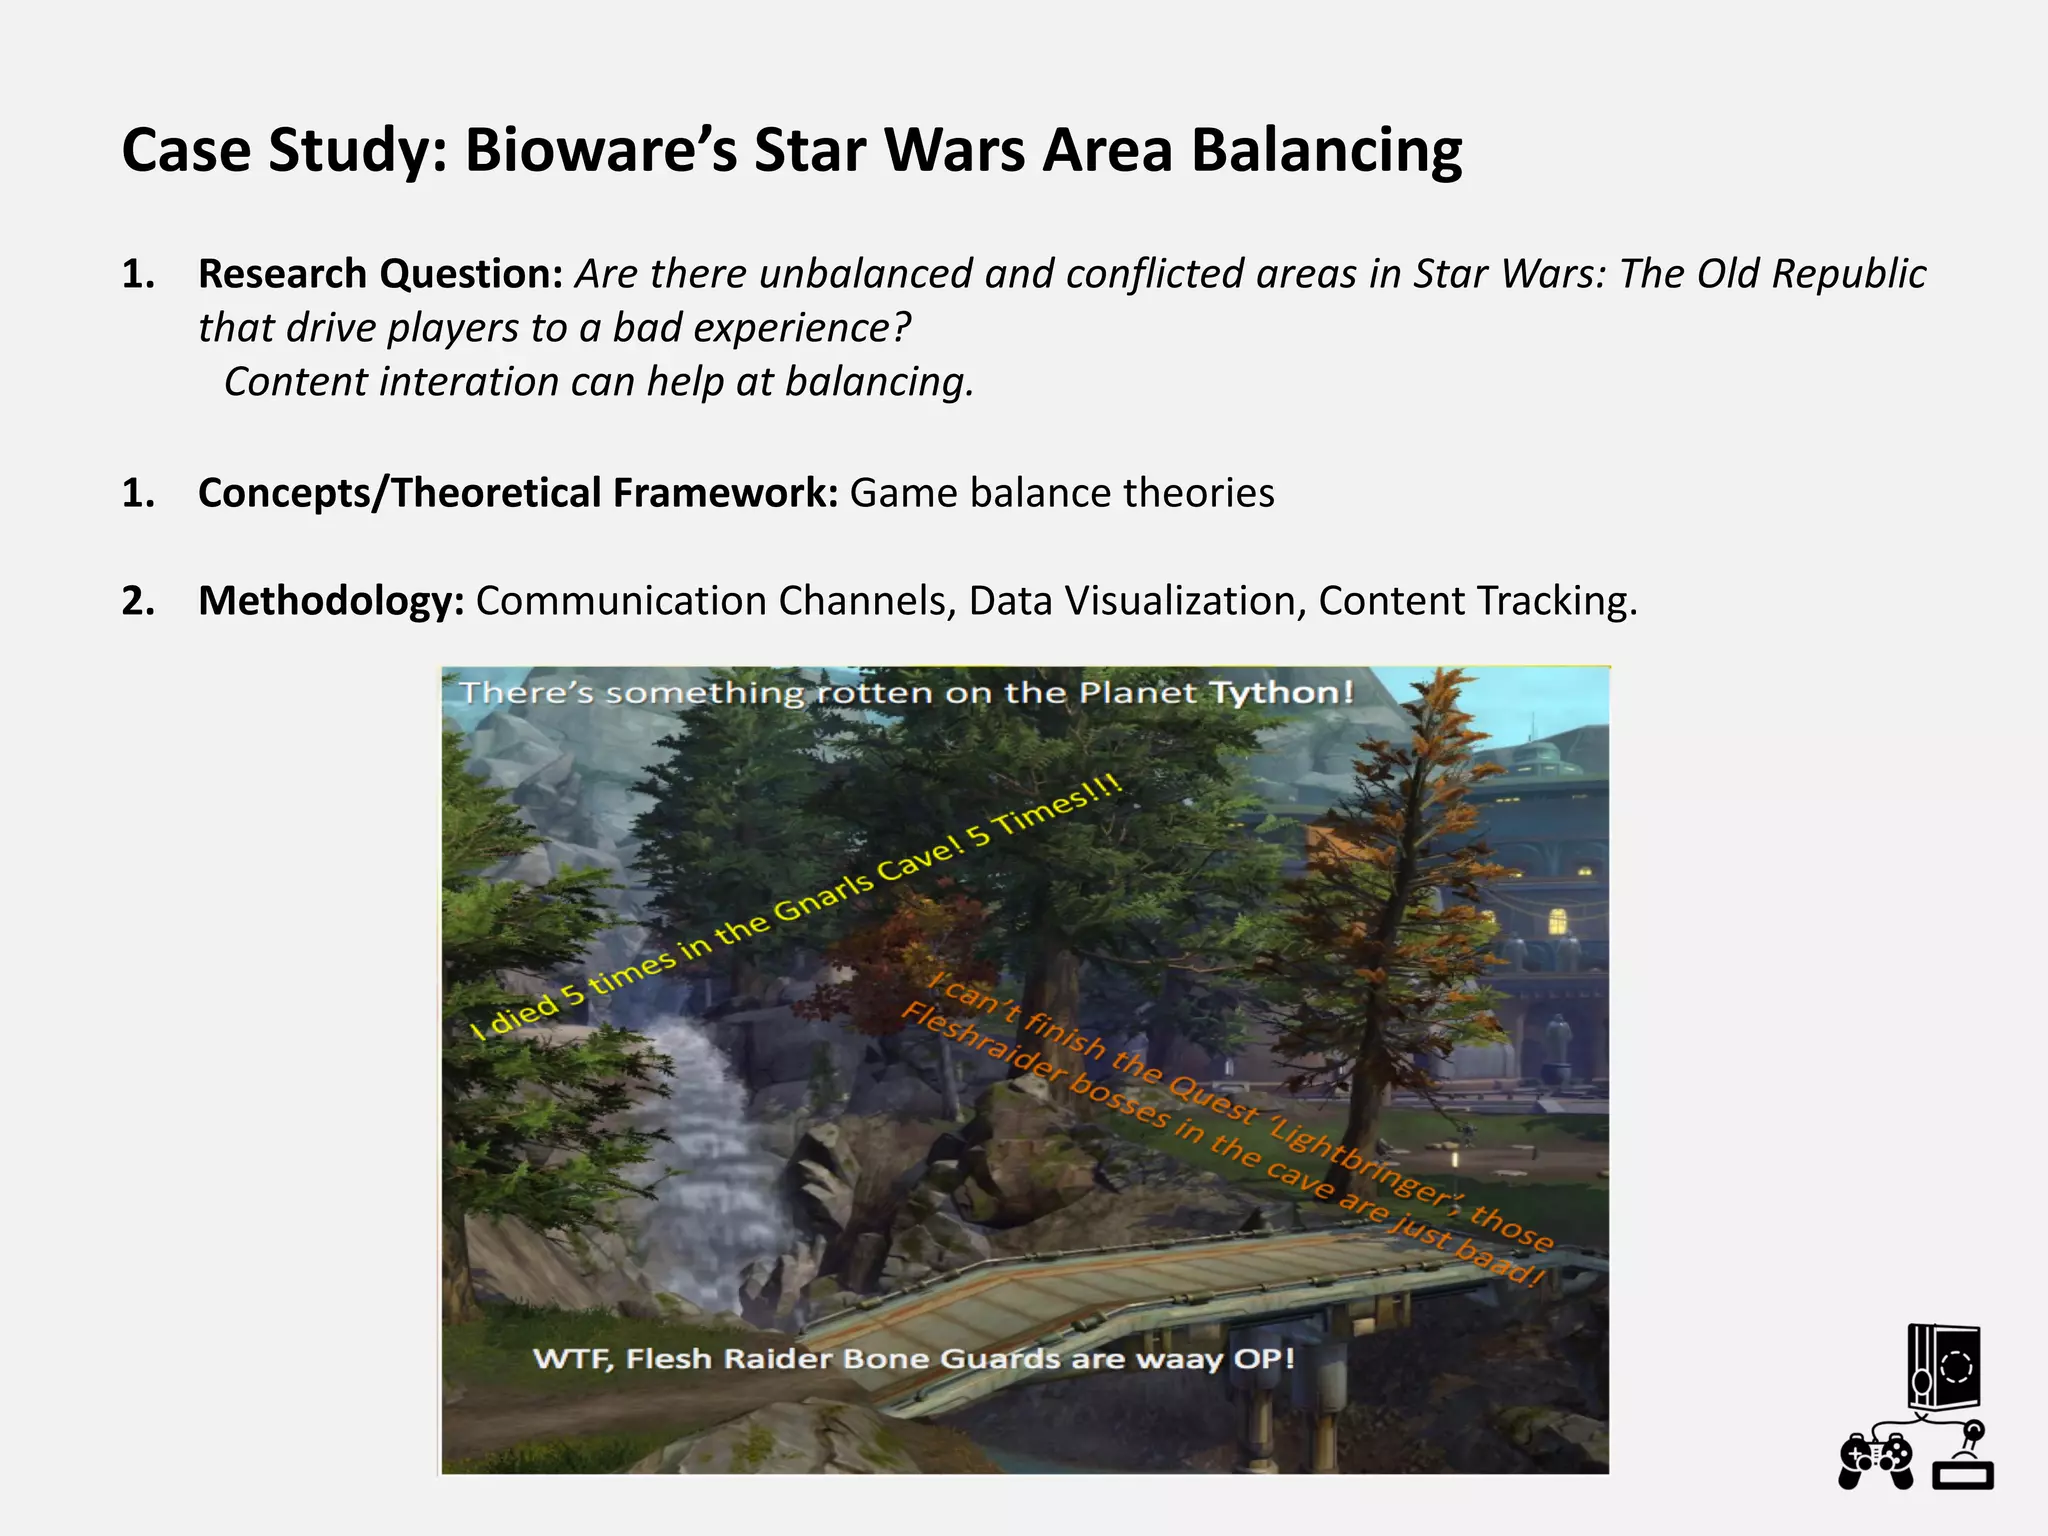
![The interesting point is that BIOWARE not only has good metrics but every item in the game
(asset) tracked. So they can cross even more data.
Georg Zoeller MMO Content Iteration
[http://twvideo01.ubm-us.net/o1/vault/gdconline11/Georg_Zoeller_Rapid_MMO_Content_Iteration.pdf]
[http://gdc.gulbsoft.org/2011-gdc-online-talk]](https://image.slidesharecdn.com/uxu7-190402205419/75/User-Experience-7-Quantitative-Methods-Questionnaires-Biometrics-and-Data-Analysis-81-2048.jpg)
![“Almost all actionable content feedback is more useful when you look at from a spatial or
temporal perspective. In order to create an efficient iteration process, we need to look at all
three elements together.” Zoeller, BIOWARE
With excellent tools
Georg Zoeller MMO Content Iteration
[http://twvideo01.ubm-us.net/o1/vault/gdconline11/Georg_Zoeller_Rapid_MMO_Content_Iteration.pdf]
[http://gdc.gulbsoft.org/2011-gdc-online-talk]](https://image.slidesharecdn.com/uxu7-190402205419/75/User-Experience-7-Quantitative-Methods-Questionnaires-Biometrics-and-Data-Analysis-82-2048.jpg)
![We want to make it possible for people in the trenches to analyze and suggest course of action to their
leads. We also want them to be able to spot mistakes on their own – something the tool can help with by
highlighting common mistakes (2 strong enemies on a single encounter, etc.)
Georg Zoeller MMO Content Iteration
[http://twvideo01.ubm-us.net/o1/vault/gdconline11/Georg_Zoeller_Rapid_MMO_Content_Iteration.pdf]
[http://gdc.gulbsoft.org/2011-gdc-online-talk]](https://image.slidesharecdn.com/uxu7-190402205419/75/User-Experience-7-Quantitative-Methods-Questionnaires-Biometrics-and-Data-Analysis-83-2048.jpg)

![[http://www.gamasutra.com/view/feature/5827/starcraft_ii_building_on_the_beta.php?print=1]
Analyzing behavioral data without a feel on
playtesting can be misleading.
If we look at the stats and we say,
"This doesn't actually back anything
we're experiencing online," I'm very
suspicious of that number.
We look at another source and say,
"You know what? What they're saying
online matches my play experience,
and it matches the stats. This seems
real. Let's talk about what some
possible fixes can be."
Data-driven assumptions wrong: Starcraft II carriers
Design director Dustin Browder warns that caution is required when analysing the data.
• “With unit stats, I can tell you that, for example, in a Protoss versus Terran game, 12 percent
of the time the Protoss build carriers. And when they build carriers, they win 70 percent of the
time. You could say, "That must mean carriers are overpowered!”. Not, it just means that you
get towards the end of the game. If they have extra resources to waste, they’re going to win
anyway.”](https://image.slidesharecdn.com/uxu7-190402205419/75/User-Experience-7-Quantitative-Methods-Questionnaires-Biometrics-and-Data-Analysis-86-2048.jpg)

![References and Bibliography
• All the references provided in the Powerpoint are valuable.
Books
• Game Analytics, Maximizing the Value of Player Data. El-Nasr et al. 2013.
• Chapter 12: Game Analytics – The Basics. Anders Drachen, Magy Seif El-Nasr, Alessandro Canossa. Game
Analytics (Book).
• Game Usability: Advancing the player experience. Isbister, Katherine, and Noah Schaffer. CRC Press. 2015.
• Game Research methods: An overview. Lankoski, P., & Björk, S. 2015.
• Games User Research: A Case Study Approach. Miguel Angel Garcia-Ruiz. AK Peters/CRC Press. 2016.
• Others
• Methods for Game User Research - Studying Player Behavior to Enhance Game Design. Heather Desurvire
and Magy Seif El-Nasr. 2013. (PAPER)
• Articles available in the site Gamasutra [gamasutra.com]
• Blog gameanalytics
– [https://andersdrachen.com/2013/10/31/10-great-reads-on-gamef-analytics/]
– [https://andersdrachen.com/category/game-user-research]
• CASE STUDY: "Game Analytics" book. Chapter 16: Better Game Experience Through Game Metrics: A Rally
Videogame Case Study. Pietro Guardini and Paolo Maninetti. (PAPER)
• CASE STUDY: Game Metrics for Evaluating Social In-game Behavior and Interaction in Multiplayer Games.
Katharina Emmerich. (PAPER)
• The Game Life-Cycle and Game Analytics: What Metrics Matter When? | Mark GAZECKI
[https://www.youtube.com/watch?v=C5lx4L0iJQI]
All images used in these slides belong to the cited sources.](https://image.slidesharecdn.com/uxu7-190402205419/75/User-Experience-7-Quantitative-Methods-Questionnaires-Biometrics-and-Data-Analysis-91-2048.jpg)
![• Nacke, L. E. (2013). An introduction to physiological player metrics for evaluating games. In Game
Analytics (pp. 585-619). Springer, London.
• “Beyond Thunderdome: Debating the effectiveness of different user-research techniques”
[https://vimeo.com/26733185]
• [http://www.gamasutra.com/blogs/TrevorMcCalmont/20130208/186075/5_Common_Pitfalls_for_Mobil
e_Game_Analytics.php]
• Game Usability: Advancing the player experience. Isbister, Katherine, and Noah Schaffer. CRC Press. 2015.
• Game Research methods: An overview. Lankoski, P., & Björk, S. 2015.
• Games User Research: A Case Study Approach. Miguel Angel Garcia-Ruiz. AK Peters/CRC Press. 2016.
• Playful Design. John Ferrara. Rosenfeld Media, 2012.
• The Art of Game Design: A Book Of Lenses. Jesse Schell. Carnegie Mellon University. 2008.
• King, R., Churchill, E. F., & Tan, C. (2017). Designing with Data: Improving the User Experience with A/B
Testing. " O'Reilly Media, Inc.".
All images used in these slides belong to the cited sources.](https://image.slidesharecdn.com/uxu7-190402205419/75/User-Experience-7-Quantitative-Methods-Questionnaires-Biometrics-and-Data-Analysis-92-2048.jpg)

The document discusses quantitative methods in user experience research for video games, focusing on understanding player experience through questionnaires, biometrics, and data analysis. It highlights the importance of selecting appropriate research methods, particularly how questionnaires can effectively gather self-reported data on user emotions and behaviors, while also addressing their limitations. The document outlines best practices for designing effective questionnaires to avoid biases and ensure valid and reliable data collection.